





1 Introduction
Research into inertial confinement fusion (ICF) is thriving after the demonstration of ignition and exceeding of gain unity at the National Ignition Facility (NIF)[ Reference Abu-Shawareb, Acree and Adams 1 , Reference Abu-Shawareb, Acree and Adams 2 ]. The field is now transitioning towards tangible inertial fusion energy (IFE) schemes for commercial energy production. A range of approaches are under consideration with an emphasis on the direct-drive scheme and related hotspot ignition variants such as shock ignition[ Reference Betti, Zhou, Anderson, Perkins, Theobald and Solodov 3 ], shock-augmented ignition[ Reference Scott, Barlow, Trickey, Ruocco, Glize, Antonelli, Khan and Woolsey 4 ] and fast ignition[ Reference Tabak, Hammer, Glinsky, Kruer, Wilks, Woodworth, Campbell, Perry and Mason 5 ]. Common to these schemes is the interaction of a laser with a plasma, albeit across a range of plasma density scale lengths, temperatures, target compositions and laser intensities. Fundamental laser–plasma interaction studies for ICF retain a crucial role in the scope of furthering the understanding of these fusion schemes and approaches to optimize performance and efficiency.
Despite significant progress in achievable gain there remains the issue of the growth of laser–plasma instabilities (LPIs) that restricts the overall efficiency of fusion implosions. Namely, the main LPIs of particular concern to IFE are stimulated Raman scattering (SRS), stimulated Brillouin scattering (SBS) and two-plasmon decay (TPD). These instabilities involve the coupling of an incoming laser wave into two daughter waves in the plasma. The SRS and SBS mechanisms couple energy into a scattered light wave, raising the reflectivity of the laser light and reducing absorption into the plasma. In addition, SRS, along with TPD, can couple energy into electron plasma waves (EPWs), which are eventually damped to form a population of hot electrons. These hot electrons can pre-heat the cryogenic fusion fuel, raising the adiabat and rendering compression more difficult; alternatively, recent work has speculated that under particular conditions these hot electrons could enhance implosion performance[ Reference Barlow, Goffrey, Bennett, Scott, Glize, Theobald, Anderson, Solodov, Rosenberg, Hohenberger, Woolsey, Bradford, Khan and Arber 6 ]. One of the main challenges facing IFE is the control of these LPIs, with approaches such as the use of incoherent broadband laser pulses[ Reference Lei, Kang, Zhao, Liu, An, Xiong, Wang, Xie, Tu, Xu, Zhou, Fang, Wang, Xia, Feng, Zhao, Ji, Cui, Zhou, Liu, Zheng, Wang, Gao, Huang and Fu 7 – Reference Tikhonchuk, Blackman, Loiseau and Ruyer 10 ] currently being explored.
Fundamental studies into parametric instabilities can be carried out at medium-scale high-power laser facilities with planar targets. This has the benefit of decoupling the laser–plasma interaction from the implosion and permits a dedicated measurement of LPI growth. These experimental investigations are central to deepening our understanding of LPI since the interplay and competition between the instabilities and related physics, such as filamentation and kinetic effects, produce a highly complex system to model holistically. Whilst it is challenging to simultaneously create all of the laser–plasma conditions present in a full-scale ICF implosion, the scaling and dependence of LPI on, for example, density scale length or laser intensity, can still be explored to support understanding of ICF conditions, or to support theoretical modelling efforts. Studies into parametric instability growth in planar geometry have been successfully performed at the Vulcan TAW[ Reference Cristoforetti, Hüller, Koester, Antonelli, Atzeni, Baffigi, Batani, Baird, Booth, Galimberti, Glize, Héron, Khan, Loiseau, Mancelli, Notley, Oliveira, Renner, Smid, Schiavi, Tran, Woolsey and Gizzi 11 , Reference Glize, Zhao, Yuan, Zhang, Zhang, Dong, Wang, Fisher, Khan, Woolsey, Hume, Cristoforetti, Koester, Gizzi and Zähter 12 ], PALS[ Reference Koester, Antonelli, Atzeni, Badziak, Baffigi, Batani, Cecchetti, Chodukowski, Consoli, Cristoforetti, Angelis, Folpini, Gizzi, Kalinowska, Krousky, Kucharik, Labate, Levato, Liska, Malka, Maheut, Marocchino, Nicolai, O’Dell, Parys, Pisarczyk, Raczka, Renner, Rhee, Ribeyre, Richetta, Rosinski, Ryc, Skala, Schiavi, Schurtz, Smid, Spindloe, Ullschmied, Wolowski and Zaras 13 – Reference Cristoforetti, Hume, Agarwal, Batani, Cervenak, Devi, Dudzak, Ettel, Gajdos, Glize, Jelinek, Juha, Koester, Krupka, Krus, Larreur, Malka, Mancelli, Masson-Laborde, Morace, Nicolai, Renner, Singappuli, Singh, Tatarakis, Yuan, Wang, Woolsey, Zhang, Zhao and Gizzi 17 ], LULI[ Reference Depierreux, Michel, Tassin, Loiseau, Stenz and Labaune 18 – Reference Goyon, Baccou, Courvoisier, Borisenko, Orekhov, Rosmej and Labaune 21 ], PHELIX[ Reference Kanstein, Wasser, Zähter, Atzeni, Benincasa, Cristoforetti, Erdogdu, Fischer, Gizzi, Glize, Grimm, Hornung, Hume, Köster, Kuschel, Meffert, Neufeld, Neumayer, Nguyen, Theobald, Winter, Woolsey, Zarrouk, Zhao, Bagnoud and Roth 9 ] and OMEGA[ Reference Seka, Baldis, Fuchs, Regan, Meyerhofer, Stoeckl, Yaakobi, Craxton and Short 22 – Reference Rosenberg, Solodov, Myatt, Hironaka, Sivajeyan, Follett, Filkins, Maximov, Ren, Cao, Michel, Wei, Palastro, Scott, Glize and Regan 24 ] facilities.
Next generation high-power laser facilities are able to combine high-energy pulses with a high repetition rate. At the ELI-Beamlines facility, the L4n laser can deliver nanosecond pulses with energies of hundreds of joules at a maximum shot rate of once every 3 minutes[ Reference Condamine, Jourdain, Kramer, Trojek, Gintrand, Fauvel, Pandikian, Bartonicek, Friedman, Havlik, Hernandez, Hubacek, Lastovicka, Orna, Renner, Rubovic, Rus, Singh, Vyhlidka and Weber 25 ]; at other comparable facilities the previous shot rates were of the order of every 45–90 minutes. This affords an excellent opportunity for parameter scans of laser–plasma conditions that non-linearly influence the gain of LPI events. One example is the work of Wasser et al. [ Reference Wasser, Zähter, Rivers, Atzeni, Condamine, Cristoforetti, Fauvel, Fischer, Gizzi, Hoffmann, Koester, Lastovicka, Myatt, Singh, Sokol, Theobald, Weber, Ditmire, Forner and Roth 26 ], where SRS and SBS reflectivities were measured to grow exponentially as a function of laser intensity. In addition, with a higher repetition rate it becomes possible to obtain statistics and repeats of measurements to reduce uncertainty.
In this paper we present experimental measurements of backscattered SRS and SBS growth taken at ELI-Beamlines. The LPI behaviour from irradiated thick and thin foil targets is compared, with thin foils found to drive fundamentally different SRS and SBS growth compared to thick foils. Optical beam smoothing via application of a phase plate is also demonstrated, and the effect on self-focusing and filamentation is discussed.
2 Experimental method
The experiment was performed using the L4n laser at the P3 Plasma Physics platform[
Reference Jourdain, Chaulagain, Havlik, Kramer, Kumar, Korn and Weber
27
] at ELI-Beamlines (Prague, Czech Republic) as part of the L4n commissioning phase. The Nd:glass laser produced pulses of wavelength
${\lambda}_{1\omega }$
 = 1053 nm with energies of
${E}_{1\omega }=450-650\;\mathrm{J}$
 . A KDP crystal was used for frequency conversion to
${\lambda}_{2\omega }$
 = 526.5 nm with a
$24\%{-}30\%$
 conversion efficiency. Shorter wavelengths are of interest for ICF due to an increased LPI intensity threshold with reduced wavelength[
Reference Kruer
28
], as well as improved collisional absorption[
Reference Garban-Labaune, Fabre, Max, Fabbro, Amiranoff, Virmont, Weinfeld and Michard
29
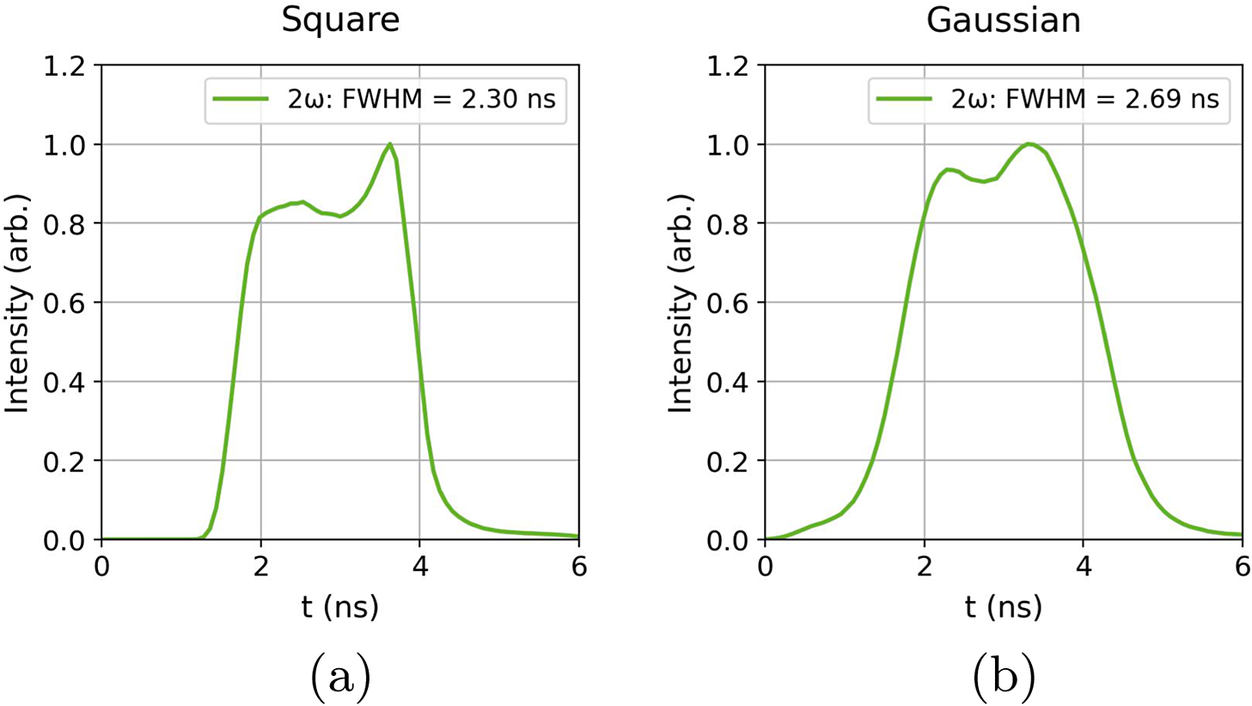
]. The power profile was approximately square with a full-width at half maximum (FWHM) duration of
${\tau}_{\mathrm{FWHM}}=2.3\;\mathrm{ns}$
 , as shown in Figure 1 .
Temporal laser profiles in 2
$\omega$
 from calculations by the L4n laser team using 1
$\omega$
 profiles measured on-shot with a photodiode. For shots without a phase plate the square temporal profile (a) was implemented, and for shots with a phase plate the Gaussian temporal profile (b) was used. The FWHM for the Gaussian profile was found by applying a super-Gaussian fit of order 4.

The laser was focused onto the target using a
$2.6\;\mathrm{m}$
 focal length lens of
$f/10.2$
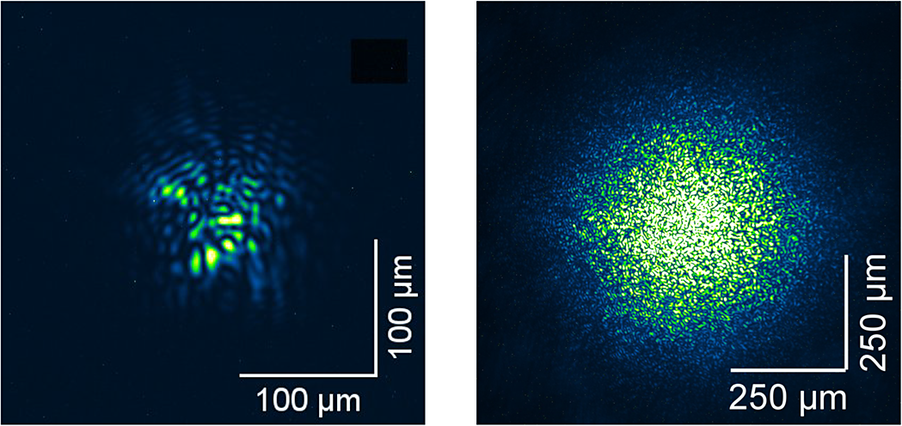
 . The unsmoothed focal spot presented several aberrations and hotspot features, as shown in Figure 2, when the localized laser intensity exceeds the average intensity across the spot. The focal spot size is estimated from averaged lineouts across the spot, giving an FWHM of the spot as approximately 70 μm. This gives a maximum average intensity across the focal spot
${I}_{\mathrm{avg}}\sim 2.6\times {10}^{15}\;\mathrm{W}/{\mathrm{cm}}^2$
 . A distributed phase plate (DPP) was used on some shots to smooth the beam and remove the aberrations, at the expense of a reduced average laser intensity. This creates a focal spot profile of greater relevance to direct-drive ICF applications, where phase plates are commonly utilized to ensure a more uniform compression. For these shots a more Gaussian-shaped temporal profile was used with a marginally increased
${\tau}_{\mathrm{FWHM}}=2.7\;\mathrm{ns}$
 . No shots were taken with the phase plate and the square laser power profile simultaneously as part of the parameter scan set so we cannot compare with precisely the same laser profile from this dataset. The FWHM focal spot size with the DPP applied was
$D\approx 320\;\mu \mathrm{m}$
 , yielding a maximum average intensity of
$5.5\times {10}^{13}\;\mathrm{W}/{\mathrm{cm}}^2$
 . Targets employed were either thick 200 μm polyvinyl chloride (PVC;
${\mathrm{C}}_2{\mathrm{H}}_3\mathrm{Cl}$
 ) targets or thin 0.9, 2 or 3 μm polyethylene terephthalate (PET;
${\mathrm{C}}_{10}{\mathrm{H}}_8{\mathrm{O}}_4$
 ) targets. All targets had an approximately 50 nm Al flash coating on the front surface to prevent laser transmission at early times.
Laser focal spot image taken at low power without (left) and with (right) the distributed phase plate.

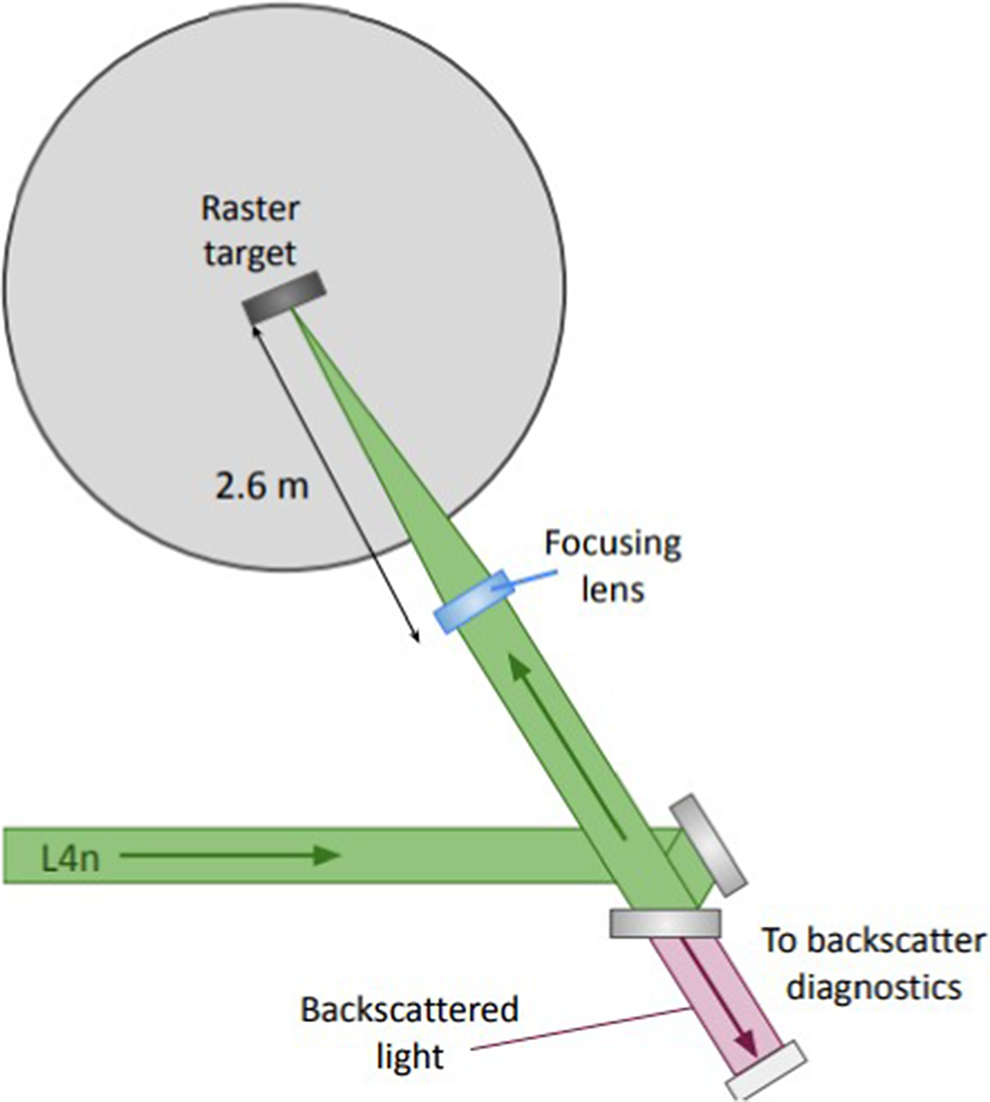
The growth of parametric instabilities was measured using a full-aperture backscatter (FABS) diagnostic installation in place on the L4n line, with details given in Ref. [Reference Wasser, Zähter, Sokol, Rivers, Atzeni, Condamine, Cristoforetti, Fauvel, Fischer, Gizzi, Hannasch, Hesse, Laštovička, Lutz, Rubovič, Schaumann, Schott, Singh, Theobald, Weber, Ditmire, Forner and Roth30]. Figure 3 shows the positioning of the FABS diagnostic station on the P3 platform. Light backscattered down the laser cone was collected from a leaky turning mirror in the collimated beam transport line. A Schmidt–Cassegrain telescope setup directed the backscattered light towards a series of diagnostic lines. Fractions of the backscattered light were directed using beamsplitters towards separate calorimeters with appropriate bandpass filters to isolate and measure SRS and SBS backscattered energies. Backscattered light was also spectrally separated and directed towards two streak cameras to obtain spectral and temporal information on SRS and SBS backscattered light. A 150 lines/mm grating was used in the SRS spectrometer to achieve spectrally resolved data over the range
$\lambda =600-900\;\mathrm{nm}$
 , with wavelength calibration performed via measurements of known spectral lines from a HgAr lamp. A 1800 lines/mm grating was used for the SBS spectrometer to obtain higher spectral resolution over a reduced spectral range
$\lambda =523.5-528.5\;\mathrm{nm}$
 . Information on timing relative to the laser pulse was not available for this campaign, and is under consideration for future experiments.
Simplified scheme of the target chamber setup. Further details on the backscatter diagnostic station on L4n can be found in Ref. [Reference Wasser, Zähter, Sokol, Rivers, Atzeni, Condamine, Cristoforetti, Fauvel, Fischer, Gizzi, Hannasch, Hesse, Laštovička, Lutz, Rubovič, Schaumann, Schott, Singh, Theobald, Weber, Ditmire, Forner and Roth30].

3 Hydrodynamic simulations
Since in situ measurements of the plasma conditions were not taken during the experiment, hydrodynamic simulations were performed to estimate the plasma properties for the different targets. The two-dimensional (2D) hydrodynamic code DUED[
Reference Atzeni, Schiavi, Califano, Cattani, Cornolti, Sarto, Liseykina, Macchi and Pegoraro
31
] was used. The laser was set to
$\lambda =526.5\;\mathrm{nm}$
 . The focal spot was set to a continuous Gaussian intensity distribution with an FWHM of
$80\;\mu \mathrm{m}$
 . A square temporal profile was implemented with an initial linear increase over 0.1 ns, a power plateau over 1.9 ns, then a linear decrease over 0.1 ns, and a total energy of 90 J. Simulations were performed for CH targets of four thicknesses as in the experiment: 0.9, 2, 3 and
$200\;\mu \mathrm{m}$
 . Interactions with the smoothed beam were modelled with a Gaussian focal spot of FWHM
$320\;\mu \mathrm{m}$
 and a Gaussian temporal power profile of FWHM
$2.7\;\mathrm{ns}$
 as used in the experiment. The total energy of the laser pulse was
$100\;\mathrm{J}$
 incident on a
$2\;\mu \mathrm{m}$
 Mylar or
$200\;\mu \mathrm{m}$
 PVC target.
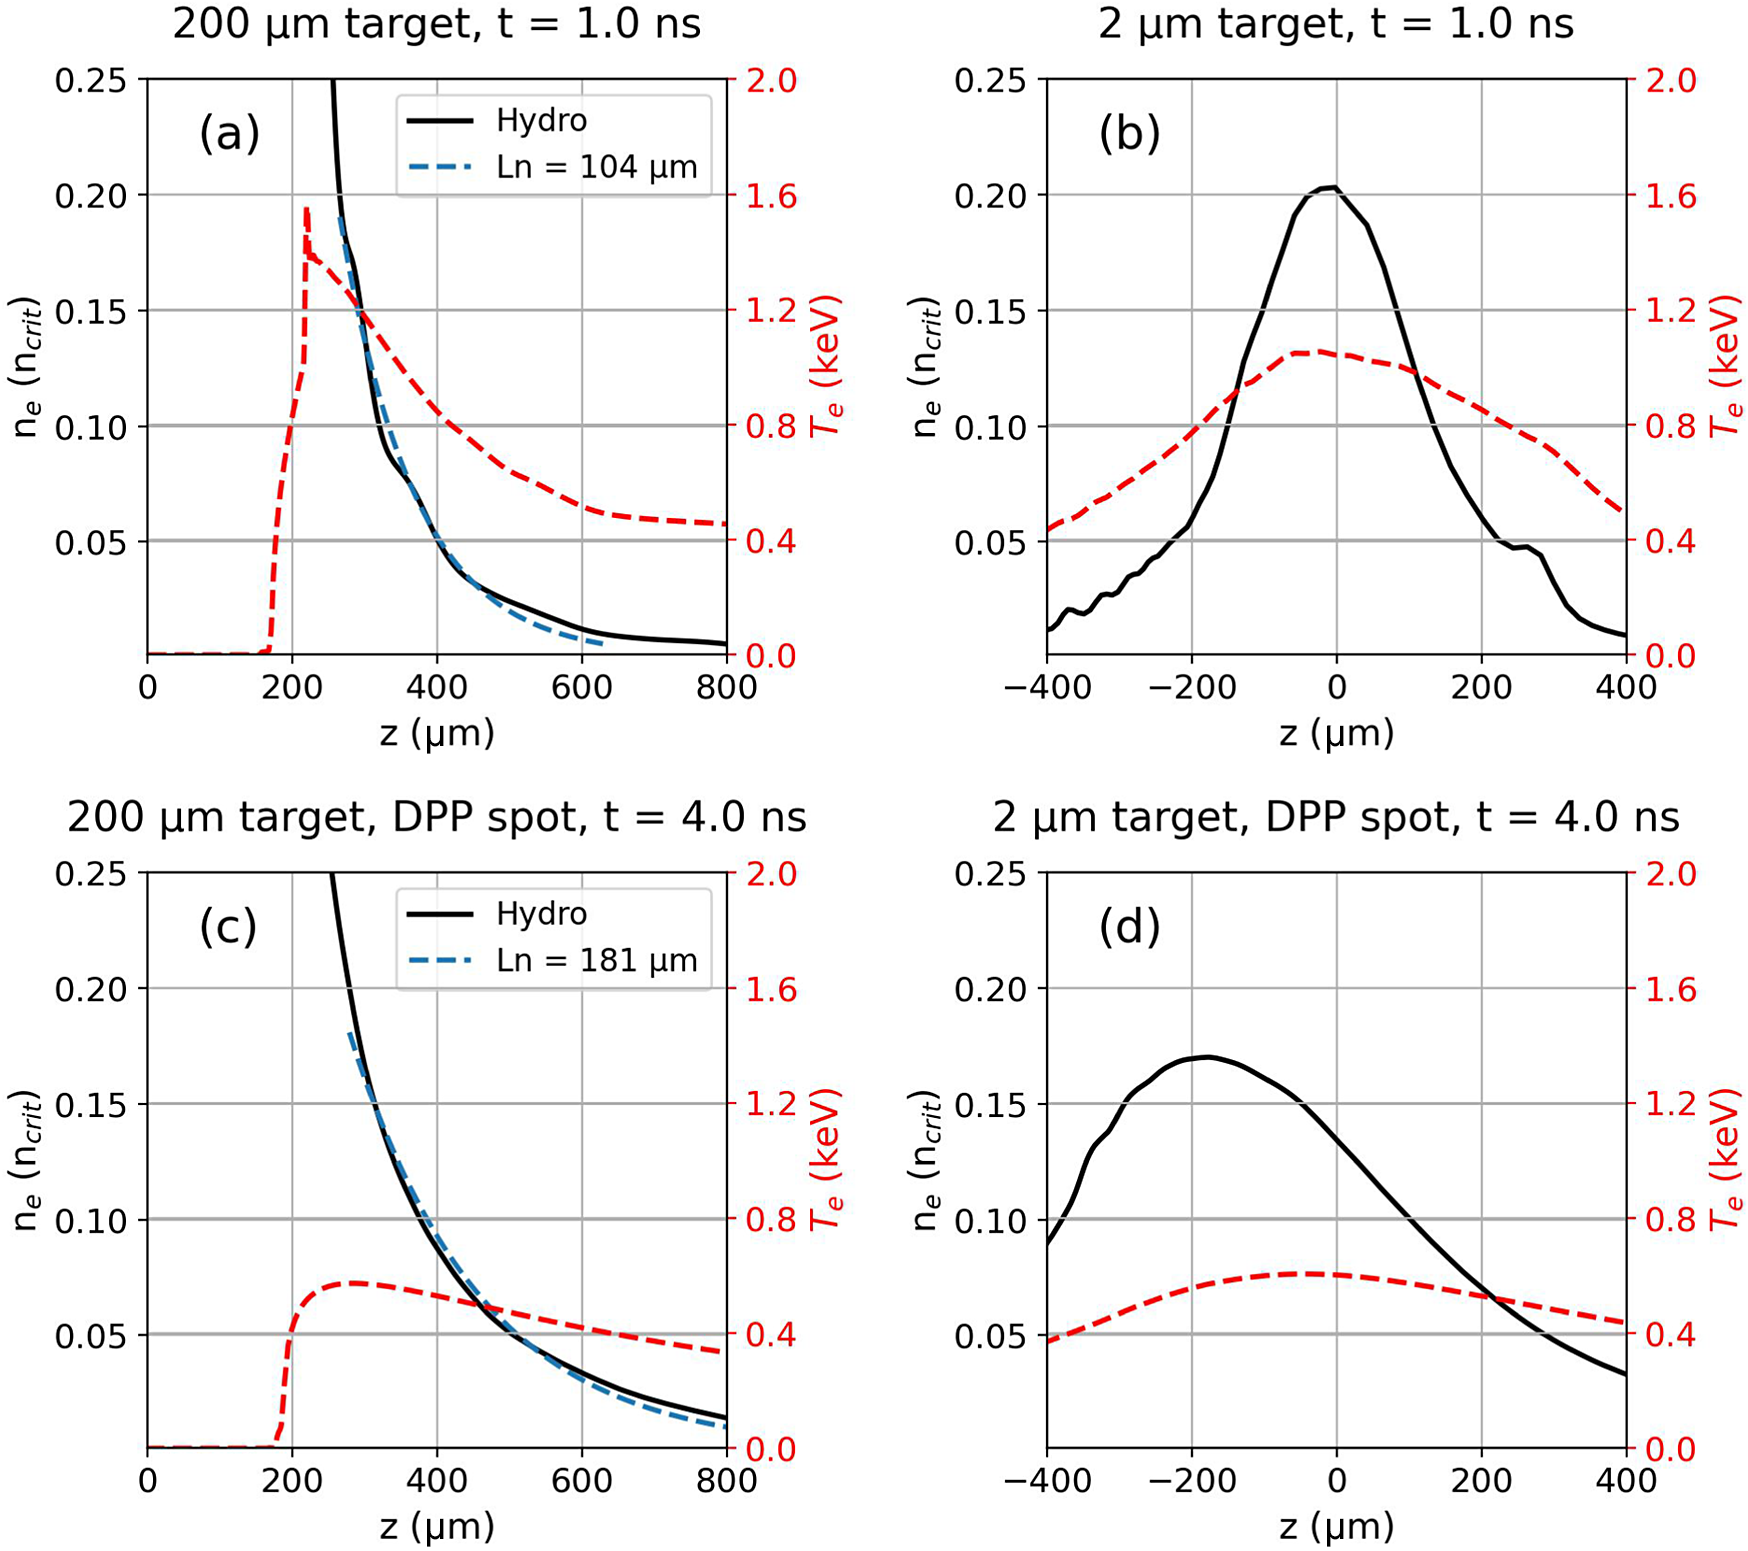
Figure 4(a) shows an example electron density and temperature profile extracted from the hydrodynamic simulation of the irradiated
$200\;\mu \mathrm{m}$
 target. An ablated plasma of
${T}_\mathrm{e}=0.4-1.2\;\mathrm{keV}$
 is produced on the front surface of the bulk solid target. The density scale length of the ablated plasma region is estimated by applying an exponential fit of the form
${n}_\mathrm{e}=A\;\exp \left(-z/{L}_n\right)$
 to the density region
$0.01\;n_\mathrm{crit}-0.20\;{n}_\mathrm{crit}$
 . This yields a scale length of
${L}_n\sim 104\;\mu \mathrm{m}$
 . Irradiation of a
$200\;\mu \mathrm{m}$
 target with the larger spot corresponding to the smoothed beam case is shown in Figure 4(c) at a comparable time within the laser power profile. Here, the density scale length is estimated to be longer at
${L}_n\sim 181\;\mu \mathrm{m}$
 , with a lower electron temperature
${T}_\mathrm{e}=0.3-0.5\;\mathrm{keV}$
 . In the case of the thinner targets, the hydrodynamic profiles exhibit a different evolution. Figure 4(b) shows the electron density and temperature profiles for the irradiated
$2\;\mu \mathrm{m}$
 target. The target is seen to explode during the interaction, with the peak of the density profile becoming under-critical during the laser pulse[
Reference Rousseaux, Amiranoff, Labaune and Matthieussent
32
,
Reference Gizzi, Giulietti, Giulietti, Afshar-Rad, Biancalana, Chessa, Danson, Schifano, Viana and Willi
33
]. The target is also predicted to become underdense for the case with the smoothed beam irradiation of thin foils, as shown in Figure 4(d).
Electron density and temperature profiles from hydrodynamic simulations. Profiles of the (a)
$200\;\mu \mathrm{m}$
 and (b)
$2\;\mu \mathrm{m}$
 targets are shown at
${t}_{\mathrm{sim}}=1\;\mathrm{ns}$
 . Profiles are also shown for simulations of (c)
$200\;\mu \mathrm{m}$
 and (d)
$2\;\mu \mathrm{m}$
 targets at
${t}_{\mathrm{sim}}=4\;\mathrm{ns}$
 during irradiation from the focal spot smoothed by the phase plate. These simulation times correspond to the centre of the respective laser power profile.

Figure 4 Long description
A four-panel line graph labeled a through d. Each panel shares a left vertical axis for electron density n sub e in units of n sub crit ranging from 0.0 to 0.25 and a right vertical axis in red for temperature T sub e in k e V ranging from 0.0 to 2.0.
Panel a shows a 200 mu m target at t equals 1.0 n s. The horizontal axis z in mu m ranges from 0 to 800. A solid black Hydro line drops sharply from above 0.25 at z equals 200 to near zero at z equals 800. A dashed blue line labeled L n equals 104 mu m follows this decay. A dashed red line for temperature peaks at 1.6 k e V near z equals 200 and decays to 0.4 k e V.
Panel b shows a 2 mu m target at t equals 1.0 n s. The horizontal axis z ranges from negative 400 to 400. The black density line forms a bell curve peaking at 0.20 at z equals 0. The red temperature line forms a broader, lower peak of 1.1 k e V at z equals 0.
Panel c shows a 200 mu m target with a D P P spot at t equals 4.0 n s. The density decay is more gradual than in panel a, with a dashed blue line labeled L n equals 181 mu m. The red temperature curve is much lower, peaking around 0.6 k e V.
Panel d shows a 2 mu m target with a D P P spot at t equals 4.0 n s. The density curve is broader and shifted, peaking at 0.17 near z equals negative 200. The red temperature curve is relatively flat, staying below 0.6 k e V across the range.
4 Results
4.1 SRS
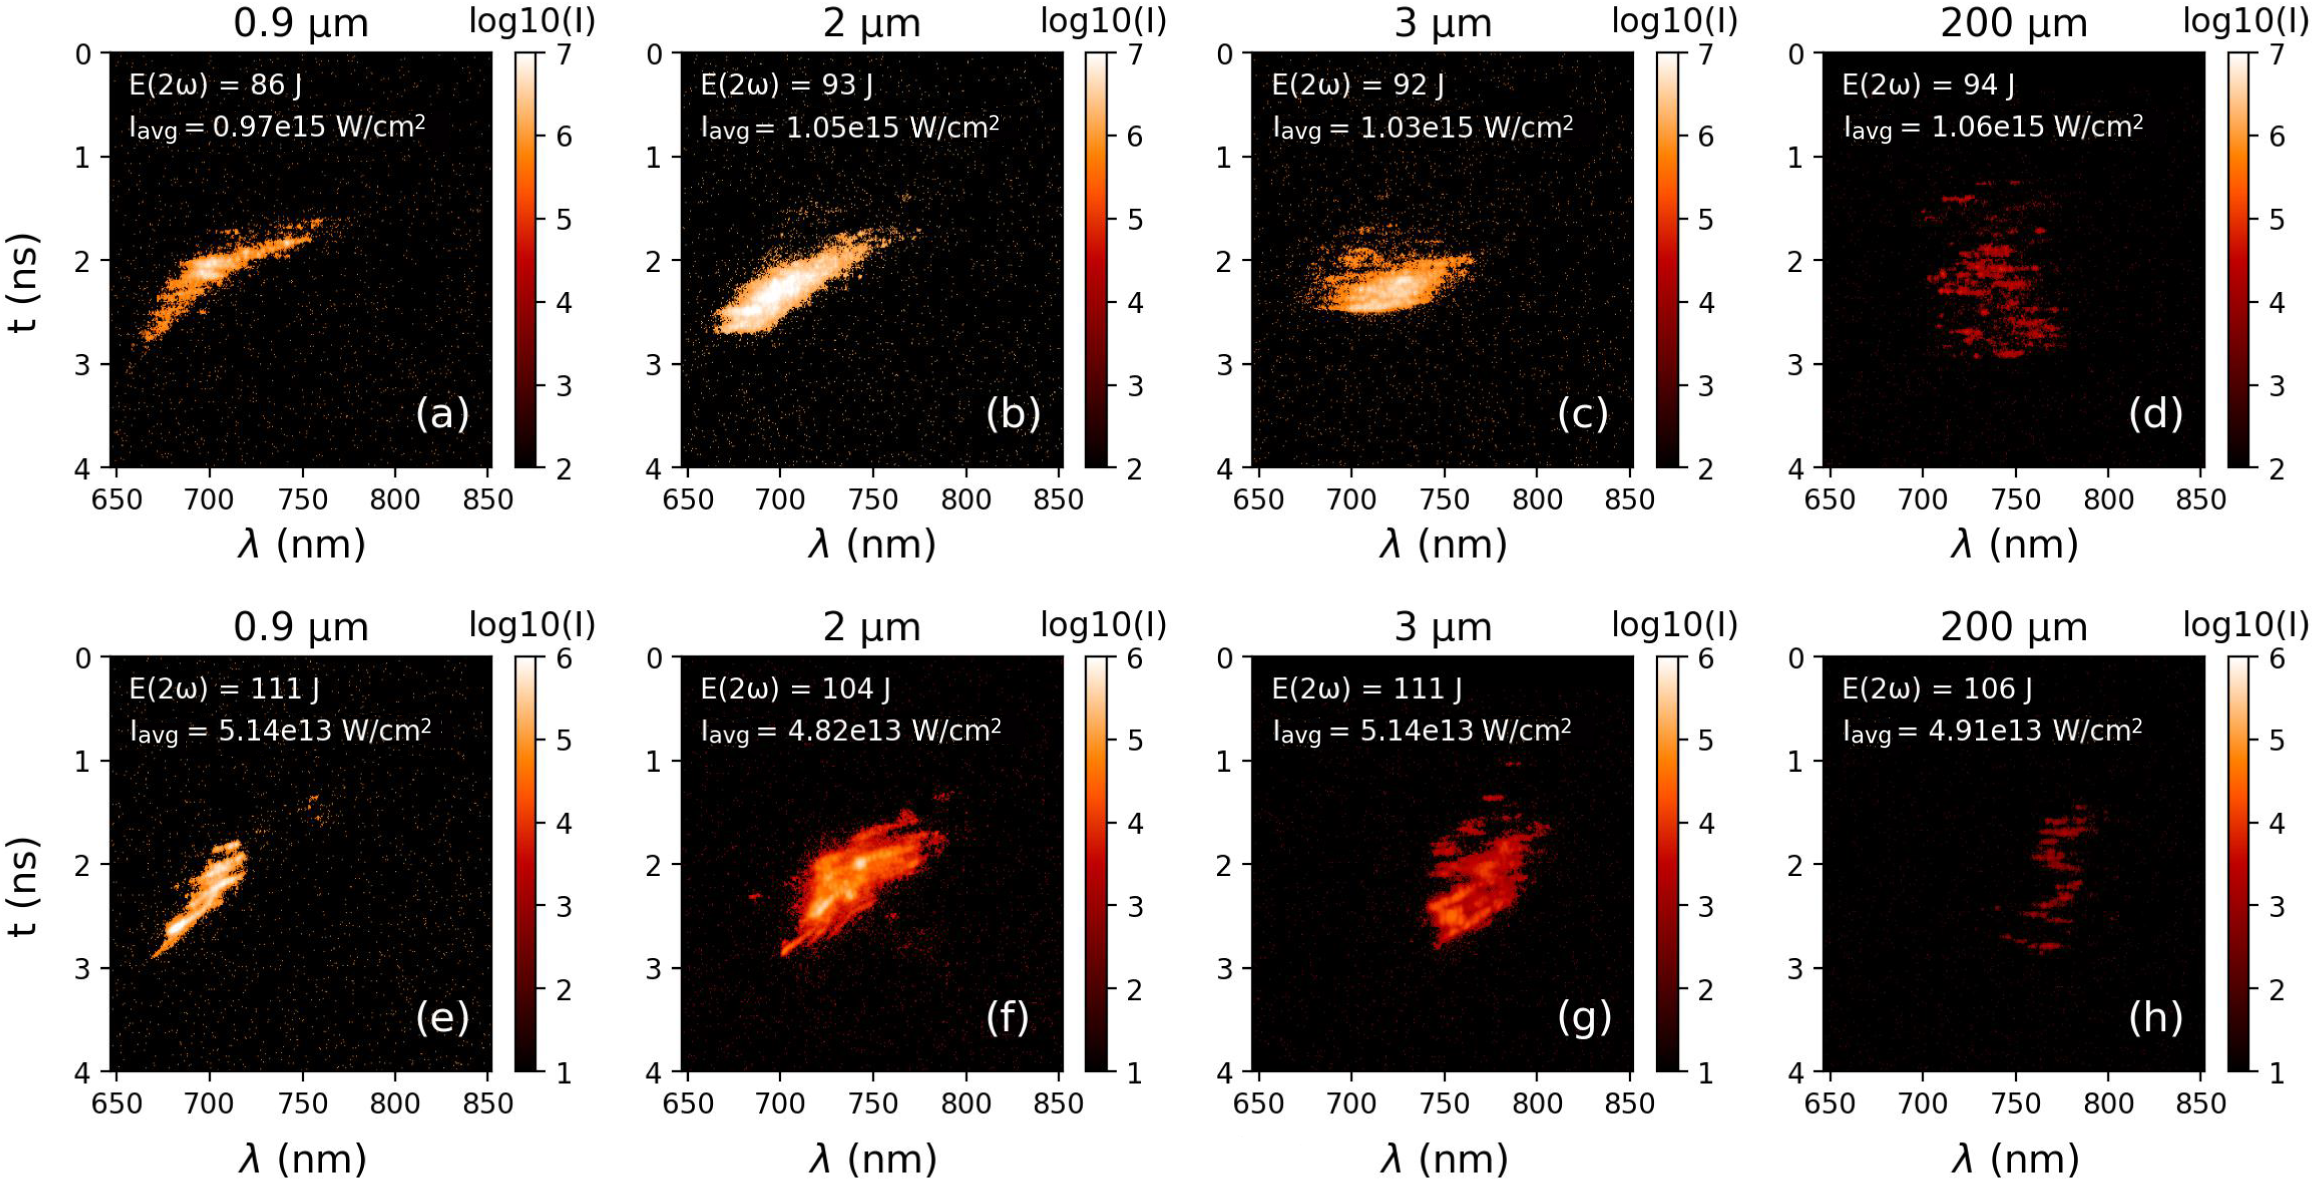
Temporally resolved streaked spectra of the SRS emission in the backscatter cone are shown in Figure 5 from targets of different initial thicknesses. Use of the wave-matching relations for the beat wave properties,
${\omega}_\mathrm{b}={\omega}_0-{\omega}_\mathrm{S}$
 and
${\overrightarrow{k}}_{\!\!\!\!\mathrm{b}}={\overrightarrow{k}}_{\!\!\!\!0}-{\overrightarrow{k}}_{\!\!\!\!\mathrm{S}}$
 , and the relation

where
${\omega}_\mathrm{pe}$
 is the electron plasma frequency and
${v}_\mathrm{e}=\sqrt{T_\mathrm{e}/{m}_\mathrm{e}}$
 is the electron thermal velocity, permits the inference of the electron density where SRS is driven via the measured spectra of scattered light. Irradiation of the 200 μm thick target produced backscattered SRS light in the region of 700–800 nm, as shown in Figure 5(d). Assuming an average electron temperature of
$1\;\mathrm{keV}$
 from the hydrodynamic simulations, it is calculated that SRS is driven at densities of
${n}_\mathrm{e}/{n}_\mathrm{crit}=0.05-0.11$
 , where
${n}_\mathrm{crit}$
 is the critical density. Use of the thin targets showed a remarkably different backscattered SRS spectrum and temporal behaviour. Scattered light from the 0.9, 2 and 3 μm targets is observed to begin at
${\lambda}_{\mathrm{scatter}}\sim 750\;\mathrm{nm}$
 and shift with time to lower wavelengths, down to
${\lambda}_{\mathrm{scatter}}\sim 660\;\mathrm{nm}$
 . The duration of the emission from the thin foils is also shorter than from the 200 μm targets. Similar SRS streaked spectra have been observed in previous experiments with exploding foils[
Reference Rousseaux, Amiranoff, Labaune and Matthieussent
32
,
Reference Labaune, Baldis, Fabre, Briand, Villeneuve and Estabrook
34
].
SRS streaked spectral data from shots on targets of different thicknesses with signal intensities plotted on a log scale. Total laser energy in 2
$\omega$
 in the pulse is indicated in the top left of each plot, with the average laser intensity across the focal spot given below. Times are not absolutely calibrated against the laser time; for visualization purposes the data were offset in time to be centralized in each image. Images (a)–(d) were taken on shots without a phase plate, while (e)–(h) are taken with a phase plate applied.

Figure 5 Long description
The figure consists of eight panels arranged in two rows of four. Each panel is a heat map with the y-axis representing time t in nanoseconds from 0 to 4 and the x-axis representing wavelength lambda in nanometers from 650 to 850. A color scale on the right of each plot indicates log 10 intensity I.
Top row panels a through d represent shots without a phase plate.
Panel a, 0.9 micrometers thickness, shows a narrow diagonal streak of high intensity moving from 650 nanometers at 3 nanoseconds to 750 nanometers at 1.5 nanoseconds.
Panel b, 2 micrometers, shows a similar diagonal streak but broader and more intense.
Panel c, 3 micrometers, shows a horizontal concentrated signal between 700 and 750 nanometers at approximately 2 nanoseconds.
Panel d, 200 micrometers, shows a vertical column of fragmented low-intensity signals centered around 750 nanometers between 1 and 3 nanoseconds.
Bottom row panels e through h represent shots with a phase plate.
Panel e, 0.9 micrometers, shows a sharp diagonal streak similar to panel a but with distinct striations.
Panel f, 2 micrometers, shows a dense central cluster of high intensity between 700 and 750 nanometers.
Panel g, 3 micrometers, shows a more elongated and fragmented signal cluster shifted toward 750 to 800 nanometers.
Panel h, 200 micrometers, shows a faint and highly fragmented signal concentrated between 750 and 800 nanometers.
Each plot includes laser energy E open parenthesis 2 omega close parenthesis in Joules and average intensity I sub avg in Watts per square centimeter in the top left corner.
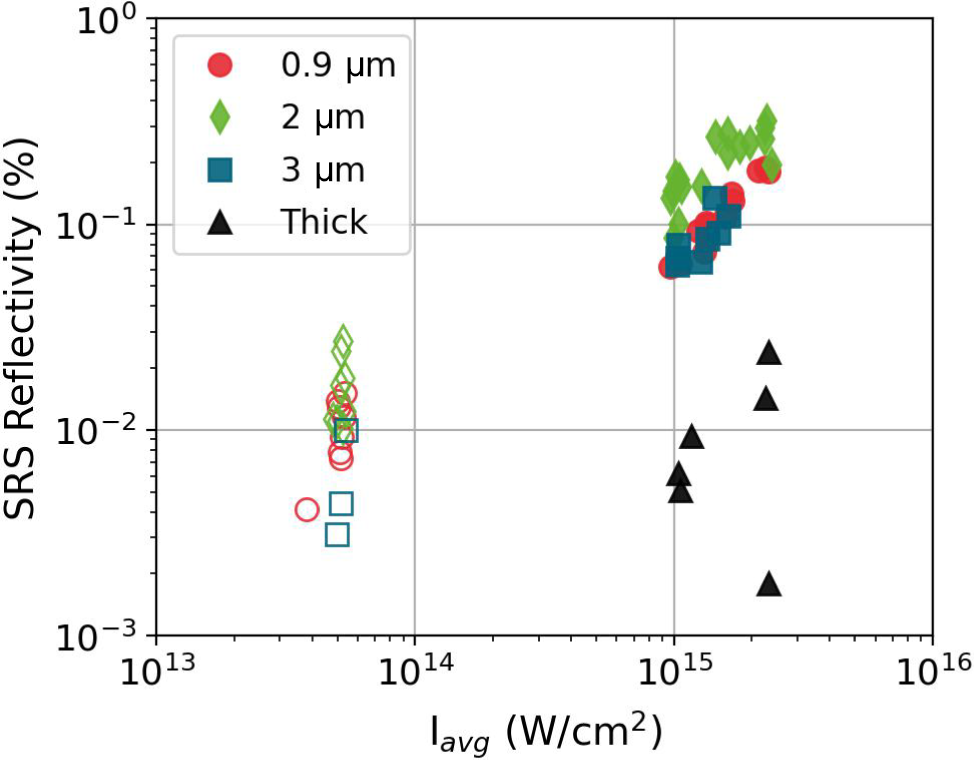
Total backscattered SRS energy was measured by means of a calorimeter in the backscatter line. The calibrated SRS energies are shown in Figure 6. A reflectivity of approximately 0.01% was measured from shots on thick targets without a phase plate. This is consistent with the SRS calorimetry reported by Wasser et al.[ Reference Wasser, Zähter, Rivers, Atzeni, Condamine, Cristoforetti, Fauvel, Fischer, Gizzi, Hoffmann, Koester, Lastovicka, Myatt, Singh, Sokol, Theobald, Weber, Ditmire, Forner and Roth 26 ] and Cristoforetti et al.[ Reference Cristoforetti, Antonelli, Atzeni, Baffigi, Barbato, Batani, Boutoux, Colaitis, Dostal, Dudzak, Juha, Koester, Marocchino, Mancelli, Nicolai, Renner, Santos, Schiavi, Skoric, Smid, Straka and Gizzi 15 ] from single laser pulse irradiation at comparable intensities. In contrast, an order of magnitude increase in reflectivity was observed when using the thin foils at comparable intensity, up to approximately 0.3%. The highest reflectivities occurred with the use of 2 μm targets.
Measured SRS reflectivities against average laser intensity across the focal spot for targets of differing initial thicknesses. Filled markers represent shots taken without a phase plate (
${D}_\mathrm{FWHM}\approx 70\;\mu \mathrm{m}$
 ), while empty markers represent shots taken with a phase plate applied (
${D}_\mathrm{FWHM}\approx 320\;\mu \mathrm{m}$
 ).

Figure 6 Long description
The scatter plot uses logarithmic scales for both axes. The horizontal x-axis is labeled I sub avg in Watts per square centimeter, ranging from 10 super 13 to 10 super 16. The vertical y-axis is labeled S R S Reflectivity in percent, ranging from 10 super minus 3 to 10 super 0.
A legend in the top left identifies four target types:
- Red circles for 0.9 micrometers.
- Green diamonds for 2 micrometers.
- Blue squares for 3 micrometers.
- Black triangles for Thick targets.
Filled markers indicate shots without a phase plate, while empty markers indicate shots with a phase plate.
The data is grouped into two main clusters:
- A lower intensity cluster around 5 times 10 super 13 Watts per square centimeter consists entirely of empty markers (with phase plate). Reflectivity for these points ranges between 3 times 10 super minus 3 and 3 times 10 super minus 2 percent.
- A higher intensity cluster between 10 super 15 and 3 times 10 super 15 Watts per square centimeter consists mostly of filled markers (without phase plate). In this region, the 0.9, 2, and 3 micrometer targets show a positive correlation, with reflectivity increasing from 6 times 10 super minus 2 to nearly 4 times 10 super minus 1 percent. The Thick targets (black triangles) in this high-intensity region are outliers, showing significantly lower reflectivity between 2 times 10 super minus 3 and 3 times 10 super minus 2 percent.
In the case of thick targets we consider the SRS to undergo convective growth in the ablated plasma at the front surface. In the data we did not identify emission around
${\omega}_0/2$
 , which is a signature of absolute SRS or TPD growth close to approximately
${n}_{\mathrm{crit}}/4$
 . The intensity threshold for convective SRS growth in an inhomogeneous plasma is given by Liu et al.
[
Reference Liu, Rosenbluth and White
35
] as follows:

where
${v}_0={eE}_0/{m}_\mathrm{e}{\omega}_0$
 , the electron quiver velocity in the laser fields, and
${k}_0$
 is the wavenumber of the incident laser light. In more practical units this is calculated as follows:

where
${L}_{\mu \mathrm{m}}$
 is electron density scale length in μm and
$\lambda_{\mu \mathrm{m}}$
 is the incident laser wavelength in μm.
For thin targets, the analysis of SRS growth becomes different. SRS is assumed to grow most strongly at the peak of the exploded density profile where the density scale length is longest[ Reference Barr, Boyd and Mackwood 36 ]. The intensity threshold for convective SRS in an underdense exploded density profile was derived by Williams and Johnston[ Reference Williams and Johnston 37 ] as follows:

where
$L$
 is defined as the parabolic density scale length,
$F$
 is defined as follows:

and
$R$
 is the normalized electron plasma wavevector:

Comparable scalings were employed by Figueroa et al. [ Reference Figueroa, Joshi, Azechi, Ebrahim and Estabrook 38 ] and Walsh et al. [ Reference Walsh, Villeneuve and Baldis 39 ] with slight differences in the numerical coefficients but matching scalings with the plasma parameters. To obtain a measure of the density scale length to describe the region around the density maximum, the peaks of the exploded foil density profiles are fit with a parabolic density profile of the following form[ Reference Fontaine, Villeneuve, Baldis, Drake and Estabrook 40 ]:

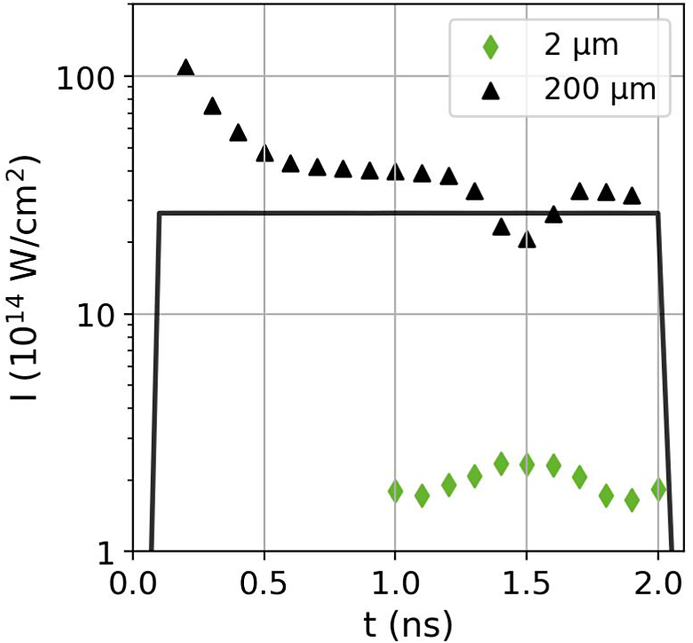
Figure 7 shows the intensity thresholds calculated with Equations (3) and (4) using plasma parameters from the hydrodynamic simulations described in Section 3. The SRS threshold for the thick target is calculated to be approximately
$4\times {10}^{15}\;\mathrm{W}/{\mathrm{cm}}^2$
 . Whilst the average intensity across the focal spot was estimated as approximately
$(1-2)\times {10}^{15}\;\mathrm{W}/{\mathrm{cm}}^2$
 , there were several aberrations across the spot (refer to Figure 2). The local intensity within these hotspots is higher than the average and can exceed the SRS threshold. Intensity thresholds for the thin
$2\;\mu \mathrm{m}$
 target were calculated at times when the target had exploded and the maximum density had dropped below
$0.25{n}_\mathrm{crit}$
 , after
${t}_{\mathrm{sim}}=1\;\mathrm{ns}$
 . The thresholds for the
$2\;\mu \mathrm{m}$
 target are found to be significantly lower than the average laser intensity at all times, and reduced by a factor approximately 10 compared to the thresholds calculated for the thick targets. SRS is therefore predicted to be more readily driven at the density maximum of the exploded foils compared to the ablated plasma region in thick targets. This explains the increased SRS reflectivity for thin targets and stronger signals on the streaked spectral images.
Calculated laser intensity thresholds for SRS growth in the 2 and
$200\;\mu \mathrm{m}$
 targets. The average laser intensity used in the hydrodynamic simulations is plotted for reference.

Figure 7 Long description
The X axis represents time t in n s from 0.0 to 2.0. The Y axis represents intensity I in units of 10 super 14 W forward slash cm squared on a logarithmic scale from 1 to 100.
Three data series are shown.
- A solid black line represents the average laser intensity used in simulations. It rises sharply at 0.1 n s to a constant value of approximately 30 and drops sharply at 2.0 n s.
- Black triangles represent the 200 mu m target. This series starts at a high intensity of over 100 at 0.2 n s, follows a decaying curve to about 40 by 0.5 n s, remains relatively stable until 1.3 n s, dips to a trough of 20 at 1.5 n s, and then recovers to approximately 30.
- Green diamonds represent the 2 mu m target. This series only appears between 1.0 and 2.0 n s, showing a low-intensity curve that peaks at approximately 2.5 around 1.5 n s.
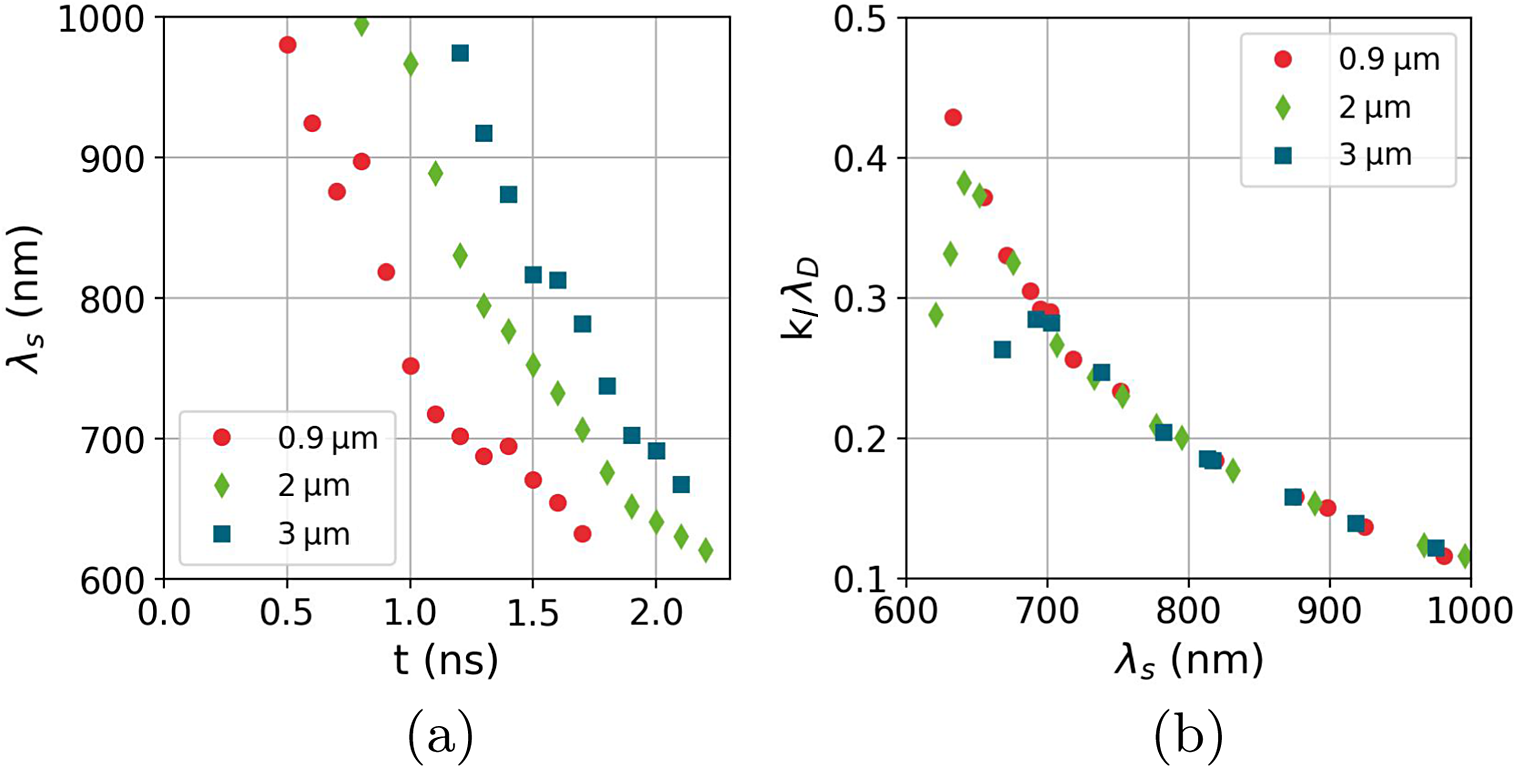
The shifting wavelength of SRS emission from higher to lower wavelengths can be reproduced by considering SRS growth near the maximum of the density profile. The electron density and temperature at the density peak are taken from each timestep of the hydrodynamic simulations and used to calculate a scattered light wavelength from SRS driven at that point. This is shown in Figure 8(a). The SRS wavelength decreases with time, as observed in the experimental spectra, due to decreasing density and temperature at the density peak. The SRS spectra from the exploded foils in Figures 5(a)–5(c) also show a similar cut-off at a lower wavelength at
${\lambda}_{\mathrm{scatter}}\sim 660\;\mathrm{nm}$
 . At lower wavelengths, corresponding to SRS driven in regions of lower density, the Langmuir wave associated with SRS is more susceptible to Landau damping from the thermal plasma. In this work we consider a Langmuir wave to be strongly damped when the Landau damping term
${k}_\mathrm{l}{\lambda}_\mathrm{D}>0.3$
 , where
${k}_\mathrm{l}$
 is the wavevector of the Langmuir wave and
${\lambda}_\mathrm{D}$
 is the Debye length of the plasma. The Landau damping term can be estimated using the following relation[
Reference Vu, DuBois and Bezzerides
41
]:

(a) Estimated wavelength of SRS emission from the density maxima from each thin target as a function of time, calculated from the hydrodynamic simulations. (b) Corresponding
${k}_\mathrm{l}{\lambda}_\mathrm{D}$
 term for each SRS wavelength.

Figure 8 Long description
The image consists of two panels labeled a and b. Both panels share a common legend identifying three data series: red circles for 0.9 micrometers, green diamonds for 2 micrometers, and blue squares for 3 micrometers.
Panel a is a scatter plot with the x-axis representing time t in n s from 0.0 to 2.5 and the y-axis representing lambda sub s in n m from 600 to 1000. All three data series show a non-linear decrease in wavelength over time. The 0.9 micrometer series starts earliest at approximately 0.5 n s and 980 n m, dropping sharply to 630 n m by 1.7 n s. The 2 micrometer series starts at 0.8 n s and 990 n m, following a similar downward curve to 620 n m at 2.2 n s. The 3 micrometer series starts latest at 1.2 n s and 970 n m, reaching 670 n m by 2.1 n s.
Panel b is a scatter plot with the x-axis representing lambda sub s in n m from 600 to 1000 and the y-axis representing the term k sub L lambda sub D from 0.1 to 0.5. All three data series converge onto a single downward asymptotic curve. As the wavelength lambda sub s increases from 600 to 1000 n m, the k sub L lambda sub D value decreases from approximately 0.43 to 0.12. The data points for all three target thicknesses overlap significantly along this curve.
with
${T}_\mathrm{e}$
 in keV. For each target thickness,
${k}_\mathrm{l}{\lambda}_\mathrm{D}$
 was calculated and is shown in Figure 8(b). The targets are found to follow a similar relation between
${k}_\mathrm{l}{\lambda}_\mathrm{D}$
 and the SRS scattered light wavelength, with wavelengths below approximately
$680\;\mathrm{nm}$
 estimated to be subject to strong Landau damping. This implies that the lower wavelength limit in the SRS spectra should be comparable between the target thicknesses, in good agreement with the measured spectra. It is acknowledged that the lower wavelength SRS cut-off is also subject to further effects, such as kinetic inflation[
Reference Vu, DuBois and Bezzerides
41
,
Reference Spencer, Seaton, Goffrey and Arber
42
] and the development of filamentation[
Reference Montgomery, Moody, Baldis, Afeyan, Berger, Estabrook, Lasinski, Williams and Labaune
43
], which can permit SRS growth in strongly damped regimes. To validate our suggested interpretation would require an extensive particle-in-cell (PIC) simulations study and is deemed beyond the scope of this present paper.
4.2 SBS
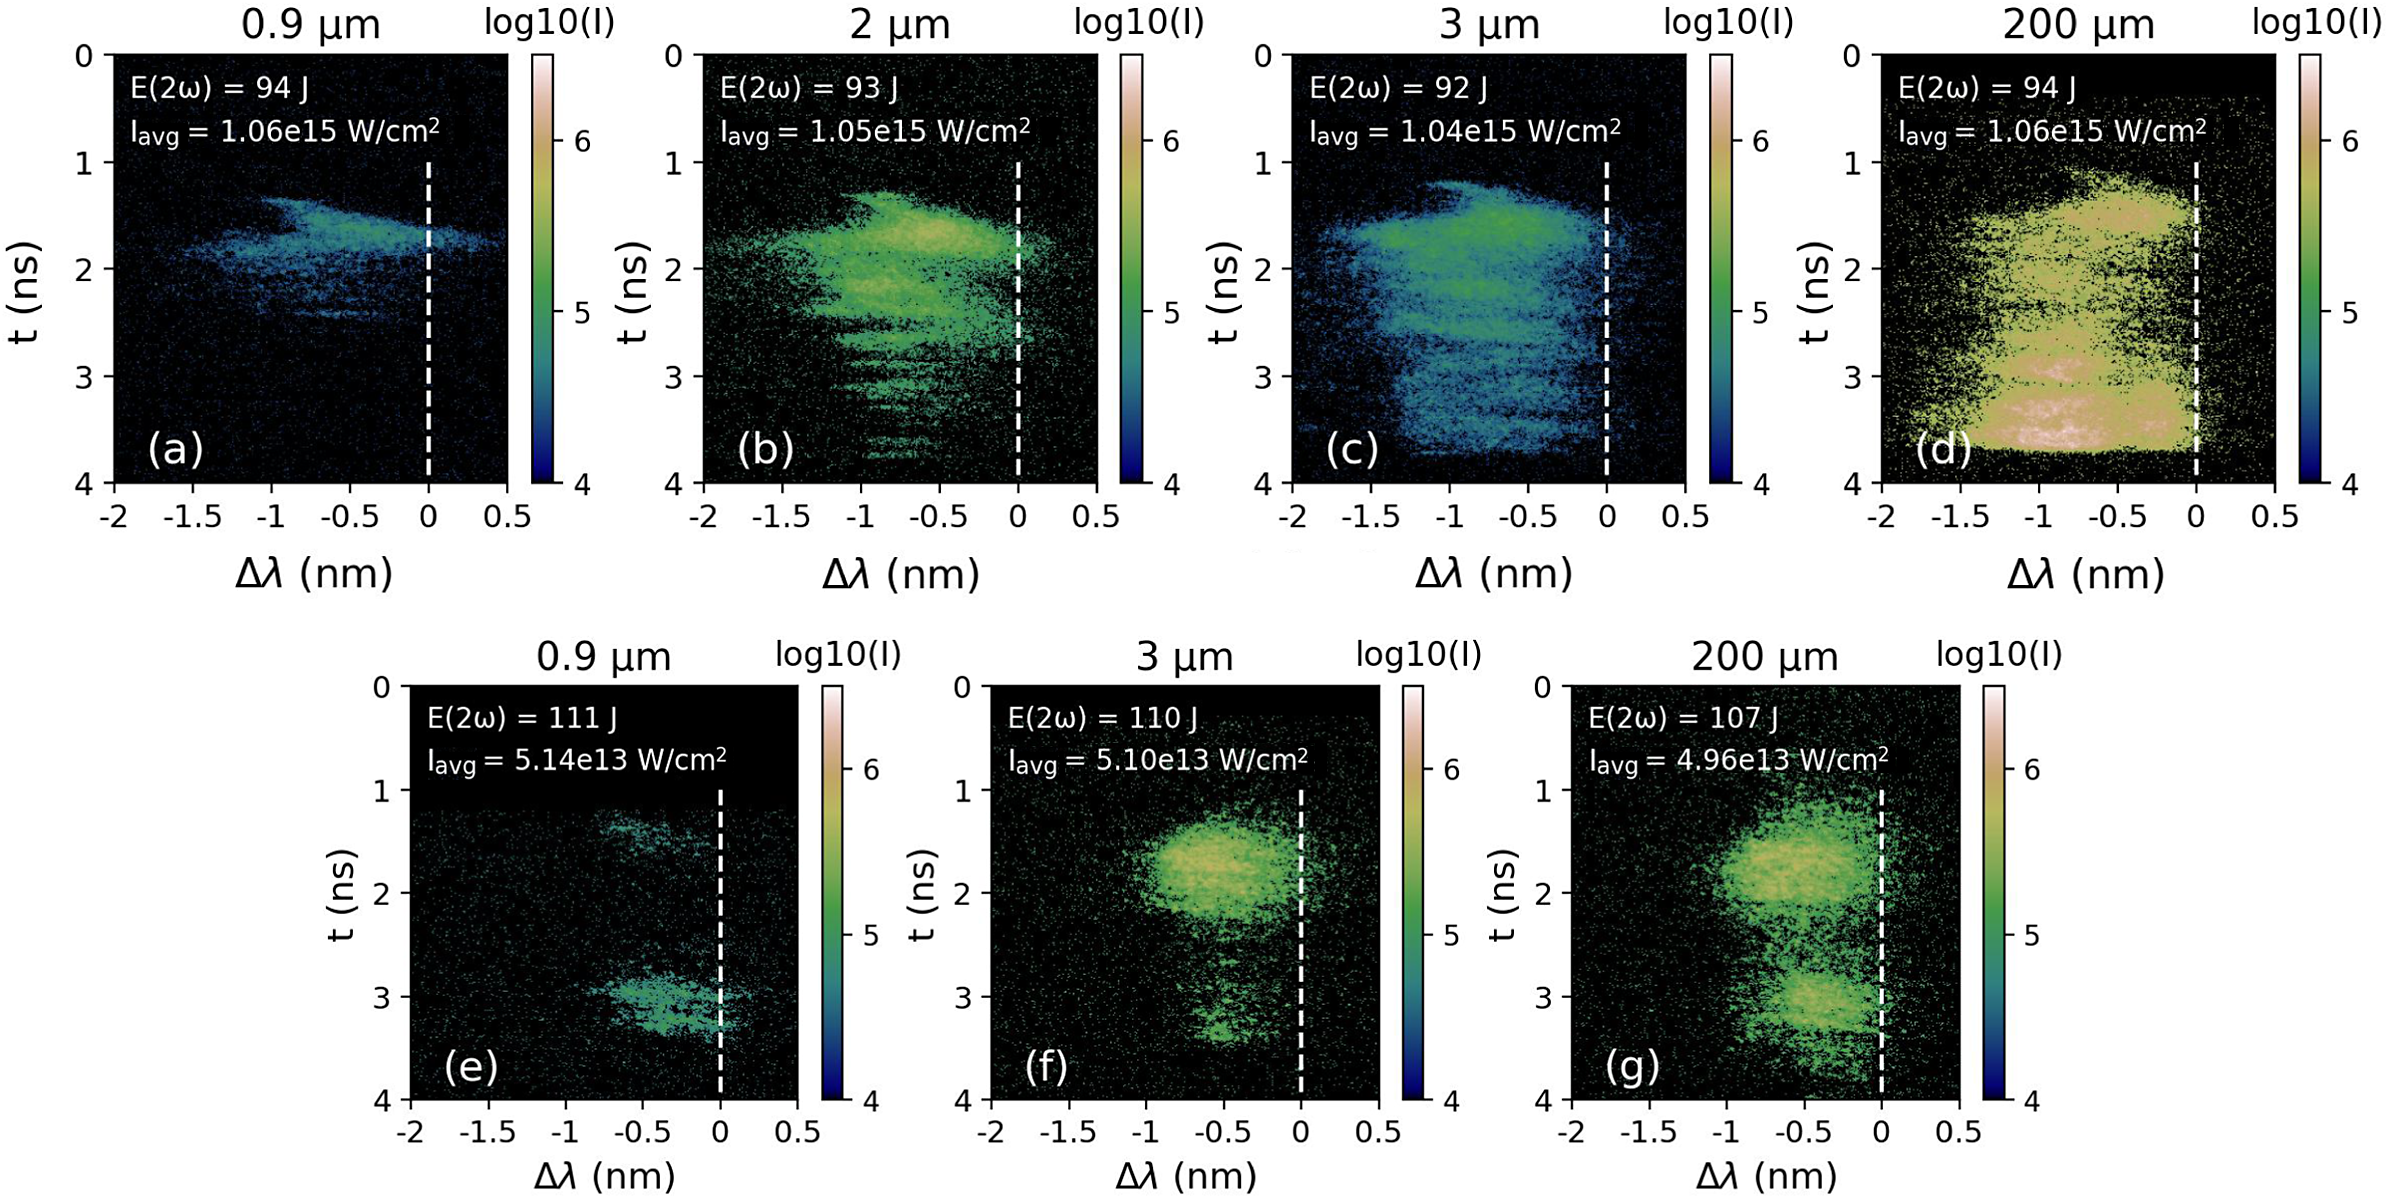
Typical streaked spectra of backscattered SBS light are shown in Figure 9, with the spectral axis showing the wavelength shift relative to the incident laser wavelength,
${\lambda}_0$
 . All scattered spectra demonstrate an average blue-shift. Scattered light is observed up to a maximum shift
${\Delta \lambda \sim -1.8}$
 nm (Figures 9(a)–9(d)). A sharp emission feature, starting at
$\Delta \lambda \sim -1$
 nm and rapidly shifting back to
${\lambda}_0$
 , can be seen at early times in all streaked spectra. This strong early-time shift is associated with the Dewandre effect[
Reference Dewandre, Albritton and Williams
44
]. This arises from a changing optical path length between the observer and the critical surface due to the time-dependence of the phase velocity, which includes a dependence on the variation of electron density with time along the beam trajectory. Ionization in the target by the laser is a source of rapid increase of electron density. The output of the hydrodynamic simulations shows that the plasma is fully ionized in the ablation region within approximately
$200\;\mathrm{ps}$
 . As such, the shift induced by the Dewandre effect will decrease quickly within this duration, which is seen in the sharp feature with the SBS wavelength moving back towards
${\lambda}_0$
 .
SBS streaked spectral data from shots on targets of different thicknesses with intensities plotted on a log scale. Images (a)–(d) were taken on shots without a phase plate, while images (e)–(g) were with a phase plate applied. Total laser energy in 2
$\omega$
 is indicated in the top left of each plot. The wavelength of the scattered light is plotted with an accuracy of
$\pm$
 0.1 nm, and the dashed white lines indicate the laser wavelength. Times are not absolutely calibrated against the laser time; for visualization purposes the data were offset in time to be centralized in the image.

Figure 9 Long description
A multi-panel set of seven heat maps arranged in two rows. The top row contains panels a, b, c, and d. The bottom row contains panels e, f, and g.
Each plot shares the same axes. The vertical y-axis represents time t in n s, ranging from 0 at the top to 4 at the bottom. The horizontal x-axis represents delta lambda in n m, ranging from negative 2 to 0.5. A vertical dashed white line is positioned at 0 n m on the x-axis. A color scale bar to the right of each plot indicates log 10 I, ranging from 4 in dark blue to 7 in white.
Top Row (No Phase Plate):
Panel a: 0.9 micrometer thickness. E 2 omega equals 94 J. I avg equals 1.06 e 15 W per cm squared. Shows a faint horizontal band of scattered light between 1 and 2.5 n s, centered around negative 1 n m.
Panel b: 2 micrometer thickness. E 2 omega equals 93 J. I avg equals 1.05 e 15 W per cm squared. Shows a broader, more intense signal extending from 1 to 4 n s.
Panel c: 3 micrometer thickness. E 2 omega equals 92 J. I avg equals 1.04 e 15 W per cm squared. Similar to b but with a more concentrated intensity peak near 1.5 n s.
Panel d: 200 micrometer thickness. E 2 omega equals 94 J. I avg equals 1.06 e 15 W per cm squared. Shows the highest intensity signal, filling much of the space between 1 and 4 n s with a bright white core.
Bottom Row (With Phase Plate):
Panel e: 0.9 micrometer thickness. E 2 omega equals 111 J. I avg equals 5.14 e 13 W per cm squared. Shows two distinct, small horizontal streaks at 1.5 and 3 n s.
Panel f: 3 micrometer thickness. E 2 omega equals 110 J. I avg equals 5.10 e 13 W per cm squared. Shows a larger, more intense elliptical cloud centered at 1.5 n s and a smaller one at 3 n s.
Panel g: 200 micrometer thickness. E 2 omega equals 107 J. I avg equals 4.96 e 13 W per cm squared. Shows two large, high-intensity clouds at 1.5 and 3 n s, with the upper cloud being more prominent.
At later times the SBS wavelength shift is dominated by Doppler terms. The wavelength shift due to plasma expansion can be calculated as follows[ Reference Depierreux, Loiseau, Michel, Tassin, Stenz, Masson-Laborde, Goyon, Yahia and Labaune 20 ]:

where
${c}_\mathrm{s}$
 is sound speed and
$v$
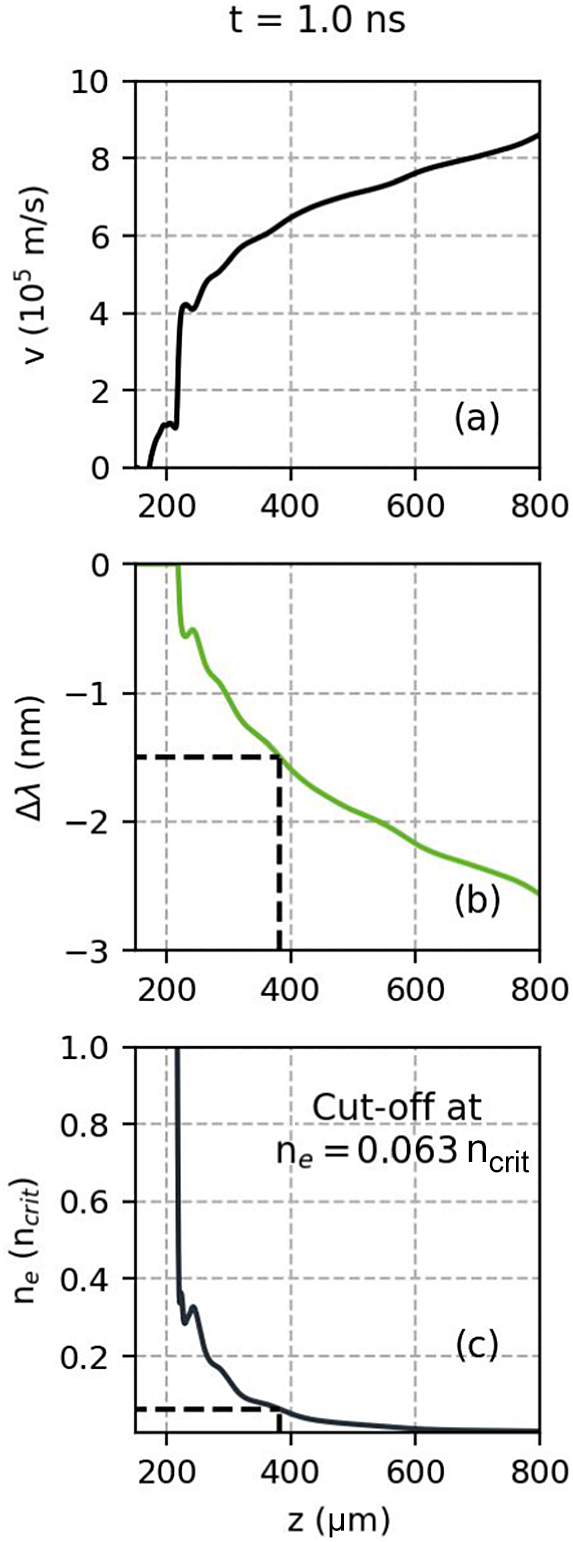
 is the plasma expansion velocity. Figure 10(a) shows the velocity profile in the ablated plasma from the hydrodynamic simulations of the
$200\;\mu \mathrm{m}$
 irradiated target. Ahead of the target front surface (
$z=200\;\mu \mathrm{m}$
 ) there is a short spike in velocity, followed by a region of increasing velocity with distance from target. The hydrodynamic profiles were used with Equation (9) to calculate the anticipated wavelength shifts along the expansion axis, as shown in Figure 10(b). The wavelength shift scales with the expansion velocity, resulting in a greater blue-shift further from the target surface. In the spectrum the shift is
$\Delta \lambda \sim -0.5\;\mathrm{nm}$
 at early times and up to
$\Delta \lambda \sim -1.5\;\mathrm{nm}$
 at later times. According to the calculated shifts for
$t=1\;\mathrm{ns}$
 this corresponds to SBS being driven in the region of
${n}_\mathrm{e}=0.06n_\mathrm{crit}-1{n}_\mathrm{crit}$
 . This result was comparable when assessing other times with the hydrodynamic outputs.
(a) Velocity and (c) electron density profiles taken along the laser axis at
$t=1\;\mathrm{ns}$
 from hydrodynamic simulations of the
$200\;\mu \mathrm{m}$
 target irradiated by the square laser profile. The laser is propagating from right to left. (b) Corresponding calculated SBS wavelength shift along the laser axis.

Figure 10 Long description
The multi-panel figure consists of three vertically aligned line graphs sharing a common x-axis labeled z in micrometers, ranging from 200 to 800. All panels are titled t equals 1.0 n s at the very top.
Panel a, top: The y-axis is v in 10 super 5 meters per second, ranging from 0 to 10. A black line shows velocity increasing from near zero at z equals 200 to approximately 8.5 at z equals 800. There is a sharp vertical rise between z equals 200 and 250, followed by a steady positive slope.
Panel b, middle: The y-axis is delta lambda in nanometers, ranging from negative 3 to 0. A green line shows the S B S wavelength shift. It starts near 0 at z equals 210 and decreases steadily. A dashed black line indicates a specific point where z is approximately 380 and delta lambda is negative 1.5.
Panel c, bottom: The y-axis is n sub e in units of n sub crit, ranging from 0 to 1.0. A dark blue line shows electron density. It drops sharply from above 1.0 at z equals 210 to approximately 0.3 at z equals 250, then decays asymptotically toward zero. A text annotation states Cut-off at n sub e equals 0.063 n sub c, marked by a horizontal dashed line meeting the curve at z approximately 380.
Whilst the duration of the SBS signal from the irradiated
$3\;\mu \mathrm{m}$
 target is similar to the
$200\;\mu \mathrm{m}$
 duration, the SBS signal from the 0.9 and
$2\;\mu \mathrm{m}$
 targets terminates before the end of the laser pulse. In the absence of a fiducial, if we assume SBS emission begins close to the laser start time we can estimate a duration of the SBS signal with the position of the tip of the sharp feature used as
$t=0$
 . The streak images obtained in the experiment were used to calculate an average SBS duration of 1.1
$\pm$
 0.2 ns for the
$0.9\;\mu \mathrm{m}$
 targets and 1.6
$\pm$
 0.4 ns for the
$2\;\mu \mathrm{m}$
 targets. According to the hydrodynamic simulations the thin targets had exploded at these points in time, with a maximum density of
$0.06\;{n}_{\mathrm{crit}}$
 at
$t=1.1\;\mathrm{ns}$
 for the
$0.9\;\mu \mathrm{m}$
 target and a maximum of
$0.07\;{n}_{\mathrm{crit}}$
 at
$t=1.6\;\mathrm{ns}$
 for the
$2\;\mu \mathrm{m}$
 target. These values are in agreement with the lower density cut-off of approximately
$0.06{n}_\mathrm{crit}$
 estimated via the maximum wavelength shift from irradiated thick targets.
In addition, the SBS spectra for 2 and
$3\;\mu \mathrm{m}$
 targets exhibit a reducing maximum wavelength shift with time. From the analysis discussed above we found that the maximum wavelength shift occurs at the lowest electron density where SBS is being driven. The magnitude of the wavelength shift is also related to the sound speed, and hence the local electron temperature since
${c}_\mathrm{s}\propto \sqrt{T_\mathrm{e}}$
 [
Reference Meezan, Berger, Divol, Froula, Hinkel, Jones, London, Moody, Marinak, Niemann, Neumayer, Prisbrey, Ross, Williams, Glenzer and Suter
45
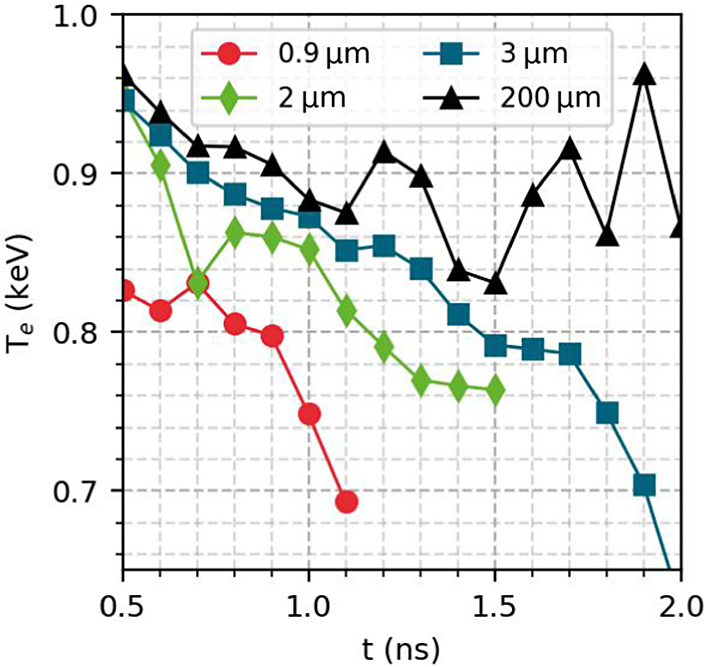
]. Figure 11 shows the simulated
${T}_\mathrm{e}$
 taken at
$0.06{n}_{\mathrm{crit}}$
 for each target thickness. For the thick target
${T}_\mathrm{e}$
 remains around
$0.9\;\mathrm{keV}$
 during the laser pulse. After the thinner targets explode it is seen that
${T}_\mathrm{e}$
 drops with time, occurring earlier in time as target thickness decreases. The decreased
${T}_\mathrm{e}$
 will result in a reduced
${c}_\mathrm{s}$
 and therefore a smaller wavelength shift due to the Doppler effect, explaining the moving maximum wavelength shift in time for the thin exploded targets.
Electron temperature at
${n}_\mathrm{e}=0.06{n}_\mathrm{crit}$
 taken from the DUED simulations from each output.

Figure 11 Long description
The x-axis represents time t in n s, ranging from 0.5 to 2.0. The y-axis represents electron temperature T sub e in k e V, ranging from 0.65 to 1.0. Four data series are plotted with distinct markers and colors.
* The 0.9 micro-meter series (red circles) starts at 0.83 k e V at 0.5 n s and shows a steep decline, ending at approximately 0.69 k e V by 1.1 n s.
* The 2 micro-meter series (green diamonds) starts at 0.94 k e V at 0.5 n s, fluctuates downward, and ends at 0.76 k e V at 1.5 n s.
* The 3 micro-meter series (blue squares) starts at 0.95 k e V at 0.5 n s and follows a steady downward trend, reaching 0.65 k e V by 2.0 n s.
* The 200 micro-meter series (black triangles) starts at 0.96 k e V at 0.5 n s and exhibits the most stability, fluctuating between 0.83 and 0.96 k e V throughout the entire 2.0 n s duration.
Grid lines are dashed and spaced at 0.1 intervals for both axes.
4.3 Effect of beam smoothing
Typical images recorded by the SRS streak camera are shown in Figures 5(e)–5(h) for shots with the smoothed beam. The streaked image intensity from the thick
$200\;\mu \mathrm{m}$
 targets was relatively low. This is also reflected in the calorimetry measurements where the calorimeter did not detect any signal from these shots, suggesting the intensity of the SRS backscattered light was below the detection threshold. Scattered light is measured in a narrower range than from the higher intensity shots without phase plate at
$\lambda =750-780\;\mathrm{nm}$
 , and with no emission at lower wavelengths, that is, from lower densities.
Figure 5(g) shows SRS streak data from an irradiated
$3\;\mu \mathrm{m}$
 target. At early times (
${t}_{\mathrm{streak}}<1.8\;\mathrm{ns}$
 ), a small amount of emission can be seen at
$\lambda =750-780\;\mathrm{nm}$
 , comparable to emission seen from the
$200\;\mu \mathrm{m}$
 target. After
${t}_{\mathrm{streak}}=2\;\mathrm{ns}$
 , a more intense signal becomes visible from
$\lambda =780\;\mathrm{nm}$
 with the spectra then shifting down to
$\lambda =750\;\mathrm{nm}$
 . This signal, which only appears for a small duration, is similar to the profile obtained from exploding foils without a phase plate. The short duration of the signal indicates that the target becomes underdense towards the end of the laser pulse. The thinner 0.9 and
$2\;\mu \mathrm{m}$
 targets produced higher intensities on the streak camera compared to
$3\;\mu \mathrm{m}$
 . Stronger SRS growth from the thinner targets is also evidenced in the calorimetry measurements in Figure 6 where the backscattered SRS energies are lower from
$3\;\mu \mathrm{m}$
 targets compared to 0.9 and
$2\;\mu \mathrm{m}$
 targets. The reflectivity of backscattered SRS from thin foils irradiated by the laser smoothed by the phase plate reached a maximum of approximately 0.01%.
SBS from shots with the phase plate, shown in Figures 9(e)–9(g), yielded a lower maximum wavelength shift of
$\Delta \lambda =-1\;\mathrm{nm}$
 . Two features of emission are clearly seen with a spacing of approximately
$1.5\;\mathrm{ns}$
 . The temporal profile used for these shots was Gaussian (refer to Figure 2). A two-peak structure is evident in the laser profile; the features seen in the streak images are consistent with SBS growth around these peaks in the laser profile. In the work of Masson-Laborde et al.
[
Reference Masson-Laborde, Hüller, Pesme, Labaune, Depierreux, Loiseau and Bandulet
46
] they saw that SBS reflectivity dropped dramatically in the case of decreasing laser power, attributed to the domain of self-focusing moving into higher density regions. The drop in SBS reflectivity on the streak can be linked to the dip in power in the laser profile.
Application of the phase plate here results in two distinct outcomes: (1) spatial smoothing of the intensity profile into the statistical distribution of speckles; and (2) lowering of the average intensity due to the increased overall focal spot diameter. The reduction in SRS reflectivity shown in Figure 6 is likely related to the reduced SRS growth rate with the lower average laser intensity. The generation of the smoothed laser beam can have other consequences on how SRS and SBS growth is considered compared to a plane wave[
Reference Ruyer, Fusaro, Debayle, Capdessus, Loiseau and Masson-Laborde
47
]. While the average intensity across the spot,
$\left\langle I\right\rangle$
 , is reduced compared to the unsmoothed case, the speckle pattern produced by the phase plate has an intensity distribution. This can be described statistically such as in Ref. [Reference Ruyer, Fusaro, Debayle, Capdessus, Loiseau and Masson-Laborde48], which gives the probability density of a speckle with intensity
$I$
 as
$P(I)\sim \left(I/{\left\langle I\right\rangle}^2\right)\;\exp \left(-I/\left\langle I\right\rangle \right)$
 . The critical power for ponderomotive self-focusing,
${P}_\mathrm{c}$
 , within a speckle is given as follows[
Reference Michel, Labaune, Weber, Tikhonchuk, Bonnaud, Riazuelo and Walraet
49
,
Reference Grech, Riazuelo, Pesme, Weber and Tikhonchuk
50
]:

where
${k}_0=2\pi /\lambda$
 . When
${P}_{\mathrm{speckle}}/{P}_\mathrm{c}\gtrsim 1$
 , a speckle can be considered unstable to self-focusing, raising the local laser intensity within the speckle. When higher powers are reached filamentation can also occur. This refers to the development of density filaments, or growing density fluctuations in the direction perpendicular to the incoming laser direction[
Reference Kaw, Schmidt and Wilcox
51
]. The filamentation figure of merit (FFOM) is described by the following[
Reference Dewald, Glenzer, Landen, Suter, Jones, Schein, Froula, Divol, Campbell, Schneider, Holder, McDonald, Niemann, Mackinnon and Hammel
52
,
Reference Froula, Divol, Meezan, Dixit, Moody, Neumayer, Pollock, Ross and Glenzer
53
]:

where
$\left\langle {I}_{14}\right\rangle$
 is average laser intensity in units of
${10}^{14}\;\mathrm{W}/{\mathrm{cm}}^2$
 ,
${T}_\mathrm{e}$
 is electron temperature in keV and
${f}^{\#}$
 is the focusing optic
$f$
 -number. When the FFOM exceeds 1 then a beam can be considered susceptible to strong filamentation.
Lower wavelength SRS and SBS emission is suppressed in the backscatter spectra compared to the shots without a phase plate. Previous work found that use of a phase plate reduced SRS and SBS activity at low densities, related to a reduction of filamentation[
Reference Willi, Afshar-rad, Coe and Giulietti
54
–
Reference Sarri, Cecchetti, Jung, Hobbs, James, Lockyear, Stevenson, Doria, Hoarty, Willi and Borghesi
56
]. For the smoothed beam the FFOM was calculated using Equation (11) taking electron density and temperature profiles from the
$200\;\mu \mathrm{m}$
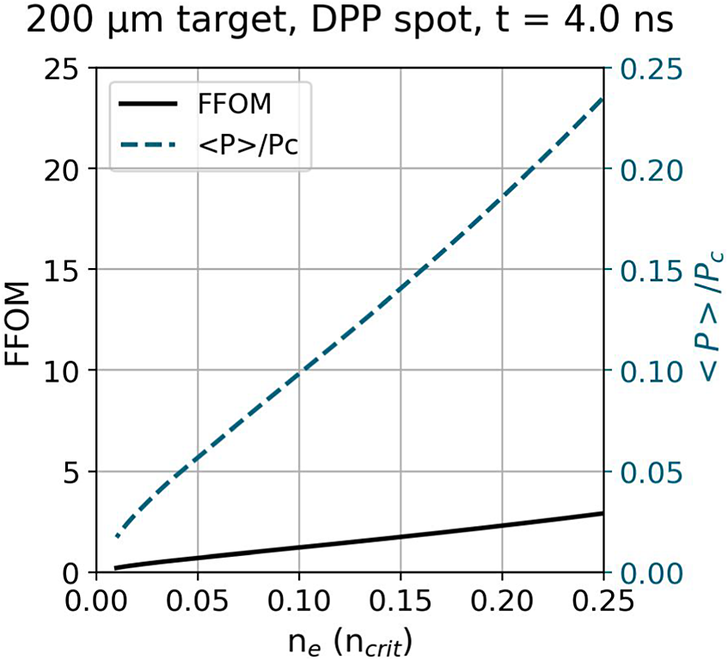
 hydrodynamic simulations. In Figure 12 the FFOM is seen to exceed 1 over a large region of the plasma, indicating that significant self-focusing from the speckles is possible. In the experimental spectra, higher wavelength SRS and SBS emission persists after beam smoothing. As
${P}_\mathrm{c}$
 reduces with increasing density, the average speckle power approaches the self-focusing power threshold. Speckles in the high-intensity tail of the distribution are more likely able to exceed the self-focusing and convective gain thresholds and dominate the net LPI reflectivity in these higher density regions[
Reference Rose
57
–
Reference Masson-Laborde, Monteil, Tassin, Philippe, Gauthier, Casner, Depierreux, Neuville, Villette, Laffite, Seytor, Fremerye, Seka, Teychenné, Debayle, Marion, Loiseau and Casanova
59
].
Filamentation figure of merit calculated from hydrodynamic simulations of the
$200\;\mu \mathrm{m}$
 target irradiated with a smoothed beam. Simulation output times were chosen to match the central time in the laser power profile. The average speckle power, normalized to the power threshold for ponderomotive self-focusing, is also shown.

For this experiment it was observed that optical beam smoothing via the phase plate was not sufficient to completely suppress SRS and SBS, particularly considering the lower average laser intensity with use of the phase plate. Within this discussion the two key parameters, the FFOM and the average speckle power,
$\left\langle P\right\rangle$
 , both scale quadratically with
${f}^{\#}$
 . The focusing lens used in this experiment was particularly long, with
$f/10.2$
 . A lens with a shorter
$f$
 -number would be preferable to avoid strong self-focusing and filamentation. This point should be considered further in view of the designs of future IFE facilities, where larger
$f$
 -number final optics may be planned for engineering purposes.
5 Summary and conclusion
We performed an experiment measuring backscattered SRS and SBS growth over differing laser power profiles and total pulse energies. To enable access to changed electron density scale lengths and temperatures in the single pulse regime both thick (
$200\;\mu \mathrm{m}$
 ) and thin (
$<3\;\mu \mathrm{m}$
 ) targets were irradiated. The effect of smoothing the focal spot via use of a phase plate was also investigated. We observed that thin target irradiation resulted in an increase in SRS reflectivity of an order of magnitude compared to thick targets. Streaked data of SBS spectra revealed a cut-off of SBS activity at increasingly shorter times for thinner targets. Results from hydrodynamic simulations suggest thin targets explode during the laser pulse, rapidly becoming under-critical. Strong SRS growth is driven at the maximum of the exploded density profile. A lower density limit was determined below which SBS does not grow significantly, explaining the cut-off in signal on the streaked SBS data. Reduced LPI activity in lower density regions was observed with the use of a phase plate due in part to the reduced laser intensity and the optically smoothed intensity distribution. Higher density emission is suggested to persist due to self-focusing within high-intensity speckles. These results demonstrate the use of exploding foils to expand the explorable parameter space at high-power laser facilities, and the importance of the focusing lens f-number in controlling filamentation and self-focusing.
A key novelty exploited in this experiment is the ability to obtain data at a high repetition rate. The data obtained in the campaign spanned over 600 shots with various targetry and laser irradiation profiles implemented. Diagnostics such as calorimetry are well-suited for transition into a higher repetition rate modality. Statistical approaches could be taken to reduce uncertainty in future data collection. Streaked spectra of backscattered light are an incredibly informative single-shot measurement, and require thought on how to best make use of the diagnostic at a high repetition rate. One option could be to use streaked images taken over a parameter scan of, for example, laser intensity to produce a three-dimensional (3D) plot or movie of the development of SRS/SBS spectra. With the increase of shot statistics, the use of Bayesian tools or machine learning should also be examined to improve the efficiency of data processing and analysing LPI behaviour.
Acknowledgements
The experiment was performed at the ELI Beamlines Facility, in the E3 experimental hall on the P3 physics platform. The authors would like to acknowledge the support of the ELI Beamlines technical and operational teams. The authors acknowledge financial support from EUROFUSION FP 9 - HORIZON EUROPE GA 101052200, CUP B53C21001960005, and the NextGeneration EU Integrated Infrastructure I-PHOQS –Initiative in Photonic and Quantum Sciences (CUP B53C22001750006, ID D2B8D520, IR0000016). The work of F. Condamine, G. Fauvel and P.-E. Masson-Laborde was partially performed in the framework of the TARANIS project supported by the French government as part of France 2030 (AAP Réacteurs Nucléaires Innovants - #DOS0237678/00). The work of B. Fisher was supported by the EPSRC grants EP/X025373/1 and EP/L01663X/1, and STFC Physical Sciences on XFELs, and UPLiFT grants. The project received funding from the Carl-Zeiss-Stiftung. This work has been carried out in the framework of the EUROfusion Enabling Research Projects: EUROfusion Enabling Research Projects AWP24-ENR-IFE-02-CEA-02 “Foams as a Pathway to Energy from high gain direct drive ignition (FoPIFE)” and CfP-FSD-AWP26-ENR-01 “Conceptual design for a European High Power Laser Fusion Research Facility” (HiPER+RF), funded by Euratom Research and Training Programme (Grant Nos. 633053 and 101052200). Views and opinions expressed are however those of the author(s) only and do not necessarily reflect those of the European Union or the European Commission. Neither the European Union nor the European Commission can be held responsible for them.
















 Open access

