Introduction
Nutrition is the consumption of sufficient and balanced food for healthy growth, development and survival. Eating habits that begin to form in the early years of life are shaped in the preschool period during which children need to try various foods, distinguish tastes and be open to new tastes to ensure optimum nutrition and, as a result, healthy growth and development. During the preschool period, children develop new motor and cognitive skills while finding opportunities to experience different foods and acquire healthy habits(Reference Nicklaus, Boggio and Chabanet1). However, during this period, children are also generally reluctant to try new foods, which might cause food refusal (FR) behaviours. This is called ‘food neophobia’ (FN) and is stated as a common reason why children reject new foods(Reference Dovey, Staples and Gibson2). Another behavioural feeding problem, ‘Food Pickiness’ (FP), is the avoidance/rejection behaviours of known and unknown foods(Reference Dovey, Staples and Gibson2,Reference Cooke, Carnell and Wardle3) . Previous studies show that children with FN and FP are generally fed with limited nutrients, which leads to inadequate and unbalanced nutrition(Reference Cooke, Carnell and Wardle3,Reference Falciglia, Couch and Gribble4) . In preschool children, FR behaviours occur as a result of various factors, for example, health problems of organic origin, socio-economic and cultural factors, sensory preferences and feeding behaviours of parents(Reference van den Brand, Hendriks-Hartensveld and Havermans5). FP and FN are common issues in preschool children, and as a result, they can affect children’s nutritional status and quality of life significantly(Reference Janius and bin Amdan6).
Mediterranean-style nutrition is associated with children’s eating habits, but it also involves social and gastronomic elements that reflect a certain lifestyle(Reference Donini, Serra-Majem and Bulló7). Recent studies investigating the relationship between children’s adaptation to the Mediterranean diet and FR behaviours report that children who exhibit FR behaviours generally have lower adaptation to the Mediterranean diet and, for this reason, have unhealthy dietary patterns(Reference Janius and bin Amdan6,Reference Belkharoubi, Medjahdi and Kaddour8,Reference Fleischeuer, Mourmans and Dibbets9) .
Previous studies also report that children with FR behaviours have lower quality of life scores(Reference Albitos and Albitos10) and that compliance with the Mediterranean diet is associated positively with quality of life(Reference Papadaki and Carayanni11). It has been emphasised that the Mediterranean nutrition model supports a healthy lifestyle and is associated with improved social functioning and reduced behavioural problems in children, which supports the critical role of nutrition on quality of life(Reference Belkharoubi, Medjahdi and Kaddour8).
Materials and methods
The study was conducted between May 2023 and February 2024 with 400 volunteering children, who were aged 4–6 years who attended preschools in the central districts of the city of Konya and who met the inclusion criteria, and their parents. The study had a cross-sectional design, and the data were collected by using a survey method. The sample size was calculated as 381 participants in the G * Power v 3.1.9.4, with a 1-point deviation from the mean score of the Child Food Rejection Scale (CFRS) in the study of Şengüzel & Akyüz(Reference Şengüzel and Akyüz Yılmaz12) (30·45 (sd 6·41)), 90 % power, 0·05 margin of error, 0·16 effect size and a paired hypothesis(Reference Faul, Erdfelder and Lang13,Reference Faul, Erdfelder and Buchner14) . The study was conducted with a 5 % larger sample size (400 participants) considering possible losses. Children who had chronic diseases, who were diagnosed with eating disorders, special diet treatments and communication barriers and did not attend the institution were excluded from the study.
In the present study, a questionnaire that included questions about the socio-demographic characteristics of children and parents, questions about children’s nutritional habits, CFRS, Mediterranean Diet Quality Index for children, general purpose health-related quality of life scale for children and KINDLY Parent Form were used as the data collection tools. The height and weight measurements of children and parents were obtained by researchers. In the evaluation of the anthropometric measurements of the children, the Z-score reference values that were developed by the WHO were employed. The Z-score intercept points recommended for children aged 0–5 and 5–19 years were used in the classification of anthropometric measurements(15).
Body mass indices were calculated from the measured values of parents’ body weights and heights by using the formula weight (kg)/height (m2)(16).
The CFRS, which was developed by Rioux et al. (Reference Rioux, Lafraire and Picard17), was used to determine children’s FP and FN status. CFRS has eleven items and two sub-dimensions. The FN sub-dimension consists of six items and the FP sub-dimension consists of five items. Each item is rated on a 5-point Likert scale and receives a score between ‘1’ and ‘5’. Scores can be between 6–30 for the FN sub-dimension, between 5–25 for the FP sub-dimension and between 11–55 for the total. An increased scale score indicates that food rejection is high(Reference Rioux, Lafraire and Picard17). The validity and reliability study for the Turkish society were conducted by Şengüzel and Akyüz(Reference Şengüzel and Akyüz Yılmaz12), and the Turkish version of the scale consists of ten items and two sub-dimensions.
The Children’s Mediterranean Diet Quality Scale (KIDMED), which was developed by Serra-Majem et al. (Reference Serra-Majem, Ribas and Ngo18), with sixteen items (twelve positive and four negative), was used to determine children’s compliance with the Mediterranean diet (+1 point is given for ‘Yes’ to the positive questions in the scale, and ‘–1’ point is given for ‘Yes’ to the negative questions). The lowest score at the end of the scale is ‘0’, and the highest is ‘12’. As a result, a score of ‘8’ and above is classified as optimal Mediterranean diet (good), 4–7 points as needing improvement in compliance with the Mediterranean diet (moderate) and 3 and below as very low compliance with the Mediterranean diet(Reference Serra-Majem, Ribas and Ngo18). The validity and reliability of the scale for the Turkish society were conducted by Şahingöz et al. (Reference Şahingöz, Özgen and Yalçın19).
The KINDL (KINDer Lebensqualitätsfragebogen: Children Quality of Life-Questionnaire), which was developed by Ravens-Sieberer and Bullinger in 1998, was used to measure general-purpose health-related quality of life(Reference Ravens-Sieberer and Bullinger20). The scale was specially developed for both healthy and sick children and adolescents. The Turkish adaptation of the scale was made by Eser et al. (Reference Eser, Yüksel and Baydur21). There are three versions of the KINDL Scale based on self-reporting used in different age groups. The Kiddy-KINDL (Interviewer-Administered Version) developed for 4- to 6-year-old children was used in the present study. The Young Child Form has a 3-point Likert style consisting of twelvequestions (1 = never – 3 = very often) and has a total quality of life and additional disease sub-dimension. Negatively oriented items are scored in reverse according to the wording of the questions.
The Kiddy-KINDL Quality of Life Scale Family Form was also employed in the study, which indirectly evaluates the quality of life of children aged 4–6 years by their families. This form consists of seven sub-dimensions (physical well-being, sensory well-being, self-esteem, family, friends, school and parents) and a total score, evaluated in a 5-point Likert style (1 = never – 5 = always). Negatively oriented items are scored by reversing the question according to the wording. As the score obtained from the scales increases, the perceived quality of life improves(Reference Ravens-Sieberer and Bullinger20,Reference Eser, Yüksel and Baydur21) .
Statistical analysis
All statistical analyses were performed by using the IBM SPPS v25 software for Windows in the study. Descriptive statistics were shown as mean (standard deviation (sd)) (min–max) or median values for continuous variables, while descriptive statistics were shown as frequency and percentage values for categorical variables. The χ 2 test was used to examine statistical relationships between categorical variables. Firstly, the normality assumption was examined for continuous variables, and the data with kurtosis and skewness values within ±2 were considered normal. Differences between two independent groups according to continuous variables were examined using the independent samples t test, the one-way ANOVA was used for groups where normality assumption was provided to compare more than two groups and the Kruskal–Wallis H test was used for groups where normality assumption was not provided. Paired group comparisons were used for significant tests in more than two group comparisons, and the Tukey test was used after checking the homogeneity of variances in paired group comparisons. Also, the Pearson correlation test was used for the data that had a normal distribution to test the relationship between two continuous variables, and the Spearman correlation test was used for the data where the assumption was not provided. The significance value for all tests was taken as 0·05.
Results
The mean age of the 400 children (41·75 % girls and 58·25 % boys) who participated in the study was found to be 4·80 (sd 0·71), 28·5 % were 4 years old, 49·5 % were 5 years old, 21·7 % were 6 years old, 13·3 % were born with low birth weight (g). The mean birth length was 51·51 (sd 6·57) cm in boys and 49·86 (sd 6·27) cm in girls. Body weight and height Z scores according to current age were similar between the genders. The mean current height Z score of the children was found to be 0·43 (sd 1·59) cm, and the mean body weight Z score was 0·29 (sd 1·05) kg. According to the current age-based BMI Z score of the children, 71·0 % were normal, 15·5 % were very thin or underweight, 9·0 % were overweight and 4·5 % were obese.
Among the children who participated in the study, 93 % had been breastfed, and the mean breast-feeding period is 19·12 (sd 7·7) months. The total breast-feeding duration of children was 18·72 (sd 8·06) (0–48) months on average, 18·21 (sd 8·21) months in girls and 19·14 (sd 7·93) months in boys. The rate of children starting complementary food at 6 months was 68·3 %. The rate of children starting complementary food before the 6th month was 20·0 %, and the rate of children starting complementary food late was 11·7 %. The rate of children getting sick frequently was 42·8 % (F: 20·5 %, M: 22·3 %). As a result of the χ 2 analysis conducted to examine whether the status of breast-feeding, duration of breast-feeding, month of starting complementary food and the frequency of child getting sick differed according to gender, it was determined that these variables did not cause significant differences according to gender (P > 0·05).
The mean age of the parents of the children participating in the study was found to be 34·65 (sd 5·35) years, 44·9 % of them were of normal weight, 39·7 % were overweight and 15·4 % were obese. The average body weight of the parents was 70·61 (sd 27·91) kg, their lengths of height was 164·30 (sd 8·34) cm and the average BMI was 25·63 (sd 4·74) (14·79–50·64). Also, 58·0 % of them had a university degree or higher, 96·8 % were married and 88·8 % had a nuclear family structure. The average number of people in the family was 4·06 (sd 1·10), and 75 % consisted of three or more people. In terms of income perception levels, it was found that 69·8 % of the parents evaluated the income level as moderate. It was also found that 84·8 % of the parents did not have a chronic health problem.
A total of 56·8 % of parents consulted healthcare staff regarding child nutrition and 85·5 % thought that it was more important for their children to get the nutrients their bodies needed. It was also found that 47·3 % of the parents who participated in the study gave their children food to make them feel better when they were sad or hurt, 40·3 % offered food as a reward for their children to behave well and 39·8 % avoided trying food without tasting it, just looking at its determined.
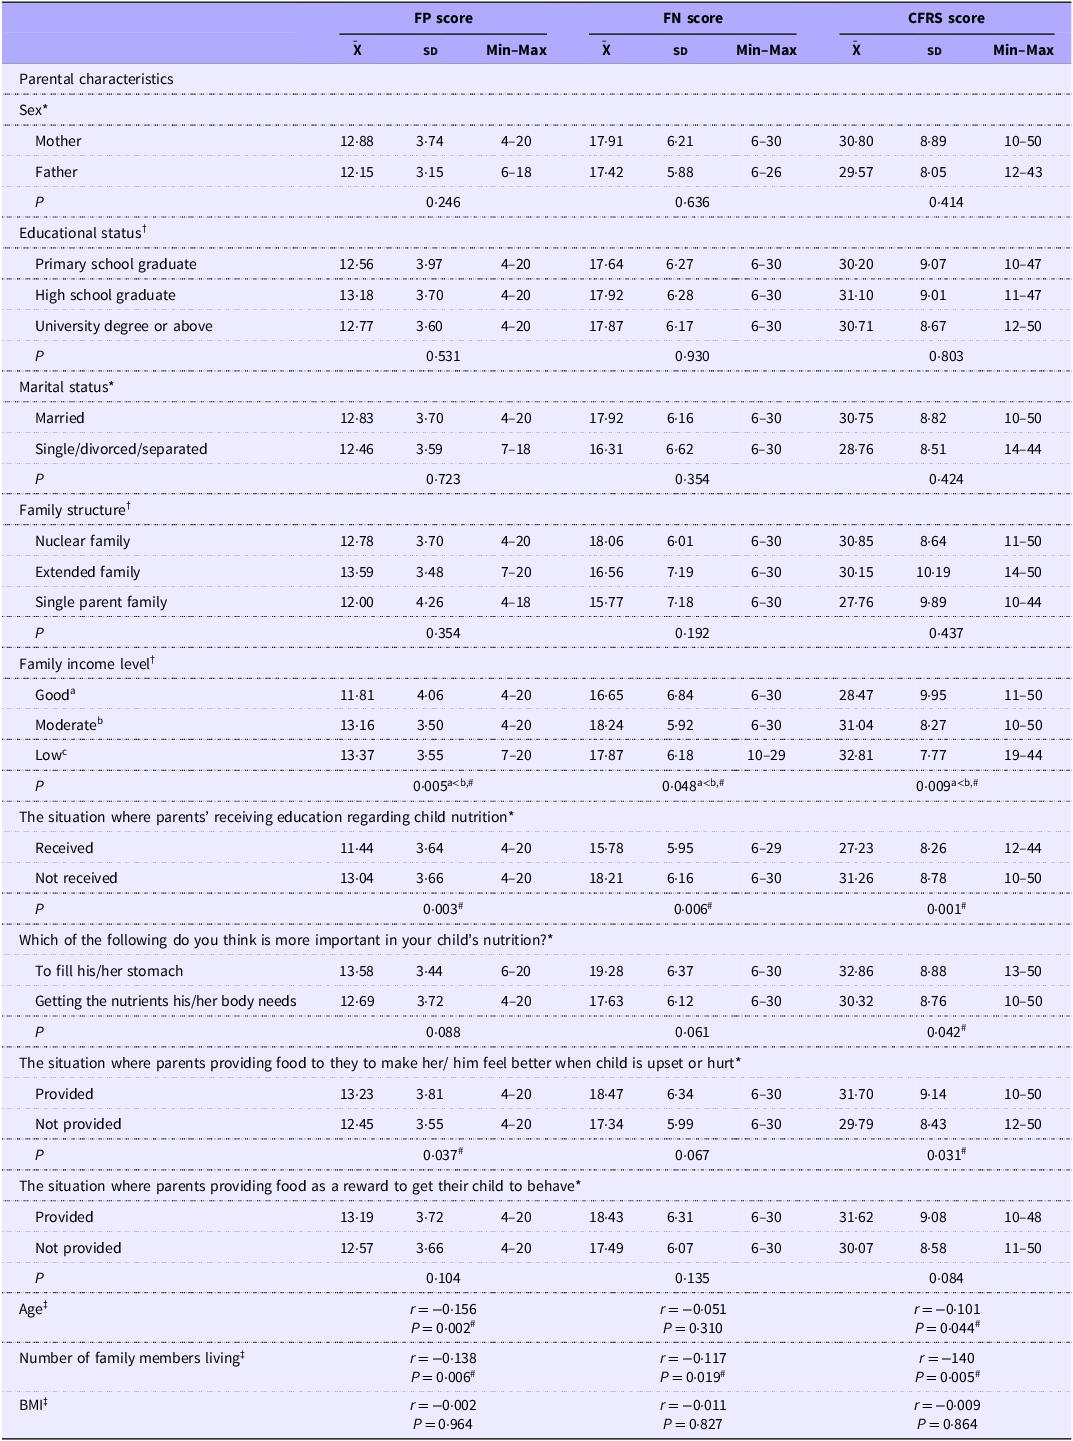
Table 1 shows the results of the effects of parents’ characteristics on the total score of the children’s FR scale, FP and FN sub-dimensions. A statistically significant negative and low-level relationship was detected between parental age and the number of people in the family and total CFRS behaviours and sub-dimensions, except for parental age and the child’s FN behaviours (P > 0·05). There was a statistically significant difference in the total scores and sub-dimensions of children’s food rejection behaviours according to the family income levels, and it was found that the children of parents with high income levels had lower total CFRS, FP and FN scores (P < 0·05). It was also found that the education status of parents on child feeding significantly affected children’s food rejection behaviours (P < 0·05). Also, the total CFRS score of the children of parents who thought that the important thing in the nutrition of the child was ‘to fill his/her stomach’ was 32·86 (sd 8·88), the total CFRS score of the children of parents who thought ‘getting the nutrients his/her body needs’ was 30·32 (sd 8·76) and the total FP score of the children of parents who said ‘when my child feels sad or hurt, I give him/her food to make him/her feel better’ was 13·23 (sd 3·81), CFRS score was 31·70 (sd 9·14), FP score of those who said ‘No’ was 12·45 (sd 3·55), CFRS score was 29·79 (sd 8·43) and statistically significant differences were detected between the groups (P < 0·05). There were no statistically significant differences between the parents offering food as a reward for their children to behave and children’s food refusal behaviours (P > 0·05) (Table 1).
The comparison of the child food rejection scale scores according to parental characteristics (Mean values and standard deviations)

FP, food pickiness; FN, food neophobia; CFRS, Child Food Rejection Scale.
*Independent samples t test, †one-way ANOVA, ‡Pearson correlation.
#It is statistically significant.
aLevel 1, bLevel 2, cLevel 3.
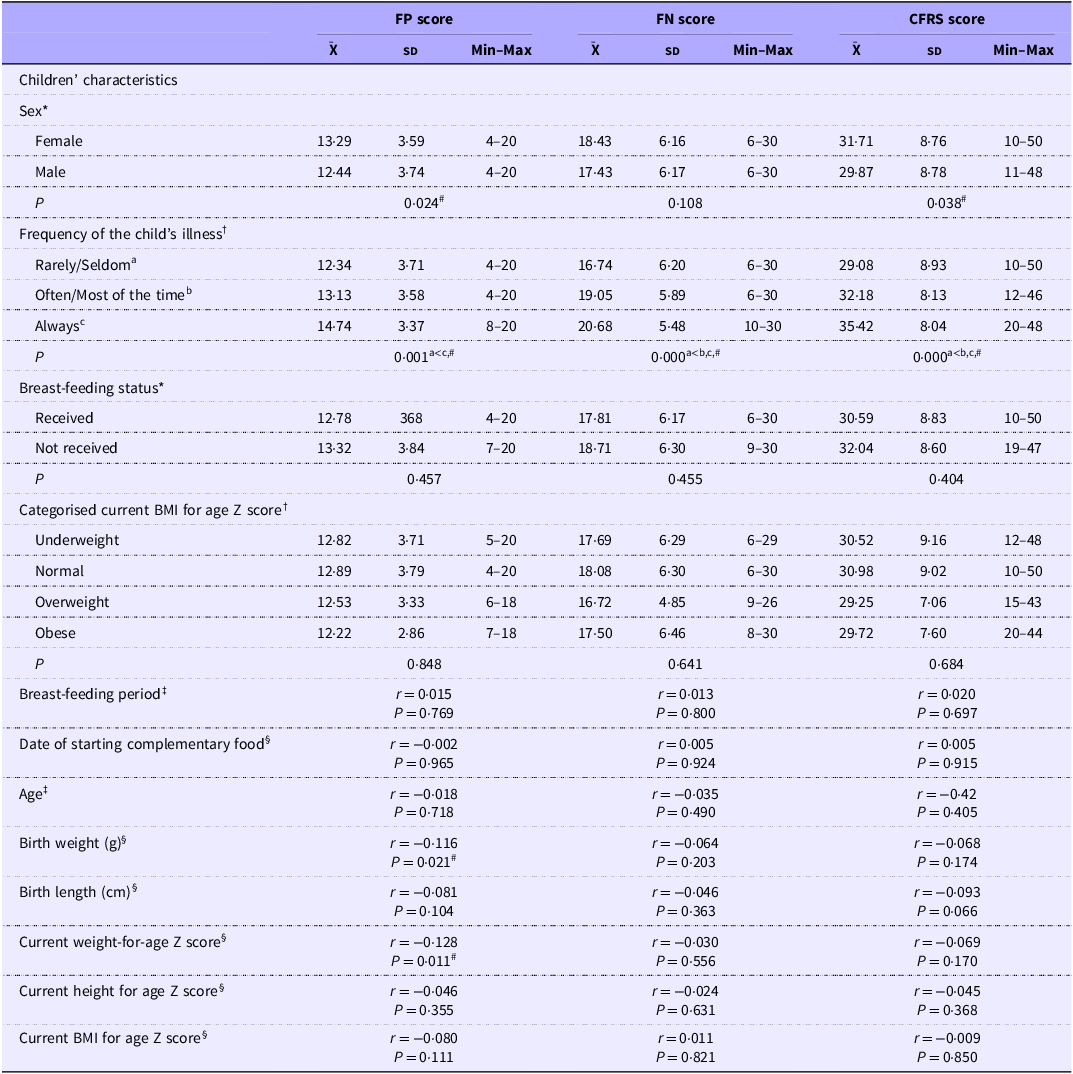
Table 2 gives the food refusal scale scores according to some characteristics of the children. No statistically significant differences were detected between the child’s age, height at birth, height Z score for current age, BMI Z score for current age, breast-feeding status, duration of breast-feeding, time of starting complementary food and total FR, FP and FN sub-dimension scores (P > 0·05). Statistically significant differences were detected between the gender of the children and the FP score and the total CFRS score (P < 0·05) and between the frequency of illness and the FP score, FN score and the total CFRS score (P < 0·001).
The evaluation of children’s food refusal scale scores according to child characteristics (Mean values and standard deviations)

FP, food pickiness; FN, food neophobia; CFRS, Child Food Rejection Scale.
*Independent samples t test, †one-way ANOVA, ‡Pearson correlation, §Spearman correlation.
#It is statistically significant.
aLevel 1, bLevel 2, cLevel 3.
A statistically significant negative and weak relationship was detected between children’s birth weight and current weight-for-age z score and the FP behaviour score (r = –0·116, P = 0·021 and r = –0·128, P = 0·011, respectively) (Table 2).
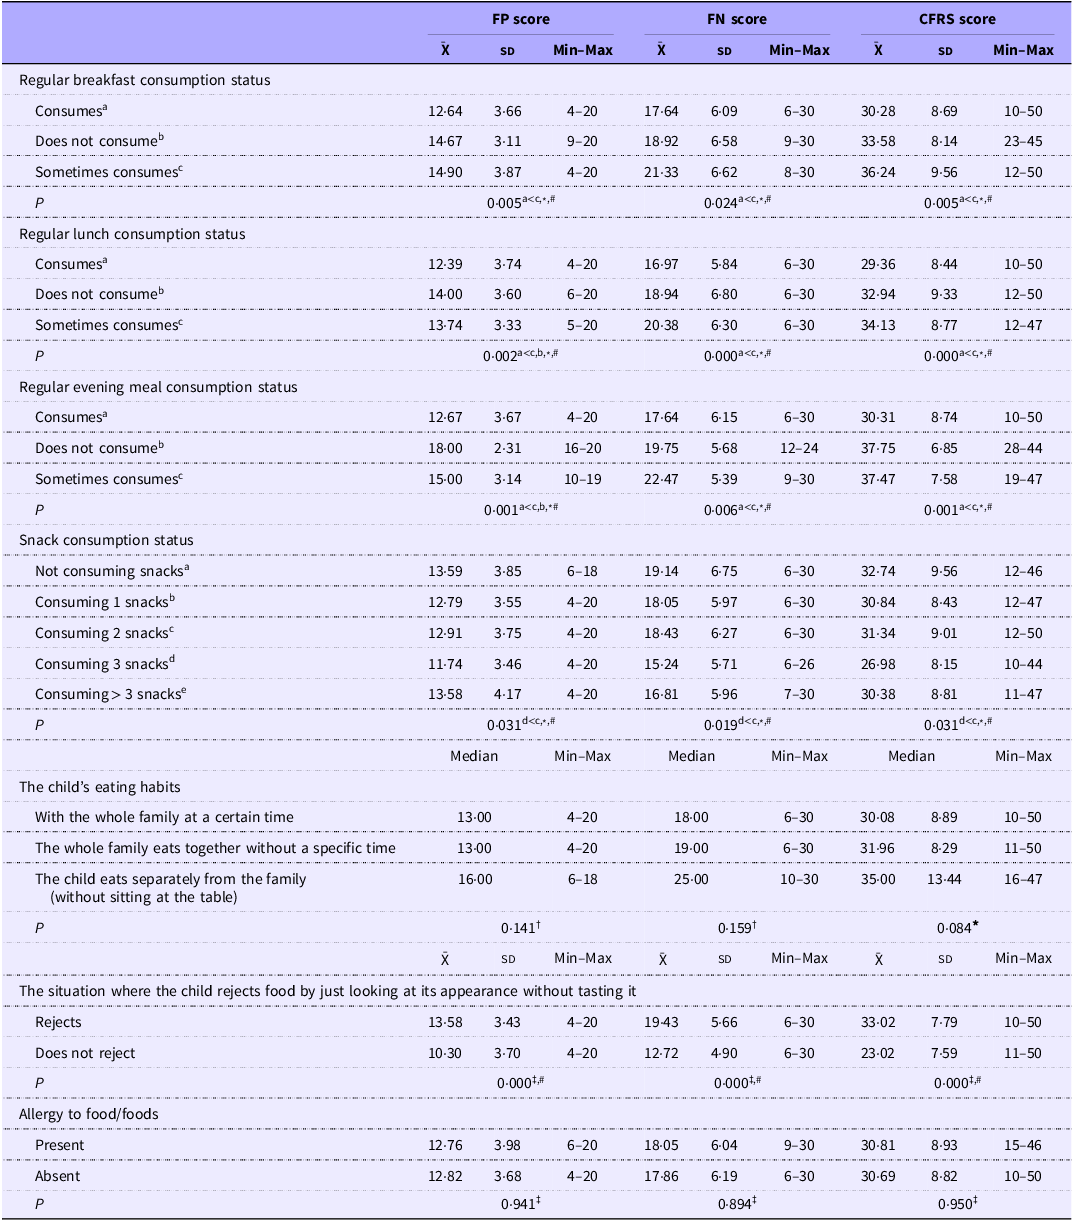
Table 3 shows the relationships between children’s dietary patterns and FR behaviours. Although there were no statistically significant differences between the dietary patterns at home and children’s food allergy and FR behaviours (P > 0·05), statistically significant differences were detected between consuming breakfast, lunch and dinner regular, consuming snacks and avoiding trying foods by just looking at their appearance without tasting them, and FR behaviours (P < 0·05). The mean FP score, FN score and total CFRS scores of children who consumed main meal regular were lower than those who did not consume main meals regular (P < 0·05). When the children’s snack consumption and FR behaviours were examined, it was found that the FP score (P > 0·05), FN score (P < 0·05) and total FR scale scores (P < 0·05) of children who never consumed snacks were higher. It was also found that children who avoided trying foods by just looking at their appearance without tasting them had higher FP scores, FN scores and CFRS total scores (P < 0·01, Table 3).
The evaluation of children’s food refusal scale scores according to their dietary patterns (Median values; mean values and standard deviations)

FP, food pickiness; FN, food neophobia; CFRS, Child Food Rejection Scale.
* One-way ANOVA, †Kruskal–Wallis H-Test, ‡independent samples t test.
#It is statistically significant.
aLevel 1, bLevel 2, cLevel 3, dLevel 4, eLevel 5.
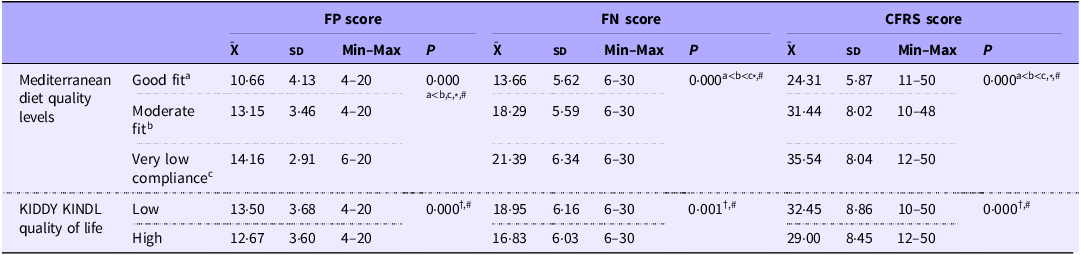
Table 4 shows the relationship between children’s compliance with the Mediterranean diet, quality of life perceptions and FR behaviour scores.
Evaluation of children’s food refusal behaviour scores according to their adaptation to the Mediterranean diet and perception of quality of life

FP, food pickiness; FN, food neophobia; CFRS, Child Food Rejection Scale.
*One-way ANOVA, †independent samples t test.
#It is statistically significant.
aLevel 1, bLevel 2, cLevel 3.
Based on the pairwise comparison results, it was found that children who had good compliance to the Mediterranean diet (FP: 10·66 (sd 4·13), FN: 13·66 (sd 5·62) and total FR: 24·31 (sd 5·87) showed less food rejection behaviours when compared to children with moderate compliance to the Mediterranean diet (FP: 13·15 (sd 3·46), FN: 18·29 (sd 5·59), total FR: 31·44 (sd 8·02) and children with very low compliance (FP: 14·16 (sd 2·91), FN: 21·39 (sd 6·34) and total FR: 35·54 (sd 8·04) (P < 0·05).
Children who had high quality of life perception (FP: 12·67 (sd 3·60), FN: 16·83 (sd 6·03), total FR: 29·00 (sd 8·45) had less FR behaviours when compared to children with low quality of life perception (FP: 13·50 (sd 3·68), FN: 18·95 (sd 6·16) and total FR: 32·45 (sd 8·86) (P < 0·05, Table 4).
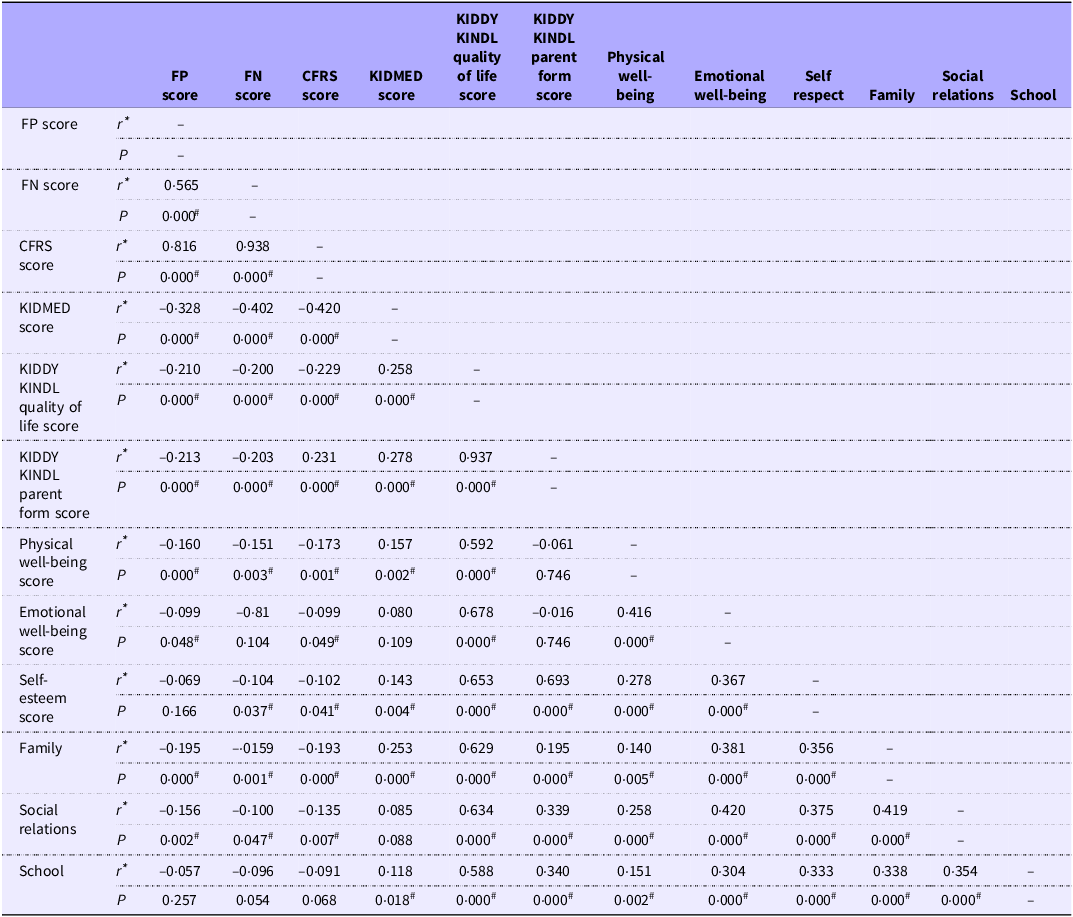
Table 5 presents the results of the relationship analysis between children’s FR, KIDMED and KIDDY KINDL quality of life child and parent scores.
Correlation analysis results between children’s FR scores and KIDMED and KIDDY KINDL scores

FP, food pickiness; FN, food neophobia; FR, food refusal; CFRS, Child Food Rejection Scale; KIDMED, The Children’s Mediterranean Diet Quality Scale; KIDDY KINDL, Children Quality of Life-Questionnaire.
*Pearson correlation test.
#It is statistically significant.
Statistically significant negative and moderate relationships were detected between the KIDMED score and FP (r = –0·328, P = 0·000), FN (r = –0·402, P = 0·000) and total CFRS score (r = –0·420, P = 0·000). Also, statistically significant negative and low-level relationships were detected between KIDDY KINDL child quality of life score and FP (r = –0·210, P = 0·000), FN (r = –0·200, P = 0·000), total FR (r = –0·229, P = 0·000) and KIDMED score (r = 0·258, P = 0·000). Also, a statistically significant positive and low-level relationship was detected between the KIDDY KINDL child quality of life score and the KIDMED score (r = 0·258, P = 0·000).
When the relationships between the children’s FR behaviour scores and the KIDDY KINDL parent form total score and the KIDDY-KINDL sub-dimension scores were evaluated, statistically significant negative and low-level relationships were detected between the children’s physical well-being, family relations and social relations and the total scores of FP, FN and FR (P < 0·05). A statistically significant negative and low-level relationship was detected between the children’s emotional well-being levels and the FP and total CFRS scores and between the children’s self-esteem levels and the FN and total CFRS scores (P < 0·05).
A low level and positive relationship was detected between children’s physical well-being, self-esteem, family relations and school relations and the KIDMED scores (P < 0·05), and a statistically significant, high level and positive relationship was detected between the KIDDY KINDL child quality of life score and parent form total scores (r = 0·937, P = 0·000). Also, moderate positive relationships were found between the KIDDY-KINDL sub-dimensions and children’s quality of life perceptions (P < 0·001, Table 5).
Discussion
Eating habits that are established in early childhood are the key to a healthy diet later in life. In preschool children, FR behaviour is known to be a common problem that prevents children from developing healthy eating habits. The two main forms of FR in young children, FP and FN, also negatively affect the quality of life of young children(Reference Vehapoğlu, Ustabaş and Özgen22).
The relationship between FR behaviours in preschool children, their compliance with the Mediterranean diet and their quality of life was examined in the present study.
Many factors have impacts on the development of eating behaviours. As well as individual characteristics, family and social factors also affect eating habits. Especially young children are dependent on their families in the development of eating behaviours. The socio-demographic characteristics, economic status and socio-cultural structure of the family affect children’s eating habits significantly(Reference Sirasa, Mitchell and Rigby23). In the present study, it was found that the gender, BMI, educational status, marital status and family structure of the parents did not cause significant differences in the FR behaviours of their children (P > 0·05). On the other hand, it was also found that the family income levels, the age of the parents, the number of individuals in the family and the education received on child nutrition caused significant differences in the total FR score, FP and FN sub-dimension scores of the children (P < 0·05, Table 1). There was also an inverse relationship between the age of the parents and FR behaviours of children, and as the age of the parent increased, FR behaviours decreased. Similarly, as the number of individuals in the family and the income levels of the family increased, FP, FN and FR behaviours of children decreased. It was also found that children of parents who had received training in child nutrition had less FP, FN and FR behaviours.
In summary, based on the findings, young parental age, low family income, small number of family members and lack of education on child nutrition may be effective in the development of FR behaviours such as FP and FN at an early age. A similar study that was conducted in Turkiye reported that FR behaviours decreased in preschool children as parental age increased(Reference Ergün and Bozdemir24).
This positive impact is associated with the experience and knowledge of the parents in the literature. Previous studies report that parental age is an important determinant of parenting outcomes, with Belsky(Reference Belsky25) stating that older parents have more knowledge about parenting and child development than younger parents(Reference Bornstein26), it is stated that older and more educated mothers are better at developing positive eating behaviours in their children(Reference Xue, Zhao and Cai27).
In the present study, it was found that as the level of education of the parents increased, the FR scores of the children decreased, but the difference was not significant. In addition, the results also show that having parents who received education in child nutrition and having a higher income level significantly reduced FR behaviours in children (P < 0·05, Table 1). Also, most of the parents (56·8 %) consulted healthcare staff about child nutrition. When the literature was reviewed, it was found that an inverse relationship was reported between the level of education of the parents and the negative nutritional behaviours of the children. It was found that the low of education of the parents and inadequate nutrition-health knowledge are associated with a higher frequency of unhealthy eating habits in children(Reference Vereecken and Maes28). In addition, evidence that there is a positive relationship between education level and income level(Reference Çiftçi and Kangallı29,Reference Mou30) . Although this study found no statistically significant relationship between education level and eating habits, the findings suggest that education level influences individuals’ income and preferred sources of information, thus supporting the development of healthy eating habits. Therefore, the study’s results are generally consistent with findings in the existing literature. Similar to this study, Foinant, Lafraire and Thibaut(Reference Foinant, Lafraire and Thibaut31) reported that FN in children was negatively associated with the socio-economic status and education levels of parents. Dop & Niculescu(Reference Dop and Niculescu32) reported that FN scores in preschool children were significantly higher in children with parents with lower education levels. On the other hand in a study conducted by Finistrella et al. (Reference Finistrella, Manco and Ferrara33), it was reported that eating behaviours such as FR were not related to the socio-economic status and education level of the parents.
Some attitudes and behaviours of parents towards child nutrition were also questioned and their relationship with FR behaviours was examined in the present study (Table 1).
The total FR scale CFRS score of the children of parents who thought that the important thing in the child’s nutrition was ‘to fill his/her stomach’ was found to be significantly higher (P < 0·05). Similarly, the total FP and CFRS scores of the children of parents who thought that giving food to children would make them feel good were significantly higher (P < 0·05). Also, although not at a statistically significant level, the FR scores of the children of parents who gave food as a reward to children to behave were higher when compared with the others (P > 0·05) (Table 1). According to these results, it can be speculated that the children of parents who exhibit positive attitudes and behaviours in child nutrition exhibit more positive eating behaviours.
The effects of parental child-feeding behaviours come to the forefront in the present study. It is reported in a study that Turkish mothers are traditionally more likely to use inadequate strategies to ensure that their children eat more and more frequently(Reference Kıvılcım, Doğan and Canaloğlu34). Similar studies that were conducted in Turkiye also report that feeding problems in children are caused by mothers’ incorrect and inadequate child-feeding strategies and that parents exhibit negative feeding behaviours such as force feeding, threatening, persuading, and offering food frequently while feeding their children(Reference Ergün and Bozdemir24,Reference Kıvılcım, Doğan and Canaloğlu34) . In the same way, results were reported in studies conducted in different countries(Reference Sirasa, Mitchell and Rigby23,Reference Galloway, Farrow and Haycraft35,Reference Jansen, Derks and Mou36) .
In the present study, statistically significant differences were detected between the gender of the children, their frequency of illness and their FR behaviours (P < 0·05, Table 2). The mean FP score and total FR score of the girls were significantly higher than those of the boys. In this context, it can be speculated that girls have higher FP and FR behaviours than boys. Similarly, Dop & Niculescu(Reference Dop and Niculescu32) also reported that the FN score in preschool children was significantly higher in girls. On the other hand, in a cross-sectional study that was conducted in Poland with children aged 2–7 years, it was reported that there were no significant differences in children’s FN scores according to gender (P > 0·05)(Reference Białek-Dratwa and Kowalski37). Similarly, in another study that was conducted in Italy with preschool children and mothers on FN and FP, no differences were reported in girls and boys according to gender(Reference Finistrella, Manco and Ferrara33). It can be considered that these differences between the studies might be associated with the different cultural characteristics of the sample group. In fact, in a previous study, it was reported that the socio-cultural characteristics of parents affected the eating behaviours of children(Reference Farrow, Haycraft and Blissett38).
In the present study, the mean SY score, FN score and total FR score of children who became sick more often were higher than those who became sick less often (P < 0·05). In this respect, the FR behaviours of children who were often ill were higher than those of children who became ill less often (Table 2). This result can be explained by the knowledge that organic diseases seen in children have negative impacts on their appetite mechanism(Reference Stokley and Houghton39).
In the present study, it was also found that as the children’s birth weight and body weight for current age Z score increased, FP behaviour decreased (P < 0·05). However, no significant relationships were found between the child’s age, duration of breast-feeding, time of starting complementary feeding and FR behaviours (P > 0·05, Table 2). In support of this finding, Dubois et al. (Reference Dubois, Farmer and Girard40) also reported that if children between the ages of 2 and 5 were picky about food, the probability of being underweight was twice as high. In another study, contrary to these results, it was reported that overweight/obese children were more picky and more neophobic than normal-weight children(Reference Finistrella, Manco and Ferrara33). In previous studies conducted on FR behaviours in early childhood, it was reported that there were no significant relationships between FN and children’s birth weight, breast-feeding history, weight at the time of breast-feeding and starting supplementary feeding and current weight(Reference Dop and Niculescu32,Reference Russell and Worsley41) .
FR is common in early childhood. Studies speculate that between 8 % and 54 % of children become picky eaters at some point during their preschool years. These refusals are often associated with young children’s pickiness towards certain foods, particularly fresh fruits and vegetables(Reference van den Brand, Hendriks-Hartensveld and Havermans5,Reference Chao42,Reference Mascola, Bryson and Agras43) . Also, a population-based study on FN in preschool children and its relationship to food preferences reported that daily food preferences of preschool children were strongly associated with FN(Reference Russell and Worsley41). Similarly, in many studies, FR behaviours are associated with the number of meals and dietary patterns and that children who consume regular meals are less likely to refuse food(Reference Farrow, Haycraft and Blissett38,Reference Savage, Fisher and Birch44,Reference Liem and Zandstra45) . In this study, it was also found that children who regularly consumed their meals had lower FR scores (P < 0·05, Table 3). This result shows that children who regularly consumed their meals had lower FR behaviours compared with children who consumed them irregularly. In the present study, it was also reported in the same study that children who avoided trying foods by just looking at their appearance without tasting them had higher average FR scores than those who did not avoid them (P < 0·01, Table 3). Consistent with this finding, Rioux et al. (2017) stated that children’s behaviour of rejecting certain foods based solely on their appearance was associated with both FN and FP(Reference Rioux, Lafraire and Picard46).
The Mediterranean diet characterises not only an accepted nutritional model but also a certain lifestyle(Reference García Cabrera, Herrera Fernández and Rodríguez Hernández47). In this study, it was found that children who had high compliance with the Mediterranean diet had lower FR behaviours (P < 0·01, Table 4). The relationship analysis results also support this result. There was a negative and moderate relationship between children’s KIDMED scores and FR scores (P < 0·01, Table 5). In this regard, it can be speculated that compliance with this dietary model has positive impacts on nutritional behaviours. In similar studies conducted in the pediatric population, a negative relationship was reported between FR behaviours such as neophobia and compliance with the Mediterranean diet(Reference Maiz and Balluerka48–Reference Kanısoy and Kabaran50).
It was found in the study that children with low quality of life perception had higher FR behaviour scores compared with children with high quality of life perception (P < 0·01, Table 4). Based on the relationship analysis, it was found that there were negative relationships between KIDDY KINDL child and parent scores and children’s FR scores (P < 0·01, Table 5). In other words, it can be speculated that children’s FR behaviours negatively affect children’s general quality of life.
As children’s KIDMED scores increased, KIDDY KINDL child and parent scores also increased (P < 0·01, Table 5). For this reason, it can be speculated that compliance with the Mediterranean diet has positive effects on the quality of life of children. In two systematic reviews, it was reported that there were significant positive relationships between compliance with the Mediterranean diet and the quality of life of children and adolescents(Reference Romero-Robles, Ccami-Bernal and Ortiz-Benique51,Reference Wu, Zhuang and Li52) . It was also reported that increasing compliance with the Mediterranean diet might affect the quality of life positively(Reference Wu, Zhuang and Li52,Reference Diamantis, Katsas and Kalogiannis53) . In a study conducted in Turkiye by Bakırhan, Özkaya and Pehlivan(Reference Bakırhan, Özkaya and Pehlivan54) to evaluate the quality of life of children and adolescents aged 5–18 years, it was reported that those with high KIDMED scores had significantly higher total and subcomponent scores on the quality of life scale (P < 0·05). Similarly, in a previous study conducted in Italy, it was reported that neophobia levels were significantly higher in children with low compliance to the Mediterranean diet (P < 0·05)(Reference Di Nucci, Pilloni and Scognamiglio55). In a prospective study, the relationship between compliance to the Mediterranean diet and lifestyle factors and eating behaviours was investigated, and it was reported that there were positive relationships between compliance with the Mediterranean diet and restricted eating, while it was negatively associated with emotional eating and external eating (P < 0·01)(Reference Bawaked, Gomez and Homs56).
Children’s quality of life was assessed with the KINDL parent form, in which parents evaluated their children’s quality of life, in addition to their subjective evaluations in the present study. In this context, a very strong and positive relationship was detected between children’s subjective evaluations and parental evaluations (r = 0·937, P = 0·000). For this reason, it can be speculated that the quality of life perceived by parents is directly related to the quality of life perceived by children. In another study conducted on the quality of life of children aged 4–7 years, it was reported that while the total quality of life score of children was high, the quality of life scores of children evaluated by parents were at moderate levels(Reference Dağtekin57). In the present study, negative relationships were found between the KIDDY KINDL parent form sub-dimensions, and it was also found that as children’s physical and emotional well-being, self-esteem, family and social relationships increased and there was a decrease in FR behaviours (P < 0·05). As a result, it can be speculated that as children’s quality of life improves, FR behaviours decrease, and for this reason, their food behaviours improve (Table 5).
In conclusion, high compliance with the Mediterranean diet in early childhood reduces FR behaviours such as FP and FN in children. It was also found that low quality of life increases FR behaviours in children. Also, socio-demographic, socio-economic characteristics, the child’s health status, parental behaviours, diet quality and quality of life level in early childhood had an impact on FR behaviours.
Recommendations and limitations
There were some limitations in the present study. Firstly, the study had a cross-sectional design and the generalisability of the results is limited. Secondly, since the data collection tools were self-report scales, the reliability of the responses given by the participants might not have been fully ensured. Another limitation was that although the sample size of the study was determined statistically appropriately with the G * Power program, it can be argued that the determined sample size was relatively small since increasing the sample size would increase the reliability of the tests. Despite this, the fact that the data and anthropometric measurements were collected face-to-face by the researchers increased the reliability of the study.
Wildfire-Driven heavy metals in soil
The results also emphasise the importance of parental education and environmental factors in developing strategies to develop healthy eating behaviours in preschool children and to improve existing eating habits.
Many environmental factors, especially the family environment, in which children live are influential in the development and establishment of feeding behaviours in early childhood. However, when the literature was reviewed, the behavioural determinants of various eating behaviours in children have not been elucidated. For this reason, more studies are needed with larger samples to fully understand the effects of environmental and dietary factors on FR behaviours in the preschool period.
Acknowledgements
The authors are grateful to the volunteers who took participated in the study.
This research received no specific grant from any funding agency, commercial or not-for-profit sectors.
The study was designed by G. P., M. K., R. S. D, S. B. and E. Y. The data were collected by R. S. D. and S. B. and analysed by E. Y. G. P. and M. K. drafted the manuscript and G. P., M. K. and E. Y. revised the manuscript. All authors read and approved the final manuscript.
The authors declare no conflict of interest.
Ethics committee approval was obtained from Selçuk University, Faculty of Health Science (No: 23/468) 26/04/2023), and the principles of the Helsinki Declaration were followed throughout the study. Before the administration of the data collection tools, all the participants were informed about the aim and content of the study and asked to sign the informed consent form.