1 Introduction
One type of resonant surface wave, named the Faraday wave, is a classic physical phenomenon which occurs when a container filled with fluids is under a vertical vibration. It was first reported by Faraday (Reference Faraday1831), who found that the frequency of the wave motions was half of the frequency of the external vibrations. However, Matthiessen (Reference Matthiessen1868) obtained a different result in that the response frequency was synchronous in his experiment. A later experiment by Rayleigh (Reference Rayleigh1883) again supported the observation of Faraday (Reference Faraday1831). This distinction was finally explained by Benjamin & Ursell (Reference Benjamin and Ursell1954) via the theory of Mathieu functions. Several instability regions corresponding to different responses were predicted. This work, despite being a linear one, shed light on the theoretical research of this problem, and many researchers devoted themselves to exploring the untapped knowledge of this area. Miles & Henderson (Reference Miles and Henderson1990) reviewed related studies of great physical significance.
Kumar & Tuckerman (Reference Kumar and Tuckerman1994) extended the linear stability theory of Benjamin & Ursell (Reference Benjamin and Ursell1954) to viscous fluids and employed Floquet-based analysis to calculate Faraday waves numerically. The stability analysis based on this numerical method was confirmed by experimental data of Edwards & Fauve (Reference Edwards and Fauve1993) and Bechhoefer et al. (Reference Bechhoefer, Ego, Manneville and Johnson1995). Thereafter, this advanced linear approach was widely used to understand Faraday waves (Kumar Reference Kumar1996; Besson, Edwards & Tuckerman Reference Besson, Edwards and Tuckerman1996). Even recently this method was applied to the analysis of Faraday waves for the case of a two-layer liquid (Pototsky & Bestehorn Reference Pototsky and Bestehorn2016). But, due to its fully numerical identity, it ‘renders a physical understanding difficult’ (Müller et al. Reference Müller, Wittmer, Wagner, Albers and Knorr1997). Beyer & Friedrich (Reference Beyer and Friedrich1994), Cerda & Tirapegui (Reference Cerda and Tirapegui1997) and Müller et al. (Reference Müller, Wittmer, Wagner, Albers and Knorr1997) also developed theories including integral formulations of the viscous dissipation to deal with linear stability problems. Besides linear analysis, weakly nonlinear theory provides more details of pattern collection and amplitude stability. Meron (Reference Meron1987) factored out the multiple-scale analysis by considering a more general form of the free surface. Then, autonomous equations were obtained to analyse the stability of parametric excitation systems. The method utilized by Milner (Reference Milner1991) to obtain amplitude equations was straightforward, but the damping term was plugged in from a viewpoint of mechanical energy. A comparison was made by Milner (Reference Milner1991) between his theoretical prediction and experiment (Douady & Fauve Reference Douady and Fauve1988) in terms of the threshold accelerations. There is still a large discrepancy even though the theory is weakly nonlinear. Zhang & Viñals (Reference Zhang and Viñals1997) assumed that dissipation is only located near the surface skin and used a quasi-potential theory to derive the amplitude equations. Chen & Viñals (Reference Chen and Viñals1999) extended previous research by using a more general model and the viscous dissipation was not restricted to small values. Miles (Reference Miles1999) also discussed this problem by using an indirect approach. Rajchenbach & Clamond (Reference Rajchenbach and Clamond2015) reviewed previous methods and summarized that the critical point of initial instability is a balance between acceleration and dissipation plus detuning.
Among the various features of Faraday waves, the diverse wave patterns are most attractive. The complexity in the presence of free surfaces is easy to investigate by relatively simple experimental devices. Many wave patterns have been found in laboratory observations including squares, hexagons, strips, stars and lattices (Douady & Fauve Reference Douady and Fauve1988; Cross & Hohenberg Reference Cross and Hohenberg1993; Edwards & Fauve Reference Edwards and Fauve1993, Reference Edwards and Fauve1994; Bosch, Lambermont & van de Water Reference Bosch, Lambermont and van de Water1994; Kudrolli, Pier & Gollub Reference Kudrolli, Pier and Gollub1998; Kityk et al. Reference Kityk, Embs, Mekhonoshin and Wagner2005). Besides, spatio-temporal chaos of the free surface was observed by Kudrolli & Gollub (Reference Kudrolli and Gollub1996). The free surface can also exhibit standing solitary waves (Wu, Keolian & Rudnick Reference Wu, Keolian and Rudnick1984; Rajchenbach, Leroux & Clamond Reference Rajchenbach, Leroux and Clamond2011) which are rarely seen except in a relatively narrow container. Wu et al. (Reference Wu, Keolian and Rudnick1984) conducted an experiment in a tank with a width of 2.54 cm and Rajchenbach et al. (Reference Rajchenbach, Leroux and Clamond2011) found standing solitons in a tank with a width of 1.7 mm which can be definitely sorted into Hele-Shaw cells. The latter research inspired Li, Xu & Liao (Reference Li, Xu and Liao2014) to design experiments in a Hele-Shaw cell filled with water–ethanol solution. It was discovered that three types of localized standing waves can be connected following a combination law. Then, another series of periodic wave patterns were reported in Hele-Shaw cells filled with one or two layers of liquids with different liquid depths (Li, Yu & Liao Reference Li, Yu and Liao2015; Li, Li & Liao Reference Li, Li and Liao2016, Reference Li, Li and Liao2018b ). An intriguing design of experiments in a Hele-Shaw cell was reported by Bronfort & Caps (Reference Bronfort and Caps2012) in that the interface was between foam and water. It was concluded that bubbles covering the liquid free surface can lead to extra energy loss based on a scaling analysis of the damping coefficient. Pradenas et al. (Reference Pradenas, Araya, Clerc, Falcón, Gandhi and Knobloch2017) also studied the parametric forcing waves in Hele-Shaw cells. In their study, the laboratory set-up was well arranged and an amplitude equation was derived. However, it still lacked a consistent numerical diagram in experimental results when a pure two-dimensional model was used. Although these recent laboratory tests enrich the knowledge of Faraday waves, all the literature indicates that Faraday waves in Hele-Shaw cells may have a different physical identity from ones in a wide-mouth container, and the mechanism is as yet less well understood.
In fact, computational fluid dynamics has been maturely applied to Faraday wave simulations (Ubal, Giavedoni & Saita Reference Ubal, Giavedoni and Saita2003; Périnet, Juric & Tuckerman Reference Périnet, Juric and Tuckerman2009; Périnet et al. Reference Périnet, Falcon, Chergui and Juric2016). However, even though some numerical wave profiles were similar to experimental observations in Hele-Shaw cells, the numerical set-up did not consider dissipation from the internal walls, which cannot illustrate the real nature. Moreover, three-dimensional simulation of Faraday waves in Hele-Shaw cells is difficult because of the high computational cost (the cell size can be quite small inside the thin boundary layer) and the inaccurate numerical scheme dealing with the dynamic contact line. Li et al. (Reference Li, Li, Chen, Xie and Liao2018a ) applied a Kelvin–Helmholtz–Darcy theory proposed by Gondret & Rabaud (Reference Gondret and Rabaud1997) to obtain the gap-averaged Navier–Stokes equations and applied an open-source code (Popinet Reference Popinet2003, Reference Popinet2009) to successfully simulate Faraday waves in a Hele-Shaw cell for the first time. Although this simplified mathematical model is well validated by experiments, the surface tension term is still two-dimensional and the coefficient is empirical, because the out-of-plane interface shape (see figure 1) was not directly taken into account. Rajchenbach et al. (Reference Rajchenbach, Leroux and Clamond2011) employed a similar model to analyse the stability by potential flow theory without considering surface tension. All these treatments may lead to miscalculations. Therefore, a model for better understanding Faraday waves in Hele-Shaw cells is still missing.
Hence, we want to establish a more sophisticated model to include the capillary motion arising from the small scale of the gap size between two walls of a Hele-Shaw cell. For this purpose, we choose a molecular kinetics model (Blake Reference Blake and Berg1993; Hamraoui et al. Reference Hamraoui, Thuresson, Nylander and Yaminsky2000) to resolve the moving contact line. Note that ‘the contact angle depends on the speed and direction of movement of the contact line, an adequate description of the wetting process becomes quite complex’ (Hamraoui et al. Reference Hamraoui, Thuresson, Nylander and Yaminsky2000). Accordingly, there is no exclusive model to tackle the whole problem. Our second aim is to predict the onset threshold of the forcing acceleration by stability analysis for the free surface in Hele-Shaw cells. A preliminary calculation from Rajchenbach et al. (Reference Rajchenbach, Leroux and Clamond2011) cannot allow the evaluation of the onset instability, and the omitted surface tension is the most likely factor. Therefore, we examine the impact of the surface tension by means of the new model. As shown below, the out-of-plane interface shape makes a large contribution to impeding the initial instability in Hele-Shaw cells, and the prediction by our model is the closest to experimental measurements. According to the discrepancy between theory and experiment, the validity of the dispersion relation considering forcing and damping is also discussed. The last aim of this paper is to reveal the real reason for the hysteresis of the initial instability which was found both in Rajchenbach et al. (Reference Rajchenbach, Leroux and Clamond2011) and in our experiments. Since the detuning, which was suggested as the reason for hysteresis by Rajchenbach & Clamond (Reference Rajchenbach and Clamond2015), cannot make up the large difference between the upper and lower branches of the instability threshold, a more appropriate explanation should be given.
The paper is organized as follows. In § 2, we describe how to establish the model for Faraday waves in Hele-Shaw cells with the capillary effect included. In § 3, we briefly show how to derive the amplitude equations from our new model. Then we describe the configuration of the laboratory experiments in § 4. Finally we present the instability analysis and other theoretical discussions in § 5, in which detailed comparisons with experimental results are reported as well.
2 Mathematical model
2.1 Gap-averaged equations
Schematic diagram of a Faraday wave in a Hele-Shaw cell. Here
 $b$
denotes the gap size of the Hele-Shaw cell and
 $\unicode[STIX]{x1D703}$
is the dynamic contact angle of the liquid on the front wall.

We consider here a Hele-Shaw cell filled with a kind of liquid and which is oscillated vertically. The motion of the liquid inside the cell is governed by the Navier–Stokes equations. However, since the gap
 $b$
is rather small and the liquid is confined between two walls as shown in figure 1, we are interested only in the vertical displacement. Since there is no accurate definition of a Hele-Shaw cell, more clarification of the size of
 $b$
needs to be given. Some investigations gave the relative expression of
 $b$
geometrically (Lagrée, Staron & Popinet Reference Lagrée, Staron and Popinet2011), for instance
 $b\ll$
cell length. In previous literature (Talib, Jalikop & Juel Reference Talib, Jalikop and Juel2007; Pradenas et al.
Reference Pradenas, Araya, Clerc, Falcón, Gandhi and Knobloch2017) the gap size is in the range from 1 to 40 mm, but it really depends. According to our laboratory observation (Li et al.
Reference Li, Li, Li, Liao and Chen2019), the three-dimensional wave profile becomes obvious if the gap is beyond 6 mm when the wavelength is around 20 mm. In this case the two-dimensional assumption does not make sense. Hence, we stand by Schwartz (Reference Schwartz1986) that the gap-to-wavelength ratio is small. So far, this system can be simplified by the Kelvin–Helmholtz–Darcy theory (Gondret & Rabaud Reference Gondret and Rabaud1997). Different from regular Hele-Shaw flow assuming that flow in the
 $z^{\prime }$
direction is of Poiseuille type, the main idea is averaging the Navier–Stokes equations across the gap to include consideration of the inertial term. Consequently, the two-dimensional system is
 $$\begin{eqnarray}\displaystyle & \displaystyle \unicode[STIX]{x2202}_{x^{\prime }}u+\unicode[STIX]{x2202}_{y^{\prime }}v=0, & \displaystyle\end{eqnarray}$$
 $$\begin{eqnarray}\displaystyle & \displaystyle \unicode[STIX]{x2202}_{t^{\prime }}u+\frac{6}{5}(u\unicode[STIX]{x2202}_{x^{\prime }}u+v\unicode[STIX]{x2202}_{y^{\prime }}u)=-\frac{1}{\unicode[STIX]{x1D70C}}\unicode[STIX]{x2202}_{x^{\prime }}p-\frac{12\unicode[STIX]{x1D708}}{b^{2}}u, & \displaystyle\end{eqnarray}$$
 $$\begin{eqnarray}\displaystyle & \displaystyle \unicode[STIX]{x2202}_{t^{\prime }}v+\frac{6}{5}(u\unicode[STIX]{x2202}_{x^{\prime }}v+v\unicode[STIX]{x2202}_{y^{\prime }}v)=-\frac{1}{\unicode[STIX]{x1D70C}}\unicode[STIX]{x2202}_{y^{\prime }}p-\frac{12\unicode[STIX]{x1D708}}{b^{2}}v-(g-F\cos \unicode[STIX]{x1D6FA}t^{\prime }), & \displaystyle\end{eqnarray}$$
where
 $u$
is the horizontal component of the averaged velocity and
 $v$
is its vertical counterpart. Here
 $\unicode[STIX]{x1D70C}$
,
 $p$
,
 $\unicode[STIX]{x1D708}$
and
 $g$
denote density, pressure, kinetic viscosity and gravity, respectively. The external oscillatory force is denoted by
 $F\cos \unicode[STIX]{x1D6FA}t^{\prime }$
, with
 $F$
the forcing acceleration and
 $\unicode[STIX]{x1D6FA}$
the forcing angular frequency. Rajchenbach et al. (Reference Rajchenbach, Leroux and Clamond2011) first used this model to analyse one kind of Faraday wave in a Hele-Shaw cell. If we take account of the bulk dissipation and the surface tension, it will be the gap-averaged Navier–Stokes equations (Li et al.
Reference Li, Li, Chen, Xie and Liao2018a
).
For stability analysis, there is no vortex initially in liquids with free surface at rest plus perturbation. Since (2.1)–(2.3) only describe the
 $(x^{\prime },y^{\prime })$
-plane motion and the damping term has nothing to do with shear stress, vorticity, if it occurs, does not contribute to dissipation. Given a weakly damped system due to the Darcy effect, inertia obviously dominates the flow. This assumption can be verified by laboratory measurements from the later analysis of the dispersion relation. Figure 7 in § 5.2 will demonstrate the close agreement between experimental data and the dispersion relation obtained from potential theory by Benjamin & Ursell (Reference Benjamin and Ursell1954). Hence, the approximation we use here is convincing, and it is plausible to assume that the two-dimensional average flow is vortex free under some weak dissipation. Similar treatment can be found in much literature with respect to free-surface flow (Alam, Liu & Yue Reference Alam, Liu and Yue2011; Abdolali, Kirby & Bellotti Reference Abdolali, Kirby and Bellotti2015) even for parametric forcing waves (Miles & Henderson Reference Miles and Henderson1990; Jiang et al.
Reference Jiang, Ting, Perlin and Schultz1996; Zhang & Viñals Reference Zhang and Viñals1997; Milewski et al.
Reference Milewski, Galeano-Rios, Nachbin and Bush2015; Rajchenbach & Clamond Reference Rajchenbach and Clamond2015). We may define velocity potential
 $\unicode[STIX]{x1D711}$
to simplify (2.1)–(2.3) (Rajchenbach et al.
Reference Rajchenbach, Leroux and Clamond2011; Li et al.
Reference Li, Li, Chen, Xie and Liao2018a
). With boundary conditions, we can rewrite these equations by integrating along the streamline as
 $$\begin{eqnarray}\displaystyle \unicode[STIX]{x2202}_{x^{\prime }x^{\prime }}\unicode[STIX]{x1D711}+\unicode[STIX]{x2202}_{y^{\prime }y^{\prime }}\unicode[STIX]{x1D711}=0, & & \displaystyle\end{eqnarray}$$
 $$\begin{eqnarray}\displaystyle \unicode[STIX]{x2202}_{t^{\prime }}\unicode[STIX]{x1D711}+\frac{3}{5}[(\unicode[STIX]{x2202}_{x^{\prime }}\unicode[STIX]{x1D711})^{2}+(\unicode[STIX]{x2202}_{y^{\prime }}\unicode[STIX]{x1D711})^{2}] & = & \displaystyle -(g-F\cos \unicode[STIX]{x1D6FA}t^{\prime })\unicode[STIX]{x1D701}-\frac{12\unicode[STIX]{x1D708}}{b^{2}}\unicode[STIX]{x1D711}+\frac{\unicode[STIX]{x1D6FE}}{\unicode[STIX]{x1D70C}}\unicode[STIX]{x1D705},\nonumber\\ \displaystyle & & \displaystyle \text{at }y^{\prime }=\unicode[STIX]{x1D701}(x^{\prime },t^{\prime }),\end{eqnarray}$$
 $$\begin{eqnarray}\displaystyle & \displaystyle \unicode[STIX]{x2202}_{t^{\prime }}\unicode[STIX]{x1D701}+\unicode[STIX]{x2202}_{x^{\prime }}\unicode[STIX]{x1D711}\unicode[STIX]{x2202}_{x^{\prime }}\unicode[STIX]{x1D701}=\unicode[STIX]{x2202}_{y^{\prime }}\unicode[STIX]{x1D711},\quad \text{at }y^{\prime }=\unicode[STIX]{x1D701}(x^{\prime },t^{\prime }), & \displaystyle\end{eqnarray}$$
 $$\begin{eqnarray}\displaystyle & \displaystyle \unicode[STIX]{x2202}_{y^{\prime }}\unicode[STIX]{x1D711}=0,\quad \text{at }y^{\prime }=-\infty , & \displaystyle\end{eqnarray}$$
where
 $\unicode[STIX]{x1D6FE},\unicode[STIX]{x1D705}$
and
 $\unicode[STIX]{x1D701}$
are surface tension coefficient, surface curvature and wave elevation, respectively. Due to the capillary effect,
 $\unicode[STIX]{x1D701}$
represents the projection of the bottom of the concave meniscus on the
 $(x^{\prime },y^{\prime })$
plane as shown in figure 1.
2.2 Capillary term
Capillary force is highlighted for large wavenumber. However, the small gap of Hele-Shaw cells will also make free surface tension more important than ever. Thus the curvature can be divided into two parts: (Saffman & Taylor Reference Saffman and Taylor1958; Chouke, van Meurs & van der Poel Reference Chouke, van Meurs and van der Poel1959)
 $$\begin{eqnarray}\displaystyle \unicode[STIX]{x1D705}=\unicode[STIX]{x2202}_{x^{\prime }}\left[\frac{\unicode[STIX]{x2202}_{x^{\prime }}\unicode[STIX]{x1D701}}{\sqrt{1+(\unicode[STIX]{x2202}_{x^{\prime }}\unicode[STIX]{x1D701})^{2}}}\right]+\frac{2}{b}\cos \unicode[STIX]{x1D703}, & & \displaystyle\end{eqnarray}$$
where the first term indicates the principal radii of curvature of the wave profile
 $\unicode[STIX]{x1D701}$
and the second term represents the out-of-plane curvature of the meniscus which can also contribute to the surface tension force (see figure 1). For regular Hele-Shaw flow, when multi-phase flow occurs, the out-of-plane interface shape is always assumed to be semicircular and the contact angle
 $\unicode[STIX]{x1D703}$
is naturally
 $180^{\circ }$
(Saffman & Taylor Reference Saffman and Taylor1958; McLean & Saffman Reference McLean and Saffman1981; Park & Homsy Reference Park and Homsy1984; Afkhami & Renardy Reference Afkhami and Renardy2013). Nevertheless, this assumption is not appropriate for Faraday waves in Hele-Shaw cells. From laboratory observation, liquid in Hele-Shaw cells will endure an up-and-down driving force, and
 $\unicode[STIX]{x1D703}$
will constantly change. Jiang, Perlin & Schultz (Reference Jiang, Perlin and Schultz2004) also conducted a series of experiments and found that the frequency of the oscillating free surface in the vicinity of the solid has a significant relevance to the contact line. This feature gives rise to the dynamic contact angle approximation.
We employ a validated model (Hamraoui et al. Reference Hamraoui, Thuresson, Nylander and Yaminsky2000) to evaluate the cosine of the dynamic contact angle as
 $$\begin{eqnarray}\displaystyle \cos \unicode[STIX]{x1D703}=1-\frac{\unicode[STIX]{x1D6FD}}{\unicode[STIX]{x1D707}}Ca, & & \displaystyle\end{eqnarray}$$
where the capillary number
 $Ca=\unicode[STIX]{x1D707}v/\unicode[STIX]{x1D6FE}$
, with
 $\unicode[STIX]{x1D707}$
the dynamic viscosity of the liquid. The friction coefficient
 $\unicode[STIX]{x1D6FD}$
comes from a molecular kinetics theory (Blake Reference Blake and Berg1993, Reference Blake2006). From (2.9), it is obvious that
 $\unicode[STIX]{x1D6FD}$
has the same units as dynamic viscosity
 $\unicode[STIX]{x1D707}$
. It only relies on the nature of the liquid–solid interaction, but the mechanism of the dissipation at the contact line is not yet understood (Johansson & Hess Reference Johansson and Hess2018). Hence, it is actually a phenomenological parameter that defines the energy dissipation rate per unit length of the contact line. This coefficient comes from the idea of a friction force at the wetting line by Voinov (Reference Voinov1976), who pointed out that the determination of this force falls outside the scope of hydrodynamics. However, it does not hinder the utilization, and the final equations become
 $$\begin{eqnarray}\displaystyle \unicode[STIX]{x2202}_{x^{\prime }x^{\prime }}\unicode[STIX]{x1D711}+\unicode[STIX]{x2202}_{y^{\prime }y^{\prime }}\unicode[STIX]{x1D711}=0, & & \displaystyle\end{eqnarray}$$
 $$\begin{eqnarray}\displaystyle \unicode[STIX]{x2202}_{t^{\prime }}\unicode[STIX]{x1D711}+\frac{3}{5}[(\unicode[STIX]{x2202}_{x^{\prime }}\unicode[STIX]{x1D711})^{2}+(\unicode[STIX]{x2202}_{y^{\prime }}\unicode[STIX]{x1D711})^{2}] & = & \displaystyle -(g-F\cos \unicode[STIX]{x1D6FA}t^{\prime })\unicode[STIX]{x1D701}-\frac{12\unicode[STIX]{x1D708}}{b^{2}}\unicode[STIX]{x1D711}+\frac{\unicode[STIX]{x1D6FE}}{\unicode[STIX]{x1D70C}}\left(\unicode[STIX]{x2202}_{x^{\prime }x^{\prime }}\unicode[STIX]{x1D701}-\frac{\unicode[STIX]{x2202}_{x^{\prime }}(\unicode[STIX]{x2202}_{x^{\prime }}\unicode[STIX]{x1D701})^{3}}{2}\right)\nonumber\\ \displaystyle & & \displaystyle +\,\frac{2\unicode[STIX]{x1D6FE}}{\unicode[STIX]{x1D70C}b}-\frac{2\unicode[STIX]{x1D6FD}}{\unicode[STIX]{x1D70C}b}\unicode[STIX]{x2202}_{y^{\prime }}\unicode[STIX]{x1D711},\quad \text{at }y^{\prime }=\unicode[STIX]{x1D701}(x^{\prime },t^{\prime }),\end{eqnarray}$$
 $$\begin{eqnarray}\displaystyle & \displaystyle \unicode[STIX]{x2202}_{t^{\prime }}\unicode[STIX]{x1D701}+\unicode[STIX]{x2202}_{x^{\prime }}\unicode[STIX]{x1D711}\unicode[STIX]{x2202}_{x^{\prime }}\unicode[STIX]{x1D701}=\unicode[STIX]{x2202}_{y^{\prime }}\unicode[STIX]{x1D711},\quad \text{at }y^{\prime }=\unicode[STIX]{x1D701}(x^{\prime },t^{\prime }), & \displaystyle\end{eqnarray}$$
 $$\begin{eqnarray}\displaystyle & \displaystyle \unicode[STIX]{x2202}_{y^{\prime }}\unicode[STIX]{x1D711}=0,\quad \text{at }y^{\prime }=-\infty . & \displaystyle\end{eqnarray}$$
3 Amplitude equations
Following Tadjbakhsh & Keller (Reference Tadjbakhsh and Keller1960) and Milner (Reference Milner1991) we derive amplitude equations which in terms of regular Faraday waves were also obtained by other researchers (Zhang & Viñals Reference Zhang and Viñals1997; Rajchenbach & Clamond Reference Rajchenbach and Clamond2015). It is worth noting that the amplitude equations for Faraday waves in Hele-Shaw cells were only taken into account by Rajchenbach et al. (Reference Rajchenbach, Leroux and Clamond2011) without capillary concerns.
To non-dimensionalize equations (2.10)–(2.13), let us define
 $k^{-1}$
as the characteristic length, with
 $k$
the wavenumber, and
 $g$
as the characteristic acceleration. By introducing an expansion bookkeeping parameter
 $\unicode[STIX]{x1D716}$
, variables and parameters can be expressed in dimensionless form as follows:
 $$\begin{eqnarray}\displaystyle & \displaystyle \unicode[STIX]{x1D711}=\unicode[STIX]{x1D716}g^{1/2}k^{-(3/2)}\unicode[STIX]{x1D719}, & \displaystyle\end{eqnarray}$$
 $$\begin{eqnarray}\displaystyle & \displaystyle \unicode[STIX]{x1D701}=\unicode[STIX]{x1D716}k^{-1}\unicode[STIX]{x1D702}, & \displaystyle\end{eqnarray}$$
 $$\begin{eqnarray}\displaystyle & \displaystyle x^{\prime }=k^{-1}x, & \displaystyle\end{eqnarray}$$
 $$\begin{eqnarray}\displaystyle & \displaystyle y^{\prime }=k^{-1}y, & \displaystyle\end{eqnarray}$$
 $$\begin{eqnarray}\displaystyle & \displaystyle \frac{12\unicode[STIX]{x1D708}}{b^{2}}=\unicode[STIX]{x1D716}^{2}(gk)^{1/2}\unicode[STIX]{x1D6F4}=(gk)^{1/2}\unicode[STIX]{x1D70E}, & \displaystyle\end{eqnarray}$$
 $$\begin{eqnarray}\displaystyle & \displaystyle \frac{\unicode[STIX]{x1D6FE}}{\unicode[STIX]{x1D70C}}=gk^{-2}\unicode[STIX]{x1D6E4}, & \displaystyle\end{eqnarray}$$
 $$\begin{eqnarray}\displaystyle & \displaystyle \frac{2\unicode[STIX]{x1D6FD}}{\unicode[STIX]{x1D70C}b}=\unicode[STIX]{x1D716}^{2}g^{1/2}k^{-(1/2)}\unicode[STIX]{x1D6E4}_{1}=g^{1/2}k^{-(1/2)}\unicode[STIX]{x1D6FF}, & \displaystyle\end{eqnarray}$$
 $$\begin{eqnarray}\displaystyle & \displaystyle \frac{\unicode[STIX]{x1D6FA}}{2}=\left(gk+\frac{\unicode[STIX]{x1D6FE}}{\unicode[STIX]{x1D70C}}k^{3}\right)^{1/2}\unicode[STIX]{x1D714}=[(1+\unicode[STIX]{x1D6E4})gk]^{1/2}\unicode[STIX]{x1D714}, & \displaystyle\end{eqnarray}$$
 $$\begin{eqnarray}\displaystyle & \displaystyle t^{\prime }=[(1+\unicode[STIX]{x1D6E4})gk]^{-(1/2)}\unicode[STIX]{x1D714}^{-1}t, & \displaystyle\end{eqnarray}$$
 $$\begin{eqnarray}\displaystyle & \displaystyle F=\unicode[STIX]{x1D716}^{2}g\tilde{F}=g\unicode[STIX]{x1D6EC}. & \displaystyle\end{eqnarray}$$
According to the above definitions, it is easy to see that
 $\unicode[STIX]{x1D719}\sim O(1)$
,
 $\unicode[STIX]{x1D702}\sim O(1)$
,
 $\unicode[STIX]{x1D70E}\sim O(\unicode[STIX]{x1D716}^{2})$
,
 $\unicode[STIX]{x1D6FF}\sim O(\unicode[STIX]{x1D716}^{2})$
and
 $\unicode[STIX]{x1D6EC}\sim O(\unicode[STIX]{x1D716}^{2})$
. Multi-scale analysis (Nayfeh Reference Nayfeh1993) is used to examine the variation of variables in a long time. Hence, we have a slow time
 $T=\unicode[STIX]{x1D716}^{2}t$
, and naturally
 $\unicode[STIX]{x2202}_{t}\rightarrow \unicode[STIX]{x2202}_{t}+\unicode[STIX]{x1D716}^{2}\unicode[STIX]{x2202}_{T}$
. Since the capillary force can be seen as a pressure balance, the constant term
 $2\unicode[STIX]{x1D6FE}/(\unicode[STIX]{x1D70C}b)$
in (2.11) can be dropped for incompressible flow (similar treatment can be found in Schwartz (Reference Schwartz1986)). Now the dimensionless equations read
 $$\begin{eqnarray}\displaystyle \unicode[STIX]{x1D6FB}^{2}\unicode[STIX]{x1D719}=0, & & \displaystyle\end{eqnarray}$$
 $$\begin{eqnarray}\displaystyle & & \displaystyle (1+\unicode[STIX]{x1D6E4})^{1/2}\unicode[STIX]{x1D714}\unicode[STIX]{x2202}_{t}\unicode[STIX]{x1D719}+\unicode[STIX]{x1D702}-\unicode[STIX]{x1D6E4}\unicode[STIX]{x2202}_{xx}\unicode[STIX]{x1D702}+\unicode[STIX]{x1D716}\frac{3}{5}(\unicode[STIX]{x1D735}\unicode[STIX]{x1D719})^{2}+\unicode[STIX]{x1D716}^{2}\left[\vphantom{\frac{\unicode[STIX]{x1D6E4}}{2}}(1+\unicode[STIX]{x1D6E4})^{1/2}\unicode[STIX]{x1D714}\unicode[STIX]{x2202}_{T}\unicode[STIX]{x1D719}-\tilde{F}\cos 2t\unicode[STIX]{x1D702}\right.\nonumber\\ \displaystyle & & \displaystyle \quad +\left.\unicode[STIX]{x1D6F4}\unicode[STIX]{x1D719}+\frac{\unicode[STIX]{x1D6E4}}{2}\unicode[STIX]{x2202}_{x}(\unicode[STIX]{x2202}_{x}\unicode[STIX]{x1D702})^{3}+\unicode[STIX]{x1D6E4}_{1}\unicode[STIX]{x2202}_{y}\unicode[STIX]{x1D719}\right]=0,\quad \text{at }y=\unicode[STIX]{x1D716}\unicode[STIX]{x1D702},\end{eqnarray}$$
 $$\begin{eqnarray}\displaystyle & \displaystyle (1+\unicode[STIX]{x1D6E4})^{1/2}\unicode[STIX]{x1D714}\unicode[STIX]{x2202}_{t}\unicode[STIX]{x1D702}-\unicode[STIX]{x2202}_{y}\unicode[STIX]{x1D719}+\unicode[STIX]{x1D716}\unicode[STIX]{x2202}_{x}\unicode[STIX]{x1D719}\unicode[STIX]{x2202}_{x}\unicode[STIX]{x1D702}+\unicode[STIX]{x1D716}^{2}(1+\unicode[STIX]{x1D6E4})^{1/2}\unicode[STIX]{x1D714}\unicode[STIX]{x2202}_{T}\unicode[STIX]{x1D702}=0,\quad \text{at }y=\unicode[STIX]{x1D716}\unicode[STIX]{x1D702}, & \displaystyle\end{eqnarray}$$
 $$\begin{eqnarray}\displaystyle & \displaystyle \unicode[STIX]{x2202}_{y}\unicode[STIX]{x1D719}=0,\quad \text{at }y=-\infty . & \displaystyle\end{eqnarray}$$
Let us assume that
 $\unicode[STIX]{x1D719}$
and
 $\unicode[STIX]{x1D702}$
have limits
 $\unicode[STIX]{x1D719}_{0}$
and
 $\unicode[STIX]{x1D702}_{0}$
, and have first and second derivatives,
 $\unicode[STIX]{x1D719}_{1}$
,
 $\unicode[STIX]{x1D702}_{1}$
,
 $\unicode[STIX]{x1D719}_{2}$
and
 $\unicode[STIX]{x1D702}_{2}$
, with respect to
 $\unicode[STIX]{x1D716}$
, as
 $\unicode[STIX]{x1D716}$
tends to zero. The second order will satisfy our needs because we are going to solve (3.11)–(3.14) until the amplitude equations emerge. We shall also define
 $\unicode[STIX]{x1D714}_{0}$
the limit of response frequency
 $\unicode[STIX]{x1D714}$
when
 $\unicode[STIX]{x1D716}=0$
with the form
 $\unicode[STIX]{x1D714}=\unicode[STIX]{x1D714}_{0}+\unicode[STIX]{x1D716}^{2}\unicode[STIX]{x1D714}_{1}$
.
For each order problem, equations (3.11) and (3.14) will not change, and thus only free-surface boundary conditions are listed. The zero-order problem reads
 $$\begin{eqnarray}\displaystyle & \displaystyle (1+\unicode[STIX]{x1D6E4})^{1/2}\unicode[STIX]{x1D714}_{0}\unicode[STIX]{x2202}_{t}\unicode[STIX]{x1D719}_{0}+\unicode[STIX]{x1D702}_{0}-\unicode[STIX]{x1D6E4}\unicode[STIX]{x2202}_{xx}\unicode[STIX]{x1D702}_{0}=0|_{y=0}, & \displaystyle\end{eqnarray}$$
 $$\begin{eqnarray}\displaystyle & \displaystyle (1+\unicode[STIX]{x1D6E4})^{1/2}\unicode[STIX]{x1D714}_{0}\unicode[STIX]{x2202}_{t}\unicode[STIX]{x1D702}_{0}-\unicode[STIX]{x2202}_{y}\unicode[STIX]{x1D719}_{0}=0|_{y=0}. & \displaystyle\end{eqnarray}$$
Therefore, we have the neutral solutions
 $$\begin{eqnarray}\displaystyle & \displaystyle \unicode[STIX]{x1D719}_{0}(x,y,t,T)=\text{i}\text{e}^{y}[A(T)\text{e}^{\text{i}t}-A^{\ast }(T)\text{e}^{-\text{i}t}]\cos x, & \displaystyle\end{eqnarray}$$
 $$\begin{eqnarray}\displaystyle & \displaystyle \unicode[STIX]{x1D702}_{0}(x,t,T)=\frac{1}{(1+\unicode[STIX]{x1D6E4})^{1/2}}[A(T)\text{e}^{\text{i}t}+A^{\ast }(T)\text{e}^{-\text{i}t}]\cos x, & \displaystyle\end{eqnarray}$$
with
 $\unicode[STIX]{x1D714}_{0}=1$
and
 $A^{\ast }$
being the conjugate of
 $A$
.
To take the derivative of (3.12) and (3.13) we utilize the relation
 $$\begin{eqnarray}\displaystyle \frac{\text{d}}{\text{d}\unicode[STIX]{x1D716}}\unicode[STIX]{x1D719}(x,\unicode[STIX]{x1D716}\unicode[STIX]{x1D702},t,T,\unicode[STIX]{x1D716})=[\unicode[STIX]{x2202}_{\unicode[STIX]{x1D716}}+(\unicode[STIX]{x1D702}+\unicode[STIX]{x1D716}\unicode[STIX]{x2202}_{\unicode[STIX]{x1D716}}\unicode[STIX]{x1D702})\unicode[STIX]{x2202}_{y}]\unicode[STIX]{x1D719}. & & \displaystyle\end{eqnarray}$$
Then letting
 $\unicode[STIX]{x1D716}=0$
, we have the first-order problem
 $$\begin{eqnarray}\displaystyle & \displaystyle (1+\unicode[STIX]{x1D6E4})^{1/2}\unicode[STIX]{x2202}_{t}\unicode[STIX]{x1D719}_{1}+(1-\unicode[STIX]{x1D6E4}\unicode[STIX]{x2202}_{xx})\unicode[STIX]{x1D702}_{1}=-{\textstyle \frac{3}{5}}(\unicode[STIX]{x1D735}\unicode[STIX]{x1D719}_{0})^{2}-(1+\unicode[STIX]{x1D6E4})^{1/2}\unicode[STIX]{x1D702}_{0}\unicode[STIX]{x2202}_{t}\unicode[STIX]{x2202}_{y}\unicode[STIX]{x1D719}_{0}|_{y=0}, & \displaystyle\end{eqnarray}$$
 $$\begin{eqnarray}\displaystyle & \displaystyle (1+\unicode[STIX]{x1D6E4})^{1/2}\unicode[STIX]{x2202}_{t}\unicode[STIX]{x1D702}_{1}-\unicode[STIX]{x2202}_{y}\unicode[STIX]{x1D719}_{1}=\unicode[STIX]{x1D702}_{0}\unicode[STIX]{x2202}_{yy}\unicode[STIX]{x1D719}_{0}-\unicode[STIX]{x2202}_{x}\unicode[STIX]{x1D702}_{0}\unicode[STIX]{x2202}_{x}\unicode[STIX]{x1D719}_{0}|_{y=0}. & \displaystyle\end{eqnarray}$$
The particular solutions read
 $$\begin{eqnarray}\displaystyle & \displaystyle \unicode[STIX]{x1D719}_{1}=-\frac{11\text{i}}{20(1+\unicode[STIX]{x1D6E4})^{1/2}}A^{2}\text{e}^{2\text{i}t}+\frac{3\text{i}\unicode[STIX]{x1D6E4}}{2(2\unicode[STIX]{x1D6E4}-1)(1+\unicode[STIX]{x1D6E4})^{1/2}}A^{2}\text{e}^{2\text{i}t}\cos 2x\text{e}^{2y}+\text{c.c.},\qquad & \displaystyle\end{eqnarray}$$
 $$\begin{eqnarray}\displaystyle & \displaystyle \unicode[STIX]{x1D702}_{1}=-\frac{1}{5}|A|^{2}+\frac{1}{1+4\unicode[STIX]{x1D6E4}}|A|^{2}\cos 2x+\frac{8\unicode[STIX]{x1D6E4}-1}{2(2\unicode[STIX]{x1D6E4}-1)(1+4\unicode[STIX]{x1D6E4})}A^{2}\text{e}^{2\text{i}t}\cos 2x+\text{c.c.}\qquad & \displaystyle\end{eqnarray}$$
It is straightforward to obtain the second-order problem by differentiating (3.11)–(3.14) with respect to
 $\unicode[STIX]{x1D716}$
twice and letting
 $\unicode[STIX]{x1D716}=0$
as follows:
 $$\begin{eqnarray}\displaystyle (1+\unicode[STIX]{x1D6E4})^{1/2}\unicode[STIX]{x2202}_{t}\unicode[STIX]{x1D719}_{2}+(1-\unicode[STIX]{x1D6E4}\unicode[STIX]{x2202}_{xx})\unicode[STIX]{x1D702}_{2} & = & \displaystyle 2\tilde{F}\cos 2t\unicode[STIX]{x1D702}_{0}-2\unicode[STIX]{x1D6F4}\unicode[STIX]{x1D719}_{0}-3\unicode[STIX]{x1D6E4}(\unicode[STIX]{x2202}_{x}\unicode[STIX]{x1D702}_{0})^{2}\unicode[STIX]{x2202}_{xx}\unicode[STIX]{x1D702}_{0}\nonumber\\ \displaystyle & & \displaystyle -\,2(1+\unicode[STIX]{x1D6E4})^{1/2}\unicode[STIX]{x2202}_{T}\unicode[STIX]{x1D719}_{0}-(1+\unicode[STIX]{x1D6E4})^{1/2}\unicode[STIX]{x1D714}_{1}\unicode[STIX]{x2202}_{t}\unicode[STIX]{x1D719}_{0}\nonumber\\ \displaystyle & & \displaystyle -\,{\textstyle \frac{12}{5}}\unicode[STIX]{x2202}_{y}\unicode[STIX]{x1D719}_{0}\unicode[STIX]{x2202}_{y}\unicode[STIX]{x1D719}_{1}-2(1+\unicode[STIX]{x1D6E4})^{1/2}\unicode[STIX]{x1D702}_{1}\unicode[STIX]{x2202}_{t}\unicode[STIX]{x2202}_{y}\unicode[STIX]{x1D719}_{0}\nonumber\\ \displaystyle & & \displaystyle -\,2(1+\unicode[STIX]{x1D6E4})^{1/2}\unicode[STIX]{x1D702}_{0}\unicode[STIX]{x2202}_{t}\unicode[STIX]{x2202}_{y}\unicode[STIX]{x1D719}_{1}-{\textstyle \frac{12}{5}}\unicode[STIX]{x1D702}_{0}\unicode[STIX]{x2202}_{y}\unicode[STIX]{x1D719}_{0}\unicode[STIX]{x2202}_{yy}\unicode[STIX]{x1D719}_{0}\nonumber\\ \displaystyle & & \displaystyle -\,(1+\unicode[STIX]{x1D6E4})^{1/2}\unicode[STIX]{x1D702}_{0}^{2}\unicode[STIX]{x2202}_{t}\unicode[STIX]{x2202}_{yy}\unicode[STIX]{x1D719}_{0}-{\textstyle \frac{12}{5}}\unicode[STIX]{x2202}_{x}\unicode[STIX]{x1D719}_{0}\unicode[STIX]{x2202}_{x}\unicode[STIX]{x1D719}_{1}\nonumber\\ \displaystyle & & \displaystyle -\,{\textstyle \frac{12}{5}}\unicode[STIX]{x1D702}_{0}\unicode[STIX]{x2202}_{x}\unicode[STIX]{x1D719}_{0}\unicode[STIX]{x2202}_{x}\unicode[STIX]{x2202}_{y}\unicode[STIX]{x1D719}_{0}-2\unicode[STIX]{x1D6E4}_{1}\unicode[STIX]{x2202}_{y}\unicode[STIX]{x1D719}_{0}|_{y=0},\end{eqnarray}$$
 $$\begin{eqnarray}\displaystyle (1+\unicode[STIX]{x1D6E4})^{1/2}\unicode[STIX]{x2202}_{t}\unicode[STIX]{x1D702}_{2}-\unicode[STIX]{x2202}_{y}\unicode[STIX]{x1D719}_{2} & = & \displaystyle 2\unicode[STIX]{x1D702}_{1}\unicode[STIX]{x2202}_{yy}\unicode[STIX]{x1D719}_{0}+2\unicode[STIX]{x1D702}_{0}\unicode[STIX]{x2202}_{yy}\unicode[STIX]{x1D719}_{1}\nonumber\\ \displaystyle & & \displaystyle -\,2(1+\unicode[STIX]{x1D6E4})^{1/2}\unicode[STIX]{x2202}_{T}\unicode[STIX]{x1D702}_{0}-(1+\unicode[STIX]{x1D6E4})^{1/2}\unicode[STIX]{x1D714}_{1}\unicode[STIX]{x2202}_{t}\unicode[STIX]{x1D702}_{0}\nonumber\\ \displaystyle & & \displaystyle +\,\unicode[STIX]{x1D702}_{0}^{2}\unicode[STIX]{x2202}_{yyy}\unicode[STIX]{x1D719}_{0}-2\unicode[STIX]{x2202}_{x}\unicode[STIX]{x1D702}_{1}\unicode[STIX]{x2202}_{x}\unicode[STIX]{x1D719}_{0}\nonumber\\ \displaystyle & & \displaystyle -\,2\unicode[STIX]{x2202}_{x}\unicode[STIX]{x1D702}_{0}\unicode[STIX]{x2202}_{x}\unicode[STIX]{x1D719}_{1}-2\unicode[STIX]{x1D702}_{0}\unicode[STIX]{x2202}_{x}\unicode[STIX]{x1D702}_{0}\unicode[STIX]{x2202}_{x}\unicode[STIX]{x2202}_{y}\unicode[STIX]{x1D719}_{0}|_{y=0}.\end{eqnarray}$$
By combining (3.24) and (3.25), one equation of
 $\unicode[STIX]{x1D719}_{2}$
is afforded. Let us substitute (3.17)–(3.18) and (3.22)–(3.23) into this equation. According to the Fredholm alternative, a solvability condition appears on the right-hand side:
 $$\begin{eqnarray}\displaystyle \frac{\text{d}A}{\text{d}T}+\left[\text{i}\unicode[STIX]{x1D714}_{1}+\frac{\unicode[STIX]{x1D6F4}+\unicode[STIX]{x1D6E4}_{1}}{2(1+\unicode[STIX]{x1D6E4})^{1/2}}\right]A+\frac{\text{i}\tilde{F}}{4(1+\unicode[STIX]{x1D6E4})}A^{\ast }+\text{i}{\mathcal{N}}|A|^{2}A=0, & & \displaystyle\end{eqnarray}$$
with
 $$\begin{eqnarray}\displaystyle {\mathcal{N}}=\frac{-32-105\unicode[STIX]{x1D6E4}-438\unicode[STIX]{x1D6E4}^{2}+40\unicode[STIX]{x1D6E4}^{3}}{80(1+\unicode[STIX]{x1D6E4})^{2}(2\unicode[STIX]{x1D6E4}-1)(1+4\unicode[STIX]{x1D6E4})}. & & \displaystyle\end{eqnarray}$$
This is the final amplitude equation.
4 Experimental set-up
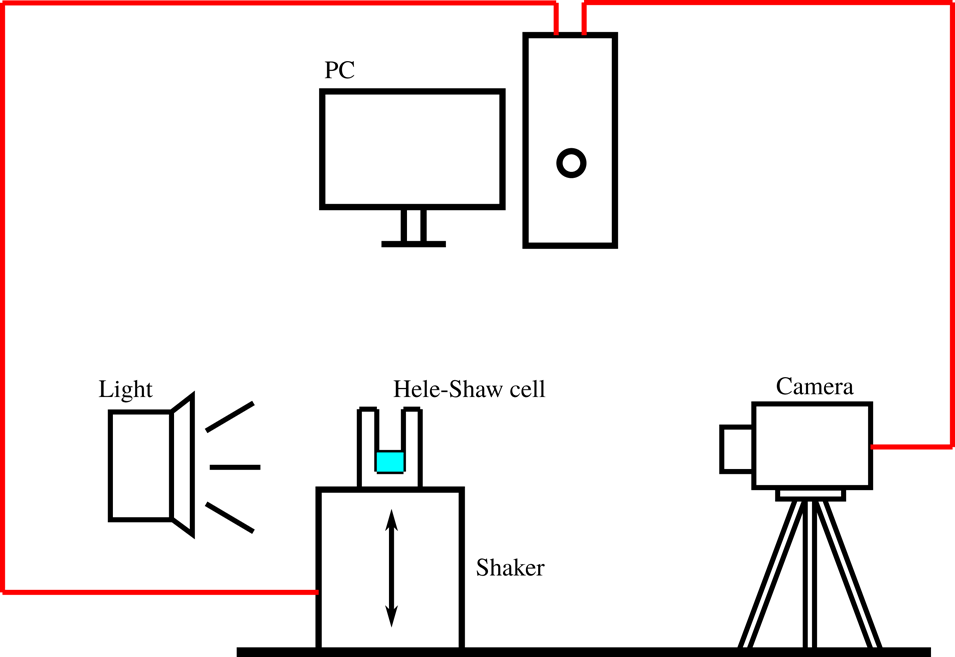
Schematic illustration of the experimental set-up.

A schematic demonstration of the experimental set-up is shown in figure 2. In our experiments, two types of Hele-Shaw cells (made of poly(methyl methacrylate)) are used. Both of them have a length of 300 mm and a height of 60 mm. However, the gap size
 $b$
is different. One is 2 mm, the other is 5 mm. Pure ethanol (
 ${>}99.7$
wt%) and a mixture of ethanol and water (
 $50$
vol%) are the working liquids for different sets of experiments. Their physical properties are given in table 1.
The parameters of liquids.

An electrodynamic vibration generator (ESS-050) is utilized to provide a peak force of 500 N and a vertical sinusoidal oscillation of acceleration
 $F\cos 2\unicode[STIX]{x03C0}ft^{\prime }$
, with
 $f$
the driving frequency, and
 $\unicode[STIX]{x1D6FA}=2\unicode[STIX]{x03C0}f$
in (2.3). The cell is fixed on it. A closed-loop control system will output signals of the driving frequency
 $f$
and the acceleration amplitude
 $F$
of the shaker. Precision is guaranteed with a waveform deviation factor
 ${<}0.3\,\%$
and a forcing frequency resolution of 0.01 %. To achieve this goal, this instrument can also adjust the signals by measuring the real-time working parameters of the motion of the shaker. We realize the visualization of the free surface for observation by a high-speed camera which is positioned perpendicular to the front wall of the cell. A maximum resolution of 1696
 $\times$
1710 pixels per snapshot at a speed of 500 frames per second can be offered by this camera. Before we conduct any experiments, we ensure that the floor is flat by using a level meter. On top of that, the shaker is very heavy (95 kg) and it is directly put on the flat floor. Given the shaker’s fundamental frequency of 8000 Hz, the torquing motion is largely prevented by the experimental frequency of less than 30 Hz. The top gap of the container is covered by a lid and sealed due to the volatilization of ethanol. An air conditioner helps us maintain the temperature at around
 $25\,^{\circ }\text{C}$
(
 $\pm 0.5\,^{\circ }\text{C}$
).
We follow the experimental procedure of Douady & Fauve (Reference Douady and Fauve1988) in that we gradually increase the amplitude of acceleration
 $F$
with the driving frequency
 $f$
fixed. For different sets of experiments, the instability threshold is different as well. Hence, we start below the instability threshold of each case and at every level of the amplitude of acceleration we expect a growth time corresponding to
 $10^{3}$
periods of the waves. When Faraday waves emerge we record
 $F$
as the onset threshold of instability from rest.
5 Results and discussions
5.1 Stability analysis
We use Lyapunov’s first method to examine the stability of the autonomous nonlinear dynamic system (3.26). Hence, finding solutions of (3.26) is the first step. We are interested in two solutions: one is the zero solution, the other is the standing wave.
Let us first consider the trivial one which represents the rest state of the free surface. To what extent of the acceleration amplitude
 $F$
cannot the rest state remain stable? The so-called onset threshold problem has been studied by many researchers through a theoretical approach (Milner Reference Milner1991; Rajchenbach et al.
Reference Rajchenbach, Leroux and Clamond2011; Rajchenbach & Clamond Reference Rajchenbach and Clamond2015). All of them gave consideration to the dissipation; if the balance between the driving acceleration and the dissipation is broken, Faraday waves emerge. According to published experimental results, the dissipation includes bulk damping and the damping at the walls of the container. This conclusion can qualitatively indicate the physical nature for a wide-mouth container. However, even in this case, the discrepancy between theory and experiment still cannot be neglected. For Hele-Shaw cells, Rajchenbach et al. (Reference Rajchenbach, Leroux and Clamond2011) tried to give some theoretical description of the initial instability but unfortunately the damping term cannot afford a much larger onset threshold. The reason is quite clear: Hele-Shaw cells are different from common wide-mouth containers. Even dissipation on the walls in the direction of the width of the cell was considered by Rajchenbach et al. (Reference Rajchenbach, Leroux and Clamond2011); both the large curvature of the wave profile and the dynamic contact line require careful attention for the free surface tension.
Note that there is another conjugate equation of (3.26). After taking the derivative with respect to
 $A$
around the zero solution, we have the linearized equations in terms of the introduced perturbation
 $\unicode[STIX]{x1D709}_{i}(i=1,2)$
as follows:
 $$\begin{eqnarray}\displaystyle & \displaystyle \frac{\text{d}\unicode[STIX]{x1D709}_{1}}{\text{d}T}=-\left[\frac{\unicode[STIX]{x1D6F4}+\unicode[STIX]{x1D6E4}_{1}}{2(1+\unicode[STIX]{x1D6E4})^{1/2}}+\text{i}\unicode[STIX]{x1D714}_{1}\right]\unicode[STIX]{x1D709}_{1}-\frac{\text{i}\tilde{F}}{4(1+\unicode[STIX]{x1D6E4})}\unicode[STIX]{x1D709}_{2}, & \displaystyle\end{eqnarray}$$
 $$\begin{eqnarray}\displaystyle & \displaystyle \frac{\text{d}\unicode[STIX]{x1D709}_{2}}{\text{d}T}=-\left[\frac{\unicode[STIX]{x1D6F4}+\unicode[STIX]{x1D6E4}_{1}}{2(1+\unicode[STIX]{x1D6E4})^{1/2}}-\text{i}\unicode[STIX]{x1D714}_{1}\right]\unicode[STIX]{x1D709}_{2}+\frac{\text{i}\tilde{F}}{4(1+\unicode[STIX]{x1D6E4})}\unicode[STIX]{x1D709}_{1}. & \displaystyle\end{eqnarray}$$
Assuming
 $\unicode[STIX]{x1D709}_{i}=\bar{\unicode[STIX]{x1D709}}_{i}\text{e}^{\unicode[STIX]{x1D706}T}$
, we have an eigenvalue equation
 $$\begin{eqnarray}\displaystyle \unicode[STIX]{x1D706}^{2}+\frac{\unicode[STIX]{x1D6F4}+\unicode[STIX]{x1D6E4}_{1}}{(1+\unicode[STIX]{x1D6E4})^{1/2}}\unicode[STIX]{x1D706}+\frac{(\unicode[STIX]{x1D6F4}+\unicode[STIX]{x1D6E4}_{1})^{2}}{4(1+\unicode[STIX]{x1D6E4})}+\unicode[STIX]{x1D714}_{1}^{2}-\frac{\tilde{F}^{2}}{16(1+\unicode[STIX]{x1D6E4})^{2}}=0. & & \displaystyle\end{eqnarray}$$
Its eigenvalue reads
 $$\begin{eqnarray}\displaystyle \unicode[STIX]{x1D706}_{\pm }=-\frac{\unicode[STIX]{x1D6F4}+\unicode[STIX]{x1D6E4}_{1}}{2(1+\unicode[STIX]{x1D6E4})^{1/2}}\pm \sqrt{\frac{\tilde{F}^{2}}{16(1+\unicode[STIX]{x1D6E4})^{2}}-\unicode[STIX]{x1D714}_{1}^{2}}. & & \displaystyle\end{eqnarray}$$
One solution is certainly negative. In order to make this state asymptotically stable,
 $\unicode[STIX]{x1D706}_{+}$
must be negative. Therefore, the corresponding forcing must satisfy
 $$\begin{eqnarray}\displaystyle |\tilde{F}|<2\sqrt{1+\unicode[STIX]{x1D6E4}}\sqrt{(\unicode[STIX]{x1D6F4}+\unicode[STIX]{x1D6E4}_{1})^{2}+4(1+\unicode[STIX]{x1D6E4})\unicode[STIX]{x1D714}_{1}^{2}}. & & \displaystyle\end{eqnarray}$$
It is obvious that different signs of
 $\tilde{F}$
represent different directions of the acceleration, which is the same for this periodically vertical excitation system. To be practical, we multiply the bookkeeping parameter
 $\unicode[STIX]{x1D716}^{2}$
to this inequality. According to (3.5), (3.7) and (3.10), the onset acceleration amplitude is
 $$\begin{eqnarray}\displaystyle \unicode[STIX]{x1D6EC}=2\sqrt{(1+\unicode[STIX]{x1D6E4})(\unicode[STIX]{x1D70E}+\unicode[STIX]{x1D6FF})^{2}+4(1+\unicode[STIX]{x1D6E4})^{2}(\unicode[STIX]{x1D714}-1)^{2}}. & & \displaystyle\end{eqnarray}$$
Comparisons of dimensionless acceleration amplitude
 $\unicode[STIX]{x1D6EC}$
between theoretical data (squares:
 $\unicode[STIX]{x1D6EC}$
given by (5.6); triangles:
 $\unicode[STIX]{x1D6EC}$
given by the conventional relation; circles:
 $\unicode[STIX]{x1D6EC}$
given by wave surface tension correction) and experimental data (asterisks) for the onset instability: (a) in cases of pure ethanol with
 $b=2~\text{mm}$
; (b) in cases of mixture of ethanol and water with
 $b=2~\text{mm}$
; (c) in cases of pure ethanol with
 $b=5~\text{mm}$
; (d) in cases of mixture of ethanol and water with
 $b=5~\text{mm}$
.

Our above result and the previous theory (Rajchenbach et al.
Reference Rajchenbach, Leroux and Clamond2011) are compared with experimental data. The experimental results of the dimensionless acceleration amplitude
 $\unicode[STIX]{x1D6EC}$
driving the initial instability are shown in figure 3 against forcing frequencies
 $f$
. We also use the averaged wavenumber so as to calculate the dimensionless parameters for each case. Hence, the theoretical and experimental results can be compared in figure 3. As mentioned before, the conventional prediction of the onset threshold of the acceleration amplitude is based on a balance between forcing and damping if we ignore the deviation between the natural frequency and the response frequency (Milner Reference Milner1991; Rajchenbach et al.
Reference Rajchenbach, Leroux and Clamond2011; Rajchenbach & Clamond Reference Rajchenbach and Clamond2015). For Hele-Shaw cells, the Poiseuille assumption only gives the dissipation
 $\unicode[STIX]{x1D70E}$
on the front and the back walls (Rajchenbach et al.
Reference Rajchenbach, Leroux and Clamond2011). It cannot evaluate a good enough threshold. We also provide data of the conventional theory with on-plane surface tension correction; the free surface tension
 $\unicode[STIX]{x1D6E4}$
due to wave profile is considered to improve the conventional theory. According to figure 3, our model proposed in § 2 gives us a much better evaluation (about three times higher), which is much closer to the experimental data than others for the initial instability of Faraday waves in Hele-Shaw cells. This is reasonable, since the out-of-plane surface tension
 $\unicode[STIX]{x1D6FF}$
indeed makes a great contribution to the stability of the rest free surface, which unfortunately was not considered in the previous theory. Besides, even though the on-plane surface tension is essential for determining the dispersion relation (as will be discussed below), in our case due to the relatively large wavenumber, it barely enhances the conventional theory. This can be explained by (5.6). Since the value of
 $\unicode[STIX]{x1D6E4}$
for our experiments falls within the range 0.08–0.4, the correction due to the wave surface tension will not surpass half of the conventional prediction. Hence, this small change cannot match the laboratory measurement. In addition, according to (5.6),
 $\unicode[STIX]{x1D6EC}$
experiences a rise as
 $f$
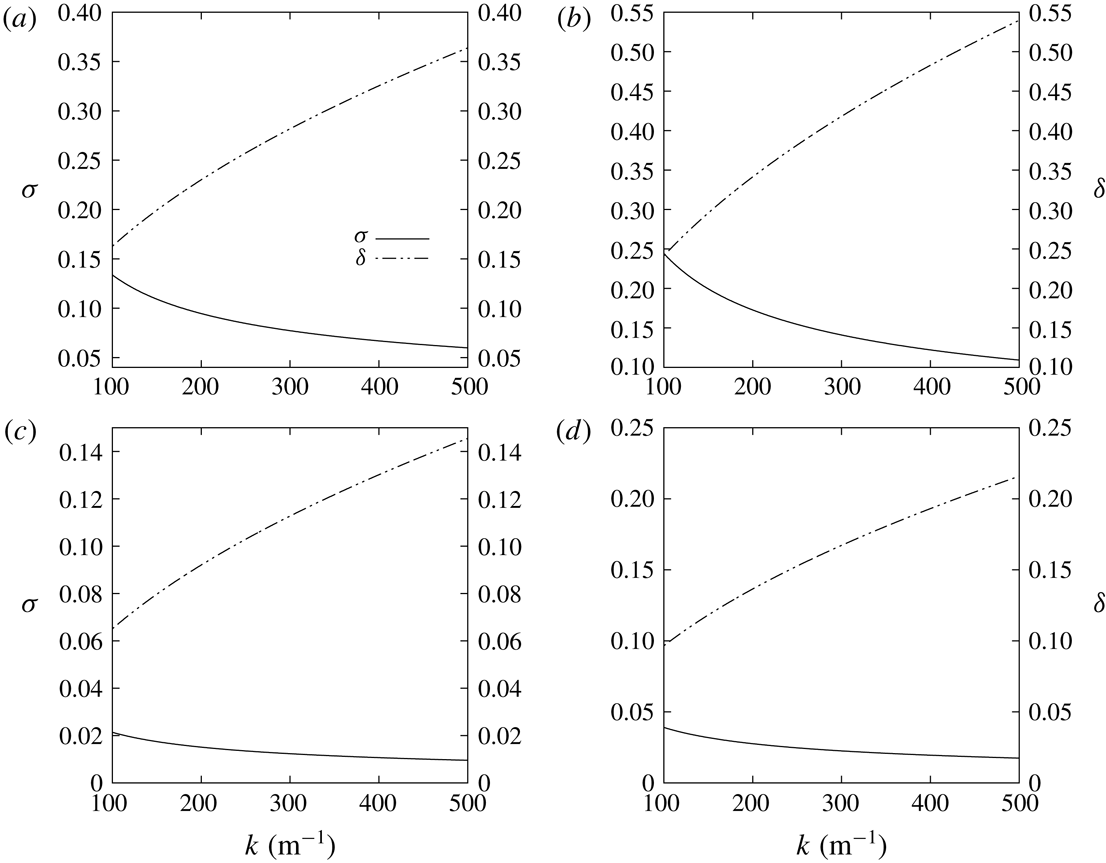
increases, which however cannot be predicted by the previous theories. In order to explain this point, we plot the curves of
 $\unicode[STIX]{x1D70E}$
and
 $\unicode[STIX]{x1D6FF}$
against wavenumber
 $k$
in figure 4. The range of wavenumber in figure 4 covers our experimental measurement. The reason for the opposite trends in figure 3 is obvious. Dimensionless damping due to the container wall sees a gradual decline while the out-of-plane capillary effect increases quickly as wavenumber increases. Hence, an increase of
 $\unicode[STIX]{x1D70E}+\unicode[STIX]{x1D6FF}$
can be expected without doubt. We can attribute the increasing tendency of
 $\unicode[STIX]{x1D6EC}$
to the dynamic contact line. Both
 $\unicode[STIX]{x1D70E}$
and
 $\unicode[STIX]{x1D6FF}$
are quite sensitive to the gap size of the Hele-Shaw cell if we look closely at figure 4(a,c) and figure 4(b,d). Expressions (3.5) and (3.7) reveal the truth. Parameters
 $\unicode[STIX]{x1D70E}$
and
 $\unicode[STIX]{x1D6FF}$
are inversely proportional to
 $b^{2}$
and
 $b$
, respectively. We may expect that
 $\unicode[STIX]{x1D70E}$
decreases faster than
 $\unicode[STIX]{x1D6FF}$
when the gap size becomes wider. Hence, if the Hele-Shaw cell has a relatively wide gap the conventional theory will lose its validity quickly. However, it also means that if the gap size is small enough,
 $\unicode[STIX]{x1D70E}$
will dominate, which is more or less against common sense that the capillary effect is more important at small scale, yet not for Hele-Shaw dissipation.
Results of
 $\unicode[STIX]{x1D70E}$
and
 $\unicode[STIX]{x1D6FF}$
against wavenumber
 $k$
: (a) in cases of pure ethanol with
 $b=2~\text{mm}$
; (b) in cases of mixture of ethanol and water with
 $b=2~\text{mm}$
; (c) in cases of pure ethanol with
 $b=5~\text{mm}$
; (d) in cases of mixture of ethanol and water with
 $b=5~\text{mm}$
.

It is unfortunate that we still cannot exactly predict the onset threshold, which can be observed in figure 3. A discrepancy is still there. We do not want to attribute this to any rational assumptions before derivations, but to the factors we do not take into account. One is the dissipation on the lateral walls of the Hele-Shaw cell in the
 $x^{\prime }$
direction. Although our container is long enough to ignore it, we cannot entirely replace an infinite length model by a practical experiment. Hence, this dissipation is part of the reason. Another factor is the bulk dissipation mostly located near the free surface, which has been verified by the simulation in figure 9 of Li et al. (Reference Li, Li, Chen, Xie and Liao2018a
). These two aspects are beyond the scope of the present work, but we will give some discussion of this in the last section. Quantitatively, Milner (Reference Milner1991) reported that his theoretical evaluation of
 $60~\text{cm}~\text{s}^{-2}$
of the threshold for the initial instability is much less than the experimental value of
 $200~\text{cm}~\text{s}^{-2}$
of Douady & Fauve (Reference Douady and Fauve1988), though he mentioned a contaminated water surface may contribute to the damping. This is for the initial instability of Faraday waves in a wide-mouth container, yet this result still demonstrates that prediction of the onset threshold for this kind of issue remains a great challenge for theoretical analysis.
The experimental measurement of
 $a$
versus
 $f/\sqrt{F/d}$
in the case of pure ethanol. Symbols: experimental data; dashed line: the fitting function
 $\log a\approx -0.58(\,f/\sqrt{F/d})+0.36$
.

The other solution of (3.26) is the standing wave. We assume its form
 $A=a\text{e}^{-\text{i}\unicode[STIX]{x1D6FC}}$
. Similar to the previous procedure of the stability analysis for the rest state, a corresponding criterion for a stable standing wave is
 $$\begin{eqnarray}\displaystyle |\tilde{F}|<2\sqrt{(1+\unicode[STIX]{x1D6E4})(\unicode[STIX]{x1D6F4}+\unicode[STIX]{x1D6E4}_{1})^{2}+4(1+\unicode[STIX]{x1D6E4})^{2}(\unicode[STIX]{x1D714}_{1}+{\mathcal{N}})^{2}}. & & \displaystyle\end{eqnarray}$$
If we let
 $\unicode[STIX]{x1D716}=1$
we may have a feasible instability threshold for standing waves, which reads
 $$\begin{eqnarray}\displaystyle \unicode[STIX]{x1D6EC}_{s}=2\sqrt{(1+\unicode[STIX]{x1D6E4})(\unicode[STIX]{x1D70E}+\unicode[STIX]{x1D6FF})^{2}+4(1+\unicode[STIX]{x1D6E4})^{2}(\unicode[STIX]{x1D714}-1+{\mathcal{N}}a^{2})^{2}}. & & \displaystyle\end{eqnarray}$$
Although in our experiment liquid depth
 $d$
is a constant, according to Li et al. (Reference Li, Li, Chen, Xie and Liao2018a
), we know that
 $a$
is a variable for different forcing acceleration, driving frequency and liquid depth. Hence, the dimensionless wave amplitude
 $a$
is parameterized for one liquid as
 $$\begin{eqnarray}\displaystyle a={\mathcal{G}}(f,F,d), & & \displaystyle\end{eqnarray}$$
which, due to two independent physical dimensions, can be written in a non-dimensional form as
 $$\begin{eqnarray}\displaystyle a=\unicode[STIX]{x1D6F1}\left(\frac{f}{\sqrt{F/d}}\right). & & \displaystyle\end{eqnarray}$$
Can (5.8) give us a sufficient prediction of the instability threshold for standing waves in Hele-Shaw cells? Let us use (5.10) to evaluate
 $a$
. Without loss of generality, we consider pure ethanol in the Hele-Shaw cell with
 $b=2~\text{mm}$
, but to examine if
 $b$
has any influence on (5.10) one needs to investigate both
 $b=2~\text{mm}$
and
 $b=5~\text{mm}$
. According to the experience of Li et al. (Reference Li, Li, Chen, Xie and Liao2018a
), the scaling law should obey a logarithmic expression. According to figure 5, the experimental data can be approximated by
 $$\begin{eqnarray}\displaystyle \log a\approx -0.58\left(\frac{f}{\sqrt{F/d}}\right)+0.36, & & \displaystyle\end{eqnarray}$$
which is totally consistent with the observation by Li et al. (Reference Li, Li, Chen, Xie and Liao2018a
). It is obvious that, for parametric forcing instability in Hele-Shaw cells,
 $a$
,
 $f$
,
 $F$
and
 $d$
can be estimated by (5.11) and the effect of gap size is trivial. There is some dispersion of the points in figure 5, which comes from the sensitivity of the experimental measurement for the onset threshold. In our experiment, if one wants to gauge the acceleration amplitude
 $F$
three times for the initial instability in the same working condition, three different values will be recorded. Different values correspond to different wave heights and wavelengths. As a result, the values will not be that concentrated around the onset instability. However, laboratory observation is much more stable for Faraday waves above the critical point (Li et al.
Reference Li, Li, Chen, Xie and Liao2018a
), and the general trend in figure 5 agrees well with the fitting line.
Defining when standing waves are unstable or turning into turbulence is difficult. In our experiments, we observe several phenomena at the critical moment. There may be some modes which are quite different from others. They are stretched much higher than other waves but can still exist for a long time. We cannot put them into ‘transient states’ (Douady & Fauve Reference Douady and Fauve1988), while, obviously, they are no longer spatially periodic. We tend to believe this state is unstable. Li et al. (Reference Li, Li, Chen, Xie and Liao2018a
) recorded the thresholds of instability for standing waves of pure ethanol in a Hele-Shaw cell with
 $b=1.7~\text{mm}$
. For different cases with
 $f=20~\text{Hz}$
,
 $\unicode[STIX]{x1D6EC}_{s}$
is around 2. Equation (5.8) is transcendent for
 $a$
versus
 $F$
. However, we can make an approximate assumption of
 $\unicode[STIX]{x1D6EC}_{s}\approx 2$
and utilize (5.11) to verify (5.8). If we let
 $f=20~\text{Hz}$
,
 $a$
can be estimated to be 0.976. Then
 $\unicode[STIX]{x1D6EC}_{s}$
is about 4, which is almost twice the value of our assumption. Note that the term
 ${\mathcal{N}}a^{2}$
has nothing to do with the out-of-plane capillary effect. A similar term can also be found in Rajchenbach & Clamond (Reference Rajchenbach and Clamond2015). Therefore, this failure is mainly because our derivation is based on a weakly nonlinear theory. For extreme waves close to instability, their finite amplitude will impede the accuracy of our theory. At this point we agree with Rajchenbach et al. (Reference Rajchenbach, Leroux and Clamond2011) in that a highly nonlinear theory is necessary to account for extreme Faraday waves in Hele-Shaw cells.
5.2 Dispersion relation
Rajchenbach & Clamond (Reference Rajchenbach and Clamond2015) revisited the dispersion relation of Faraday waves and they thought that the traditional dispersion relation only reflects the connection between wavenumber and the natural frequency without forcing and damping. Nonlinear resonance occurs when
 $\unicode[STIX]{x1D714}$
is close to
 $\unicode[STIX]{x1D714}_{0}$
. Some laboratory evidence validates this argument (Edwards & Fauve Reference Edwards and Fauve1994). Hence, the actual dispersion relation of Faraday waves was established by Rajchenbach & Clamond (Reference Rajchenbach and Clamond2015). Rajchenbach et al. (Reference Rajchenbach, Leroux and Clamond2011) and Li et al. (Reference Li, Li, Chen, Xie and Liao2018a
) modified this dispersion relation and applied it to Faraday waves in Hele-Shaw cells.
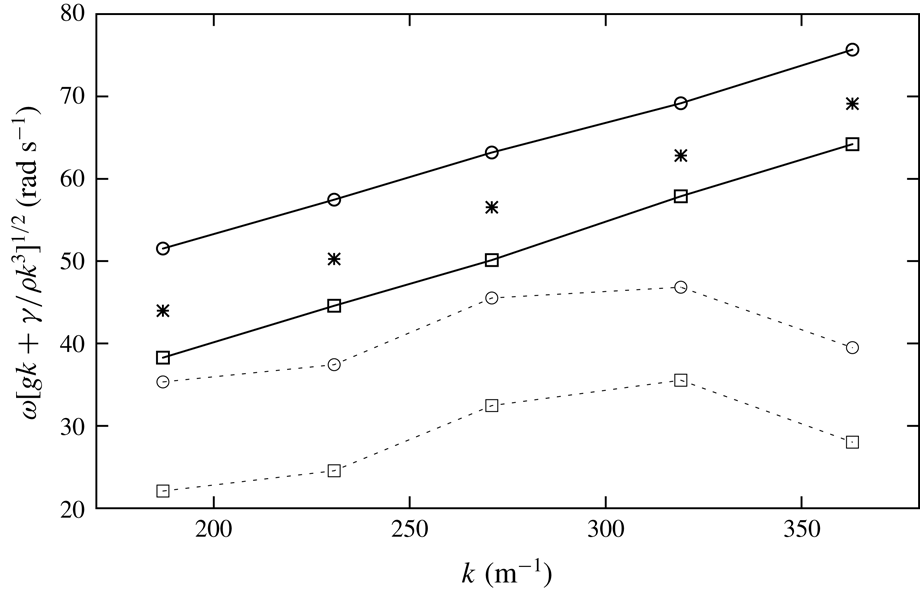
Comparison of dispersion relations in the case of pure ethanol with
 $b=2~\text{mm}$
. Dashed and dotted line: data from (5.12); solid and dotted line: data from (5.12) as
 $a\rightarrow 0$
; asterisks: experimental data; lines with circles: the upper branch; lines with squares: the lower branch.

Following Rajchenbach & Clamond (Reference Rajchenbach and Clamond2015), we directly substitute
 $A=a\text{e}^{-\text{i}\unicode[STIX]{x1D6FC}}$
into (3.26), and then setting
 $\unicode[STIX]{x1D716}=1$
we have
 $$\begin{eqnarray}\displaystyle \unicode[STIX]{x1D714}=1-{\mathcal{N}}a^{2}\pm \sqrt{\frac{\unicode[STIX]{x1D6EC}^{2}}{16(1+\unicode[STIX]{x1D6E4})^{2}}-\frac{(\unicode[STIX]{x1D70E}+\unicode[STIX]{x1D6FF})^{2}}{4(1+\unicode[STIX]{x1D6E4})}}. & & \displaystyle\end{eqnarray}$$
Combined with (3.8), equation (5.12) is the modified dispersion relation for Faraday waves in Hele-Shaw cells. Just as Rajchenbach & Clamond (Reference Rajchenbach and Clamond2015) obtained, there are two wave angular frequencies
 $\unicode[STIX]{x1D714}$
corresponding to the same wavenumber
 $k$
. We would like to see how this relation works compared with the experimental data. In figure 6, surprisingly, we find that consideration of
 ${\mathcal{N}}a^{2}$
does not make the prediction better but worse. The positive term
 ${\mathcal{N}}a^{2}$
depresses the value of
 $\unicode[STIX]{x1D714}$
quite significantly. When
 $a\rightarrow 0$
, the guess performs much better. According to figure 5, a convincing way to explain this phenomenon is that a higher nonlinear theory is needed for Faraday waves in Hele-Shaw cells with finite wave amplitudes. This result, although disappointing, is still inspiring. The idea of obtaining a new dispersion relation by Rajchenbach & Clamond (Reference Rajchenbach and Clamond2015) is totally right, but the finite wave amplitude even at the onset point for Faraday waves in Hele-Shaw cells is hard to predict. It loses its validity. If we degrade the relation letting
 $a=0$
, the dispersion relation is much closer to the experimental data. However, there is an error of about
 $10\,\%$
even with consideration of the out-of-plane surface tension. Hence, the deviation of theory will be far away from the experimental observation if no
 $\unicode[STIX]{x1D6FF}$
is added in our model.
Comparison between the dispersion term (dashed lines) and the corresponding experimental results (asterisks): (a) in cases of pure ethanol with
 $b=2~\text{mm}$
; (b) in cases of mixture of ethanol and water with
 $b=2~\text{mm}$
; (c) in cases of pure ethanol with
 $b=5~\text{mm}$
; (d) in cases of mixture of ethanol and water with
 $b=5~\text{mm}$
.

Alternatively, we do not bother to find a more accurate or theoretically correct dispersion relation, since the conventional dispersion relation without forcing and damping is so far the best fit. Although a maximum error of 5 % was reported in figure 7 of Edwards & Fauve (Reference Edwards and Fauve1994), the error is much lower in most of our laboratory tests. Figure 7 shows the comparisons. If we look at each diagram, the sign of
 $\unicode[STIX]{x1D714}-\unicode[STIX]{x1D714}_{0}$
is not the same for different liquids. It can somewhat reflect the two branches predicted by (5.12). According to Rajchenbach & Clamond (Reference Rajchenbach and Clamond2015), with the assumption
 $\unicode[STIX]{x2202}_{k}F=0$
, the first mode will emerge from rest with
 $\unicode[STIX]{x1D714}>\unicode[STIX]{x1D714}_{0}$
. However, figure 3 tells us this assumption is not appropriate for Faraday waves in Hele-Shaw cells. Hence, to assess which branch will work when resonance occurs is still complicated. We would think of it as a stochastic problem although without solid evidence yet. Note that without considering the capillary effect, there is an obvious deviation of dispersion relations from experimental results in Li et al. (Reference Li, Li, Chen, Xie and Liao2018a
). Therefore, we recommend to highlight surface tension of Faraday waves in Hele-Shaw cells.
5.3 Hysteresis
A hysteretic phenomenon was observed in our experiment. According to the experimental set-up, we gradually increase the driving acceleration
 $F$
from rest, and record
 $F_{+}$
as the threshold when instability occurs. Next, we slowly decrease
 $F$
so that the surface waves disappear when another threshold
 $F_{-}$
is also reached. Therefore, a hysteretic region
 $[F_{-},F_{+}]$
occurs, which was also reported and explained by Rajchenbach et al. (Reference Rajchenbach, Leroux and Clamond2011), who found that
 $$\begin{eqnarray}\displaystyle |\unicode[STIX]{x1D714}^{-1}-1|=\frac{(\unicode[STIX]{x1D6EC}_{+}^{2}-\unicode[STIX]{x1D6EC}_{-}^{2})^{2}}{4}, & & \displaystyle\end{eqnarray}$$
where
 $\unicode[STIX]{x1D6EC}_{+}$
and
 $\unicode[STIX]{x1D6EC}_{-}$
are the dimensionless
 $F_{+}$
and
 $F_{-}$
, respectively. This comes in handy, and if
 $\unicode[STIX]{x1D714}=\unicode[STIX]{x1D714}_{0}$
, the hysteresis region does not exist. The start point with a balance between forcing and damping is right. Indeed, in their study, without considering the capillary effect, there is a gap between the criterion
 $\unicode[STIX]{x1D6EC}>2\unicode[STIX]{x1D70E}$
to avoid imaginary numbers and the other
 $\unicode[STIX]{x1D6EC}<2\sqrt{\unicode[STIX]{x1D70E}+4(\unicode[STIX]{x1D714}-\unicode[STIX]{x1D714}_{0})^{2}}$
to circumvent positive eigenvalues. Nevertheless, the small contribution of
 $|\unicode[STIX]{x1D714}-\unicode[STIX]{x1D714}_{0}|$
cannot afford the difference between
 $\unicode[STIX]{x1D6EC}_{+}$
and
 $\unicode[STIX]{x1D6EC}_{-}$
.
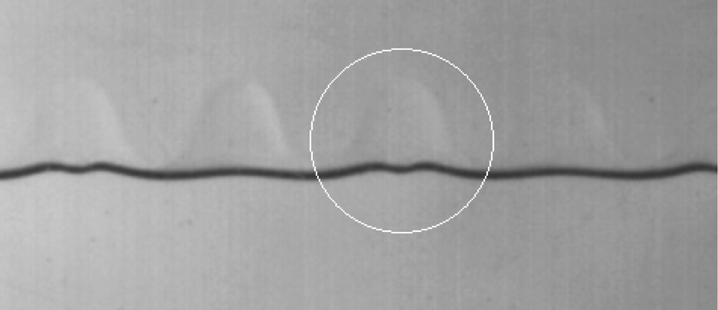
The shadow of liquid film on the front wall while the wave crest is falling.

Our model can provide a new viewpoint to this problem. As mentioned before, the wave profile surface tension works as a tiny correction, and the out-of-plane interface shape is the major factor for the onset instability of Faraday waves in Hele-Shaw cells. Hence, we go back to the friction coefficient
 $\unicode[STIX]{x1D6FD}$
. According to a personal communication with Blake, the evaluation of
 $\unicode[STIX]{x1D6FD}$
is not entirely straightforward and requires some assumptions. During this process, one needs not only the shear viscosity but also the molecular flow volume. Although it can lead to a useful degree of insight, the whole procedure may still not be perfectly correct. Hence, we directly use values employed by Hamraoui et al. (Reference Hamraoui, Thuresson, Nylander and Yaminsky2000) to avoid such a complexity. In figure 8, we show the observation during our experiments. A liquid film is yielded on the front wall of the Hele-Shaw cell, which is a wetting process. Therefore, given the definition of
 $F_{-}$
, the corresponding friction coefficient must be different from the one used in the onset situations. The exact parameter needs more accurate and refined experimental measurement considering more successful molecular kinetics theories which is far beyond the scope of hydrodynamic scales. Voué et al. (Reference Voué, Valignat, Oshanin and Cazabat1999) once used a stratified droplet model to study droplet spreading on a surface. A quite essential feature of this parameter mentioned by them was that
 $\unicode[STIX]{x1D6FD}$
for the layer of liquid directly on a solid is two times larger than that for the layer on a liquid film. A linear plot shows good agreement with experiments in their work and
 $\unicode[STIX]{x1D6FD}_{w}/\unicode[STIX]{x1D6FD}_{d}$
of 0.5 was recommended for cases of
 $\unicode[STIX]{x1D6FD}_{w}/\unicode[STIX]{x1D6FD}_{d}<1$
, where
 $\unicode[STIX]{x1D6FD}_{w}$
denotes the dimensional friction coefficient of liquid on the first layer of fluid (wet condition) and
 $\unicode[STIX]{x1D6FD}_{d}$
indicates the dimensional friction coefficient of the first layer of liquid on a solid surface (dry condition). Furthermore, as introduced by Voué et al. (Reference Voué, Valignat, Oshanin, Cazabat and De Coninck1998), lowering the friction of molecules by humidity has been widely investigated. As a qualitative discussion within the scope of hydrodynamics, it is reasonable to use half of the initial values of
 $\unicode[STIX]{x1D6FD}$
(
 $\unicode[STIX]{x1D6FD}_{d}$
) as
 $\unicode[STIX]{x1D6FD}_{w}$
to qualitatively estimate the effect of the wetting process on this problem.
Hysteresis regions of the experimental measurement (shaded area) and the theoretical rough estimation (hatching pattern): (a) in cases of pure ethanol with
 $b=2~\text{mm}$
; (b) in cases of mixture of ethanol and water with
 $b=2~\text{mm}$
; (c) in cases of pure ethanol with
 $b=5~\text{mm}$
; (d) in cases of mixture of ethanol and water with
 $b=5~\text{mm}$
.

We plot the hysteresis regions in figure 9. The shaded areas represent what we observe in the laboratory tests. The hatching patterns are the approximate evaluation by our model and letting
 $|\unicode[STIX]{x1D714}-\unicode[STIX]{x1D714}_{0}|=0$
. First we look at the experimental results. The hysteresis phenomenon is more obvious in a Hele-Shaw cell of 2 mm in width than in one of 5 mm in width no matter what the filling liquid. According to figure 7, there is no great difference between the two types of containers. Hence, again, the ‘detuning’
 $|\unicode[STIX]{x1D714}-\unicode[STIX]{x1D714}_{0}|$
is not the key reason for hysteresis. Equation (5.13) also cannot tell us why the onset forcing
 $F_{+}$
has to be larger than
 $F_{-}$
. Following the previous assumption, we define
 $\unicode[STIX]{x1D6FF}_{d}$
and
 $\unicode[STIX]{x1D6FF}_{w}$
as the dimensionless friction coefficients for dry and wet solid walls, respectively. We may obtain a relation to evaluate the hysteresis region:
 $$\begin{eqnarray}\displaystyle \frac{\unicode[STIX]{x1D6EC}_{+}^{2}-\unicode[STIX]{x1D6EC}_{-}^{2}}{4(1+\unicode[STIX]{x1D6E4})}=(2\unicode[STIX]{x1D70E}+\unicode[STIX]{x1D6FF}_{d}+\unicode[STIX]{x1D6FF}_{w})(\unicode[STIX]{x1D6FF}_{d}-\unicode[STIX]{x1D6FF}_{w}). & & \displaystyle\end{eqnarray}$$
A rough estimate is shown in figure 9 with the assumption
 $2\unicode[STIX]{x1D6FF}_{w}=\unicode[STIX]{x1D6FF}_{d}$
. Figure 9(a,b) demonstrates that the wetting effect of the liquid film can provide a relatively large hysteresis region. We argue that the same phenomenon observed by Rajchenbach et al. (Reference Rajchenbach, Leroux and Clamond2011) can be explained by this theory since the gap size of the Hele-Shaw cell is 1.7 mm which is smaller than 2 mm, and a larger region can be expected. As for figure 9(c,d), the hysteresis regions shrink and the rough evaluation also experiences the same trend, but it is overestimated. We remind readers again that
 $\unicode[STIX]{x1D6FF}_{w}$
is an approximate assumption, and determining this parameter is a quite tricky work and high-precision devices are needed to gauge some microscale physics. Another factor is that the wave amplitude in a Hele-Shaw cell with
 $b=5~\text{mm}$
is quite small at the onset point. This feature means that the liquid wetting process will be depressed. Accordingly, we may expect
 $\unicode[STIX]{x1D6FF}_{w}$
to be much larger in this situation. Thereafter,
 $\unicode[STIX]{x1D6EC}_{-}$
may be larger and the hysteresis region can be evaluated as smaller than what is shown in figure 9. If this model reveals the truth, the hysteresis for onset instability is hardly observed or the hysteresis region is quite small for a wide-mouth container, which can be easily examined by future investigations.
6 Concluding remarks
Milner (Reference Milner1991) mentioned that ‘dissipation from a moving contact line’ can be neglected for the experiments of Douady & Fauve (Reference Douady and Fauve1988). However, considering the scaling law given by Jiang et al. (Reference Jiang, Perlin and Schultz2004), the dynamic contact line cannot be ignored in analysing the parametric forcing free-surface flows in a wide-mouth container but with two-dimensional wave profiles. It consequently becomes a more essential factor for Faraday waves in Hele-Shaw cells. In this paper, we propose a new model to take into consideration the out-of-plane capillary action. With the aid of the dynamic contact line, we can explain more issues hidden by traditional theories. Multi-scale analysis is used to derive the amplitude equation for Faraday waves in Hele-Shaw cells. By using Lyapunov’s first method, we give a law to predict the acceleration amplitude when onset instability occurs. This theoretical estimate is verified by our laboratory experiments. Although there is some difference between them, our prediction is still much closer to the observation than conventional ones. Besides, the same increasing trend as forcing frequency increases can also be seen. Given other factors which may play a role in dissipation but overlooked, this result is quite convincing. We also carry out a stability analysis of standing waves. Because of the finite amplitude of the extreme scenarios, the prediction of the acceleration for instability of standing waves is overvalued by the weakly nonlinear theory. Hence, the dispersion relation with forcing and damping correction will not coincide with the experiments. Even when we let the wave amplitude be zero, the linear relation still cannot compete with the traditional one. Therefore, we suggest that the dispersion relation without damping and forcing is accurate enough to give a connection between wavenumber and resonant frequency. Hysteresis emerges in our experiments and other research. Rajchenbach & Clamond (Reference Rajchenbach and Clamond2015) gave an explanation for this phenomenon but we beg to differ. First, the ‘detuning’
 $|\unicode[STIX]{x1D714}-\unicode[STIX]{x1D714}_{0}|$
cannot afford the large hysteresis region. Second, we have no idea which acceleration is greater between
 $F_{+}$
and
 $F_{-}$
from this theory. By introducing the out-of-plane interface shape, this phenomenon can be explained as the difference of friction coefficients between the dry and the wet container walls. Some qualitative comparisons are also carried out to support this point of view.
This study has not answered all questions ahead of us, and there are several issues that need addressing in the future. If these restrictions can be improved, we would have a much better understanding of Faraday waves in Hele-Shaw cells. The first issue is the attenuation from the bulk and the lateral walls of the container. The former can be dealt with by some fully hydrodynamic approaches from the gap-averaged Navier–Stokes equations with the out-of-plane interface correction. Li et al. (Reference Li, Li, Chen, Xie and Liao2018a ) gave a hint for this application of computational fluid dynamics, but the instability analysis depending on interface capturing schemes, such as volume of fluid, may lead to numerical dispersion and capillary force balance problems. Of course, the Floquet-based analysis is an option. The prediction of initial instability should be fulfilled by this numerical, linear approach. As for the latter factor, there is no effective way to resolve this unless a fully three-dimensional numerical approach is validated. However, we have attempted to conduct some three-dimensional simulations of Navier–Stokes equations by several numerical schemes, and all our results are quite sensitive to grids and surface tension approximation, with a high computational cost. Hopefully computational fluid dynamics could tackle this problem one day, because the instability of standing waves in Hele-Shaw cells is also a difficult issue in current theoretical frameworks for their finite amplitude. The second issue is the evaluation of out-of-plane surface tension. As mentioned before, there is no exclusive model for the dynamic contact line. In addition to the molecular kinetics model, there are some other models, e.g. hydrodynamic theory and combined models (Blake Reference Blake2006). Unfortunately, no one model can predict the physics for all situations. Even for the model we employ in the present study, the measurement of the friction coefficient is still a tricky aspect. In fact this model also in turn affects the numerical approximation of surface tension. Hence, it is necessary to address this for Faraday waves in Hele-Shaw cells in the future.
Acknowledgements
We acknowledge the helpful suggestions and references given by T. D. Blake, J. Viñals and the anonymous referees. This work is partly supported by the National Natural Science Foundation of China (approval nos. 11432009 and 11702099) and the China Postdoctoral Science Foundation (approval no. 2017M612670).