Introduction
Antarctica is cherished as one of the least disturbed areas and one of the last wildernesses of our planet. However, its environmental qualities might be compromised by the increasing scale of human activities, including tourism. Since the beginning of ship-based and airborne tourism in the 1950s, the number of tourists has increased from 194 in season 1957–58 (Enzenbacher Reference Enzenbacher1993) to 36 875 in 2009–10, with an all-time high of 46 069 in season 2007–08 (IAATO 2010a). Antarctic tourism largely takes place during the summer between late October and the middle of March, spurred by the presence of more wildlife during breeding seasons, longer daylight, higher temperatures, and reduced ice coverage (Molenaar Reference Molenaar2005). Tourists come from the United States (32.4%), Germany (14.1%), the United Kingdom (10.3%), Australia (7.0%), Canada (5.6%), the Netherlands (3.9%), Japan (3.2%), Switzerland (2.8%) and other countries (20.6%) (IAATO 2010a). These tourists start with a long-haul trip to South America, New Zealand, Australia or South Africa before setting off for the final leg of 1000, 3000, 3500 and 4000 km respectively to the Antarctic proper (Wace Reference Wace1990).
Currently, more than 95% of Antarctic tourism is seaborne and originates from ports in southern Chile and Argentina, heading to the Antarctic Peninsula area (Molenaar Reference Molenaar2005). This area owes its appeal to its relative proximity to South America, its relatively benign climate, the limited presence of sea ice, a great diversity of wildlife and scenery, and the presence of numerous operational and abandoned scientific stations (Wace Reference Wace1990, Enzenbacher Reference Enzenbacher1993, Cessford & Dingwall Reference Cessford and Dingwall1994). The rapid growth of tourism activity in the Antarctic Peninsula area has raised concerns with a range of stakeholders over potential environmental impacts, safety issues and regulatory difficulties (Bastmeijer & Roura Reference Bastmeijer and Roura2004, Molenaar Reference Molenaar2005). The validity of these concerns remains disputed, partly because they have not been extensively studied. Research on Antarctic tourism may be grouped into three clusters: tourism patterns, tourism policy and management, and tourism impacts (Stewart et al. Reference Stewart, Draper and Johnston2005). Within the first cluster, research has focused on the extent of tourist visitation - numbers of tourists, frequency of arrival, length of stay, activities and routes - (Acero & Aguirre Reference Acero and Aguirre1994, Naveen et al. Reference Naveen, Forrest, Dagit, Blight, Trivelpiece and Trivelpiece2001), the demographic characteristics of tourists (Cessford & Dingwall Reference Cessford and Dingwall1994), the experiences of tourists visiting the continent (Maher et al. Reference Maher, Steel and Mcintosh2003, Powell et al. Reference Powell, Kellert and Ham2008) and historical perspectives and the evolution of tourism (Dingwall Reference Dingwall1990, Wace Reference Wace1990, Headland Reference Headland1994, Splettstoesser & Folks Reference Splettstoesser and Folks1994).
Research on tourism policy and management includes the development of guidelines, standards and tourism models (Davis Reference Davis1999, Crosbie Reference Crosbie2005), regulatory issues and challenges (Splettstoesser Reference Splettstoesser2000, Bastmeijer & Roura Reference Bastmeijer and Roura2004, Molenaar Reference Molenaar2005, Haase et al. Reference Haase, Storey, McIntosch, Carr and Gilbert2007, Reference Haase, Lamers and Amelung2009) and onsite management challenges (Pfeiffer et al. Reference Pfeiffer, Buesser, Mustafa and Peter2007).
Finally, research on the impacts of tourism includes the assessment of the environmental impacts of tourism in general (Hofman & Jatko Reference Hofman and Jatko2000), the impacts on physical systems and cultural heritage of the continent (Hughes Reference Hughes1992, Kirby et al. Reference Kirby, Stewart and Steel2001, Tejedo et al. Reference Tejedo, Justel, Benayas, Rico, Convey and Quesada2009), on local air pollution from anthropogenic sources (Shirsat & Graf Reference Shirsat and Graf2009), on the economy (White Reference White1994) and on the local biota - e.g. changes in populations, stress conditions and invasions (Codling Reference Codling1982, Wace Reference Wace1990, Acero & Aguirre Reference Acero and Aguirre1994, Pfeiffer & Peter Reference Pfeiffer and Peter2004, Frenot et al. Reference Frenot, Chown, Whinam, Selkirk, Convey, Skotnicki and Bergstrom2005, de Villiers Reference de Villiers2008). These concerns are motivated by the fact that the Antarctic contains unique marine and terrestrial ecosystems with at least 60% of all terrestrial and 70% of all marine species endemic to the region (Hall & McArthur Reference Hall and McArthur1993).
Considerable controversy exists over the local impacts of ship-based tourism on the Antarctic environment. Actually, little conclusive empirical evidence exists of a significant negative effect of tourism on the ecology of Antarctica (Hofman & Jatko Reference Hofman and Jatko2000, Stewart et al. Reference Stewart, Draper and Johnston2005). Adding to the controversy are the signs that the impacts of scientific research (constructing and operating stations and undertaking scientific work) may be much higher than those of local tourism activities (Pfeiffer & Peter Reference Pfeiffer and Peter2004). However, next to these local activities, Antarctic tourism also entails transport to the gateway ports in the Southern Hemisphere, long-distance shipping, and ship-to-shore transport. The impacts of these transport components have been generally ignored (Bastmeijer & Roura Reference Bastmeijer and Roura2004). As a result, there is a lack of data for the global impacts of Antarctic tourism in terms of energy consumption and carbon dioxide emissions. Shirsat & Graf (Reference Shirsat and Graf2009) estimated total greenhouse gas emissions from all anthropogenic sources in Antarctica to be 208 kilotonnes of CO2 for the season 2004–05, but no details are given on the emissions of tourism. The only dedicated paper on emissions from Antarctic tourism is by Amelung & Lamers (Reference Amelung and Lamers2007), who estimated emissions of around 15 tonnes of CO2 equivalents per passenger (flight and cruise to Antarctica). Based on these findings, the World Tourism Organisation (UNWTO-UNEP-WMO 2008) suggests that a fly-cruise to Antarctica may entail emissions 1000 times larger than those of a domestic cycling holiday.
The large per capita emissions are in contrast with the self-proclaimed role of ambassadorship that the tourism industry plays in Antarctica (Amelung & Lamers Reference Amelung and Lamers2007) and with the self-image of cruise passengers (Eijgelaar et al. Reference Eijgelaar, Thaper and Peeters2010). As a result, the topic is highly controversial. Trying to stay away as much as possible from normative discussions, this paper makes a contribution towards the review of Antarctic tourism policy and raises awareness about the carbon footprint of Antarctic travel by providing the best possible estimate of emissions, based on the latest methodologies and data.
This paper improves on the analysis by Amelung & Lamers (Reference Amelung and Lamers2007) in two major ways. First, newly available characteristics of the actual Antarctic vessel fleet are used, replacing data representing the world shipping fleet as a whole. Secondly, the analysis benefits from the major improvements in the calculation methods for the aviation sector that have become available in the past year.
Thus, the goal of this research is to quantify the global environmental impact of Antarctic tourism in terms of CO2 emissions of the entire Antarctic vessel fleet and per passenger (both per trip and per day), taking into account the emissions from energy consumption of aviation and shipping.
Methodology
The bulk of tourism in Antarctica takes place on ships which unite all three traditional components of tourism: transport, accommodation, and activities (Amelung & Lamers Reference Amelung and Lamers2007). Ship-based tourism accounts for 99.2% of the market in the season of 2008–09, with land-based tourism and over-flights making up the remaining 0.8% (IAATO 2009b). Nearly all Antarctic tourists (around 97%) pass through the gateway city of Ushuaia in Argentina (IAATO 2009b), most of them heading for the Antarctic Peninsula. The great majority of Antarctic tour operators are members of the International Association of Antarctica Tour Operators, IAATO (Haase et al. Reference Haase, Storey, McIntosch, Carr and Gilbert2007, Tin et al. Reference Tin, Fleming, Hughes, Ainley, Convey, Moreno, Pfeiffer, Scott and Snape2009). The non-IAATO Antarctic tourism sector is now limited to a number of small yachts and other small organizers of Polar expeditions (Haase et al. Reference Haase, Lamers and Amelung2009).
In light of these facts, the scope of this study is limited to ship-based tourism, operating from/through the Argentinean city of Ushuaia, and to tourists reported by IAATO. Not included in the analysis are independent expeditions, as defined by Murray & Jabour (Reference Murray and Jabour2004), and emissions from the relocation of ships, crew and staff to and from Antarctica at the start and the end of the season.
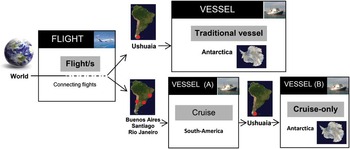
The analysis is divided into two stages: the flight from the country of origin to the gateway city (flight stage); and the actual cruise (vessel stage) (Fig. 1). The next sections describe each stage in detail. Calculations are based on data for the Antarctic season 2008–09.
Diagram of the stages of Antarctic tourism. Reproductions not to scale.

A bottom-up approach has been followed, which starts from the emission properties of aircraft and ships and arrives at macro-scale results through aggregation. Results are reported in terms of tonnes (t) of CO2. Non-CO2 effects on the climate system, such as contrails in the case of aviation, have not been considered. While these may be highly significant (perhaps tripling or quadrupling the contribution of aviation to radiative forcing with respect to CO2 only), they are also highly uncertain (see e.g. Frömming et al. Reference Frömming, Ponater, Burkhardt, Stenke, Pechtl and Sausen2010). In addition, the technique of accounting for non-CO2 emissions by using a multiplier, as applied by Amelung & Lamers (Reference Amelung and Lamers2007), has been advised against for application to individual flights (Lee et al. Reference Lee, Fahey, Forster, Newton, Wit, Lim, Owen and Sausen2009). Therefore, in this paper only CO2 emissions are calculated.
Carbon dioxide emissions from the vessel stage
Ships represent the world's most polluting combustion sources per unit of fuel Consumed (Corbett & Fischbeck Reference Corbett and Fischbeck1997). In the Antarctic context, three types of ships are used for tourism: i) traditional vessels, i.e. ships that include landings in the Antarctic territory, ii) cruise-only trips, i.e. vessels that are not allowed to conduct landings in Antarctica because of their size, and iii) yachts (Table I). Yachts have been excluded from this study, because no data were available on them. Ignoring yachts is unproblematic, as they only carry a minute proportion of Antarctic tourists (< 1%). For the other two ship categories, local information regarding the operating ship fleet, and number of trips has been obtained from IAATO (2009a) and the Tierra de Fuego Tourism Office (Instituto Fueguino de Turismo http://www.tierradelfuego.org.ar/v4/_eng/index.php?seccion=5&sub=3), accessed July 2009.
Ship-borne tourism in the Antarctic tourism season 2008–09, based on IAATO (2009b).

1IAATO and ATS rule is that only ships below 500 passengers are allowed to land tourists. Therefore, although some ships have a capacity over 500 passengers, they are considered traditional vessels because they do not transport more than 500 passengers and, therefore, they are able to land tourists.
2In reality, there are many more yachts but these are the reported ones by IAATO.
Whereas traditional vessels depart from Ushuaia to reach the Antarctic, cruise-only ships have their origin and destination in bigger ports, such as Buenos Aires, Santiago de Chile and Rio de Janeiro. From these ports, they make cruise voyages along the coasts of South America, passing Cape Horn, which, according to the operators’ brochures, can take 16–20 days. Around 6–7 days in this period are typically spent in Antarctic waters, departing from and/or returning to Ushuaia (Fig. 1). Only the emissions of the Antarctic part of cruise voyage (vessel stage B) are considered within the scope of this research.
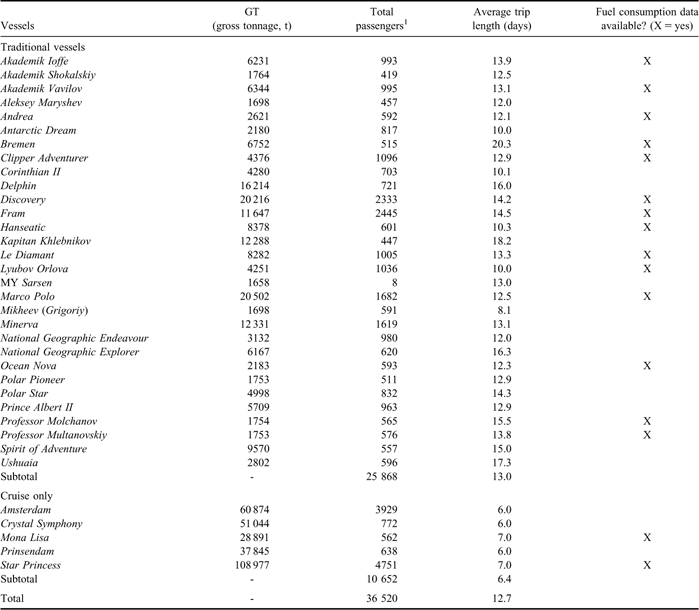
The duration of all individual trips made by all individual ships in the 2008–09 season is documented by IAATO (2009a). Complete technical specifications were available for 16 out of 36 Antarctic vessels, obtained from Brogren (Reference Brogren2010a, Reference Brogren2010b), the Lloyd's Register of Shipping and several specialized magazines (e.g. Cruise & Ferry Info, The Motor Ship, and The Naval Architect), which included (among other specifications): maximum fuel use, gross tonnage, dimensions, capacity, total engine output, engine type, service speed and age.
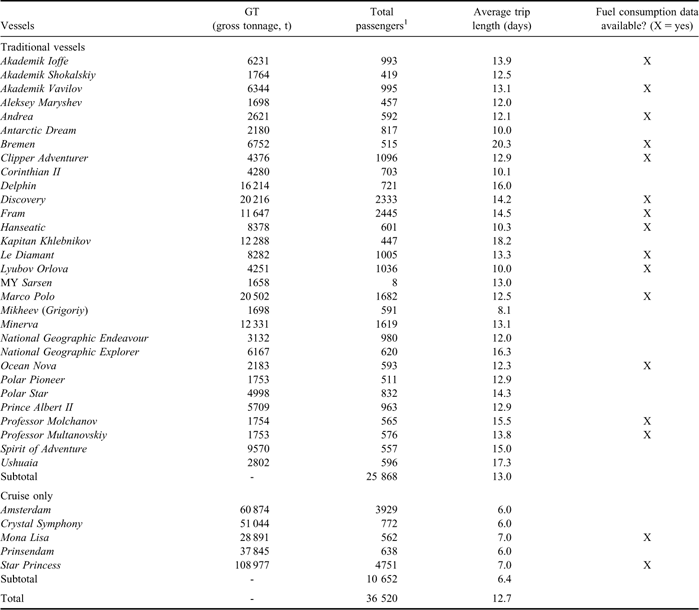
Data on the other vessels have been collected from several sources such as websites dedicated to shipping and cruising, but the information available lacked detail (i.e. maximum fuel use). Table II shows the list of vessels included in the analysis, with their gross tonnage, total passengers and average trip length.
Main characteristics of the vessel fleet travelling to Antarctica, season 2008–09.
1IAATO. 2008–09 Nationalities of seaborne, airbone and land-based tourists. Landed and cruise-only passengers.
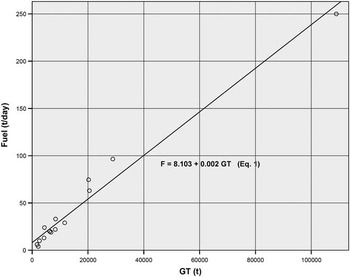
Table II also shows for which vessels (16 in total) data on fuel consumption are available. For these 16 vessels, the following regression model for fuel use at maximum power has been developed (Fig. 2), as a function of gross tonnage, which is the main determining factor of fuel consumption (Hickman et al. Reference Hickman, Hassel, Joumard, Samaras and Sorenson1999):

where F is fuel use at maximum power, in t/day, and GT is gross tonnage, in t. The model is statistically significant and has a very high determination coefficient (r 2 = 0.974). It is based on information about 16 out of the 36 vessels of the Antarctic fleet, a sample size that is deemed large enough to consider the model representative of the entire fleet. Thus, Eq. (1) is used to estimate fuel use at maximum power for all ships in the fleet, based on their gross tonnage. This paper uses a model based on a sample of the actual Antarctic tourism fleet (Eq. (1)), which makes it superior to the regression model that was proposed by Amelung & Lamers (Reference Amelung and Lamers2007) based on Hickman et al. (Reference Hickman, Hassel, Joumard, Samaras and Sorenson1999).
Scatter plot representing the ships with available fuel consumption data. The linear regression model presents the best adjustment to data. The variables of the equation are fuel consumption at maximum power (F) and gross tonnage (GT).

Fuel consumption depends on the ‘mode’ in which a ship is operating. For instance, in ‘hotelling’ mode - when a ship is in a stationary state in a port or lies at anchor - much less fuel is used than in cruise mode (Amelung & Lamers Reference Amelung and Lamers2007). It is assumed that ships operating in their cruise and hotelling modes respectively use 80% and 32% of the amount of fuel used at maximum power. These ratios are based on calculations by Hickman et al. (Reference Hickman, Hassel, Joumard, Samaras and Sorenson1999) but have to be considered with caution in the Antarctic context. They probably underestimate fuel consumption in Antarctica because of greater heating requirements (Amelung & Lamers Reference Amelung and Lamers2007). These authors used:

where F is fuel use at maximum power, in t/day, and GT is gross tonnage, in t. Equation (2) was based on fuel consumption and gross tonnage data from 83 passenger ships of any kind, with unknown relevance for Antarctic tourism. The two models (Eqs (1) & (2)) have virtually identical slopes (linking fuel use to tonnage), but their constants are different: the constant in the model by Hickman et al. (Reference Hickman, Hassel, Joumard, Samaras and Sorenson1999) is more than twice the constant in the model proposed here. This implies that the difference in results between the two models is relatively large for small ships, and relatively small for very large ships.
The relative share of time that is spent in cruising and hotelling mode is calculated separately for expedition cruises and cruise-only operations. The amount of time a ship operates in cruising mode is estimated by dividing total trip distance by the ship's cruise speed. Itinerary data and expert accounts indicate an average distance of 2000 and 1300 miles for expedition cruises and cruise-only operations, respectively, and an average speed of 9 and 12 knots for expedition cruises and cruise-only operations, respectively. The rest of the time is allocated to hotelling, related to either (un)loading passengers in ports or pausing during the trip itself. The calculations result in a similar amount of time spent in cruising mode for expedition cruises and cruise-only vessels, estimated at 71 and 70%: the rest of the time is spent in hotelling mode.
The conversion from fuel consumption to emission estimates follows the methodology suggested by Hickman et al. (Reference Hickman, Hassel, Joumard, Samaras and Sorenson1999), which proposes emission factors (kg/tonne of fuel) depending on the engine type. Results are presented on the total amount of CO2 emissions, emissions per passenger-trip, and emissions per passenger-day.
Carbon dioxide emissions from the flight stage
This study takes into consideration that taking an Antarctic holiday entails not only being aboard a ship for a certain period, but also travelling from home to the place where that ship is boarded. Given the large distances between the ports in southern South America and the main tourist markets, the large majority of tourists arrive by airplane. Carbon dioxide emissions from these flights are calculated by means of the Carbon Emission Calculator provided by the International Civil Aviation Organization, ICAO (http://www2.icao.int/en/carbonoffset/Pages/default.aspx, accessed March 2010.). This calculator uses the best publicly available data regarding fuel consumption and employs a distance-based approach to estimate an individual passenger's emissions. It uses a database of scheduled flights and the types of aircraft used to perform these flights, including flight connections. Based on the great circle distance (i.e. the shortest distance between any two points on the planet's surface) between the airports, the system calculates the average fuel consumption for the journey. This fuel consumption is divided between passengers and cargo, based on passenger load factors and passenger-to-cargo ratios. Total fuel consumption by passengers is subsequently divided by the total number of economy class equivalent passengers, giving an average fuel burn per economy class passenger. The result is multiplied by a conversion factor of 3.157 (the ratio between the amount of CO2 released and the amount of fuel combusted), yielding the amount of CO2 emissions attributed to each passenger.
Passenger nationalities for all the cruises departing from Ushuaia during the season 2008–09 are available from IAATO (http://www.iaato.org/tourism_stats.html, accessed March 2010). Following Amelung & Lamers (Reference Amelung and Lamers2007), it is supposed that all passengers depart from the largest airport in their respective home countries.
For traditional vessels, it is assumed that all passengers make a round-trip from there to Ushuaia by airplane; the use of alternative and complementary means of transport is ignored. Chilean and Argentinean passengers take direct flights to Ushuaia, from Santiago de Chile and Buenos Aires respectively due to availability of flights. Passengers from other nations change flights at the airport of Buenos Aires (international code: EZE). Therefore, the flight stage can be divided into two phases: from the country of origin to Buenos Aires (which may entail some connecting flights depending on the route), and from there to Ushuaia (Fig. 1).
For cruise-only trips, it is assumed that all passengers fly from their country of origin to one of the big South American gateway cities for cruises (Buenos Aires, Santiago de Chile and Rio de Janeiro) and back from another one, based on the information provided by the cruise operators.
For the cruise-only trips, not all flight-related emissions are allocated to Antarctic tourism since visiting Antarctica represents only one part of the voyage cruise around South America. Therefore, only a fraction of the flight emissions is considered, namely the proportion of time spent in Antarctica in relation to the length of the cruise (6–7 days out of 16–20 days, depending on the cruise).
Limitations
A main methodological limitation of this work is that the regression model used for the estimation of vessel fuel consumption (Eq. (1)) assumes that the set of Antarctic vessels is homogeneous,and can be adequately represented by one regression model. The validity of this assumption is uncertain in the case of the Antarctic fleet, given the large variety in vessel sizes (e.g. vessel capacity ranging from 15 passengers on MY Sarsen to 2600 on Star Princess). Thus, multiple regression models should ideally have been developed, linking fuel consumption to gross tonnage in different tiers. Unfortunately, data limitations forestalled such an operation.
Another limitation would be that the estimates of the flight stage are based on a simplification of the many transportation activities that take place in order to reach Ushuaia. Consequently, calculations may underestimate actual flight stage emissions.
Results
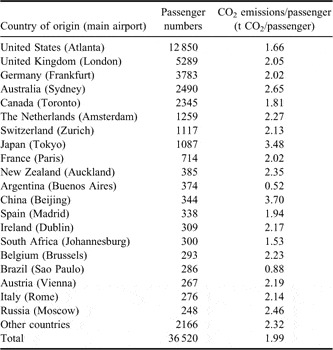
The results for the CO2 emissions associated with the flight stage, for the passengers flying to Ushuaia (traditional vessels) are shown in Table III (only the 20 countries that account for most tourists are shown for reasons of space, but all countries are included in the estimations). Much lower emissions are allocated to cruise-only passengers, since only part of the total flight emissions are attributed to the Antarctic trip, and actual distances flown are shorter since the gateway cities for cruise-only trips (Buenos Aires, Santiago de Chile, Rio de Janeiro) are closer to the main tourist markets.
Estimated CO2 flight emissions resulting from travelling to and from Ushuaia (Argentina), season 2008–09.

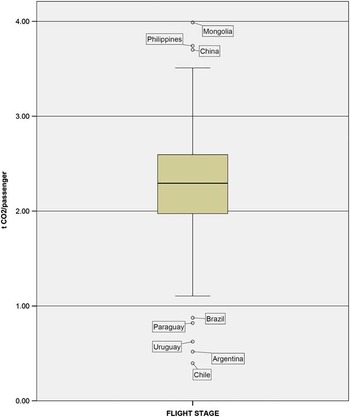
Flight emissions for passengers flying to Ushuaia and embarking on traditional vessels range from 0.40 t CO2 per Chilean passenger (direct flight from Santiago to Ushuaia) to 3.99 t CO2 for passengers departing from Mongolia (Fig. 3).
Box plot of CO2 emissions (t CO2/passenger) for the flight stage for all passengers flying to Ushuaia and embarking in traditional vessels. Season 2008–09.

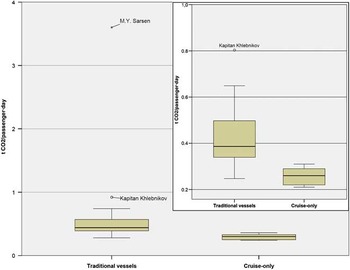
Figure 4 shows the box plot for CO2 emissions/passenger-day for the vessel stage, differentiating between traditional vessels and cruise-only ships. The median emissions are 0.37 and 0.25 t CO2/passenger·day, respectively.
Box plot of CO2 emissions (t CO2/passenger·day) for the vessel stage. An inlet is shown (upper right side) focusing on emissions between 0 and 1 tonne per passenger-day. Season 2008–09.

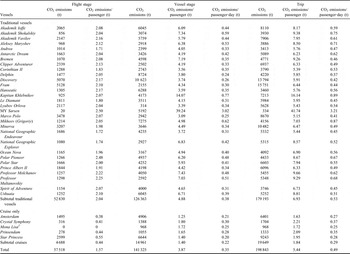
Table IV presents an overview of CO2 emissions, organized by ship. Each row details the respective ship's emissions, as well as the emissions related to the flights taken by its passengers. On average, about 70% of carbon emissions can be attributed to the vessel stage, while the remaining 30% originate from the flight stage. These ratios vary significantly between the various trips, but in all cases, the vessel stage produces more emissions than the flight stage. In absolute values, Antarctic tourism causes the emission of almost 200 000 t of CO2 in the season of 2008–09, which is equivalent to 5.44 t of CO2 per passenger and 0.49 t of CO2 per day (considering both flight and vessel stages) (Table IV).
Estimated CO2 emissions resulting from flight and vessel stages, season 2008–09.

1Mona Lisa does not entail a flight stage since it is a cruise voyage around the world which departs from Yokohama (Japan), transporting an almost exclusively Japanese clientele.
Discussion
Table IV reveals considerable variety in flight stage emissions between ships, which is directly related to differences in the composition of the ships’ passenger groups. Flight-related emissions are highest for the MY Sarsen and Polar Pioneer trips (around 2.5 t/passenger), because most of their customers come from Australia, while the emissions for the National Geographic Endeavour trips (1.72 t/passenger) are among the lowest because its passengers come mostly from the USA.
A considerably greater variety in emissions (an order of magnitude) is found for the vessel stage. This variety in emissions/ and emissions/passenger-day values can be explained by three main factors:
Ratio of gross tonnage to capacity. This ratio is a measure of a ship's efficiency in accommodating passengers. The high ratios of some vessels (e.g. MY Sarsen and Kapitan Khlebnikov) imply that large amounts of energy are used per passenger and emissions generated to satisfy their hotelling and cruising needs. An explanation for the differences is that many of the ships that are currently operating as passenger ships in the Antarctic were not built for this purpose.
Occupancy of vessels. Some vessels are fuller than others are during the season, and this clearly influences the amount of emissions per passenger. The general occupancy rate is 84%. However, some vessels have operated with an occupancy of approximately 50% (e.g. MY Sarsen, Spirit of Adventure), which inflates their emissions per passenger.
Length of the trip. The wide differences in trip length between vessels, and in particular when comparing expedition cruises and cruise-only operations (13.0 and 6.4 days/trip respectively), partly explain the differences in emissions/passenger.
The highest emissions result from vessels which run under maximum capacity and with high gross tonnage to passenger-capacity ratios, coupled with passengers coming from distant countries (e.g. China or Japan). A clear example of this is the MY Sarsen: 80% of its passengers come from Australia, it has the lowest occupation rate and the highest GT to passenger capacity ratio (138 t/passenger). Naturally, a group of passengers coming from South America and travelling in a vessel at full capacity and with low GT to capacity ratios would cause much smaller emissions.
Comparison with Amelung & Lamers
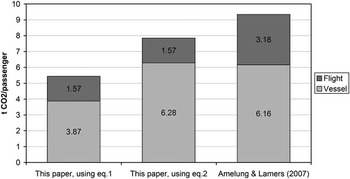
Amelung & Lamers (Reference Amelung and Lamers2007) produced the only study on emissions from Antarctic tourism that is currently available, which makes it an important point of reference. As it turns out, the results presented here differ significantly from those of Amelung & Lamers (Reference Amelung and Lamers2007), on several aspects (Fig. 5).
Emissions per passenger according to this paper (using Eq. (1) - own regression model - and Eq. (2) - previously used by Amelung & Lamers (Reference Amelung and Lamers2007)), and to the results presented by Amelung & Lamers (Reference Amelung and Lamers2007).

For the flight stage, Amelung & Lamers calculated an average of 3.18 t of CO2 per passenger, which is almost twice as high as the estimate in this paper. The ICAO methodology is a considerable improvement over the methodology applied by Amelung & Lamers (Reference Amelung and Lamers2007), as it uses scheduled flights data, adjusts fuel consumption to the aircraft types that cover each specific route, and takes into account the average occupancy of flights in order to give an emission average per passenger and route. The difference in attribution (all versus part) of flight-stage emissions to Antarctic trips adds to the divergence.
For the vessel stage, results are different as well (Fig. 5). Some of this difference can be explained by changes in the vessel fleet composition between 2004–05 (used by Amelung & Lamers) and 2008–09 (used here). However, the greatest dissimilarity results from differences in the regression model used to estimate fuel consumption (Eq. (1) vs Eq. (2)).
For the large cruise-only ships, different assumptions regarding trip length may explain why estimated emissions are only a quarter of the estimates produced by Amelung & Lamers for the vessel stage. Amelung & Lamers defined trip length as the period of time between the last call to a port where new passengers can actually board the ship before visiting the Antarctic and the first call after the visit where passengers can end their journey, even though much of the trip was spent outside of Antarctic waters. In this paper, only the days spent in Antarctic waters are counted as part of the trip, which results in a relatively short trip duration.
Expedition vs cruise-only operations
From the results in Table IV, it follows that cruise-only tourism to Antarctica would be the best option in terms of CO2 emissions per passenger. The CO2 emissions per passenger are about one quarter of those for traditional vessels (Table IV): a cruise-only passenger emits an average of 1.84 t of CO2 versus 6.93 t for a passenger on a traditional ship. About half of the disparity is due to the difference in time spent in the Antarctic. On a per passenger-day basis, average emissions are 0.53 t of CO2 for traditional trips and 0.29 t for cruise-only trips. The remaining difference is due to several factors. First of all, cruise-only ships are more efficient due to economies of scale (smaller emissions/passenger-day). Furthermore, the flight stage of cruise-only trips is not only shorter (to Rio, Buenos Aires or Santiago instead of Ushuaia) but their CO2 emissions are also only partially allocated to the trip to Antarctica.
It needs to be highlighted that emissions (or other impacts) from cruise-only trips cannot be easily compared to those from expedition cruises due to differences in activity, trip length and days spent in Antarctic territory. Nevertheless, a number of differences between these two types of operation are worth mentioning. Next to their smaller per passenger emissions, cruise-only trips seem to have a limited and indirect impact on the local, terrestrial ecosystems as no landings are permitted for ships carrying more than 500 passengers. However, cruise-only trips do present several other concerns, mostly related to safety risks. Some large cruise liners that are not ice-strengthened enter the poorly charted icy waters of Antarctica (Stewart & Draper Reference Stewart and Draper2008). This is relevant since risks related to human safety are considered among the most important ones in the Antarctic context (Molenaar Reference Molenaar2005); the presence of large ships also implies a need for improved search and rescue capabilities (Molenaar Reference Molenaar2005). Finally, large cruise ships use heavy fuel oil, which is more harmful than light marine gas oil (used by smaller expedition ships), resulting in greater environmental damage in the event of a leak.
Recent actions have been taken by the International Maritime Organization (IMO) to ban the use and carriage of heavy fuel oil for ships sailing in Antarctica, which will take effect in August 2011 (IMO 2010). This ban will significantly affect the operation of large cruise-only ships that transit around Cape Horn and briefly visit Antarctic waters (IAATO 2010b). The ban will force cruise operators to use the more expensive lighter fuels in Antarctica and make Antarctic trips far more costly than they are now, which may drive some larger cruise operators away from the Antarctic destination (IAATO 2010b).
Antarctic emissions in context and policy implications
In the greater scheme of greenhouse gas emissions, Antarctic tourism is a minor issue. The overall contribution of the Antarctic tourism industry to the climate change problem is small, certainly when compared to mass destinations like the Mediterranean or the Caribbean. Emissions from Antarctic tourism are a minute fraction (∼0.02%) of the global tourism-related emissions of CO2, which were estimated to be 5% of the total world CO2 emissions in 2005 (UNWTO-UNEP-WMO 2008). At the level of individual tourists, however, the picture is very different. The emissions caused by a single Antarctic holiday (Table IV) do not only vastly exceed the average emissions per international tourist trip (0.68 t CO2, UNWTO-UNEP-WMO 2008), but also the annual per capita emissions of the average world citizen (4.38 t CO2) (International Energy Agency http://www.iea.org/co2highlights/co2highlights.pdf, accessed June 2010). These high emissions lead some authors (e.g. Eijgelaar et al. Reference Eijgelaar, Thaper and Peeters2010) to conclude that luxurious high-energy mobility products like Antarctic tourism may need to be phased out in a low carbon future.
In earlier papers, it has been argued that the lack of reliable emissions data calls for the inclusion of greenhouse gas inventories in the environmental impact assessments required by the Protocol on Environmental Protection to the Antarctic Treaty (Amelung & Lamers Reference Amelung and Lamers2007). No major actions have been taken by the Antarctic Treaty System in this direction. Admittedly, some tour operators did voluntarily supply information on emissions (see Eijgelaar et al. (Reference Eijgelaar, Thaper and Peeters2010)), and the issue of emission inventories did appear in an Antarctic Treaty Party working paper by Norway & United Kingdom (2008). However, at the Antarctic Treaty Meeting of Experts on Climate Change held in Svolvaer, Norway in 2010, the development of such inventories was not recommended. Instead, it was recommended “that Parties be requested to acknowledge and encourage continuing efforts in developing and exchanging experience of energy efficiency and alternative energy practices so as to promote reduction of the carbon footprint of activities in Antarctica and cut fossil fuel use from stations, vessels, ground transportation and aircraft” (Norway & United Kingdom 2010, 2). In reaction to plans of IAATO to tackle this issue, the same report “welcome(s) the efforts of IAATO in working towards developing best practice towards reducing the carbon footprint of its tour ships” (Norway & United Kingdom 2010, 3). Arguably, establishing a reliable baseline through emission inventories is a key condition for assessing the performance of individual tour ships, as well as for monitoring the environmental track record of the industry as a whole. Insights on emissions may also be shared with tourists. Many operators provide their passengers with a series of on-board lectures on all kinds of aspects of Antarctica, such as the consequences of climate change for Antarctic landscapes and wildlife. An informative lecture about the passengers’ own roles in global environmental change might complement such a curriculum.
Conclusions
The global environmental impact of Antarctic tourism is a controversial issue that is being currently debated. This paper presents new estimates of energy consumption and carbon dioxide emissions of Antarctic tourism, following up on earlier attempts to quantify carbon emissions of Antarctic tourism. The calculations are based on newly available characteristics of the actual Antarctic vessel fleet and major improvements in the calculation methods for the aviation sector. An average tourist trip to Antarctica results in average emissions of 5.44 t of CO2 per passenger. Approximately 70% of these emissions are attributable to the cruising part of the trip and 30% to the flight, a finding that highlights the global environmental relevance of ‘local’ transportation within the vast destination of Antarctica. Vessel emissions are produced during the full 6–20 days of the trip, while flight-related emissions are produced within a relatively short period at the beginning and end of the trip.
Trips on traditional vessels produce more CO2 emissions per passenger than cruise-only trips: 6.93 vs 1.84 t CO2/passenger. One reason for this is that cruise-only trips are substantially shorter than trips on traditional ships, but also when looking at per passenger-day results, cruise-only trips appear to be more efficient (0.29 vs 0.53 t/passenger-day). They benefit from economies of scale and use purpose-built ships. However, cruise-only operations present their own unique challenges, in particular in terms of safety. While the risk of a large vessel being involved in an accident may not be high, any major accident would have severe implications, given the large number of passengers involved and the limited search-and-rescue capacity available in the region. Such low-probability high-impact events are cause for serious concern among the Antarctic policy makers, and no easy solutions appear to be available.
Future studies into the emissions from Antarctic tourism may focus on aspects that are not extensively treated in this study. For example, emissions related to transporting ships, crew, staff, food and other goods to the Antarctic have been neglected here, even though they may be significant. In addition, as more information becomes available on the technical properties of individual ships, more differentiated and accurate estimates of fuel use by ships may be derived. Complementary research, e.g. into the options for reducing emissions or for incorporating CO2 emissions into environmental impact assessments, would also be valuable.
The Antarctic tourism industry is slowly becoming aware of the relevance of its own carbon footprint. For several reasons, this is an issue of great and immediate strategic significance. Having environmental protection as one of its cornerstones, and boasting a strong track record of environmental performance on a local scale, the industry can do little else than to take climate change seriously. Perhaps even more importantly, pressure is mounting to strongly limit fossil energy use, as climate change is gaining relevance on political agendas around the world. As a consequence, stringent mitigation policies may endanger the competitiveness of Antarctica as a tourist destination. Reconciling energy-intensive Antarctic tourism with a lower-carbon future will require careful policies, but first it will require the identification and acknowledgement of the global environmental facts of Antarctic tourism. It is to this fact finding that this paper wishes to contribute.
Acknowledgements
The authors wish to thank Arturo Paniagua and Juan Kratzmaier for his support on the obtaining of data, the Catalan government and the European Social Fund for the scholarship enjoyed by R. Farreny; and Abertis and the Spanish Ministry for Science and Innovation for their financial support in the project ‘Valoración del impacto ambiental del turismo comercial sobre los ecosistemas antárticos’. We thank the reviewers who made valuable comments which improved the paper.