Introduction
Exposure to poor maternal nutrition during pregnancy may adversely affect fetal growth and development and lead to increased risk of non-communicable disease in adulthood, a concept embodied within the ‘Developmental Origins of Health and Disease’ (DOHaD) hypothesis. The programming of adult disease in utero has been demonstrated in epidemiological, clinical and animal models, contributing in particular not only to cardiometabolic dysfunction such as hypertension and metabolic syndrome but also affecting a range of bodily systems. Reference Barker and Thornburg1,Reference Langley-Evans2 A recent focus in developmental origins of disease has concerned the timing during gestation when poor maternal nutrition or other environmental conditions may induce adverse effects. This has identified the period around mammalian conception and early embryogenesis to be particularly vulnerable to changes in the immediate environment. Reference Fleming, Watkins and Velazquez3
The relationship between maternal nutrition and bone structure and function throughout life has been investigated, with evidence to suggest that maternal diet may influence the susceptibility of offspring to osteoporosis by altering bone mineral density accrual. Reference Jones, Riley and Dwyer4–Reference Lanham, Bertram, Cooper and Oreffo7 Moreover, poor growth during fetal life, infancy and childhood is associated with decreased bone mass in adulthood and an increased risk of fracture. Reference Cooper, Javaid, Taylor, Walker-Bone, Dennison and Arden8 In a rat model of maternal low-protein diet (LPD) nutrition during pregnancy, known to induce offspring diabetes, kidney disease and hypertension, we found a LPD also caused alterations in the osteogenic environment of postnatal offspring leading to deficiency in bone structure and strength, particularly in femoral heads and midshaft tibiae, in female offspring in old age. Reference Petry, Dorling, Pawlak, Ozanne and Hales9–Reference Lanham, Roberts, Perry, C. Cooper and Oreffo12
A focus of the current study using the rodent LPD model was to determine the origin of the bone-related disease phenotype during development in relation to deficient maternal nutrition. Our previous work has shown maternal LPD targeted exclusively to the period of preimplantation development in rats and mice with normal nutrition thereafter and postnatally (treatment known as Emb-LPD) was sufficient to induce cardiometabolic and neurological disease in adult offspring. Reference Kwong, Wild, Roberts, Willis and Fleming13–Reference Gould, Smith and Airey15 These data add weight to the periconceptional origin of disease mediated through maternal LPD. Reference Fleming, Watkins and Velazquez3 Recently, we substantiated this association and demonstrated that paternally administered LPD during mouse spermatogenesis was also sufficient to modulate fetal growth, bone development and mineral density distribution. Reference Watkins, Sirovica, Stokes, Isaacs, Addison and Martin16
We hypothesise that poor maternal nutrition around the time of conception may adversely affect bone growth and resulting density. Here, we report the influence of maternal Emb-LPD or sustained LPD at two time points during fetal development to evaluate sex-specific effects on bone growth and quality.
Methods and materials
Animal care, treatments and experimental design
All animal experimentation was performed under license from the UK Home Office in accordance with regulations and with local ethics committee approval. MF1 mice were bred in-house within the University of Southampton Biomedical Research Facility and kept on a 0700–1900 h light cycle at a temperature of 20–22 °C, with water and diet provided ad libitum. Virgin female MF1 mice (7–8.5 weeks) previously maintained on standard laboratory chow (Special Diet Services) were housed singly overnight with MF1 males. The presence of a vaginal plug the following morning indicated successful mating. Plug positive females were housed singly and allocated randomly to one of three isocaloric diet regimes (supplied by Special Dietary Services Ltd, UK) whose full composition have been published previously. Reference Watkins, Ursell and Panton14,Reference Watkins, Lucas, Wilkins, Cagampang and Fleming17 These comprised: (i) normal protein diet (NPD; 18% casein) maintained throughout gestation; (ii) LPD (9% casein) maintained throughout gestation; or (iii) LPD maintained only for the preimplantation period up to Embryonic day E3.5 before switching to NPD for the remainder of gestation (Emb-LPD). Dams were culled at either Embryonic day E14.5 or Embryonic day E17.5 and fetuses, placentae, yolk sacs and viscera weighed and stored at −80 °C for further analyses. For 3D computed tomography and histological studies on fetal skeleton described below, samples were subsequently fixed in 10% formalin.
3D computed tomography
Whole fetuses (excluding the skull) were scanned using a Skyscan 1176 in vivo micro-CT scanner (µCT; Skyscan, Kontich, Belgium). All scans were taken at 45 kV, 550 µA with no filter. Voxel size was 18 µm. Reconstructed volume images were analysed using Skyscan CTAn software version 1.12. Data analysed was either complete skeleton or individual bones and comprised volume or volume/density plots. Phantoms of known density (Skyscan) were used to determine bone mineral density of bones. From direct visual analysis, the cut-off for bone visualisation was determined to be −25 mg cm−3. For low- and high-density bone analysis, thresholds were set at −25 to 34 mg cm−3 (low range) and 200–535 mg cm−3 (high range) as used previously. Reference Watkins, Sirovica, Stokes, Isaacs, Addison and Martin16 In addition, a developmental index (DI) score was used to collate relative progression of new bone formation for the front right paw (0–3; 1 when metacarpals present; 2 when proximal phalanges present; 3 when distal phalanges present) and tail vertebrae (number of vertebral bodies visible below the pelvis). Reference Patton and Kaufman18
Histology
Fetal forelimbs from female fetuses (one per dam) at E17.5 were dissected, fixed in 10% formalin for 24 h, alcohol dehydrated and embedded in paraffin, and cut to generate longitudinal 4 µm sections of the humerus with consecutive sections stained for Haematoxylin/eosin, 1% Alcian blue and 2% Alizarin red (Sigma) (adapted from Reference Rigueur and Lyons19 to visualise cartilage and mineralised bone, respectively). Slides were viewed on an Olympus SZX10 microscope, images at the precise mid-longitudinal axis were analysed using Image J and area measurements of bone development compared across dietary treatment.
Statistics
For µCT, at least 10 dams were used for each diet group and one male and one female offspring analysed per dam. For humerus histology, five to eight female fetal samples from five to eight dams were used per treatment (control: n = 6; Emb-LPD: n = 8; LPD: n = 7). All fetal data were analysed using a multilevel random-effects regression model using PASW for Windows program version 21 (SPSS UK, Woking, Surrey, United Kingdom). Thus, differences identified between treatment groups are independent of maternal origin of litter and litter size. Reference Watkins, Ursell and Panton14 Data are presented as mean ± 95% confidence limits unless otherwise shown; significance was determined with a P value of 0.05 or lower.
Results
Fetal stage E14.5
Early bone development was assessed by µCT in E14.5 fetuses. At this stage, bone formation is minimal but LPD total bone volume (TBV) was increased relative to other groups and with male (P < 0.05) and female (P < 0.05) fetuses, increased over NPD controls (Fig. 1a). Mean TBV in Emb-LPD fetuses was similar to control although reduced in females (P < 0.05; Fig. 1a). Representative µCT images of males are shown in Fig. 1b where the clavicle (arrowed Fig. 1b) is the main bone mineralised at this stage, as shown previously, Reference Huang, Fukai, Selby, Olsen and Mundlos20 but with more substantial bone growth including ribs (R, Fig. 1b) evident in the LPD group.
Effect of maternal diets on fetal bone growth at E14.5 with error bars shown as SEM and with P values at significant and trend level indicated between treatments. (a) Total bone volume is increased in both male and female LPD fetuses. (b) Representative µCT images of control, Emb-LPD and LPD skeletons (all males), at E14.5, the main bone formed is the clavicle (arrowed) while ribs have also partially formed in the more advanced LPD fetus. (c) Total bone volume ratio to fetal mass, placental mass and yolk sac mass showing disproportionate growth and increased placental and yolk sac efficiency of male and female LPD fetuses versus controls. (d) Correlation between total bone volume and fetal mass showing the increased bone growth evident in LPD fetuses. For all graphs for each sex, n = 14–24 from 10 to 13 different mothers per treatment.

Increased bone growth in E14.5 LPD fetuses at least in part reflects an increase in conceptus and fetal mass at this stage, evident particularly in male fetuses. This was not associated with accompanying significant increase in viscera, placenta or yolk sac masses, resulting in increased placental efficiency (defined here as fetal/placental mass ratio) in LPD males (P < 0.05; Table 1). As a consequence, LPD males have an increased TBV ratio with fetal mass (P < 0.05; Fig. 1c), not evident for viscera/fetal mass ratio (Table 1), reflecting disproportionate growth of bone in LPD male fetuses. TBV/placental and yolk sac mass ratios are also increased in male LPD fetuses, indicating increased placental and yolk sac efficiency in facilitating this bone growth (P < 0.05; Fig. 1c). LPD females, in contrast to LPD males, tend not to show disproportionate bone growth with, for example, viscera/fetal mass being increased relative to controls (Table 1) while TBV ratios to fetal, placental and yolk sac masses were similar to controls (Fig. 1c). Emb-LPD males and females show similar bone growth and relations to conceptus growth to controls (Table 1, Fig. 1c). E14.5 TBV and fetal mass for all treatments are positively correlated (P < 0.05; Table 2) and show clearly in LPD how bone growth was activated after a threshold fetal weight was reached (Fig. 1d).
Masses (g) and ratios of different parts of the conceptus at E14.5 or E17.5 of gestation exposed to maternal diets during pregnancy

Litter size was accounted for during statistical analysis. Different letters within columns, developmental day, and sexes indicate significant differences (P < 0.05). Letters in italics indicate differences at trend level (P < 0.1).
Correlation between bone volume and conceptus masses at E14.5 or E17.5 of gestation exposed to maternal diets during pregnancy

Litter size was accounted for during all statistical analyses. When data were split by sex, diet treatment was accounted for, and when split by diet treatment, sex was accounted for. Asterisks (*) highlight significant relationships (P < 0.05) and ($) highlight relationships at trend level (P < 0.1).
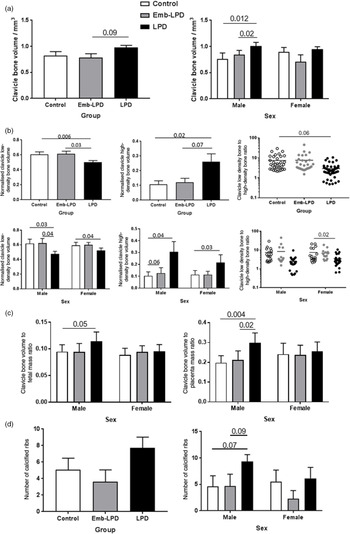
More specific µCT analyses were performed on the E14.5 clavicle. LPD clavicle volume was increased relative to other groups and significant in males (P < 0.05; Fig. 2a). By separate analysis of low and high clavicle bone density (see Methods), LPD displayed reduced volume of low and increased volume of high density relative to other groups and evident in both male and female fetuses (P < 0.05), resulting in a reduced low/high bone density ratio (Fig. 2b). As observed for TBV above, the clavicle volume/fetal mass and /placental mass ratios were also significantly increased in E14.5 LPD males (P < 0.05; Fig. 2c). The increase in bone growth evident in the LPD group also resulted in an increased number of calcified ribs, particularly in male fetuses (P = 0.07; Fig. 2d).
Effect of maternal diets on individual bone growth and mineral density quality at E14.5 with error bars shown as SEM and with P values at significant and trend level indicated between treatments. (a) Clavicle bone volume is increased in male but not female LPD fetuses. (b) Clavicle normalised low- and high-density bone volumes and low/high-density bone volume ratio showing reduced low and increased high-density bone volume and reduced low/high-density ratio in male and female LPD fetuses. (c) Clavicle bone volume ratio to fetal and placental masses indicating increased bone growth and placental efficiency in male but not female LPD fetuses. (d) Number of calcified ribs is increased in male but not female LPD fetuses. For all graphs for each sex, n = 14–24 from 10 to 13 different mothers per treatment.

Collectively, by E14.5, the sustained LPD treatment resulted in increased bone growth over controls, especially in males that was disproportionate to the remaining viscera, coinciding with increased fetal growth and placental efficiency, and this response included sufficient mineralisation to ensure bone structural quality. Emb-LPD treatment at E14.5 had minimal or no effect on bone growth compared with controls.
Fetal stage E17.5
µCT analysis
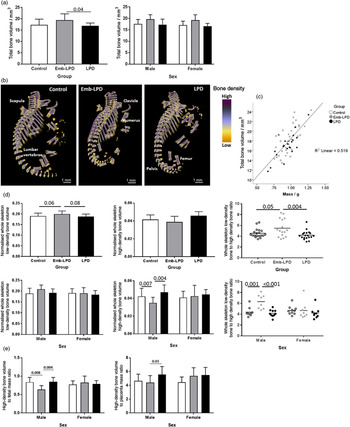
In all treatment groups, bone development at E17.5 was increased extensively from E14.5, allowing µCT analysis of several torso and limb bones. In contrast to E14.5 where LPD showed increased bone growth, at E17.5 the Emb-LPD samples displayed increased mean TBV compared with other groups, evident in both males and females, although not significant (Fig. 3a and b). LPD male and female TBV were similar to control (Fig. 3a). Representative µCT images of E17.5 male skeletons are shown in Fig. 3b with extensive bone formation evident.
Effect of maternal diets on bone growth and mineral density quality at E17.5 with error bars shown as SEM and with P values at significant and trend level indicated between treatments. (a) Total bone volume is increased as a mean but not significantly in male and female Emb-LPD fetuses versus controls (for each sex, n = 9–10 each from 9 to 10 different mothers, per treatment). (b) Representative µCT images of control, Emb-LPD and LPD skeletons (all males), at E17.5 bone formation is well advanced and main central and peripheral bones are indicated. (c) Total bone volume ratio is positively correlated with fetal mass for all treatments (for each sex, n = 9–10 from 9 to 10 different mothers per treatment). (d) Whole skeleton normalised low- and high-density bone volumes and low/high-density bone volume ratio showing reduced high-density bone volume and increased low/high-density ratio in male but not female Emb-LPD fetuses versus controls (for each sex, n = 8–10 from 8 to 10 different mothers, per treatment). (e) High-density bone volume ratio to fetal and placental mass showing a reduced high-density bone volume to fetal mass rato in male but not female Emb-LPD fetuses (for each sex, n = 8–10 from 8 to 10 different mothers per treatment).

The increased volume of Emb-LPD skeleton at E17.5 coincided with an overall small mean increase in conceptus and fetal mass in this group relative to others (Table 1). However, Emb-LPD placental and yolk sac mass were comparable to control indicating a small, non-significant increase in Emb-LPD placental efficiency to support fetal growth (fetal/placental ratio; Table 1). In contrast, E17.5 LPD male and female conceptus and fetus masses were similar to control yet had reduced placental mass (P < 0.05) resulting in a significant increase in placental efficiency (P < 0.05; Table 1). However, in both treatment groups, while TBV was positively correlated with fetal weight (Table 2; Fig. 3c), both TBV and viscera ratio with fetal mass were not affected by treatment, indicating bone growth to be proportionate with fetal growth (Table 1; data not shown). Moreover, TBV ratio to both placental and yolk sac mass were unaffected by treatment, and correlations were less clear, suggesting bone growth to be less dependent on their respective efficiencies (data not shown; Table 2).
When whole skeletons were analysed additionally for distributions of low- and high-density bone, Emb-LPD fetuses displayed increased low-density bone (P < 0.06) and an increased low/high-density bone ratio when compared to controls (P < 0.05; Fig. 3d). This was evident only in male offspring with reduced high-density bone (P < 0.007) and an increased low/high bone density ratio (P < 0.001) compared with controls. No such differences were found between female offspring (Fig. 3d). In contrast, LPD whole skeleton volume and mineral density was similar to control bone at E17.5 with male fetuses in particular, maintaining the high mineralisation found at E14.5 (Fig. 3d). Interestingly, when high-density bone volume was normalised to fetal and placental mass, Emb-LPD males displayed a significantly reduced ratio when compared with other treatments (P < 0.05; Fig. 3e), further confirming that increased bone growth in Emb-LPD males is of lower mineral quality.
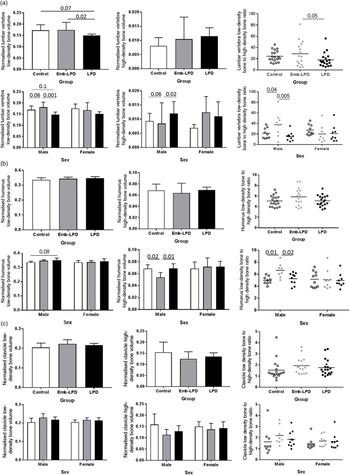
Broadly, similar patterns of bone growth and density were found when specific bone regions were analysed separately although distinct features were evident. Specifically, lumbar vertebrae (Fig. 4a) in Emb-LPD male, but not female fetuses, exhibited increased volume of low and decreased volume of high mineral density (P = 0.06) compared with controls, while LPD males tended to maintain less low density and more high-density bone than controls (Fig. 4a). A similar pattern was found in the humerus with male Emb-LPD and LPD fetuses showing reduced and maintained mineral density, respectively, compared with controls (Fig. 4b). In the clavicle (Fig. 4c), while the same pattern was evident, differences were not significant.
Effect of maternal diets on individual bone growth and mineral density quality at E17.5 with error bars shown as SEM and with P values at significant and trend level indicated between treatments. (a) Lumbar vertebra normalised low- and high-density bone volumes and low/high-density bone volume ratio showing increased low and reduced high-density bone volumes (trend level) and increased low/high-density ratio in male but not female Emb-LPD fetuses versus controls. (b) Humerus normalised low- and high-density bone volumes and low/high-density bone volume ratio showing reduced high-density bone volumes and increased low/high-density ratio in male but not female Emb-LPD fetuses versus controls. (c) Clavicle normalised low- and high-density bone volumes and low/high-density bone volume ratio across treatments showing no significant differences. For all graphs, for each sex, n = 8–10 each from 8 to 10 different mothers per treatment.

The DI, a measure used for bone formation in paw and tail vertebrae, further showed the advanced growth of Emb-LPD fetuses at E17.5 with both paw and tail DI increased relative to other groups (P < 0.09–0.001), and evident in males and females (Fig. 5a and b).
Effect of maternal diets on developmental index of front right paw and tail vertebrae at E17.5 with error bars shown as SEM and with P values at significant and trend level indicated between treatments. (a) Representative µCT images of front paw developmental index scores of 1–3 (left) and scores across treatments (right) showing increased score in both male and female Emb-LPD fetuses. (b) Representative µCT images of tail vertebra developmental index scores of 5–7 (left) and scores across treatments (right) showing increased score in total and female Emb-LPD fetuses. For all graphs, for each sex, n = 9–10 from 9 to 10 different mothers per treatment.

Collectively, by E17.5, the dynamics of bone growth and quality had changed from E14.5 with Emb-LPD bone growth increased relative to other groups and associated with proportionate fetal growth. Moreover, in male fetuses, Emb-LPD bone growth was predominantly of low rather than of high mineral density. LPD bone growth broadly matched that of controls and normal bone density quality was maintained.
Histological analyses
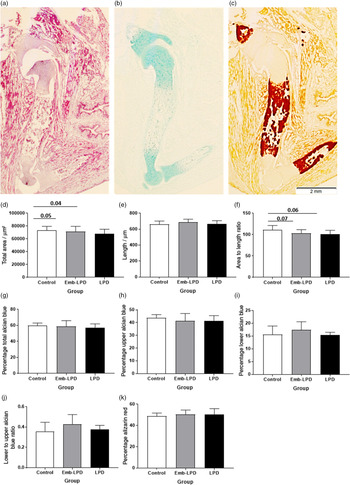
Bone developmental quality at E17.5 was further examined in longitudinal sections of humerus from female fetuses across dietary treatments for histology and histochemical staining for cartilage (Alcian blue, AB) and mineralisation (Alizarin red, AR) (Fig. 6a–c). Measurement of the precise middle histological section of each sample indicated controls had an increased cross-sectional area compared with Emb-LPD or LPD treatments (P < 0.05; Fig. 6d). However, humerus length was not different between treatments (Fig. 6e) such that area/length was increased in controls (Fig. 6f) and indicating the humerus to be marginally thinner in Emb-LPD and LPD. AB staining was observed within the upper and lower extremities and AR within the central region of each humerus longitudinal section (Fig. 6a–c). The percentage of area occupied by AB (either totally or upper or lower regions separately) and AR was not different between treatments (Fig. 6g–k) although the mean value for lower AB domain was highest in Emb-LPD as was the lower/higher AB ratio (Fig. 6i and j).
Histological analysis of humerus within mid-longitudinal sections of female fetal forelimbs at E17.5. Error bars are shown as SEM and with P values at significant and trend level indicated between treatments (n = 5–8 each from 5 to 8 different mothers per treatment). (a–c) Representative micrograph images of Haematoxylin/eosin (a), Alcian blue (cartilage) (b) and Alizarin red (mineral) (c) stained samples showing upper and lower Alcian blue and central Alizarin red domains within the humerus. (d–k) Area and staining pattern proportions of humerus comprising total area (d), length (e), area/length (f), % Alcian blue of total area (g), % upper Alcian blue of total area (h), % lower Alcian blue of total area (i), lower/upper Alcian blue area ration (j), and % Alizarin red of total area (k). Control samples have an increased area and area/length ratio versus Emb-LPD and LPD samples. Scale bar = 2 mm.

Discussion
Our study reveals that poor maternal nutrition, either throughout gestation or limited to just preimplantation development, was sufficient to alter both the rate of fetal bone growth and the mineral density quality in a pattern that is dependent upon dietary treatment timing and duration, stage of fetal growth and offspring sex with males being most affected. We also find the dynamics of bone growth and quality are further influenced by overall conceptus growth with both Emb-LPD and LPD showing evidence of increased placental efficiency as defined by fetal/placental mass ratio, a commonly used correlate of placental efficacy in developmental programming. Reference Thornburg, Kolahi, Pierce, Valent, Drake and Louey21 To characterise and interpret these effects, the two treatments are first considered separately.
Maternal LPD treatment throughout gestation led to increased fetal bone growth at E14.5 at the onset of osteogenesis, evident in increased clavicle volume and rib number in both male and female offspring. This increased bone growth, while correlated to fetal growth, is in excess to the remaining viscera and fetal growth and reflects evidence of increased placental efficiency in males. Moreover, male LPD bone growth comprises increased volumes of high mineral density compared with controls, indicating compensatory responses to poor maternal nutrition, discussed below, are sufficient to protect gestational skeletogenesis. In late gestation (E17.5), when the bulk of the skeleton has been developed shortly before term, LPD bone and fetal growth have effectively slowed or plateaued in that they become similar to controls yet bone mineral density quality is maintained in both sexes. This confirms the capacity for compensatory responses to stabilise skeletal development despite the sustained condition of undernutrition. However, our past studies indicate the sustained LPD treatment leads to altered postnatal osteogenic environment and deficiency in bone structure in old age in females but not males. Reference Lanham, Bertram, Cooper and Oreffo7,Reference Lanham, Roberts, Cooper and Oreffo11,Reference Lanham, Roberts, Perry, C. Cooper and Oreffo12
In contrast to the LPD, the overall pattern of offspring bone growth and quality following the short-term Emb-LPD treatment is quite distinct. At E14.5, Emb-LPD male and female offspring are similar to controls in terms of bone growth and mineral density. However, at E17.5, Emb-LPD offspring exhibit enhanced bone growth across several bone types compared with controls that broadly matches the rate of fetal growth and with evidence of increased placental efficiency. Critically, and especially in male offspring, Emb-LPD bone growth is achieved at the expense of mineral density which is reduced compared with that of both controls and LPD. Moreover, unlike male LPD at E14.5, male Emb-LPD bone growth at E17.5 is less associated with placental and yolk sac efficiency, suggesting their capacity to maintain bone mineral quality has diminished. These bone characteristics of male Emb-LPD offspring close to term match those recognised as vulnerable to osteoporotic disease in later life. Reference Lanham, Bertram, Cooper and Oreffo7
How might the two maternal dietary treatments lead to distinct fetal bone growth and quality outcomes? Given the close relationship between bone and fetal growth as discussed above, to answer this requires consideration of the dietary influence on offspring conceptus growth regulating mechanisms. Previous studies using the mouse LPD/Emb-LPD model have identified that responses occurring in offspring tissues differ between extra-embryonic (placental, yolk sac) and embryonic/fetal tissues. Thus, a consistent finding has been that both Emb-LPD and LPD induce changes in placental and yolk sac lineages that augment maternal nutrient transfer to offspring. Such compensation occurs from the blastocyst stage and is multifaceted, including increased proliferation and nutrient delivery mechanisms. Reference Watkins, Ursell and Panton14,Reference Coan, Vaughan and McCarthy22–Reference Watkins, Lucas, Marfy-Smith, Bates, Kimber and Fleming25 Some of these extra-embryonic modifications to poor diet supporting offspring survival are epigenetically regulated. Reference Sun, Denisenko and Sheth26 Thus, activation of such extra-embryonic compensatory mechanisms by LPD and Emb-LPD would contribute to the fetal growth and placental efficiency observed here.
The embryonic/fetal tissues respond to maternal LPD/Emb-LPD treatments by activating a mechanism which coordinates the rate of ribosome biogenesis, the basis of protein translation and cellular growth, to the availability of maternal nutrients. By this process, ribosome biogenesis and growth are restricted during periods of maternal nutrient challenge but upon release of the dietary challenge (as in Emb-LPD here), the restriction is lifted and growth may occur beyond that of control treatment (Denisenko, Lucas et al. 2016) mediated via mTORC1 signalling, known to be modulated in the Emb-LPD blastocyst. Reference Eckert, Porter and Watkins23,Reference Denisenko, Lucas and Sun27 This growth-regulating mechanism is active across the lifespan and is again epigenetically regulated, based upon manipulation of rRNA gene promoter DNA methylation level. Reference Denisenko, Lucas and Sun27
In the context of the current study, the combination of the above extra-embryonic and embryonic adaptations following maternal Emb-LPD, plus the non-restricted diet from implantation onwards, would all act as positive factors for both fetal and bone growth, as observed at E17.5. In LPD, while extra-embryonic compensatory responses would be activated, these would be tempered by continued maternal undernutrition and suppressed cellular biosynthesis, leading to fetal and bone growth that is similar to controls at E17.5. What is interesting is the transient advanced growth of LPD offspring at E14.5, suggesting short-term compensation of placental activity overcoming restrictions on growth control.
Our study provides further evidence that adverse environment around conception is sufficient to activate conditions that may lead to later-life disease and emphasise the particular risk of transient undernutrition at a time when women would likely not know they are pregnant. Reference Fleming, Watkins and Velazquez3 The periconceptional risk to bone growth characteristics and mineral density quality have also been identified in our earlier parallel mouse paternal study where LPD fed to fathers exclusively over the period of spermatogenesis and spermiogenesis (7–9 weeks up to mating) generated at E17.5 fetuses with increased skeletal volume. Crucially, paternally derived LPD led to fetal bone comprising an increased proportion of low density and a reduced proportion of high mineral density bone compared with controls, using the same µCT method of analysis as here. Reference Watkins, Sirovica, Stokes, Isaacs, Addison and Martin16
In conclusion, we show that mouse maternal dietary protein restriction from the time of conception can alter the pattern of development of the fetal skeleton in ways affecting bone growth and mineral density. The duration and nature of dietary challenge influence fetal outcomes with a transient Emb-LPD treatment in particular provoking adverse bone structure mimicking conditions found in adult bone disease. Mechanistically, maternal LPDs may mediate effects on bone through fetal growth and placental efficiency, especially affecting male offspring. More detailed molecular steps in the adverse programming of bone phenotype need to be focused from the time of conception onwards.
Financial support
Financial support is gratefully acknowledged from Biotechnology and Biological Sciences Research Council (BB/1001840/1; BB/F007450/1) and European Union FP7-CP-FP Epihealth programme (278418) to TPF. RO acknowledges support from the Biotechnology and Biological Sciences Research Council UK (BB/G010579/1 and BB/LO21072/1) and Research into Ageing (Grant number 253).
Conflicts of Interest
The authors declare that there are no competing interests associated with this manuscript.
Ethical standards
All animal experimentation was performed under license from the UK Home Office in accordance with regulations and with local ethics committee approval.