Introduction
To maintain signal transmission, neurons must sustain release of synaptic vesicles for long periods of time (Beutner et al., Reference Beutner, Voets, Neher and Moser2001; Wu et al., Reference Wu, Ryan and Lagnado2007; Alabi & Tsien, Reference Alabi and Tsien2012). This process requires tight coupling between exocytosis and endocytosis (Rieke & Schwartz, Reference Rieke and Schwartz1996; Gundelfinger et al., Reference Gundelfinger, Kessels and Qualmann2003; Haucke et al., Reference Haucke, Neher and Sigrist2011), with vesicles retrieved via compensatory endocytosis after their release (Pysh & Wiley, Reference Pysh and Wiley1974; Miller & Heuser, Reference Miller and Heuser1984; LoGiudice & Matthews, Reference LoGiudice and Matthews2007; Wu et al., Reference Wu, Ryan and Lagnado2007; Barg & Machado, Reference Barg and Machado2008; Smith et al., Reference Smith, Renden and von Gersdorff2008; Xue & Mei, Reference Xue and Mei2011). Tight temporal coupling between exocytosis and endocytosis is especially important in rod photoreceptors. At conventional synapses, release occurs phasically in response to action potentials (Waites & Garner, Reference Waites and Garner2011), but rods respond to changes in light and dark by graded changes in membrane potential that modulate the continuous release of vesicles (Dowling, Reference Dowling2012). In darkness, rods have a depolarized membrane potential of ca. −40 mV that promotes continued activation of L-type Ca2+ channels and sustained release of vesicles. To facilitate ongoing release, rods contain a specialized protein active zone structure known as the ribbon, which tethers releasable vesicles close to Ca2+ channels (Sterling & Matthews, Reference Sterling and Matthews2005; Schmitz, Reference Schmitz2009). Unlike mammalian rods that have a single ribbon per rod terminal (Sterling & Matthews, Reference Sterling and Matthews2005), there are an average of 7 ribbons per terminal in salamander rods (Townes-Anderson et al., Reference Townes-Anderson, MacLeish and Raviola1985). Measurements in both salamander and mouse retina suggest that synaptic vesicles are released from rods at a rate of 18 vesicles/second/ribbon in darkness (Berntson & Taylor, Reference Berntson and Taylor2003; Sheng et al., Reference Sheng, Choi, Dharia, Li, Sterling and Kramer2007). At this rate, the entire cytoplasmic pool of vesicles would be depleted within 5–10 min after the onset of darkness without compensatory endocytosis (Sheng et al., Reference Sheng, Choi, Dharia, Li, Sterling and Kramer2007; Zampighi et al., Reference Zampighi, Schietroma, Zampighi, Woodruff, Wright and Brecha2011). Thus, even though a very large number of vesicles participate in release from rods (ca. 75,000 per rod in salamander retina; Sheng et al., Reference Sheng, Choi, Dharia, Li, Sterling and Kramer2007), endocytosis remains essential for maintaining ongoing release.
The properties of endocytosis have been studied directly in only a few neuronal cell types. Retinal bipolar cells are one of the most thoroughly characterized. Studies in bipolar cells show that multiple mechanisms of endocytosis with different kinetics are involved in retrieving vesicles after their release (von Gersdorff & Matthews, 1994b). A slow phase of endocytosis, with a time constant of approximately 10 s, was shown to be clathrin dependent (Jockusch et al., Reference Jockusch, Praefcke, McMahon and Lagnado2005). In clathrin-mediated endocytosis, a clathrin protein lattice coats the exterior of the vesicle prior to endocytosis. Another faster component of endocytosis, with a time constant of approximately 1 s, was not clathrin dependent (Jockusch et al., Reference Jockusch, Praefcke, McMahon and Lagnado2005), but did involve endophilin (Llobet et al., Reference Llobet, Gallop, Burden, Camdere, Chandra, Vallis, Hopkins, Lagnado and McMahon2011). This fast component was not due to a kiss-and-run endocytosis mechanism, in which a transient pore connects the vesicle to the plasma membrane without full collapse fusion (Zenisek et al., Reference Zenisek, Steyer, Feldman and Almers2002; Llobet et al., Reference Llobet, Beaumont and Lagnado2003). Both clathrin-dependent and clathrin-independent modes of endocytosis typically involve the GTPase dynamin (LoGiudice et al., Reference LoGiudice, Sterling and Matthews2009; Wan & Heidelberger, Reference Wan and Heidelberger2011). However, a GTP-independent mode of endocytosis has also been observed in bipolar cells (Heidelberger, Reference Heidelberger2001) as well as other neurons (Xu et al., Reference Xu, McNeil, Wu, Nees, Bai and Wu2008; Chung et al., Reference Chung, Barylko, Leitz, Liu and Kavalali2010). A third mechanism, bulk endocytosis, was identified under conditions of strong and prolonged stimulation (Holt et al., Reference Holt, Cooke, Wu and Lagnado2003; Coggins et al., Reference Coggins, Grabner, Almers and Zenisek2007). In this mechanism, portions of the synaptic membrane are retrieved less selectively forming large endosomes.
In photoreceptors, both coated vesicles (Gray & Pease, Reference Gray and Pease1971; Schaeffer & Raviola, Reference Schaeffer and Raviola1978) and clathrin (Sherry & Heidelberger, Reference Sherry and Heidelberger2005; Wahl et al., Reference Wahl, Katiyar and Schmitz2013; Fuchs et al., Reference Fuchs, Brandstätter and Regus-Leidig2014) are found in perisynaptic regions adjacent to ribbons. Other endocytic proteins including dynamin, syndapin, amphiphysin, endophilin, and calcineurin are also found in this region of rod terminals (Ullrich & Südhof, Reference Ullrich and Südhof1994; Sherry & Heidelberger, Reference Sherry and Heidelberger2005; Wahl et al., Reference Wahl, Katiyar and Schmitz2013; Fuchs et al., Reference Fuchs, Brandstätter and Regus-Leidig2014). Rods and cones exhibit both fast and slow components of endocytosis (Rieke & Schwartz, Reference Rieke and Schwartz1996; Rabl et al., Reference Rabl, Cadetti and Thoreson2005; Innocenti & Heidelberger, Reference Innocenti and Heidelberger2008; Van Hook & Thoreson, Reference Van Hook and Thoreson2012). Cones have an ultrafast component of endocytosis, with a time constant of ∼250 ms, much more rapid than the fast component in bipolar cells (Van Hook & Thoreson, Reference Van Hook and Thoreson2012). Endocytosis in cones was not slowed by inhibition of dynamin with dynasore or GTPγS (Van Hook & Thoreson, Reference Van Hook and Thoreson2012), whereas endocytosis in rods was decreased by these same inhibitors (Van Hook & Thoreson, Reference Van Hook and Thoreson2012). This result indicates that different mechanisms mediate endocytosis in rods and cones.
In the present study, we characterized endocytosis in rods further and observed an ultrafast component of retrieval with an average time constant of <200 ms following a brief depolarizing test step. Unlike cones, the kinetics of endocytosis in rods slowed with increasing release and decreasing Ca2+ buffering suggesting that endocytosis in rods is regulated by both endocytic load and local Ca2+ levels.
Materials and methods
Retinal slice
Slices were prepared from the retina of aquatic tiger salamanders (Ambystoma tigrinum; both sexes, 18–25 cm length; Charles Sullivan, Nashville, TN) using methods described by Van Hook and Thoreson (Reference Van Hook and Thoreson2013). Experimental procedures were approved by the University of Nebraska Medical Center’s Institutional Animal Care and Use Committee. Animals were maintained at 4–8 °C on a 12:12 h light-dark cycle. Salamanders were sacrificed 1–2 h after the beginning of subjective night by rapid decapitation and hemisection of the head with heavy shears followed immediately by pithing. Then, the eyes were enucleated and the anterior segment of the eye and the lens were removed. The resultant eyecup was placed vitreal side down onto a nitrocellulose membrane (5 × 10 mm; type AAWP, 0.8 µm pores; Millipore). The tissue was cut into 125 µm slices using a razor blade tissue slicer (Stoelting Co., Wood Dale, IL). Slices were rotated 90° and anchored to the recording chamber using vacuum grease. The recording chamber was placed on an upright fixed stage microscope (E600FN; Nikon, Tokyo, Japan) equipped with a long working distance, 60X, 1.0 NA water-immersion objective. Tissue was superfused at ∼1 ml/min with an oxygenated amphibian saline solution containing the following (in mM): 111 NaCl, 2.5 KCl, 1.8 CaCl2, 0.5 MgCl2, 5 glucose, and 10 HEPES (pH 7.8; 240–245 mOsm).
Electrophysiology
Recording pipettes were fabricated from borosilicate glass pipettes (1.2 mm outer diameter, 0.9 mm inner diameter, with internal filament; World Precisions Instruments) using a Narishige PP-830 vertical puller to produce tips of ∼2 μm in diameter and resistance values between 12–20 MΩ. The shaft of each recording pipette was coated with dental wax to reduce stray capacitance. Pipettes were positioned with Huxley–Wall micromanipulators, so that the tip of the pipette contacted the rod cell body, which was identified morphologically. After establishing a giga-ohm seal, the patch was ruptured with gentle suction. The pipette solution contained (in mM): 40 Cs glutamate, 50 Cs gluconate, 10 TEACl, 3.5 NaCl, 1 CaCl2, 1 MgCl2, 10 MgATP, 0.5 GTP, 1 BAPTA, and 10 HEPES (pH 7.2; 235–240 mOsm). BAPTA was included to rapidly buffer Ca2+ and minimize Ca2+-dependent conductances. In some experiments, we used 10 mM BAPTA, 5 mM EGTA, or 0.5 mM EGTA in place of the 1 mM BAPTA. The 0.5 mM EGTA solution was made without the 1 mM CaCl2. TEA and Cs are included to block K+ channels, improving voltage clamp and Ca2+ current (I Ca) measurements. Rods were voltage clamped with an Optopatch patch clamp amplifier (Cairn Research), which was controlled using an Axon Instruments Digidata 1322A interface (Molecular Devices) and pClamp 9.2 software (Axon/Molecular Devices). We excluded rods that required holding currents >200 pA in order to maintain a membrane potential of −70 mV. Membrane resistance, series resistance, and membrane capacitance (C m) averaged 223.0 ± 16.8 MΩ, 34.5 ± 1.8 MΩ, and 31.2 ± 1.4 pF, respectively (N = 21).
Changes in C m were used to measure exocytosis and endocytosis. Vesicle exocytosis was evoked by applying a depolarizing voltage step to the rod. Measurements of C m were made using the phase-tracking circuitry of the lock-in amplifier integrated into the Optopatch patch clamp amplifier (Johnson et al., Reference Johnson, Thomas and Kros2002; Rabl et al., Reference Rabl, Cadetti and Thoreson2006; Bartoletti et al., Reference Bartoletti, Babai and Thoreson2010; Van Hook & Thoreson, Reference Van Hook and Thoreson2012). The membrane potential was varied sinusoidally (500–600 Hz, 30 mV peak-to-peak) about a holding potential of −70 mV. Series resistance and membrane capacitance controls were adjusted to cancel the sinusoidal output current of the lock-in amplifier. To limit possible C m measurement artifacts that can be caused by conductance changes and allow time for the phase angle feedback circuitry to settle, capacitance recordings were suspended during the voltage step and for 30 ms afterward. Recordings that showed pronounced poststimulus changes in access resistance were excluded. The net change in C m is due to exocytosis of vesicles minus any compensatory endocytic retrieval. The kinetics of endocytosis were characterized by the time constant for a single exponential fit to the decline in C m after stimulation (τ endo) or for the time required for the increase in C m to decline by 50% (t 50).
In a few experiments, we obtained simultaneous paired whole cell recordings from rods and horizontal cells in retinal slices. Rod recordings were obtained as described for capacitance experiments. Rods were voltage clamped at −70 mV and stimulated with 200 ms voltage steps to −10 mV. Horizontal cells were voltage clamped at −60 mV with an Axopatch 200B amplifier. Horizontal cell pipettes were filled with a solution containing the following (in mM): 90 Cs gluconate, 10 TEACl, 3.5 NaCl, 1 CaCl2, 1 MgCl2, 10 MgATP, 0.5 GTP, 5 EGTA, and 10 HEPES (pH 7.2; 235–240 mOsm). Paired recording techniques are described in detail by Van Hook and Thoreson (Reference Van Hook and Thoreson2013).
Analysis
Capacitance traces were analyzed with pClamp 10 software. Data were analyzed using GraphPad Prism 4 to determine the mean ± SEM. Statistical significance of differences between experimental conditions was determined using two-tailed independent or paired Student’s t tests with P < 0.05.
Results
Fast endocytosis in rods
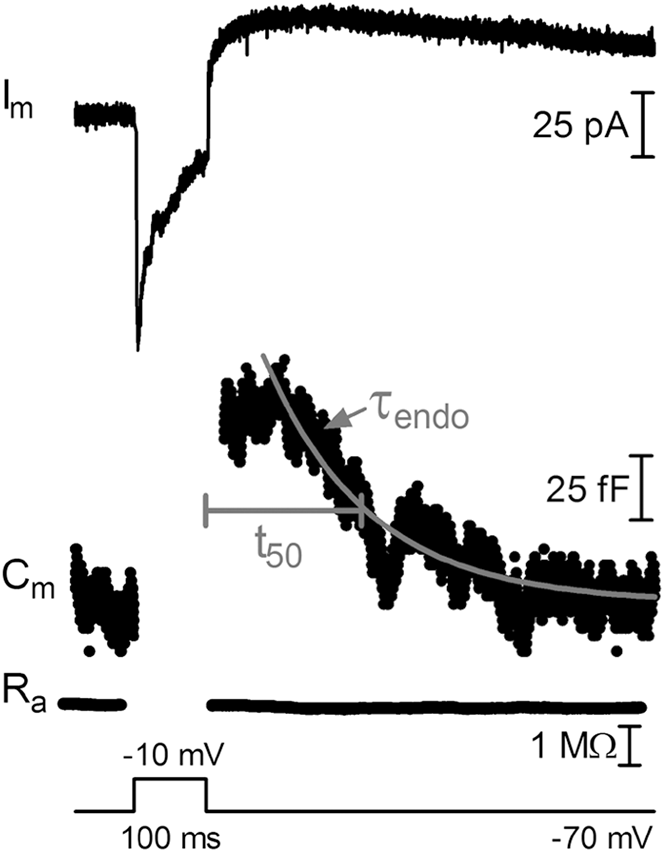
To study endocytosis in rods, we used capacitance recording techniques. Membrane capacitance provides a direct, high temporal resolution method for measuring changes in membrane surface area that result from the exocytosis and endocytosis of vesicles. Depolarizing test steps applied to voltage clamped rods typically evoked rapid endocytic retrieval of membrane. Fig. 1 illustrates the response of a rod to a 100 ms step from −70 to −10 mV. This strong stimulus maximally triggers opening of the L-type Ca2+ channels beneath the ribbon, allowing an influx of Ca2+ that drives vesicle release (Thoreson et al., Reference Thoreson, Rabl, Townes-Anderson and Heidelberger2004; Rabl et al., Reference Rabl, Cadetti and Thoreson2006). The step evoked an inward I m followed by an outward tail current after the step (Fig. 1: I m). An increase in membrane capacitance due to exocytosis was observed when measurements were resumed 30 ms after the step. Capacitance declined thereafter due to endocytosis (Fig. 1: C m).
Fast endocytosis in rods. Whole-cell capacitance recordings from a rod in a salamander retinal slice preparation. Changes in membrane current (I m), membrane capacitance (C m), and access resistance (R a) evoked by a 100 ms depolarizing step to −10 mV from a mean holding potential of −70 mV. The increase in C m caused by fusion of synaptic vesicles was followed, after a brief delay, by a decline in capacitance due to compensatory endocytosis. C m and R a measurements were suspended during the step and for 30 ms afterward. The light gray trace shows an exponential fit (τ endo) to the decline with a time constant of 142 ms. Endocytosis kinetics were also measured by determining the time at which the capacitance increase had declined by 50% (t 50), which was 213 ms in this example.

We measured the kinetics of endocytosis in two ways. First, we determined τ endo from a single exponential fit to the decline in C m (gray line, Fig. 1). Fitting the records with two exponentials did not improve the fit. For 5 out of the 6 step durations tested, fitting the average trace with a two-exponential function produced a negative value for the amplitude and/or the time constant. When fits were constrained to positive values for amplitude and time constant, fits were not improved significantly by addition of a second exponential component (paired comparison of the sum of squared errors for fits to average waveforms with 5–200 ms steps, P = 0.38, N = 6). Although there is evidence that slower endocytic components also contribute to retrieval with longer steps (Rieke & Schwartz, Reference Rieke and Schwartz1996; Thoreson et al., Reference Thoreson, Rabl, Townes-Anderson and Heidelberger2004), these results suggest that a single kinetic process dominated endocytosis with the relatively short steps used in our experiments.
We often observed a brief plateau before capacitance began to decline. Because of this plateau, we also characterized endocytosis by the time required for the amplitude of the capacitance increase to decline by 50% (t 50). The t 50 values were typically longer than τ endo, because they included this initial plateau (Fig. 1).
The kinetics of endocytosis following a 100 ms step were quite rapid (τ endo = 174.4 ± 33.54 ms, N = 13; t 50 = 192.9 ± 23.77 ms, N = 14; 100 ms; −70 to −10 mV). Cones often exhibited an endocytic overshoot, in which C m went below baseline after stimulation before returning to the pre-stimulation level (Van Hook & Thoreson, Reference Van Hook and Thoreson2012). By contrast, in rods we did not see convincing evidence for such an overshoot even with 200 ms steps. Some individual records appeared to show endocytic overshoot, but when we averaged multiple records to reduce the influence of baseline noise, we observed no evidence for an endocytic overshoot in rods. A similar method of analysis in cones using averaged records persisted in demonstrating endocytic overshoot (Van Hook & Thoreson, Reference Van Hook and Thoreson2012).
A 100 ms step to −10 mV evoked a capacitance increase averaging 76 fF. The diameter of a single vesicle in rods averages 45 nm, equivalent to a C m of 57 aF (Thoreson et al., Reference Thoreson, Rabl, Townes-Anderson and Heidelberger2004), suggesting 1333 vesicles were released during the step. Salamander rods possess an average of 7 ribbons/terminal (Townes-Anderson et al., Reference Townes-Anderson, MacLeish and Raviola1985) and each ribbon has an average of 710 vesicles, yielding a total ribbon pool of 4970 vesicles (Thoreson et al., Reference Thoreson, Rabl, Townes-Anderson and Heidelberger2004). In mammalian rods, 17% of the ribbon pool is docked in contact with the plasma membrane (Sterling & Matthews, Reference Sterling and Matthews2005). Assuming a similar proportion in salamander, this suggests an immediately releasable pool of 845 vesicles. Many vesicles were also probably released from non-ribbon sites (Chen et al., Reference Chen, Van Hook, Zenisek and Thoreson2013).
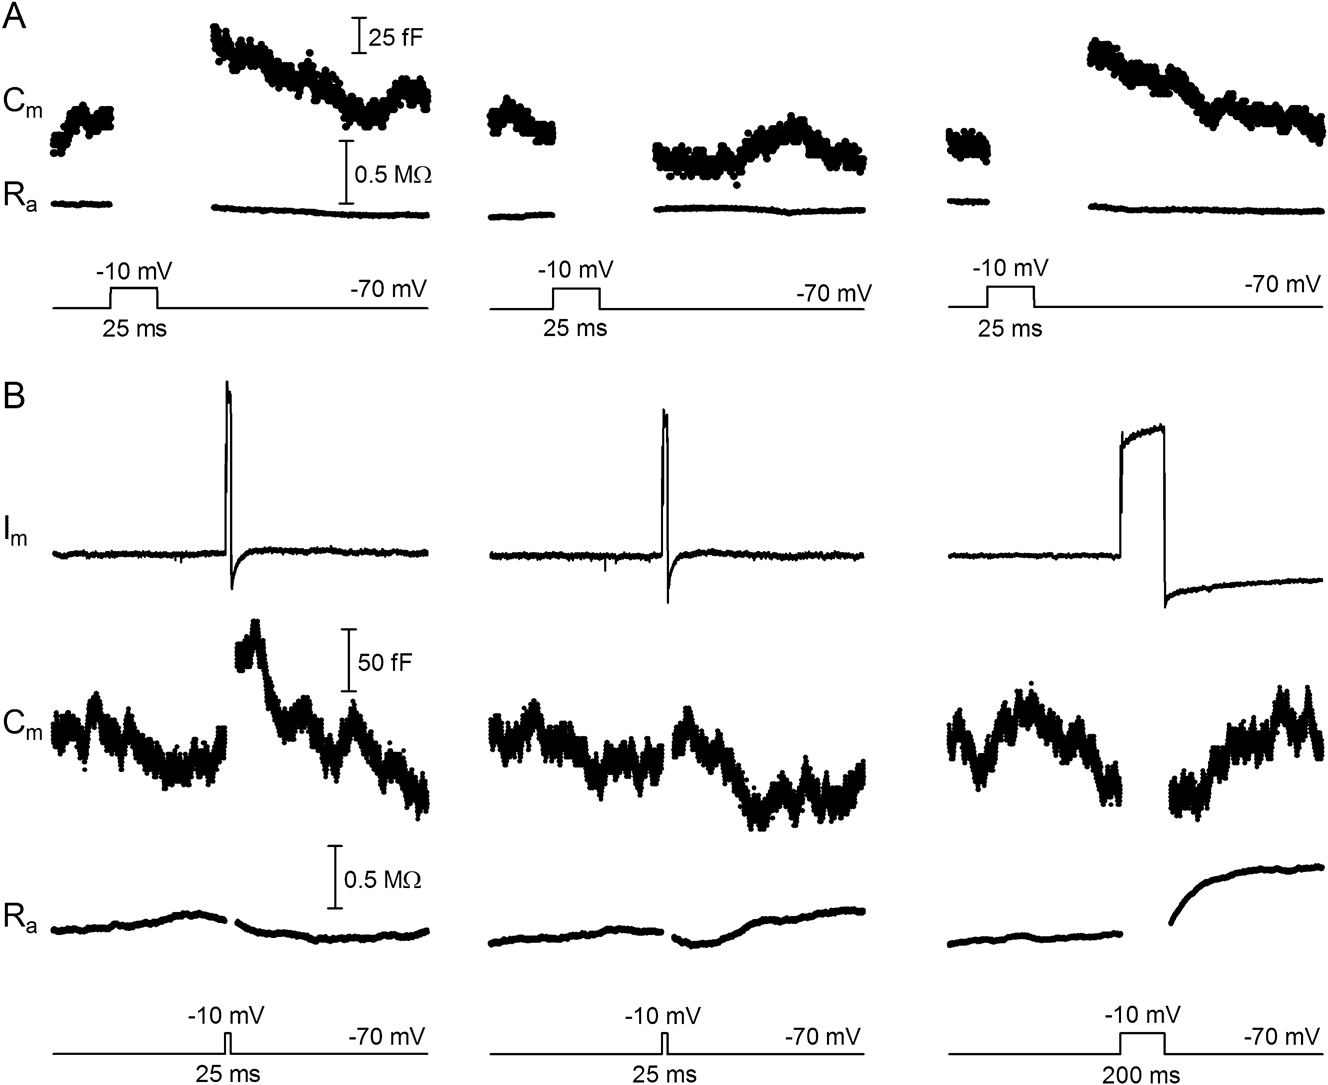
We performed a number of control experiments to confirm that capacitance increases represented synaptic exocytosis. 1) Depletion of the releasable pool of vesicles by a 1 s pulse train (25 ms steps to −10 mV at 13.3 Hz) abolished the capacitance increase evoked by a subsequent depolarizing test pulse. The left trace in Fig. 2A shows a capacitance increase evoked by a depolarizing test step (25 ms to −10 mV) prior to the train. Immediately after the train, the response was abolished (center trace, Fig. 2A). The depolarization-evoked capacitance increase subsequently recovered after waiting >1 min for replenishment of the releasable pool of vesicles (right trace, Fig. 2A). 2) Capacitance increases were not consistently correlated with the presence or absence of tail currents following depolarizing steps. Fig. 2B (left traces) shows a recording in which depolarization (25 ms to −10 mV) evoked both a capacitance increase and a brief inward tail current. Application of the same depolarizing step later in the same cell evoked a similar tail current but no capacitance increase (Fig. 2B, center traces). Subsequent application of a 200 ms step evoked a large inward tail current but did not evoke a capacitance increase (Fig. 2B, right traces). This indicates that the small tail current evoked by the 25 ms step applied earlier in the same cell was not responsible for the observed capacitance increase (Fig. 2B, left traces). The absence of capacitance increases in the two later traces was presumably due to rundown of exocytosis (Linton et al., Reference Linton, Holzhausen, Babai, Song, Miyagishima, Stearns, Lindsay, Wei, Chertov, Peters, Caffe, Pluk, Seeliger, Tanimoto, Fong, Bolton, Kuok, Sweet, Bartoletti, Radu, Travis, Zagotta, Townes-Anderson, Parker, Van der Zee, Sampath, Sokolov, Thoreson and Hurley2010). In some cells, we observed outward rather than inward tail currents. These were also not consistently correlated with capacitance increases. Together these experiments showed that, in the absence of any significant change in the resistance trace, tail currents were not responsible for capacitance increases. However, if tail currents were accompanied by large changes in the resistance trace (e.g., the 200 ms record in Fig. 2B, right trace), we excluded those records out of concern that such large changes in resistance might induce artifacts that could influence capacitance measurements. 3) As expected for exocytosis, there was rundown in the amplitudes of capacitance responses over time (average slope significantly nonzero, P = 0.0015), averaging −5.5 ± 1.3 fF/min (N = 13) for cells stimulated with 10 ms steps (−70 to −10 mV). 4) Depolarization-evoked capacitance increases were unchanged after blocking I Cl(Ca) with niflumic acid (10 ms steps: 0.1 mM t 50 = 142.7 ± 24.02 ms, N = 8; control t 50 = 115.6 ± 6.85 ms, N = 58; P = 0.19). Two results from earlier studies provide further evidence that depolarization-evoked capacitance increases in rods are due to exocytosis: 1) The amount of exocytosis measured from capacitance increases was linearly correlated with the amount of release measured by postsynaptic currents in paired recordings from rods and horizontal cells (Rabl et al., Reference Rabl, Cadetti and Thoreson2005). 2) In a model photoreceptor cell, large changes in membrane resistance did not produce a capacitance increase (Rabl et al., Reference Rabl, Cadetti and Thoreson2005).
Capacitance changes were not due to conductance or amplifier artifacts. (A) Emptying the releasable pool of vesicles with a 1 s pulse train (25 ms steps to −10 mV at 13.3 Hz) abolished the depolarization-evoked capacitance increase. Three responses recorded in the same cell show the membrane capacitance (C m) and access resistance (R a) evoked by a test step (25 ms to −10 mV) prior to the pulse train (left traces), immediately after the pulse train when the vesicle pool was depleted (center traces), and following subsequent recovery of the releasable vesicle pool (right traces). This result is consistent with capacitance increases being due to vesicle exocytosis. (B) Capacitance responses are not due to tail currents. A step depolarization (25 ms step to −10 mV) induced a capacitance increase and brief inward tail current (left traces). The same test step applied later in the same cell evoked a similar tail current but did not evoke a capacitance increase (center traces). Subsequent application of a 200 ms test step evoked a large tail current but no capacitance increase (right traces). The absence of a capacitance increase in later records was presumably due to rundown of exocytosis.
We tested whether properties of the phase lock amplifier might influence the measured kinetics of endocytosis. Changing the gain of the phase tracking feedback circuitry (by changing the amplifier gain) changed the rise time of depolarization-evoked capacitance increases, quickening it with higher gains, but did not significantly alter endocytosis kinetics (10 ms steps: gain 2 t 50 = 83.44 ± 5.02 ms, N = 8; gain 5 t 50 = 86.43 ± 16.68 ms, N = 8; P = 0.88). Slowing the frequency of the sine wave used for capacitance measurements from 500 to 300 Hz also did not significantly alter endocytosis kinetics or amplitude (25 ms steps: 500 Hz t 50 = 126.6 ± 22.28 ms, amplitude = 100.6 ± 21.11 fF, N = 5; 300 Hz t 50 = 137.4 ± 25.23 ms, amplitude = 79.9 ± 12.18 fF, N = 5; t 50P = 0.62; amplitude P = 0.42). Finally, we obtained similar time constants for endocytosis following 50 ms steps whether we used the phase tracking hardware of the Optopatch amplifier (τ endo = 169.5 ± 28.82 ms, N = 15) or the software-based, dual sine-wave protocol incorporated into JClamp (Scisoft) (Santos-Sacchi, Reference Santos-Sacchi2004) and implemented with a Multiclamp 700A amplifier (Molecular Devices) (τ endo = 176 ± 37 ms, N = 4).
Role of calcium and endocytic load
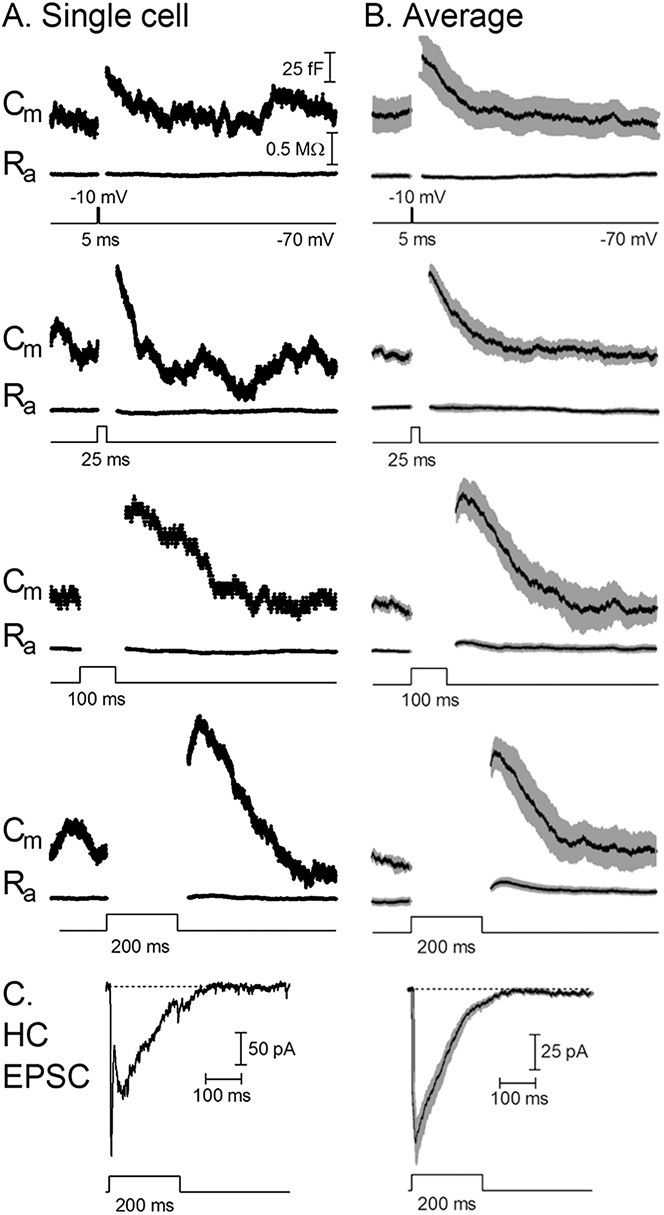
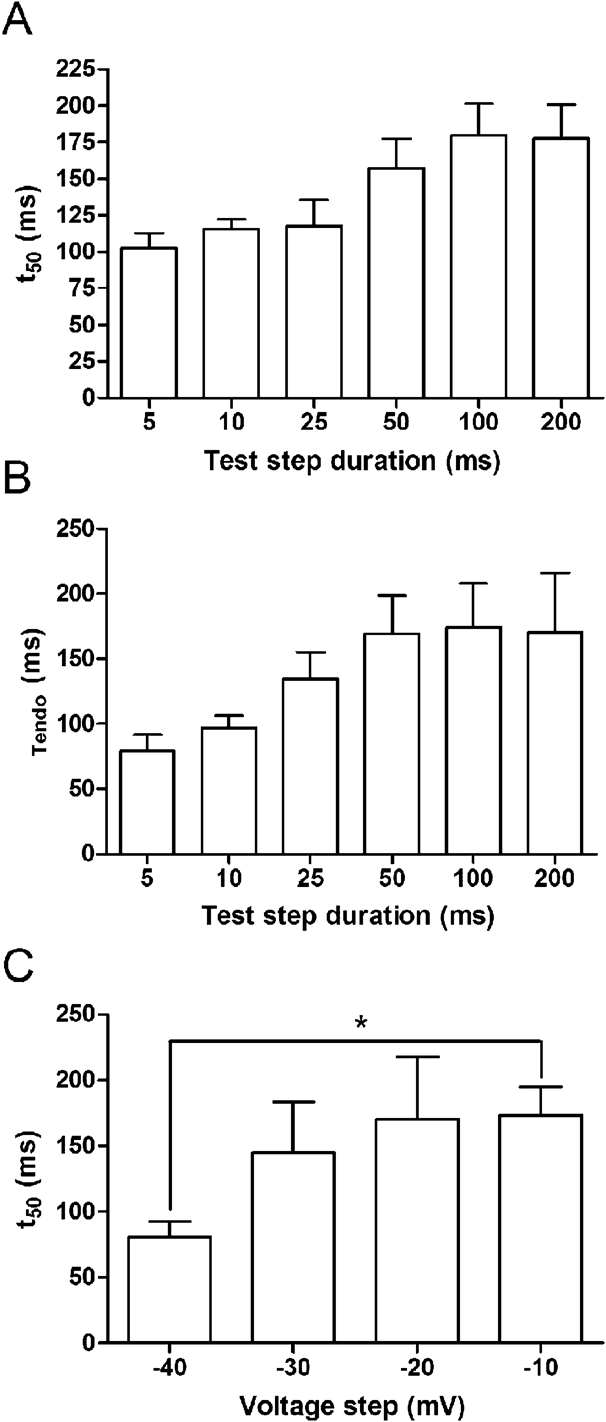
Next, we tested two factors that are commonly found to regulate the kinetics of endocytosis: the amount of Ca2+ influx and the endocytic load (the amount of membrane that needs to be retrieved) (Wu et al., Reference Wu, Hamid, Shin and Chiang2014). To do so, we varied Ca2+ influx and endocytic load by changing the duration and strength of voltage steps. Longer durations and larger voltage steps promote greater influx of Ca2+ and also trigger more exocytosis, and thus a greater endocytic load. The single cell and average traces illustrate that as the step duration increased, the time for the C m to return to baseline after the step also increased (Fig. 3). Both τ endo and t 50 values increased for steps from 5 to 50 ms and then remained about the same with 100 and 200 ms steps (Fig. 4A and 4B). Steps longer than 200 ms stimulated large tail currents that were accompanied by large resistance changes made capacitance measurements of the endocytosis kinetics unreliable.
The kinetics of endocytosis slowed with longer duration test steps. Representative traces from an individual cell (A) (all responses from the same cell) and average traces from multiple cells (B) with different duration steps: 5, 25, 100, and 200 ms (−70 to 10 mV). Average traces show the mean in black and SEM in gray (5 ms, N = 15; 25 ms, N = 21; 100 ms, N = 14; 200 ms, N = 13). Endocytosis kinetics slowed with longer steps. (C) EPSCs evoked in a horizontal cell by stimulation of rods with a depolarizing step (200 ms, −70 to −10 mV). The trace at the left shows an example from a single cell pair and the trace at the right shows the postsynaptic response averaged from 22 cell pairs.
Effects of test step duration and amplitude on endocytosis kinetics. With longer step durations (5, 10, 25, 50, 100, 200 ms), there was a similar increase in both t 50 (A) and τ endo (B) values (t 50: 5 ms = 102.4 ± 10.33 ms, N = 15; 10 ms = 115.6 ± 6.85 ms, N = 58; 25 ms = 117.9 ± 17.97 ms, N = 20; 50 ms = 157.0 ± 20.19 ms, N = 14; 100 ms = 179.5 ± 21.72 ms, N = 13; 200 ms = 177.4 ± 23.33 ms, N = 11 and τ endo: 5 ms = 79.20 ± 12.39 ms, N = 15; 10 ms = 96.89 ± 9.036 ms, N = 54; 25 ms = 134.4 ± 20.72 ms, N = 21; 50 ms = 169.5 ± 28.82 ms, N = 15; 100 ms = 174.4 ± 33.54 ms, N = 13; 200 ms = 170.3 ± 45.96 ms, N = 12). (C) With increasing voltage steps (−70 to −40, −30, −20, and −10 mV; 50 ms) there was an increase in the t 50 of endocytosis (−40 mV = 80.50 ± 12.17 ms, N = 8; −30 mV = 145.0 ± 38.62 ms, N = 8; −20 mV = 170.5 ± 47.32 ms, N = 11; −10 mV = 172.9 ± 22.03 ms, N = 28; −40 vs. −10 mV, P < 0.05).
In addition to longer values for τ endo, slowing of the kinetics of endocytosis also involved a lengthening of the plateau in the capacitance trace prior to endocytic retrieval. This plateau tended to increase in length with increasing test step duration (5 ms = 56.1 ± 6.27 ms, N = 14; 10 ms = 54.4 ± 3.12 ms, N = 49; 25 ms = 58.9 ± 8.25 ms, N = 20; 50 ms = 88.8 ± 8.58 ms, N = 14; 100 ms = 106.8 ± 14.72 ms, N = 13; 200 ms = 103.5 ± 15.99 ms, N = 11). Because Ca2+ influx increases with longer duration steps, these results are consistent with evidence that endocytosis can be inhibited by high Ca2+ concentrations and thereby delay the capacitance decline (von Gersdorff & Matthews, 1994a; Wan et al., Reference Wan, Vila, Zhou and Heidelberger2008; Leitz & Kavalali, Reference Leitz and Kavalali2011). However, another possible explanation for lengthening of the plateau is that endocytosis may be balanced by release that continues after the end of the voltage step (e.g., Singer and Diamond, Reference Singer and Diamond2006; von Gersdorff et al., Reference von Gersdorff, Sakaba, Berglund and Tachibana1998). To examine that possibility we obtained paired whole cell recordings from rods and horizontal cells. We stimulated the rod with a depolarizing voltage step to −10 mV for 200 ms and recorded the excitatory postsynaptic current (EPSC) evoked in the postsynaptic horizontal cell. Fig. 3C shows an EPSC from a single rod/horizontal cell pair as well as the average EPSC from 22 cell pairs. The EPSC persisted for an average of 72.7 ± 13.3 ms (N = 22) after the end of the step. This is slightly shorter than the average plateau duration in the capacitance response evoked by 200 ms steps measured with the same pipette solution (5 mM EGTA; 109.4 ± 19.2 ms, N = 7; P = 0.17), suggesting that continued release may also contribute to lengthening of the plateau with increasing step duration.
Ca2+ influx and endocytic load were also varied by changing the strength of 50 ms depolarizing steps. The voltage step was increased from −40 mV, which is near the threshold for opening of L-type Ca2+ channels in rods, up to −10 mV. The voltage needed for maximal Ca2+ channel activation is near −20 mV. As the probability of Ca2+ channel openings increased, the Ca2+ influx and endocytic load also increased. As with increasing step duration, increasing the strength of the voltage step resulted in slowing of the kinetics of endocytosis as represented by increasing t 50 values (Fig. 4C).
To assess whether the kinetics of endocytosis depend upon the amount of Ca2+ influx, we changed intracellular Ca2+ buffering to vary the local Ca2+ levels near release sites. In our standard pipette solution, we used 1 mM BAPTA, which is a relatively rapid chelator of Ca2+ and confines Ca2+ to within 100 nm of open Ca2+ channels (Van Hook & Thoreson, Reference Van Hook and Thoreson2012). We compared this to stronger buffering with 10 mM BAPTA, which abolished endocytosis entirely in mature calyx of Held neurons (Yamashita et al., Reference Yamashita, Eguchi, Saitoh, von Gersdorff and Takahashi2010). We also used the slower Ca2+ chelator EGTA at 5 and 0.5 mM concentrations, which allows Ca2+ to spread further away from sites of Ca2+ entry. These different buffering conditions should produce significant differences in Ca2+ concentration at more distant regions of the terminal where endocytosis occurs (LoGiudice et al., Reference LoGiudice, Sterling and Matthews2009; Wahl et al., Reference Wahl, Katiyar and Schmitz2013; Fuchs et al., Reference Fuchs, Brandstätter and Regus-Leidig2014).
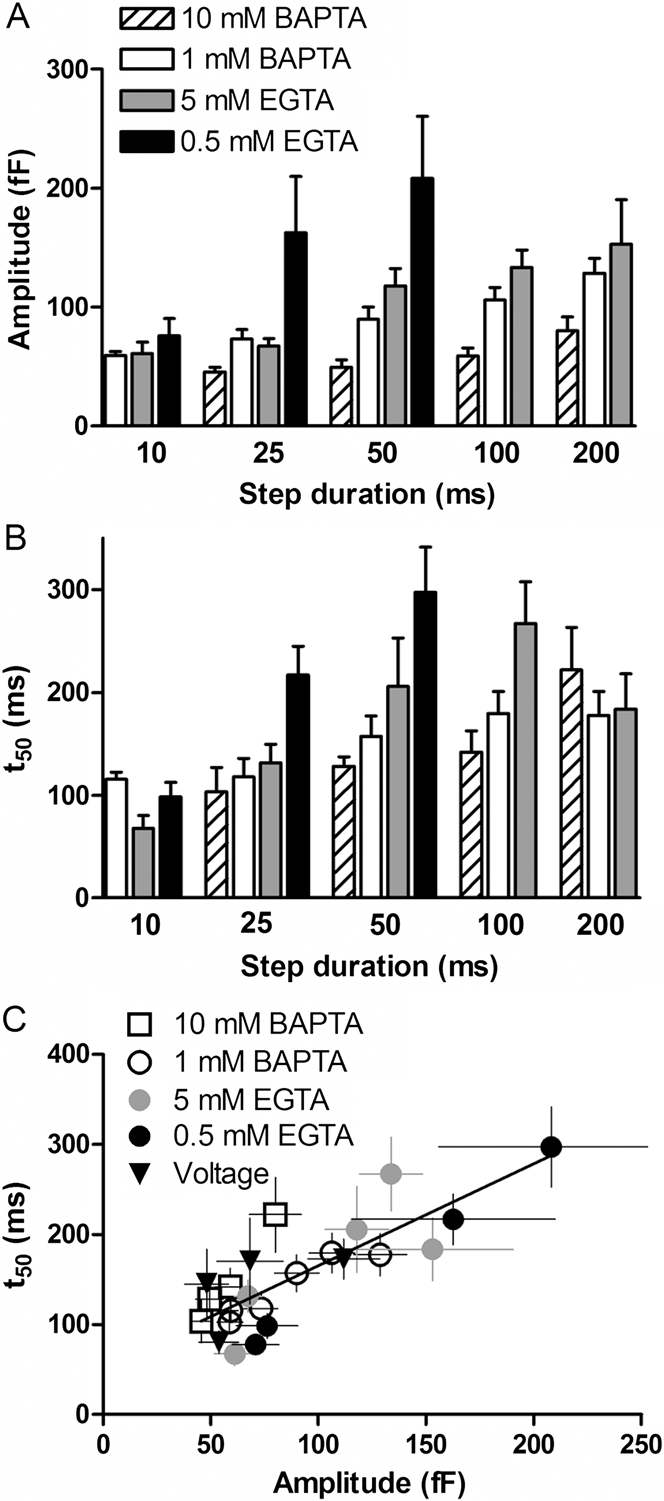
For a given Ca2+ buffer, the amount of release increased with longer step durations up to 200 ms (Fig. 5A). In addition, at a given step duration, decreasing the amount of Ca2+ buffering from 10 mM BAPTA to 0.5 EGTA tended to increase the t 50 value of endocytosis (Fig. 5B). Fast endocytosis persisted with use of 10 mM BAPTA, although the amount of exocytosis was diminished. With weak intracellular Ca2+ buffering using 0.5 mM EGTA, test steps longer than 50 ms evoked large tail currents that prevented accurate capacitance measurements. The lengthening of t 50 values with the shift from a high concentration of the fast buffer BAPTA to a low concentration of the slow buffer EGTA suggests that elevation of cytosolic Ca2+ slows endocytosis.
Changes in step duration and Ca2+ buffering altered the kinetics of endocytosis. (A) The amplitude of capacitance increases observed with different test step durations and intracellular Ca2+ buffers (10 mM BAPTA, 1 mM BAPTA, 5 mM EGTA, and 0.5 mM EGTA). (B) Average t 50 for steps of increasing duration measured using the same intracellular Ca2+ buffers. (C) There was a linear correlation between t 50 and the amplitude of exocytosis, which is proportional to endocytic load (r 2 = 0.66; slope significantly nonzero, P < 0.0001).
Decreasing Ca2+ buffering also increased the amplitude of exocytotic capacitance responses (Fig. 5A), perhaps by stimulating greater release at sites relatively far from the ribbon (Chen et al., Reference Chen, Van Hook, Zenisek and Thoreson2013, Reference Chen, Krizaj and Thoreson2014). We therefore tested whether the kinetics of membrane retrieval might also be influenced by endocytic load by plotting t 50 values against the amount of release (endocytic load) for the different test conditions described above: different durations, voltage steps, and Ca2+ chelators. As shown in Fig. 5C, there was a linear correlation between the slowing of endocytosis and the increase in endocytic load (r 2 = 0.66; Fig. 5C) over a range of experimental conditions. This correlation between endocytic load and kinetics held even under conditions where perisynaptic Ca2+ levels should be quite different due to the use of different Ca2+ buffers. This suggests that endocytic load also regulates the kinetics of endocytosis in rods.
Discussion
Our results indicate that endocytosis in rods involves “ultrafast” retrieval with time constants of less than 300 ms and an onset delay that lengthened with greater release. The rates of retrieval observed in rods were much faster than the fast endocytic component observed in many neurons including bipolar cells (Neves & Lagnado, Reference Neves and Lagnado1999; Wan & Heidelberger, Reference Wan and Heidelberger2011), the calyx of Held (Sun & Wu, Reference Sun and Wu2001), and frog auditory hair cells (Cho et al., Reference Cho, Li and von Gersdorff2011). However, ultrafast endocytosis has been observed previously in cones (Van Hook & Thoreson, Reference Van Hook and Thoreson2013), mammalian inner hair cells (Beutner et al., Reference Beutner, Voets, Neher and Moser2001), hippocampal neurons (Gandhi & Stevens, Reference Gandhi and Stevens2003; Watanabe et al., 2013b), neuromuscular junction (Watanabe et al., 2013a), and neuroendocrine cells (Thomas et al., Reference Thomas, Lee, Wong and Almers1994; Artalejo et al., Reference Artalejo, Henley, McNiven and Palfrey1995; Hsu & Jackson, Reference Hsu and Jackson1996). Kiss-and-run fusion is one potential mechanism for ultrafast endocytosis, but unlike ultrafast endocytosis in rods (Van Hook and Thoreson, Reference Van Hook and Thoreson2012) kiss-and-run fusion is not thought to be sensitive to dynamin inhibitors. Furthermore, imaging of single vesicle fusion events suggested that most fusion events in rods involve full collapse of vesicles (Chen et al., Reference Chen, Van Hook, Zenisek and Thoreson2013).
Most cell types, including bipolar cells and the calyx of Held, exhibit at least two kinetic components to membrane retrieval (von Gersdorff & Matthews, 1994b; Neves & Lagnado, Reference Neves and Lagnado1999; Wu et al., Reference Wu, Xu, Wu and Wu2005; Dittman & Ryan, Reference Dittman and Ryan2009). We found that endocytosis in rods following steps up to 200 ms in duration was better fit by a single exponential. Nevertheless, previous studies in enzymatically isolated rods and with longer test steps have shown evidence for a second slower component of retrieval (Rieke & Schwartz, Reference Rieke and Schwartz1996; Thoreson et al., Reference Thoreson, Rabl, Townes-Anderson and Heidelberger2004). The presence of clathrin and related endocytic proteins in rod terminals is also consistent with the presence of a slower component of retrieval by clathrin-mediated endocytosis (Wahl et al., Reference Wahl, Katiyar and Schmitz2013; Fuchs et al., Reference Fuchs, Brandstätter and Regus-Leidig2014). It is possible that small, slow components of endocytosis may have been obscured by unrelated slow baseline capacitance changes in our recordings. In addition, slow retrieval is typically more prominent after longer steps that stimulate greater Ca2+ influx and greater release. In our experiments, such long steps stimulated large Ca2+-activated tail currents and large resistance changes that made measurements of endocytosis unreliable.
Both the amount of preceding exocytosis (endocytic load) and cytosolic Ca2+ levels have been shown to promote endocytosis (Yamashita, Reference Yamashita2012; Wu et al., Reference Wu, Hamid, Shin and Chiang2014). Increases in Ca2+ speed endocytosis in many cell types (Wu et al., Reference Wu, Hamid, Shin and Chiang2014), but increasing Ca2+ influx can also slow endocytosis (Hsu & Jackson, Reference Hsu and Jackson1996; Wu & Betz, Reference Wu and Betz1996; Sun & Wu, Reference Sun and Wu2001; Sun et al., Reference Sun, Wu and Wu2002; Oltedal & Hartveit, Reference Oltedal and Hartveit2010; Cho et al., Reference Cho, Li and von Gersdorff2011). Slowing of endocytosis may be caused by global elevation of cytosolic Ca2+, whereas enhancement of endocytosis may be triggered by localized elevation of synaptic Ca2+ (Wu & Wu, Reference Wu and Wu2014). In retinal bipolar cells, Ca2+ slows the time constant of the slow mode of endocytosis (von Gersdorff & Matthews, 1994a; Wan et al., Reference Wan, Vila, Zhou and Heidelberger2008), but can also increase contributions from fast endocytosis without altering the fast time constant (Neves et al., Reference Neves, Gomis and Lagnado2001). Mammalian inner hair cells show a similar enhanced contribution from fast endocytosis with increasing Ca2+ influx (Beutner et al., Reference Beutner, Voets, Neher and Moser2001; Neef et al., Reference Neef, Jung, Wong, Reuter, Pangrsic, Chakrabarti, Kügler, Lenz, Nouvian, Boumil, Frankel, Wichmann and Moser2014). We found that shifting from high concentrations of the fast Ca2+ buffer BAPTA to low concentrations of the slower Ca2+ buffer EGTA, which promotes greater increases in perisynaptic Ca2+, was accompanied by a slowing of endocytosis in rods. While this suggests that Ca2+ regulates endocytosis kinetics in rods, greater Ca2+ influx also stimulates greater release. Unlike other neurons that show a marked cooperativity between Ca2+ influx and release, the amount of exocytosis in rods increases linearly with the amount of Ca2+ influx (Thoreson et al., Reference Thoreson, Rabl, Townes-Anderson and Heidelberger2004). This makes it especially difficult to distinguish the contributions of endocytic load and intracellular Ca2+ in shaping endocytosis kinetics in rods. However, we found that the slowing of endocytosis paralleled increases in endocytic load over a variety of different conditions, including conditions where perisynaptic Ca2+ levels should differ considerably (Fig. 5). This is similar to data from other cell types showing that slowing of endocytosis is linearly related to the amount of preceding exocytosis (Sankaranarayanan & Ryan, Reference Sankaranarayanan and Ryan2000; Wu et al., Reference Wu, Xu, Wu and Wu2005; Renden & von Gersdorff, Reference Renden and von Gersdorff2007). Slowing of endocytosis with greater release may be due to saturation of endocytic capacity (Wu et al., Reference Wu, Hamid, Shin and Chiang2014). Taken together, our results suggest that both Ca2+ and endocytic load play a role in regulating endocytosis in rods, similar to other systems (Wu et al., Reference Wu, Hamid, Shin and Chiang2014).
The present results provide further evidence that endocytosis mechanisms differ in rod and cone photoreceptors. Endocytosis in both cell types involves ultrafast retrieval. However, ultrafast endocytosis in rods is dynamin-dependent, whereas it is dynamin-independent in cones (Van Hook & Thoreson, Reference Van Hook and Thoreson2012). Furthermore, we found that endocytosis in rods slowed with greater Ca2+-triggered release, whereas the time constant of membrane retrieval in cones was independent of both Ca2+ and endocytic load. Cones also showed an endocytic overshoot that appeared to be absent from rods (Van Hook & Thoreson, Reference Van Hook and Thoreson2012). The molecular mechanisms responsible for rod/cone differences in endocytosis remain to be elucidated. It is possible that rod-cone differences in endocytosis may relate to rod-cone differences in the sites at which release occurs. Release from cones occurs almost exclusively at ribbons (Snellman et al., Reference Snellman, Mehta, Babai, Bartoletti, Akmentin, Francis, Matthews, Thoreson and Zenisek2011), whereas a significant amount of release from rods can occur at non-ribbon locations (Chen et al., Reference Chen, Van Hook, Zenisek and Thoreson2013, Reference Chen, Krizaj and Thoreson2014). It is plausible that vesicles released at ribbon sites may be retrieved by different mechanisms than vesicles released at non-ribbon sites. Differences in retrieval at ribbon and non-ribbon release sites might also contribute to differences in kinetics observed within rods under different experimental conditions. In rods, shorter steps and Ca2+ increases that remain confined near the ribbon favor more ribbon release, whereas longer steps and greater spread of intraterminal Ca2+ favor more non-ribbon release (Chen et al., Reference Chen, Van Hook, Zenisek and Thoreson2013, Reference Chen, Krizaj and Thoreson2014). Thus, the faster kinetics of endocytosis observed in rods with shorter steps and stronger Ca2+ buffering might reflect a faster retrieval mechanism for ribbon release compared to non-ribbon release.
Exocytosis in rods is continually balanced by endocytosis (Rieke & Schwartz, Reference Rieke and Schwartz1996). Ongoing endocytosis is essential at the rod synapse in order to maintain synaptic signaling, especially during darkness when there is continuous vesicle release for hours at a time. The fast rate of endocytosis may facilitate this balance by helping to rapidly clear previously exocytosed proteins from release sites, readying them for a subsequent round of release (Neher, Reference Neher2010).
Acknowledgments
This research was supported by the National Institutes of Health grants EY010542, Research to Prevent Blindness (WT), and a Graduate Fellowship from UNMC (KC). Thanks to Dr. Matthew Van Hook for helpful discussions.