Introduction
Varactor frequency multipliers are often used as solid-state sources in the millimeter and submillimeter ranges. Frequency multipliers based on GaAs Schottky diode technology are commercially available up to several terahertz [Reference Crowe, Bishop, Porterfield, Hesler and Weikle1]. The use of these devices has been proved in different fields such as spectroscopy, satellite applications, communications, radio astronomy, etc. For several of these applications high efficiency and large fixed-tuned bandwidth are required. This, in particular, holds for dynamic nuclear polarization systems [Reference Ardenkjær-Larsen, Fridlund, Gram, Hansson, Hansson, Lerche, Servin, Thanning and Golman2]. The polarization process relies on the power of electromagnetic radiation delivered to the sample. Traditionally, this power is delivered from sources using long wave-guiding structures, which loss and price scales with operating frequency. Alternatively, the multiplier can be placed close to the sample inside the polarization system, where the temperature of the environment is in the range from 77 to 100 K. Unfortunately, the power dissipation in the multiplier itself has been found to heat up the sample under test. Commercially available sources are typically not optimized for operation at cryogenic temperatures. Therefore, it may still be possible to improve the performance of the multipliers by design optimization directly at cryogenic temperatures. This motivates the development of a dedicated compact model of GaAs Schottky-barrier varactor diodes valid at cryogenic temperatures.
Compact diode models are available in most RF and microwave CAD software packages. Such diode models are generic, representing mainly the physical behavior of Silicon pn-junction diodes. Embedded with parasitic networks these diode models can be used to describe the performance of room temperature GaAs Schottky-based multipliers and mixers operating at frequencies up to several hundreds of GHz [Reference Yan3]. The temperature dependence of a Silicon pn-junction diode, however, is quite different from that of a GaAs Schottky-barrier diode due to the different carrier transport mechanisms involved.
It is a well-established fact that the performance of Schottky-based millimeter-wave multipliers improves when cooled [Reference Louhi, Raisanen and Erickson4]. The main reason for the improvement is an increase of the bulk mobility in GaAs. The increase in bulk mobility translates directly into a decrease in series resistance of the Schottky-barrier varactor and hence higher efficiency. For accurate prediction of multiplier performance at cryogenic temperature it is thus mandatory to include this temperature dependence of the bulk conductivity into the model formulation. The efficiency of Schottky-based multipliers is fundamentally limited by either forward conduction, including current saturation effects or reverse breakdown mechanisms [Reference East and Mehdi5]. These effects must be properly accounted for in the compact model description. Also, at cryogenic temperatures barrier inhomogeneities influence the forward current conduction and must be accounted for as well.
In this paper, the performance of GaAs Schottky-based multipliers at cryogenic temperatures are studied. The paper expands on the author's previous study [Reference Johansen, Rybalko, Zhurbenko, Bowen, Hesler and Ardenkjær-Larsen6] on the efficiency at cryogenic temperatures for a 78 GHz frequency doubler reported in the literature [Reference Porterfield, Crowe, Bradley and Erickson7]. The paper is structured as follows. In the section “Schottky-barrier varactor characterization”, the static characterization in the temperature range from 5– to 295 K of a GaAs Schottky-barrier varactor using a triple anode diode stack mounted in a multiplier block is described. Section “Schottky-barrier varactor modeling” describes the development of a dedicated compact model for the triple-anode stack varactor. The Schottky-barrier varactor model is extended with a frequency-dependent network to capture the effect of carrier inertia and displacement current in the epilayer. Also, the skin effect in the substrate layer is modeled. This should make the developed compact model versatile enough to predict the performance of frequency multipliers even in the submillimeter wave frequency range. In the section “Efficiency of millimeter-wave frequency multipliers at cryogenic temperatures”, an experimental setup is presented which serves to verify the developed compact model against cryogenic measurements on a commercial 200-GHz frequency doubler from Virginia Diodes Inc. For further model verification a 78-GHz frequency doubler cooled down to 14 K is considered. The conclusions are given in the section“Conclusion”.
Schottky-barrier varactor characterization
A Schottky-barrier varactor diode mounted in a multiplier block was I--V tested for a range of temperatures from 5– to 295 K. The diode, which consists of three anodes in series, has a total zero-bias capacitance of 26 fF. A two-stage closed-cycled cryogenic system is used to set the varactor multiplier at different temperatures. By applying Apizon N thermal grease between the varactor multiplier block and the second-stage cryogenic system, effective thermal coupling was achieved. Furthermore, a temperature sensor from Lake Shore was mounted on the varactor multiplier block to monitor the temperature precisely. A sweepable Keithley source unit was used to measure the I–V performance. The measured I–V characteristics in the interval from 5 to 295 K are shown in Fig. 1.The measured forward I–V –T dataset were compared with the standard diode equation
 $$I = I_s\left[ {\exp \left( {\displaystyle{{q(V - IR_s)} \over {\eta kT}}} \right) - 1} \right]$$
where η is the ideality factor,  $R_s$ is the series resistance,
 $I_s$ is the saturation current, q is the electron charge, and k is the Boltzmann constant. The standard diode I--V equation in (1) should provide a good description of a Schottky-barrier diode with a forward transport current dominated by thermionic emission [Reference Sze and Ng8,Reference Pierret9]. In this case, the saturation current can be described by
 $$I_s = AA^{\ast \ast}T^2\exp \left( {\displaystyle{{ - q\Phi _b} \over {kT}}} \right)$$
where A is the diode area,  $A^{\ast \ast}$ is the modified Richardson constant, and
 $\Phi _b$ is the barrier height. The I–V measurements in Fig. 1, however, show that when the multiplier is cooled below roughly 155 K, abnormal current transport mechanisms other than thermionic emission becomes important.
Forward I--V --T characteristics.

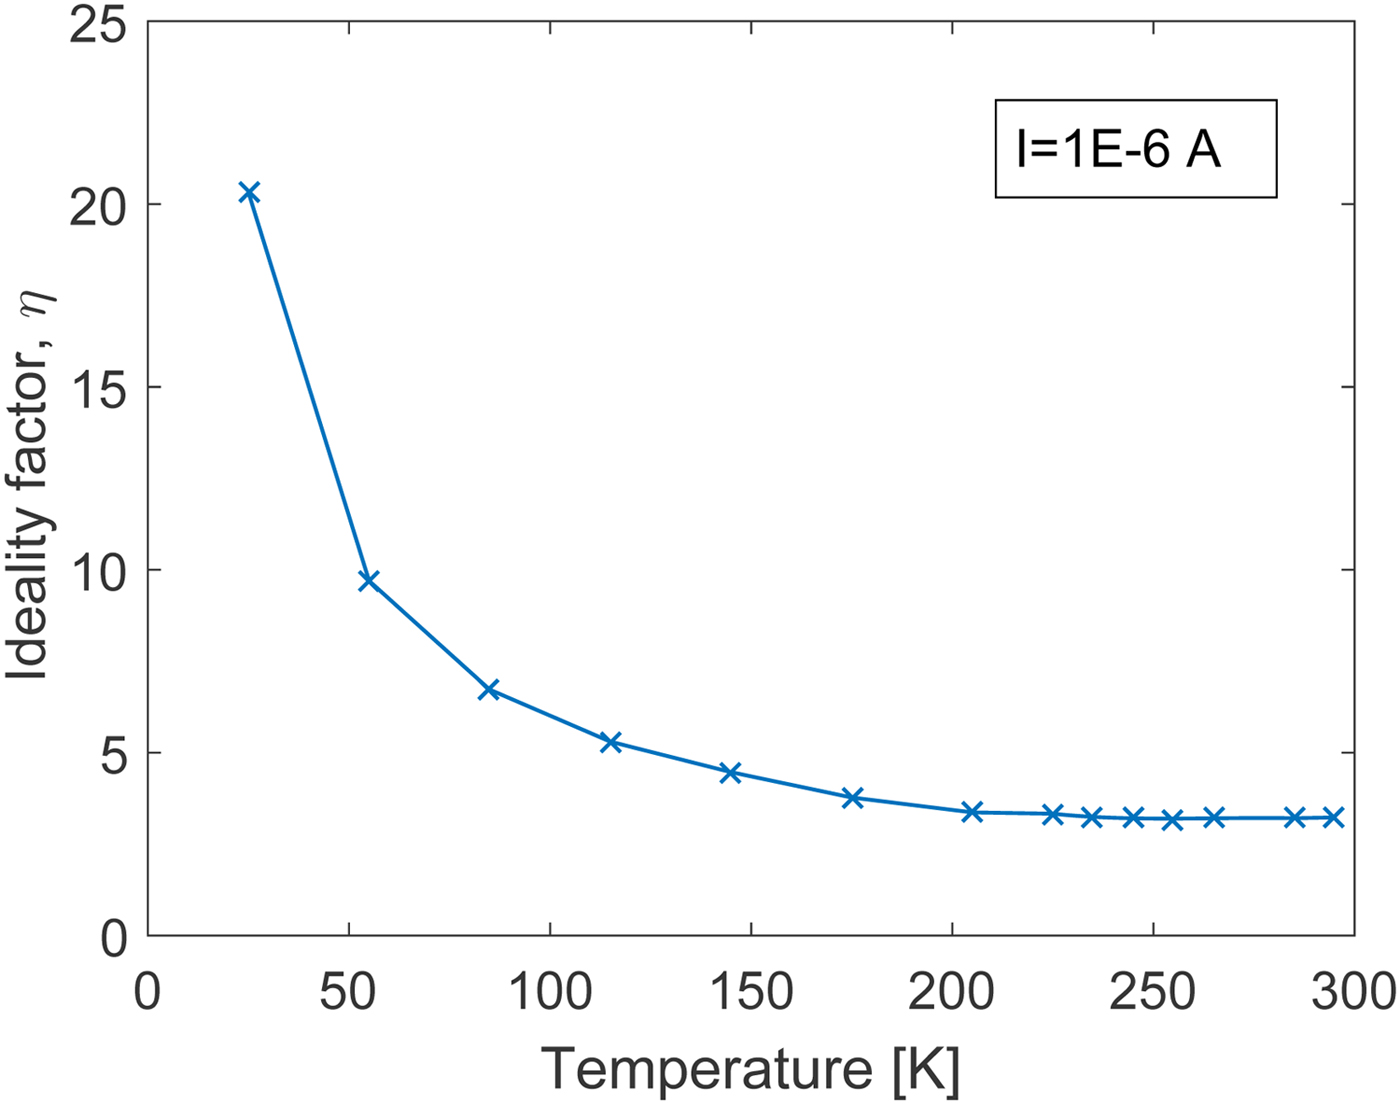
To investigate the current transport at cryogenic temperatures in more details, Fig. 2 shows the ideality factor
 $$\eta = \displaystyle{q \over {kT}}\left( {\displaystyle{{dV} \over {d\ln I}}} \right)$$
extracted from the slope of the I–V characteristics at different temperatures. It is found that the ideality factor increases with decreasing temperatures. For a constant current level of  $1 {\times 10^{-6}}$ A the ideality factor changes from a value of ~3.2 at 295 K to ~20.3 at 25 K. The increase in ideality factor with decreasing temperature may be explained in part by a tunneling component as described by the thermionic-field-emission and field-emission transport theory of Padovani and Stratton [Reference Padovani and Stratton10]. It may also be a consequence of inhomegeneities at the metal–semiconductor interface [Reference Gammon, Tomas, Shah, Vavasour, Donchev, Pang, Myronov, Fisher, Jennings, Leadley and Mawby11]. A possible physical explanation for the electron transport in the presence of such interfacial inhomegeneities has been proposed by Tung [Reference Tung12]. According to Tung's model, current transport across the Schottky barrier is affected by parasitic patches with lower barrier heights than the background. The effect of the parasitic patches will be hardly noticeable at room temperature but manifest themselves at lower temperatures [Reference Korucu, Turut and Efeoglu13]. The Richardson's plot is shown in Fig. 3. According to (2) a plot of
 $\ln (I_s/T^2)$ versus
 $(kT)^{-1}$ should yield a straight line with slope of
 $-\Phi _b$ and intersect of
 $\ln (AA^{\ast \ast})$. From Fig. 3 it is clearly seen that the extracted saturation currents do not follow the expected linear trend in the Richardson's plot. This is a further confirmation that the current transport can-not be described by thermionic emission and may be affected by parasitic patches with a lower barrier heights than the background. Therefore, for improved accuracy at cryogenic temperatures our compact modeling approach implements a parallel conduction model description to account for the effect of parasitic patches on the forward I--V characteristics.
Extracted ideality factor dependence on temperature in the range 25–295 K for a constant current of  $1 {\times 10^{-6}}$ A.
Richardson's plot in the temperature range of 25–295 K for a constant current of  $1 {\times 10^{-6}}$ A.

Schottky-barrier varactor modeling
The standard quasi-static lumped-element model of a Schottky diode, consisting of the parallel dynamic junction conductance and capacitance followed by a fixed series resistance, is known to be of limited validity at millimeter- and submillimeter waves [Reference Pardo, Grajal, Perez-Moreno and Perez14]. For this frequency range, the Schottky diode model must be extended to take into account of the charge-carrier inertia and displacement current in the undepleted part of the device. The frequency dependence of the spreading resistance in the  $n^{+}$-doped GaAs substrate due to the skin effect must also be taken into account [Reference Dickens15]. At the plasma frequency, where the inductive effect associated with the charge-carrier inertia resonate with the capacitive effect associated with the displacement current, the losses in the device increase sharply. At millimeter- and submillimeter- waves the charge-carrier inertia and displacement current in the substrate can be neglected [Reference Crowe16]. For the low to moderately doped GaAs epilayer, however, the carrier inertia and displacement current can have a strong effect on the performance at submillimeter waves [Reference Crowe16,Reference Kelly and Wrixon17]. The extended model for a homogeneous Schottky-barrier varactor is shown in Fig. 4(a). The parallel conduction model in Fig. 4(b) is proposed here to account for the inhomegenities associated with the Schottky-barrier varactor diode stack. The models shown in Figs 4(a) and 4(b) are implemented as Symbolic Defined Devices (SDDs) in Keysight ADS. For a consistent SDD implementation the capacitive elements must be defined in terms of voltage-dependent charge functions. The inductive elements must be defined in term of current-dependent fluxes. As the flux is dependent on the current flowing through the inductive element it must be defined using an implicit expression in our SDD implementation.
(a) Extended homogeneous Schottky-barrier varactor model valid far below the plasma frequency of the substrate. (b) Parallel conduction model for inhomogeneous Schottky barriers.

Forward I–V –T characteristics
From the characterization of the Schottky-barrier varactor in the previous section, it was found that the thermionic-emission theory alone cannot describe the current transport taking place in the Schottky-barrier varactor. From the increase in ideality factor with decreasing temperature, it is plausible that tunneling through the barrier contributes to the current transport [Reference Sze and Ng8]. The expected importance of the tunneling current at a given temperature can be assessed by comparing the thermal energy, kT, to the characteristic energy for tunneling,  $E_{00}$. At low temperatures where
 $kT {\ll }E_{00}$, tunneling through the barrier at an energy-level corresponding to the Fermi-level is the dominating transport mechanism. This current transport mechanism is called field-emission. In the temperature range where
 $kT\approx E_{00}$, thermionic-field-emission dominates where thermally excited carriers tunnels through a narrower barrier than at field-emission. Thermionic-emission is expected to be the dominating current transport mechanism only for higher temperatures where
 $kT {\gg }E_{00}$. Analytical expressions for the current transport by field-emission and thermionic-field emission have been derived by Padovani and Stratton [Reference Padovani and Stratton10]. These expressions, however, are generally too complicated to form the basis for a compact modeling formulation. Instead, a current transport model which combines the main features of the field-emission, thermionic-field-emission, and thermionic-emission transport mechanisms has been proposed [Reference Louhi, Raisanen and Erickson4]. This transport model modifies the forward transport current into
 $$I_j = AA^{\ast \ast}\Theta (T)^2\exp \left( {\displaystyle{{ - q\Phi _b} \over {k\Theta (T)}}} \right)\left[ {\exp \left( {\displaystyle{{qV_j} \over {k\Theta (T)}}} \right) - 1} \right]$$
where the so-called slope-parameter  $\Theta (T)=\eta T$ has been introduced. The temperature dependence of the slope-parameter is given as
 $$\Theta (T) = \Theta _f\coth \left( {\displaystyle{{\Theta _f} \over T}} \right)$$
with
 $$\Theta _f \approx \alpha \displaystyle{{q\hbar } \over k}\sqrt {\displaystyle{{N_d} \over {4{\rm \epsilon }_sm^{\ast}}}} $$
where ℏ is the reduced Plank's constant,  $N_d$ is the doping of the epilayer,
 $\epsilon _s$ is the semiconductor permittivity, and
 $m^{\ast}$ is the effective mass of electrons in the conduction band. From above it is observed that the temperature dependence of the I–V characteristic for a given metal–semiconductor contact are determined alone by two unknown parameters; the barrier height and the doping of the epilayer. A scaling factor, α, is introduced in our modeling approach for added flexibility. Equation (4) has the property of reducing to the field-emission equation of Padovani and Stratton in the limit of
 $T\rightarrow 0$ K. In the high-temperature limit,
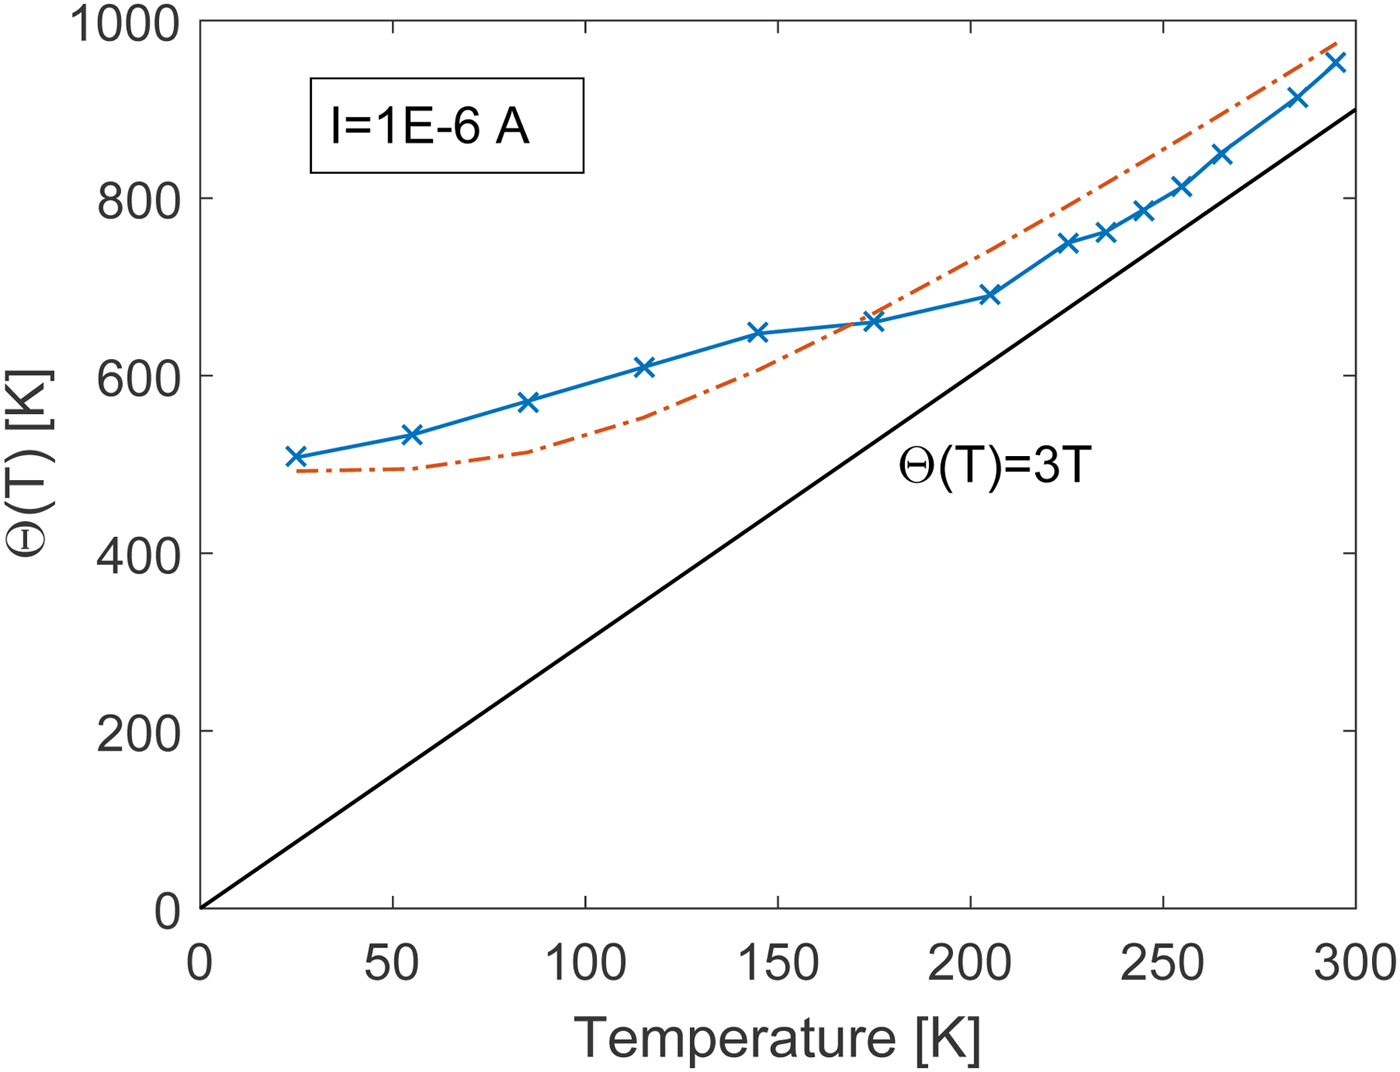
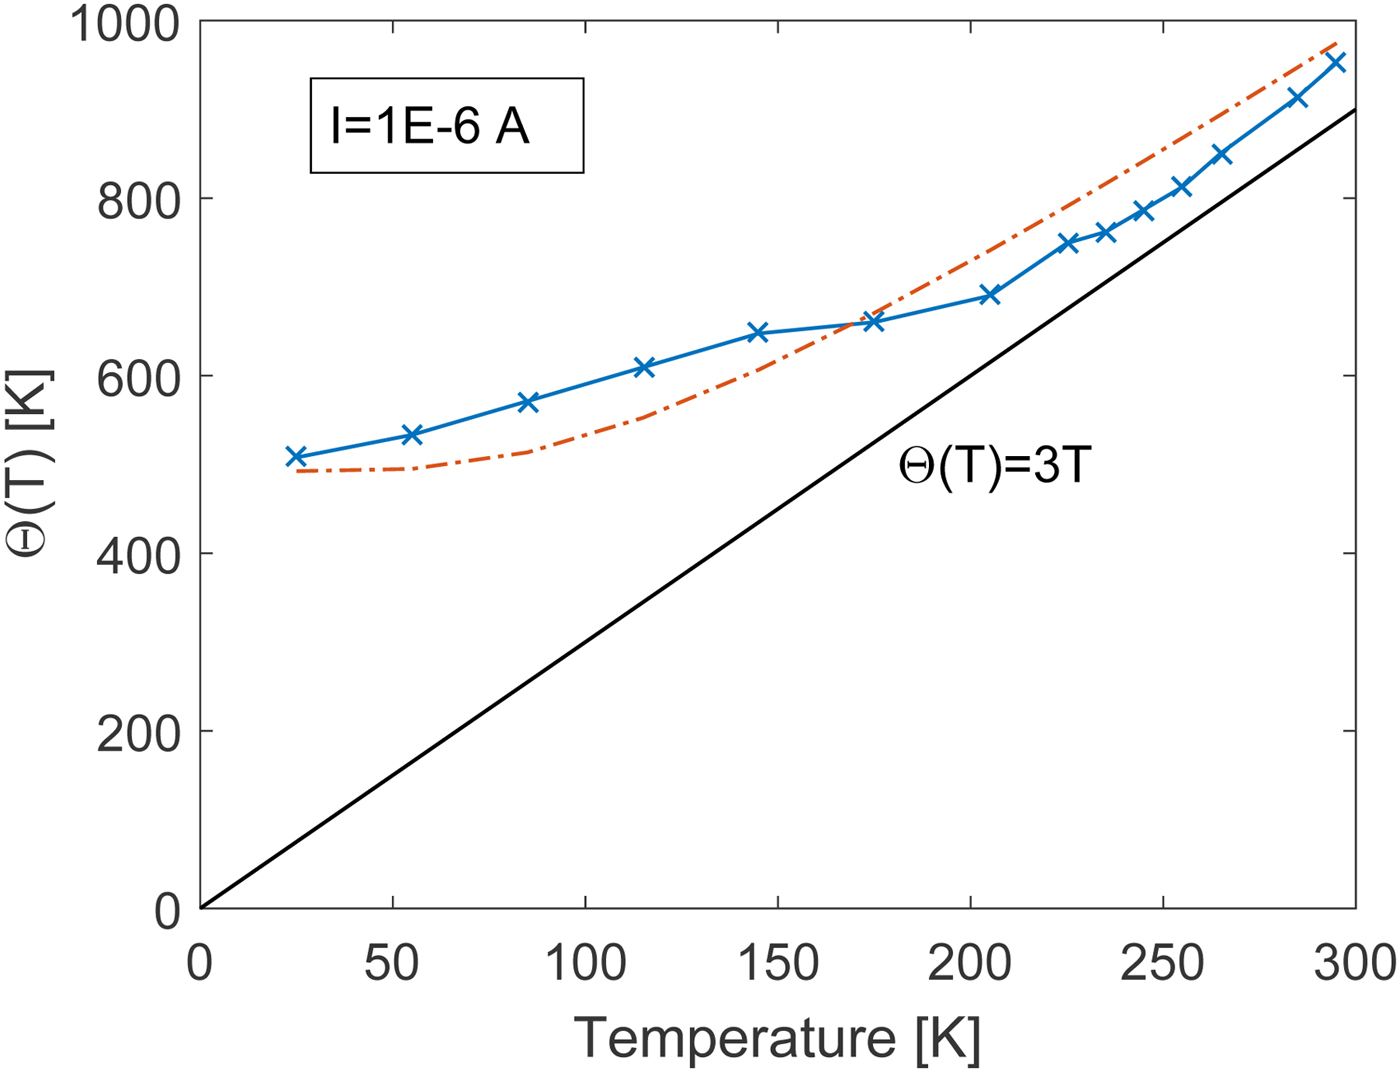
 $\Theta (T)\rightarrow T$, and (4) becomes identical to the ideal thermionic-emission expression corresponding to (1). It is interesting to investigate the validity of (4) for the Schottky-barrier varactor triple-anode diode stack considered in the previous section. To this end, the slope parameter at each temperature is extracted from the I–V characteristic at a constant low-current level of 1
 $\times 10^{-6}$ A. Figure 5 shows the extracted slope parameters compared with a calculated model response using (5) and (6) with
 $\alpha =1.59$,
 $N_d=2E17$ cm−3,
 $\epsilon _s=12.9 \epsilon _0$, and
 $m^{\ast}=0.068\;m_0$. To model the effect of a triple-anode diode stack a leading multiplication factor of 3 is included in the calculation of the slope parameter. This factor is necessary as the applied voltage will divide equally across the individual diodes of the stack. The factor of 3 is observed to also have an influence on the saturation current. Therefore, an effective barrier height of three times that of a single diode is used in our model formulation. The leading factor of 3 on the slope parameter may still seem to modify the temperature dependence of the saturation current as given by the
 $\Theta (T)^2$ term of (4). It should be noticed, however, that the compact model formulation as given by (7)and (8) leads to the correct temperature dependence as the factor of 3 divides out. The slope parameter can actually be seen as an effective temperature of the Schottky-barrier varactor. Therefore, a plot proportional to
 $3\,T$ is also included as a reference in Fig. 5. In the high-temperature range, this plot approaches the extracted slope parameter and thermionic emission will dominate the current transport. For a compact model implementation, the I–V characteristic in (4) can be formulated in terms of an temperature-dependent saturation current
 $I_s(T)$ and temperature-dependent ideality factor
 $\eta (T)$ as
 $$I_j = I_s(T)\left( {\exp \left( {\displaystyle{{qV_j} \over {\eta (T)kT}}} \right) - 1} \right)$$
similar to the standard diode equation in (1). The temperature dependence of the saturation current, however, is evaluated as
 $$\eqalign{& I_s(T) = I_s(T_{nom})\left( {\displaystyle{{\Theta (T)} \over {\Theta (T_{nom})}}} \right)^2 \cr & \times \exp \left( {\displaystyle{{q\Phi _b} \over k}\left( {\displaystyle{1 \over {\Theta (T_{nom})}} - \displaystyle{1 \over {\Theta (T)}}} \right)} \right)} $$
where  $I_s(T_{nom})$ represents the saturation current extracted at the model reference temperature
 $T_{nom}$. Similarly, the temperature-dependent ideality factor is evaluated as
 $$\eta (T) = \eta (T_{nom})\displaystyle{{\Theta (T)} \over T}\displaystyle{{T_{nom}} \over {\Theta (T_{nom})}}$$
where  $\eta (T_{nom})$ is the ideality factor extracted at
 $T_{nom}$.




The expression for the forward I–V characteristic in (7) remains valid for the triple-anode varactor diode stack only up to the so-called flat-band condition [Reference Kollberg, Zirath and Jelenski18]. The flat-band condition is given as  $V_{fb}=V_{bi}-V_j=3 \times kT/q$ where the built-in potential has been introduced. The built-in potential is determined in terms of the barrier height and epilayer doping as
 $$V_{bi} = \Phi _b - 3 \times \displaystyle{{kT} \over q}\ln \left( {\displaystyle{{N_c} \over {N_d}}} \right)$$
with  $N_c$ representing the effective density of states in the conduction band for GaAs. At voltages above flatband the device will act like a resistor. To model this resistive behavior a linear extrapolation of the I--V characteristic in (4) above flatband is proposed
 $$I_j = I_s(T)\left( {\exp \left( {\displaystyle{{qV_{\,fb}} \over {\eta (T)kT}}} \right)\left( {1 + \displaystyle{{q(V_j - V_{\,fb})} \over {\eta (T)kT}}} \right) - 1} \right).$$
Conduction above flatband becomes important to accurately model the current flow at cryogenic temperatures in the presence of barrier inhomogeneities as discussed next.
Modeling barrier inhomogeneities
It was shown in the section “Schottky-barrier varactor characterization” that the Richardson's plot could not be described in terms of the thermionic-emission theory using a single constant barrier height. With the increased insight following from the discussion in the section “Forward I–V –T characteristics” it can be seen that one should actually plot 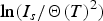 ${\rm ln}(I_s/\Theta (T)^2)$ versus
 $(k\Theta (T))^{-1}$ to extract the barrier height
 $\Phi _b$ from the slope. It is found, however, that the slope is not constant over temperature even with this improved extraction technique. As shown in Fig. 6 the extracted effective barrier height for a single anode shows a nearly linearly decreasing trend with the inverse of the effective temperature
 $\Theta (T)$. Such an observation can be explained by the presence of barrier inhomogeneities. Werner and Güttler [Reference Werner and G”uttler19] have shown that a spatial fluctuating Schottky contact with Gaussian barrier distribution can be described as
 $$\Phi _b = \Phi _b^0 - \displaystyle{{\sigma _s^2 } \over {2k\Theta (T)}}$$
where  $\Phi ^{0}_{b}$ is the mean barrier height and
 $\sigma _{s}$ is the standard deviation. In (12), we have substituted the temperature as given in [Reference Werner and G”uttler19] with the slope parameter
 $\Theta (T)$ to account for field emission and thermionic-field emission. As shown in Fig. 6 the extracted effective barrier height can be reasonably well represented by (12). It should be mentioned that a refined model of barrier inhomogeneities has been proposed by Tung [Reference Tung12] where a bias voltage dependence is included for the effective barrier height. Based on the experimental available data for the triple-anode varactor stack there seems to be little evidence that the voltage dependence is significant. The effect of barrier inhomogeneities on the forward I--V --T characteristics is subtle. For a homogeneous Schottky contact it is well known that the bias voltage necessary to reach a given current level increases at lower temperatures due to the temperature dependence of the slope parameter. In the presence of barrier inhomogeneities, regions of the Schottky contact will have a lower barrier than expected for the given metal-semiconductor material system. As a consequence, the flatband condition is reached earlier for the regions with low-barrier heights than for the higher barrier regions. Once the flatband condition is reached, the low-barrier regions stops to contribute significantly to the overall current conduction and the higher barrier regions begins to dominate. It is not sufficient to implement the effective barrier height as given in (12) into our compact model formulation as the current conduction caused by regions with different barrier heights cannot be predicted in this way. Instead a parallel conductance model must be applied. As was shown by Ohdomari and Tu [Reference Ohdomari and Tu20] the effective barrier height of a parallel conductance model consisting of a high-barrier region of area
 $A_{hb}$ and a low-barrier region of area
 $A_{lb}$ can be represented as
 $$\eqalign{ \Phi _b & = - \displaystyle{{k\Theta (T)} \over q}\ln \left( {X_j\exp \left( {\displaystyle{{ - q\Phi _{hb}} \over {k\Theta (T)}}} \right)} \right. \cr & + \left. {(1 - X_j)\exp \left( {\displaystyle{{ - q\Phi _{lb}} \over {k\Theta (T)}}} \right)} \right)} $$
where  $\Phi _{hb}$ and
 $\Phi _{lb}$ is the barrier height associated with the high- and low-barrier regions, respectively, and
 $X_j=A_{hb}/(A_{hb}+A_{lb})$ is the fraction of the total Schottky contact area allocated to the high-barrier region. A similar modeling approach is followed here. For added flexibility, however, the slope factors for both contacts are allowed to be different in our modeling approach. This is implemented through different fitting factors,
 $\alpha _{hb}$ and
 $\alpha _{lb}$, for the high and low barriers, respectively. Figure 7 shows the parallel conduction modeling compared with the measured forward I–V –T characteristics discussed in Section “Schottky-barrier varactor characterization”. For clear illustration I–V characteristics for a temperature increment of 30 K is shown. In general, the parallel conduction model is able to accurately reproduce the measured I–V –T characteristics the full range of temperatures from 25 to 295 K. The parallel conduction model requires a total of eight parameters. Their values corresponding to a triple-anode varactor stack are given in the caption of Fig. 7. The effect of barrier inhomogeneities can be deactivated from the model by setting the area distribution factor to
 $X_j=1.0$. It is interesting to notice that even though only 2 % of the total area is allocated to the low-barrier region, it has a strong effect on the modeled I–V characteristics at cryogenic temperatures. The modeling at the lowest temperatures of 25 and 55 K can be improved by implementing more junctions in parallel. As the main interest for the present work is to demonstrate improved modeling of multiplier performance down to 77 K the extra model complexity is not worthwhile.
Extracted effective barrier height plotted versus  $1000/\Theta (T)$ for a constant current of
 $1 {\times 10^{-6}}$ A. The dashed line shows the calculated model response using (12) with
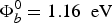 $\Phi ^{0}_{b}=1.16\;\;{\rm eV}$ and
 $\sigma ^{2}_s=0.075\;\;{\rm eV}^2$.

Measured (symbols) and modeled (dashed lines) forward I--V --T characteristics. The model is based on the parameters:  $I_s=1.475 {\times 10^{-13}}$ A,
 $\eta =3.2$,
 $\Phi _{hb}=2.96$ eV,
 $N_d=2E17$ cm−3,
 $\alpha _{hb}=1.59$,
 $X_j=0.98$,
 $\phi _{lb}=2.12$, eV,
 $\alpha _{lb}=0.71$.

C--V characteristic
The junction capacitance of the Schottky-barrier triple-anode stacked varactor diode is modeled as
 $$C_j = \displaystyle{{C_{\,jo}} \over {\sqrt {1 - (V_j/V_{bi} - 3(kT/q)} )}} + C_{corr}$$
where  $C_{jo}$ is the zero-biased junction capacitance and
 $C_{corr}$ is a first-order correction term for edge effects in very small submillimeter-wave diodes. The singularity at high forward bias in (14) is avoided by a linear extrapolation of the junction capacitance above the voltage
 $F_cV_j$ where
 $F_c$ is a factor between 0 and 1.
Series impedance
The series impedance of the Schottky varactor stack contains three contributions; the impedance,  $Z_{epi}(j\omega )$, due to the undepleted part of the epilayer, the spreading resistance,
 $R_{sub}$, of the heavily doped substrate layer including the frequency-dependent skin-effect impedance
 $Z_{skin}(j\omega )$, and the contact resistance. The contact resistance is absorbed into the substrate resistance in our modeling approach. Furthermore, it is assumed that only the resistive part of the epilayer impedance varies with the temperature. The temperature dependence is mainly due to the bulk mobility,
 $\mu _n(T)$, of moderate doped n-type GaAs. The low-frequency series resistance of the Schottky varactor stack can be partitioned into two parts using the parameter
 $X_r$ according to
 $$\eqalign{ R_s(T) & = X_rR_s(T_{nom})\left( {\displaystyle{T \over {T_{nom}}}} \right)^{0.89} \cr &\quad + (1 - X_r)R_s(T_{nom})} $$
where the exponent of 0.89 is proposed to account for the expected temperature dependence of the bulk mobility for GaAs [Reference Tang, Schlecht, Lin, Chattopadhyay, Lee, Gill, Mehdi and Stake21]. The first and second terms in (15) describes the parts of the low-frequency series resistance allocated to the epilayer and substrate, respectively. For an accurate prediction of multiplier efficiency, it is necessary to include the velocity saturation of the mobile carriers in the undepleted part of the epilayer which occurs at high-current levels [Reference Kollberg, Tolmunen, Frerking and East22]. This is implemented in the SDD model using an empirical current-dependent function
 $$R_{epi}(T,i(t)) = R_{epi0}(T,i(t) \approx 0)\left( {1 + {\left( {\displaystyle{{i(t)} \over {i_{sat}(T)}}} \right)}^6} \right)$$
where  $R_{epi0}(T,\, i(t)\approx 0)$ is the epilayer resistance before the onset of current saturation,
 $i(t)$ is the current flowing through the epilayer and
 $i_{sat}(T)$ is a characteristic current for the onset of velocity saturation effects. This approach is similar to that of Kollberg et al. [Reference Kollberg, Tolmunen, Frerking and East22]. The temperature dependence of the characteristic current is implemented as
 $$i_{sat}(T) = i_{sat}(T_{nom})\left( {\displaystyle{T \over {T_{nom}}}} \right)^{ - 0.37}$$
which corresponds to an expected increase of 65 % for the saturated velocity of GaAs at 77 K [Reference Louhi, Raisanen and Erickson4]. The displacement current in the epilayer is modeled as a linear temperature-independent capacitance
 $$C_{epi} = \displaystyle{1 \over {R_{epi}(T_{nom})\omega _d}}$$
where  $\omega _d=qN_d\mu _n(T_{nom})/\epsilon _s$ is the dielectric relaxation frequency [Reference Crowe16]. As the temperature dependence of the epilayer resistance and the dielectric relaxation frequency both depends on the bulk mobility but in an opposite manner it is justified to assume a temperature-independent epilayer capacitance. The carrier inertia is modeled as a linear temperature-independent inductance
 $$L_{epi} = R_{epi}(T_{nom})/\omega _s$$
where  $\omega _s=q/m^{\ast}\mu _n(T_{nom})$ is the scattering frequency [Reference Crowe16]. Again it is well justified to assume temperature independence for the epilayer inductance.
The impedance of the substrate layer must include the increase with frequency due to the skin effect. In our modeling approach, the frequency dependence of the impedance of the substrate layer is implemented as
 $$\eqalign{& Z_{sub}(\,j\omega ) = R_{sub} + Z_{skin}(\,j\omega ) \cr & = R_{sub}\left( {1 + \displaystyle{{R_{skin}(\,j\omega _{skin})} \over {R_{sub}}}\sqrt {\left( {\displaystyle{{2j\omega } \over {\omega _{skin}}}} \right)} } \right)} $$
in terms of the skin-effect resistance  $R_{skin}(j\omega _{skin})$ at frequency
 $\omega _{skin}$. The frequency-dependent substrate impedance is implemented in the SDD by applying a frequency-dependent weighting function to the low-frequency resistive part of the substrate impedance,
 $R_{sub}$.
Reverse breakdown
The reverse breakdown is the limiting mechanisms for the Schottky-barrier varactor at high reverse voltages. The reverse breakdown is modeled using the standard ADS implementation. The empirical formulation leads to an exponentially increase in current conduction for reverse voltages exceeding the breakdown voltage
 $$I_{br} = - I_{bv}\exp \left( { - \displaystyle{{q(V_j + BV)} \over {kTN_{bv}}}} \right) + I_{bv}\exp \left( { - \displaystyle{{qBV} \over {kTN_{bv}}}} \right)$$
where BV is the breakdown voltage,  $I_{bv}$ the breakdown saturation current, and
 $N_{bv}$ the breakdown ideality factor.
Self-heating
A first-order thermal network, similar to the one described in [Reference Johansen, Rybalko, Zhurbenko, Bowen, Hesler and Ardenkjær-Larsen6], is included into our model formulation to simulate self-heating effects.
Efficiency of millimeter-wave frequency multipliers at cryogenic temperatures
Cryogenic setup
A commercially available D200 frequency doubler from VDI has been used to experimentally study the performance at cryogenic temperatures and to validate the diode model. The D200 frequency doubler was optimized for 188 GHz output frequency operation by controlling the bias voltage. The input signal was generated by a narrow-band microwave source providing 207 mW of power at 94 GHz. The generated power level was verified by a VDI Erickson power meter PM5. The experimental setup is shown in Fig. 8. To reach the doubler temperature of 77 K the Dewar flask (1) is filled with liquid nitrogen. The doubler is placed directly into the Styrofoam container (2) minimizing the thermal losses and providing thermal isolation while maximizing cooling efficiency. To control the temperature the calibrated temperature meter Omega HH804U (3) was used. A platinum resistance temperature detector (RTD) head is placed directly on the surface of the doubler block to maximize the temperature measurement accuracy. The Schottky-junction temperature is expected to be somewhat higher due to power dissipation in the device.
Photograph of the experimental setup, complete view.

To be able to control the temperature of the multiplier, helium gas is applied from the balloon through a pipe directly to the input valve of the Dewar flask. Helium gas flow can change the cooled evaporation rate of the liquid nitrogen from the output valve. In this way, the temperature inside the Styrofoam container can be adjusted. The performance of the doubler was measured with 10 K step at temperatures from 77 to 300 K. The output signal was recorded by an Agilent Spectrum Analyzer with OML mixers.
Uncertainties in the experimental setup over temperature is expected to come from the platinum RTD Omega HH804U and from the VDI Erickson power meter PM4. All equipment has factory calibration. For the platinum resistance temperature detector the uncertainty (error) is ±0.01 K. The VDI Erickson power meter PM4 has an uncertainty ±0.01 mW.
Millimeter-wave balanced doubler design
The frequency doubler is based on a varactors diode chip with a total of six anodes in a anti-series balanced configuration [Reference Porterfield, Crowe, Bradley and Erickson7]. The principle schematic of the frequency doubler as used for the harmonic balance simulation is shown in Fig. 9. The advantage of the anti-series balanced configuration is suppression of odd-order harmonics, while the amplitude of the second harmonic is double as high as for the case of an unbalanced single-diode doubler. Three diodes are connected in series in each branch in order to enhance the power handling capability. The arrangement of three series diodes is equivalent to a single Schottky diode with three times the reverse breakdown voltage. In simulations, each triple diode series stack is represented with the compact model developed in the previous section. In the anti-series configuration, diode arrays are fed out-of-phase by an input signal source through a balancing transformer  $T_1$. Turns ratio of the transformer is equal to 1. The diodes are reverse biased with negative
 $V_d$, which is chosen to maximize efficiency at a given input power. DC blocking capacitors
 $C_{cl}$ are placed at the output of the transformer to prevent DC current flowing into the transformer. DC feeding inductors
 $L_{cl}$ are used to isolate the RF signal from DC voltage source and provide DC ground. The generator and load impedances (
 $Z_g$ and
 $Z_L$, respectively) are frequency dependent and chosen to maximize doubler efficiency.
 $Z_g$ is conjugate matched to the input impedance of the doubler at the frequency of the input signal and represents a short circuit at the second harmonic. The load impedance
 $Z_L$, on the other hand, is conjugate matched at the second harmonic of the input signal, and represents a short circuit at the frequency of the input signal. In this analysis, the losses in the matching circuits are neglected. In order to compare the efficiency as calculated by circuit simulation using the schematic in Fig. 9 to the measured flange-to-flange efficiency it is necessary to account for the input and output coupling losses. As proposed in [Reference Pardo, Grajal, Perez-Moreno and Perez14] the measured and simulated flange-to-flange efficiency,
 $\eta _{meas}$ and
 $\eta _{sim}$, respectively, can be related as
 $$\eta_{meas}=\alpha \beta \eta_{sim} $$
where β is the assumed coupling factor of the output power and α is the assumed coupling factor of the input power. The rather long waveguide leading from the 94 GHz source to the multiplier located inside the Dewar flask is estimated to have 1 dB of loss leading to an input coupling factor of  $\alpha \sim 0.8$. An output coupling factor of
 $\beta \sim 0.875$ is assumed similar to [Reference Pardo, Grajal, Perez-Moreno and Perez14].
Principle schematic of the circuit setup for harmonic balance simulation of frequency doublers in an anti-series configuration of diode arrays.

Varactor model verification
The harmonic-balance analysis is applied to the circuit in Fig. 9 to theoretically estimate doubler efficiency at a fixed input power of about 207 mW and frequency of interest 188 GHz. Initially values for the zero bias capacitance, breakdown voltage, series resistance, and embedded impedances are taken from [Reference Porterfield23] for a similar 200 GHz frequency doubler. These parameters are given in Table 1 together with the optimized parameters taking into account the measured zero bias capacitance of 26 fF and breakdown voltage of 26 V for the triple-anode stack varactors in the present D200 frequency doubler. The series resistance,  $R_s$, and zero-bias capacitance,
 $C_{jo}$, model parameters controls the efficiency at room temperature together with the embedded impedances and the bias voltage. The partitioning factor,
 $X_r$, for the series resistance controls the improvement of the efficiency with reduced temperature and is initially set to 0.6. The graph in Fig. 10 shows estimated and measured efficiency versus temperature using the initial parameters and the optimized parameters for the present doubler. The measured efficiency of the doubler improves from ~21% at 300 K to ~31.5% at 77 K and confirms the expected improvement with cooling. The simulated efficiency using the initial parameters overestimates the measured efficiency of the doubler, whereas the optimized parameters show good agreement. From Fig. 10 some deviation is observed around the temperature range from 150 to 200 K. Given the low uncertainty in the measurement of the block temperature this deviation cannot be attributed alone to measurement inaccuracy. An assumption in the comparison shown in Fig. 10 is that the junction temperature of the Schottky-barrier varactor is the same as the block temperature. This is not necessarily the case due to the aforementioned self-heating and thermal coupling effects. Another possible explanation could be that the mobility versus temperature characteristic is more complicated than the power law assumed here. For the optimized case the series resistance remains at a value of 12.0 Ω for a best estimate of the measured efficiency at room temperature. The partitioning factor is lowered to 0.47 to capture the slope of the efficiency versus temperature curve. The complete list of model parameters for the Schottky-barrier varactor using the triple-anode diode stack is summarized in Table 2. Not all model parameters are of equal importance for the prediction of the measured efficiency of the 200 GHz doubler. In particular, parameters describing current saturation, carrier inertia, and displacement current in the epilayer, and the skin effect in the substrate layer are superfluous for the considered 200 GHz doubler. These effects, however, will become limiting factors for frequency multipliers at higher frequencies and should be included for a versatile compact model formulation. The parameters describing current saturation, carrier inertia, and displacement current in the epilayer can be calculated from well-known physical quantities for the used semiconductor material (e.g. doping, mobility, saturated velocity, and effective mass of electrons). If necessary, the skin-effect resistance
 $R_{skin}$ at frequency
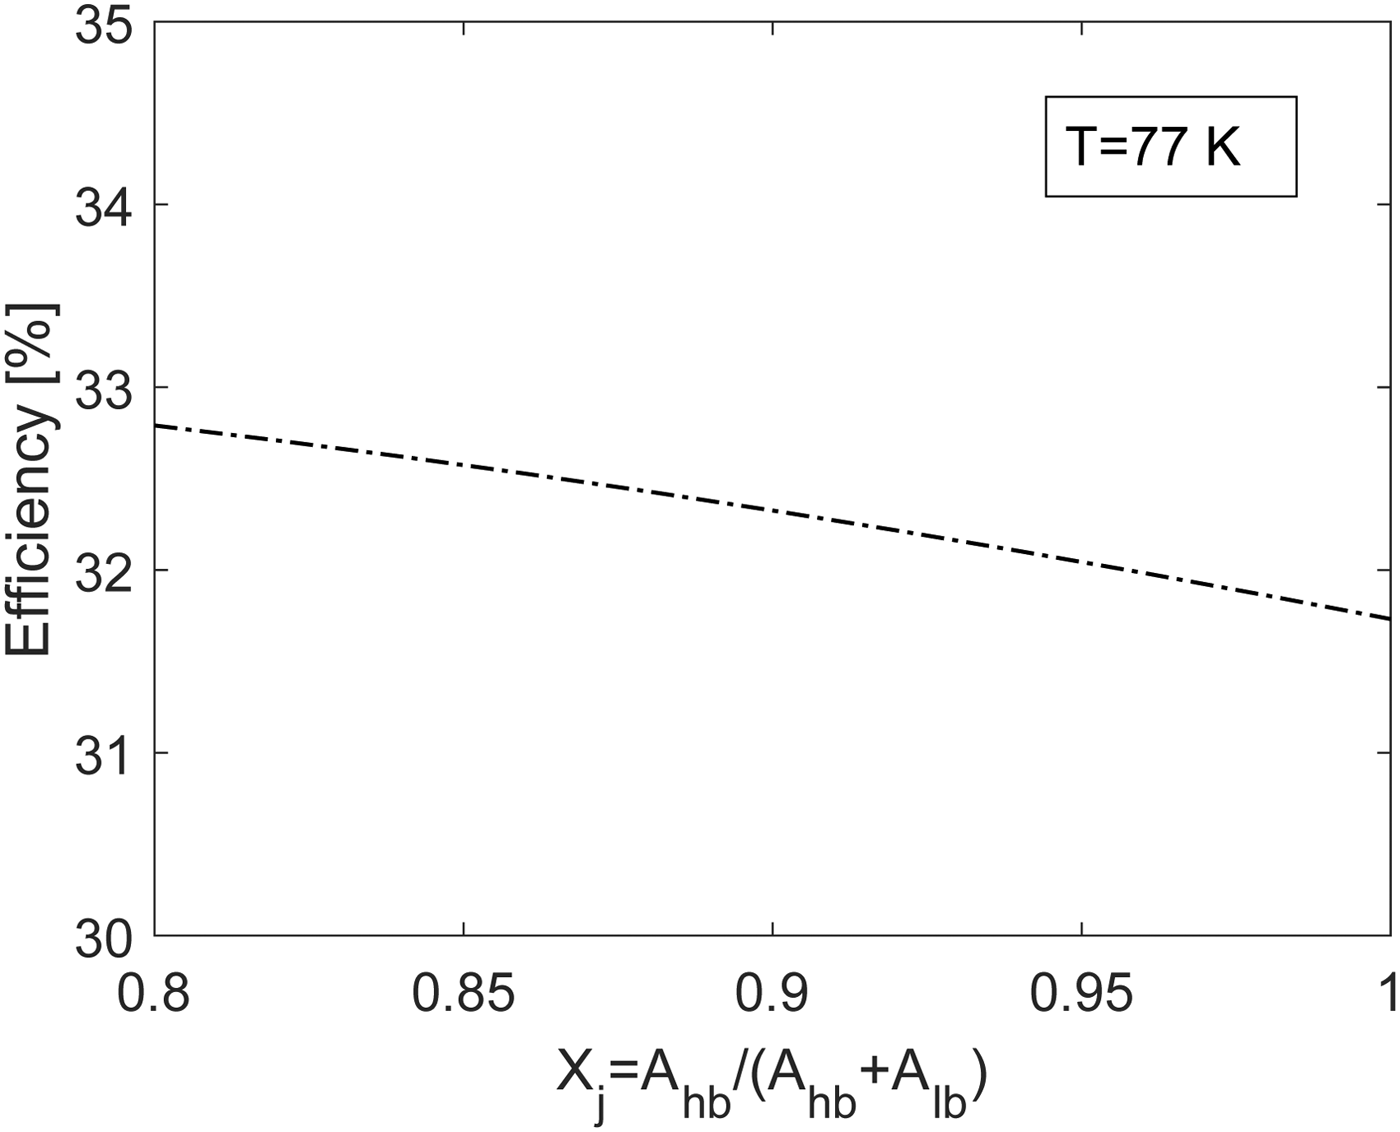
 $f_{skin}$ can be determined from the additional series resistance needed to fit the room temperature efficiency. This assumes that the DC resistance has been reliable extracted. The barrier inhomogeneities was seen to have a significant effect on the forward I--V curves at cryogenic temperatures. It is interesting to investigate the influence of barrier inhomogeneities on the efficiency of the 200 GHz doubler. The effect is expected to be strongest at lowest temperatures. Therefore Fig. 11 shows the simulated efficiency at 77 K for a high-barrier area to total barrier area ratio ranging from 0.8 to 1.0. It is observed that the influence on the simulated efficiency going from
 $X_j$=0.8 to 1.0 is minor. A possible explanation for this is that the input source drive level at 94 GHz is not sufficient to drive the varactor deep into its forward conduction region. Also, the signal swing across each diode stack remains negative for most part of the cycle. Multipliers which experience larger degree of forward conductance are expected to show greater dependence on barrier inhomogeneities.
Efficiency versus temperature. Solid line with crosses represents measured efficiency. Dashed line represents initial simulated efficiency using  $C_{jo}=18.7$ fF and
 $V_{BV}=28.5$ V while solid line represents the optimized simulated efficiency using
 $C_{jo}=26$ fF and
 $V_{BV}=26$ V.

Simulated efficiency versus high-barrier to total barrier area at T=77 K.
Initial and optimized parameters

Model parameters for Schottky-barrier varactor

The developed model has also been used to evaluate the behavior of the 78 GHz balanced frequency doubler described in [Reference Porterfield, Crowe, Bradley and Erickson7]. For HB simulation the embedded impedances as simulated by HFSS have been used. A loss of 0.42 dB is assumed based on the discussion in [Reference Porterfield, Crowe, Bradley and Erickson7]. The main contribution to this loss comes from the output coupling at 78 GHz. Therefore, a value of  $\beta \sim 0.908$ is used while the input coupling loss is neglected. The input power to the circuit is assumed to be 200 mW. Compared with the model parameters in Table 2 the Schottky-barrier varactor model for the 78 GHz frequency doubler must take into account the difference in the doping level (
 $N_d=1E17$cm−3), junction capacitance (
 $C_{jo}=140$ fF per anode), breakdown voltage (
 $V_{BV}$=14 V per anode), and characteristic current for onset of saturation effect (
 $I_{sat}$=400 mA). The series resistance is set equal to its extracted value at DC,
 $R_s=1.2$ Ω per anode. Figure 12 shows that the measured data in the temperature range from 14 to 295 K. These data points have been extracted from [Reference Porterfield, Crowe, Bradley and Erickson7]. Using the measured DC resistance in the model overestimates the measured efficiency. Therefore, to fit the simulation results to the measured data at 295 K, an additional skin effect resistance of 0.7 Ω per anode at 39 GHz has been used. The slope of the efficiency versus temperature characteristic is fitted using the distribution parameter
 $X_r=0.6$. All other model parameters in Table 2 are kept as they are.
Efficiency versus temperature for 78 GHz frequency doubler. The measured data (solid line with symbols) are extracted from [Reference Porterfield, Crowe, Bradley and Erickson7]. The solid line represents the simulated efficiency.

The excellent fitting of the measured efficiency versus temperature characteristic all the way down to 14 K provides further verification of the developed Schottky-barrier varactor modeling approach.
Conclusion
In this work, the benefit of cryogenic cooling for millimeter-wave frequency doublers based on GaAs Schottky-barrier varactors has been studied. For this purpose a triple-anode diode stack mounted in a multiplier block has been characterized in the temperature range from 5 to 295 K. The measurements of the varactor's I–V–T characteristics reveal abnormal current transport other than thermionic emission. It was shown that the abnormal current transport can be explained in part by thermionic-field-emission and field-emission current transport and in part by barrier inhomogeneities. A dedicated compact model of the GaAs Schottky-barrier varactor taking these effects into account was described. It has been verified experimentally that the efficiency of a commercially available 188 GHz doubler improves up to 31.5% when cooled to 77 K. The main reason for the increasing efficiency with cooling is the drop in series resistance which is well predicted by the developed compact model. The model has also been verified to 14 K on a 78 GHz doubler.
 Tom K. Johansen received his M.S and Ph.D. degrees in Electrical Engineering from the Technical University of Denmark, Denmark, in 1999 and 2003, respectively. In 1999, he joined the Electromagnetic Systems group, DTU Elektro, Technical University of Denmark, Denmark, where he is currently an Associate Professor. From September 2001 to Marts 2002 he was a Visiting scholar at the Center for Wireless Communication, University of San Diego, California, CA. He has spent several external research stays at the Ferdinand Braun Institute (FBH), in Berlin, Germany. His research areas include the modeling of high-frequency solid-state devices, millimeter-wave and sub-millimeter-wave integrated circuit design, and reconfigurable microwave filter design.
 Oleksandr Rybalko was born in Sumy, Ukraine, in 1985. He received the M.Sc. and Ph.D. degrees in Electrical Engineering from Sumy State University (SSU), Ukraine, in 2007 and 2011, respectively. From 2011 to 2013, he was an Assistant Professor at the Nanoelectronics Department, SSU. From 2014 to 2017, he was a Postdoctoral Researcher at the Center for Magnetic Resonance, Department of Electrical Engineering, Technical University of Denmark. In 2017, he joined the Antenna Group, R&D Department, Oticon A/S, where he works as Antenna Designer. His research interests include THz electronics and techniques, antenna analysis and design, antenna measurement techniques.
 Vitaliy Zhurbenko received his M.Sc. degree in Electrical Engineering from the Kharkiv National University of Radio Electronics in 2001, and the Ph.D. degree from the Technical University of Denmark in 2008, all in Electrical Engineering. In 2005, he joined the Technical University of Denmark, where he is currently an Associate Professor. His present research interests include microwave and millimeter wave sensing for biomedical and security applications; microwave and millimeter-wave components and integrated circuits for instrumentation applications; antennas and passive circuit design and characterization; magnetic resonance technology.
 Berhanu T. Bulcha received the M.S. degree in Electrical Engineering from Virginia Commonwealth University, Richmond, VA, USA, in 2011, and the Ph.D. degree in Microwave Engineering from the University of Virginia, Charlottesville, VA, in 2015. During his graduate school, he was a design and test engineer of components and systems in the 1--5 THz range at the Virginia Diodes Inc. He is currently a research engineer at the NASA Goddard Space Flight Center, Instrument Systems and Technology Division. His research interests include development of superconductive detectors, novel Schottky-based submillimeter and submillimeter wavelength devices and systems, silicon micromachining of waveguide structures, and THz metrology for planetary science and astrophysics applications.
 Jeffrey L. Hesler is the Chief Technology Officer of Virginia Diodes and a Visiting Research Assistant Professor at the University of Virginia. His career is focused on the creation of new technologies that are making possible the full exploitation of the Terahertz frequency band for scientific, defense and industrial applications. He has published over 150 technical papers in refereed international conferences and journals, given talks at THz-focused workshops at conferences such as IMS & EuMW, is a member of IEEE TC MTT-4 on THz Technology and Applications and serves as a reviewer for a variety of IEEE & IEE journals. Terahertz systems based on Dr. Hesler's innovative designs are now used in hundreds of research laboratories throughout the world.