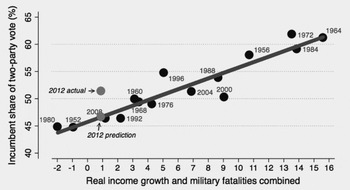
President Obama received approximately 51.5% of the two-party vote in the 2012 election. The last Bread and Peace Model forecast of Obama's vote share, based on advance estimates of 2012:quarter 3 personal income posted on October 26, 2012, by the Bureau of Economic Analysis (BEA), was 46.6%—lower than the 47.5% forecast appearing in the October issue of PS, which was based on July 27, 2012, BEA data. The Bread and Peace Model therefore underpredicted Obama's vote by 4 to 5 percentage points, equivalent to around 2 model standard errors. The president's vote therefore benefited from a +2-sigma composite shock to Bread and Peace Model fundamentals. Figure 1 shows actual and predicted values for 2012 in perspective of incumbent vote shares at all presidential elections 1952–2012.
Bread and Peace Voting in 2012—Actual and Predicted Values in Postwar Perspective
Combination of real growth and fatalities weights each variable by its estimated coefficient. Estimated effects of fatalities on vote shares: −0.7% in 2008 (Iraq), −7.4% in 168 (Vietnam), −9.7% in 1952 (Korea); negligible in 1964, 1976, 2004, 2012, and null in other years. Source: www.douglas-hibbs.com, November 11, 2012

My PS article in October emphasized that the Bread and Peace Model aims to pin down quantitatively the persistent influence of objectively measured political-economic fundamentals, rather than to predict vote shares optimally or to track them statistically after the fact. Consequently the model makes no use of time-coded variables or poll readings of presidential approval and vote intentions. It is not surprising that models incorporating the latter, along with generic poll data (especially those so skillfully aggregated by Nate Silver at 538) and betting price data (my personal prediction favorite), delivered the most accurate 2012 forecasts at all sensible preelection horizons. However, forecasts based on polls or betting prices yield no insight about causal forces driving political valuation and electoral choice—which are what the Bread and Peace Model is designed to identify. Models including both fundamental variables (almost always measures of economic performance) and poll readings of presidential approval rates or vote intentions supply some information about underlying causal forces, but I am unable to determine how much because poll variables clearly are endogenous. We learn nothing about the causes of electoral outcomes from correlations between aggregated poll data on preelection candidate sentiments and Election Day outcomes.
Demographic analyses of poll data suggest that partisan cleavage over immigration reform and reproductive rights were the main idiosyncratic issues behind President Obama overcoming the poor reelection prospects implied by weak economic performance. If those issues turn out to be enduring, I would be delighted to enhance the Bread and Peace Model with a composite “social” variable measuring their net, concrete effects on the electorate's aggregate wellbeing. But I do not know how to calibrate those net concrete effects objectively and ex-ante. Yet I believe immigration will prove to be transitory because in the wake of 2012 a widely accepted resolution of the issue will attract enough Republican support to pass comfortably on a bipartisan basis in the next Congress, and that will remove immigration tensions from the national political arena. I am more uncertain about reproductive rights. A decisive affirmation of Roe v. Wade by the Supreme Court (perhaps after a new appointment or two during Obama's second term) would put that issue to rest nationally as well, but I don't have much confidence in this conjecture.
Of course if every election were dominated by transitory, idiosyncratic issues—and there is no reason, in principle, why not—one would not observe the strong relationship of incumbent vote shares to Bread and Peace fundamentals graphed in the figure, notwithstanding the model's 2-sigma error in 2012.