Implications
Genotype imputation is now a routine application in genetic studies and breeding programs to obtain higher density markers with lower genotyping cost. However, the imputation accuracy of low-frequency and rare variants was not laudable with small single bred reference panel in livestock populations. In this study, the publicly available sequencing data were included to form a combined reference panel, which improved the imputation accuracy greatly, especially for low-frequency and rare variants. The imputation strategies investigated in this study provided useful solutions of genotyping in livestock breeding.
Introduction
Genotype imputation is now a common strategy to increase the power of genome-wide association studies (GWAS) (Marchini and Howie, Reference Marchini and Howie2010). Genotype imputation algorithms phase the haplotypes underlying observed genotypes in a reference panel to predict genotypes at missing or ungenotyped markers (Li and Al, Reference Li and Al2009; Marchini and Howie, Reference Marchini and Howie2010). Publicly available reference panels from the 1000 Genomes Project (Auton et al., Reference Auton, Brooks, Durbin, Garrison, Kang, Korbel, Marchini, McCarthy, McVean and Abecasis2015), the International HapMap Project (Altshuler et al., Reference Altshuler, Gibbs, Peltonen, Altshuler, Gibbs, Peltonen, Dermitzakis, Schaffner, Yu, Peltonen, Dermitzakis, Bonnen, Altshuler, Gibbs, de Bakker, Deloukas, Gabriel, Gwilliam, Hunt, Inouye, Jia, Palotie, Parkin, Whittaker, Yu, Chang, Hawes, Lewis, Ren, Wheeler, Gibbs, Muzny, Barnes, Darvishi, Hurles, Korn, Kristiansson, Lee, McCarrol, Nemesh, Dermitzakis, Keinan, Montgomery, Pollack, Price, Soranzo, Bonnen, Gibbs, Gonzaga-Jauregui, Keinan, Price, Yu, Anttila, Brodeur, Daly, Leslie, McVean, Moutsianas, Nguyen, Schaffner, Zhang, Ghori, McGinnis, McLaren, Pollack, Price, Schaffner, Takeuchi, Grossman, Shlyakhter, Hostetter, Sabeti, Adebamowo, Foster, Gordon, Licinio, Manca, Marshall, Matsuda, Ngare, Wang, Reddy, Rotimi, Royal, Sharp, Zeng, Brooks and McEwen2010) and the 1000 Bull Genomes consortia (Hayes et al., Reference Hayes, Fries, Lund, Boichard, Stothard, Veerkamp, Van Tassell, Anderson, Hulsegge and Guldbrandtsen2012) have been instrumental in discovering thousands of loci associated with diseases or traits in individual GWAS (Leeuwen et al., Reference Leeuwen, Sabo, Bis, Huffman, Manichaikul, Smith, Feitosa, Demissie, Joshi and Duan2016; Littlejohn et al., Reference Littlejohn, Tiplady, Fink, Lehnert, Lopdell, Johnson, Couldrey, Keehan, Sherlock, Harland, Scott, Snell, Davis and Spelman2016). However, imputation reference panels are not publicly available for most livestock species, such as pigs, chickens, horses and sheep.
Sequencing costs have rapidly decreased, and thus it has become acceptable to sequence a subset of a research population as a reference panel to perform genotype imputation with high accuracy. For example, in 25 sequenced brown layer chickens, the imputation accuracy from 600 K to whole-genome sequence (WGS) data were 0.91 for Minimac, 0.89 for FImpute and 0.90 for IMPUTE2 (Ni et al., Reference Ni, Strom, Pausch, Reimer, Preisinger, Simianer and Erbe2015). A study on dogs using 83 sequenced individuals across 15 breeds resulted in genotype concordance of 0.94 with IMPUTE2 from 80K single nucleotide polymorphism (SNP)-chip data to whole genome-level genotypes (Friedenberg and Meurs, Reference Friedenberg and Meurs2016). In horses, using 44 sequenced individuals, the mean imputation accuracy was 0.92 with Impute2 from 50 K SNP-chip data to sequence level genotypes (Frischknecht et al., Reference Frischknecht, Neuditschko, Jagannathan, Drogemuller, Tetens, Thaller, Leeb and Rieder2014). The genotype imputation accuracies in these species were very well for common variants, but declined rapidly for low-frequency variants. Previous studies have shown that enlarging the size of reference panels could considerably increase imputation accuracy, especially for low-frequency variants (Chou et al., Reference Chou, Zheng, Cheng, Yan, Wang, Han, Richards, Karasik, Kiel and Hsu2016). Although international genome consortia (such as 1000 Human Genomes or 1000 Bull Genomes Project) are not available for many species, hundreds or thousands of WGS data sets for some species are now available in several public databases (National Center for Biotechnology Information (NCBI); European Nucleotide Archive (ENA); BIG Data Center (BIG)). Adding these publicly available data to reference panels is an attractive method to increase the reference panel size. However, these publicly available data usually came from diverse breeds and had differences in linkage disequilibrium (LD) patterns. The differences of LD patterns between reference and target panel would significantly decrease the imputation accuracy. In addition, larger reference panel resulted in higher computing costs for pre-phasing and imputation (Browning and Browning, Reference Browning and Browning2016). Therefore, the comprehensive and systematic investigations to balance these factors on genotype imputation are very important in livestock.
In this study, we sequenced 24 key individuals from a yellow-feather dwarf broiler population as an internal reference panel and downloaded WGS data of 311 chickens from public databases as an external reference panel. We first assessed the impact of the internal and external reference panels, and the combined reference panel on imputation accuracy. Then we explored the impact of size of reference panel, the proportion of the internal reference panel in the combined reference panel and selection strategies for the external reference panel on the imputation accuracy. The results of study provide useful knowledge on ways to design and execute genotype imputation with a combined reference panel in a livestock population.
Material and methods
Data
A quality chicken population was used as an internal population in this study. This population was derived from a yellow-feather dwarf broilers breed and maintained for 25 generations by Wens Nanfang Poultry Breeding Co. Ltd (Xinxing, P.R. China). This population including 1600 birds (800 males, 800 females), was the 3rd batch of the 25th generation of this quality chicken population. These birds came from a mixture of full sib and half sib families with the mating of 30 males and 360 females from the 24th generation. After systemically phenotyped, a total of 450 birds were selected randomly for genotyped using the 600K Affymetrix® Axiom® (Shanghai Biotechnology Corporation, Shanghai, China) HD genotyping array (Kranis et al., Reference Kranis, Gheyas, Boschiero, Turner, Yu, Smith, Talbot, Pirani, Brew, Kaiser, Hocking, Fife, Salmon, Fulton, Strom, Haberer, Weigend, Preisinger, Gholami, Qanbari, Simianer, Watson, Woolliams and Burt2013). These birds were 15 male parents and 435 male offspring. And the average sire family size was 13.5 with a range of 7 to 23 in 435 genotyped male offspring. In addition, 24 key individuals were selected from the 450 birds for re-sequencing in order to maximize the expected genetic relationship (REL), which was described in detail by Druet et al. (Reference Druet, Macleod and Hayes2014). We utilized the marker-based genetic relationship matrix (G matrix) to replace the pedigree-based genetic relationship matrix (A matrix), to maximize expected genetic relationship between key individuals and the whole population. Detailed information about this population is in our previous study (Ye et al., Reference Ye, Yuan, Lin, Gao, Luo, Chen, Li, Zhang and Zhang2018).
External population was a total of 311 chickens from diverse chicken breeds. They were downloaded from 10 BioProjects in ENA or NCBI. BioProject numbers were PRJNA271711, PRJNA202483, PRJNA292383, PRJNA232548, PRJNA251505, PRJNA344300, PRJNA247952, PRJDB4092 (Ulfah et al., Reference Ulfah, Kawahara-Miki, Farajalllah, Muladno, Dorshorst, Martin and Kono2016), PRJNA241474 and PRJNA306389. The breeds included red junglefowls, green junglefowls, fighting chickens, Tibetan chickens, white leghorn chickens and so on. Detailed information about these 311 birds is in Supplementary Table S1.
Mapping and variant calling
Raw sequence reads per individual were mapped separately to galGal5 using the Burrows-Wheeler Alignment tool (BWA) version 0.7.12 (Li and Durbin, Reference Li and Durbin2009) with default parameters. The SAM format files generated from BWA were converted to BAM format files by SAMtools version 1.2 (Li et al., Reference Li, Handsaker, Wysoker, Fennell, Ruan, Homer, Marth, Abecasis and Durbin2009). After that, potential PCR duplicates were removed by the MarkDuplicates utility in Picard release 1.119 (https://sourceforge.net/projects/picard/files/picard-tools/1.119/). Local realignments were performed with the IndelRealigner utility of GATK version 3.7 (McKenna et al., Reference McKenna, Hanna, Banks, Sivachenko, Cibulskis, Kernytsky, Garimella, Altshuler, Gabriel, Daly and DePristo2010). Single sample genotypes were called by the HaplotypeCaller utility of GATK version 3.7. Finally, all gVCF-files were combined by the CombineGVCFs utility of GATK and jointly called by the GenotypeGVCFs utility of GATK. The PLINK/SEQ (https://atgu.mgh.harvard.edu/plinkseq) v0.10 i-stats module was used to calculate number of variants (NVAR), number of non-reference (NALT) variants, number of heterozygous (NHET) variants, average call rate (RATE) and the per sample transition/transversion (TITV) ratio. Samples with an average call rate less than 0.9 were removed. Multi-allelic single nucleotide variants were removed and we further excluded variants with call rate ⩽0.95 and a minor allele count ⩽2.
Genotype data
Single nucleotide polymorphisms chip data
The 600 K genotyping array we used contains 580 961 SNP probes across 28 autosomes, two linkage groups (LGE64 and LGE22C19W28_E50C23) and two sex chromosomes. After converting genome coordinates to a chicken reference genome (galGal5), we extracted 28 autosomes and a sex chromosome (chrZ) for further quality controls. To process samples, genotyped SNPs with minor allele frequency (MAF) smaller than 0.5%, genotyping call rate smaller than 97%, and Hardy–Weinberg equilibrium test P-value smaller than 1×10⁻⁶ were removed, resulting in 547 020 SNPs.
Whole-genome sequence data
After variant calling, the variants of 311 chickens in public databases and 24 internal population birds on chromosome 6 (chr6) were retained for further analysis. The averages of NALT variants, NHET variants, NVAR variants, RATE and TITV ratio on chr6 were 255 881.20, 127 256.21, 1 767 062.63, 0.95 and 2.48, respectively. Detailed sequencing data information of chr6 is shown in Supplementary Table S2. After rigorous quality controls, only 289 birds (265 birds from public databases and 24 birds from a population of yellow-feather dwarf broilers) with 1 354 096 SNPs were retained for chr6. In this study, all of the reference panels were built using WGS data from 289 chickens or subsets of these chickens, and the target panel included the 450 yellow-feather dwarf broilers with 600 K array data.
External reference panel selection
To investigate the influences of external reference panel selection on the accuracy of imputation from SNP chip data to WGS data, we considered four methods when selecting an external reference panel. Method one involved selecting the external reference panel by maximizing phylogenetic diversity (PD) with a greedy algorithm (Zhang et al., Reference Zhang, Zhan, Rosenberg and Zollner2013). We used sequencing data to compute the Hamming distances between individuals using PLINK and constructed a pairwise distance matrix (Supplementary Table S3). Using this distance matrix, we applied a greedy algorithm to maximize PD. Detailed information about method one was described a previous study (Zhang et al., Reference Zhang, Zhan, Rosenberg and Zollner2013). In method two, an external reference panel was selected by minimizing average distance to the closest leaf (ADCL). Minimizing ADCL is an approach that identifies reference haplotypes based on their genetic proximity to the rest of the sample haplotypes (Matsen et al., Reference Matsen, Gallagher and McCoy2013). We constructed a tree using PHYLIP version 3.695 with the neighbor-joining method (Supplementary Figure S1). We used the rppr binary in pplacer (Matsen et al., Reference Matsen, Gallagher and McCoy2013) to execute the adapted partitioning-around-medoids algorithm, returning a reference panel that minimizes ADCL. Detailed information about method two is in a previous study (Kang et al., Reference Kang, Zhang, Zollner and Rosenberg2015). For method three, selection of an external reference panel was done by maximizing the relationship with the target panel, while accounting for relationships among the selected birds of the external reference panel (REL). This method is described in detail by Druet et al. (Reference Druet, Macleod and Hayes2014). We extracted the overlapping sites of 600 K SNP arrays and sequencing data and built the marker-based genetic relationship matrix (G matrix) to compute the relationship among individuals. This G matrix was built following a previous study (VanRaden, Reference VanRaden2008). Method four involved randomly selecting individuals (RAN) to create an external reference panel.
Imputation scenarios
To check the effect of adding an external reference panel, the proportion of the internal reference panel in the combined reference panel and the selection strategies of the external reference panel on the imputation accuracy, we investigated three scenarios in this study. Scenario one was designed to compare the imputation accuracy of the internal reference panel, the external reference panel and the combined reference panel from 600 K chip data to sequencing data. The internal reference panel was 24 key individuals of a yellow-feather dwarf broiler population. The external reference panel was 265 birds with WGS data from diverse chicken breeds. The combined reference panel was assembled by all or a subset of individuals from the internal and external reference panels. Scenario two was designed to study the effects of the number of special-population individuals in the combined reference panel. According to the optimized rank of the 24 key individuals of the yellow-feather dwarf broiler population, we selected 1, 4, 8, 12, 16 and 20 birds to be an internal reference panel, respectively. These internal reference panels were combined with an external reference panel as an imputation reference panel for imputation from 600 K chip data to sequencing data. Scenario three was designed to study the effects of reference panel size and strategies of external reference panel selection on imputation accuracy. With or without an internal reference panel as an initial value, we used these four methods to select 50, 100, 150, 200 and 250 birds as an imputation reference panel for imputation from 600 K chip data to sequencing data.
Pre-phasing and imputation
The reference panel and the target panel were phased separately. Before pre-phasing, duplicate and monomorphic variants were excluded. In the target panel, we extracted the overlapping sites between the array and reference panel and revised strand inconsistencies in A/T and C/G SNPs using conform-gt program (http://faculty.washington.edu/browning/conform-gt.html). Pre-phasing was executed in Beagle 4.1 with default analyses. All genotype imputations were also executed in Beagle 4.1 with default values (Browning and Browning, Reference Browning and Browning2016). A previous study found no difference in imputation accuracy between chromosomes with different lengths (Ye et al., Reference Ye, Yuan, Lin, Gao, Luo, Chen, Li, Zhang and Zhang2018). In order to improve computational efficiencies, only chr6 was selected to perform genotype imputation in this study.
Assessment of imputation quality
For all scenarios, we randomly masked 2% of SNPs from the target panel as the validation set before imputation, and then calculated the correlation between the imputed genotypes and masked genotypes per individual or per SNP. This procedure was replicated five times for each scenario, and the average imputation accuracies of these five replicates are reported in this study.
Results
Imputation accuracy of internal, external and combined reference panel
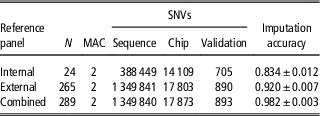
The internal reference panel (n=24), external reference panel (n=265) and the combined reference panel (n=289) were used as the imputation reference panels to investigate the influences of reference panels on imputation accuracy (Table 1). Imputation accuracy was assessed by correlations between the imputed and masked true genotypes per individual. Average imputation accuracies (five replicates) of chr6 from 600 K to WGS data are shown in Table 1. In general, the imputation accuracy (±SD) of the internal reference panel was lower (0.834±0.012) than that of the external reference panel (0.920±0.007) and the combined reference panel (0.982±0.003). The numbers of variants in the external reference panel (1 349 841 SNPs) and the combined reference panel (1 349 840 SNPs) were 3.475-fold larger than in the internal reference panel (388 449 SNPs).
Summary of genotype imputation from high-density (HD) panel to whole-genome sequence (WGS) data on chicken chromosome 6

N=number of reference panel; MAC=minor allele count; SNVs=single nucleotide variants.
The influence of reference panel size on imputation accuracy
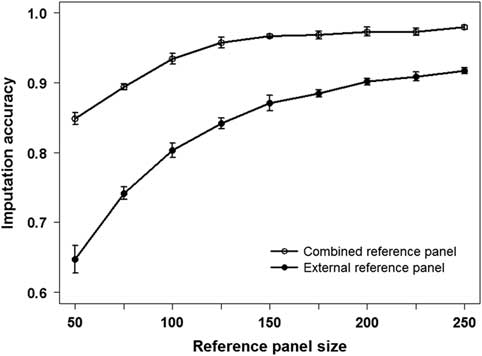
To investigate influences of the size of the reference panel on imputation accuracy, with or without an internal reference panel as an initial value, we randomly selected 50, 75,100, 125, 150, 175, 200, 225 and 250 birds as an imputation reference panel. The imputation accuracy was assessed by correlations between imputed and masked true genotypes per individual. Average imputation accuracies (five replicates) of chr6 from 600 K chip data to WGS data are shown in Figure 1. We found that more sequenced individuals resulted in greater imputation accuracy. With the same reference size, the imputation accuracy of the combined reference panel was always greater than the external reference panel. As the size of the reference panel increased, the rate of accuracy decreased, especially for the combined reference panel. For example, when the size of the reference panel was increased from 125 to 250, the imputation accuracy of the combined reference panel was only increased by 0.022 (from 0.957 to 0.979). In addition, the difference of imputation accuracy between the combined reference panel and the external reference panel was smaller as the size of reference panel increased.
Average imputation accuracy of chicken of combined reference panel and external reference panel obtained with different sizes of reference panel for chromosome 6 among five replications.

The number of special-population individuals in the combined reference panel
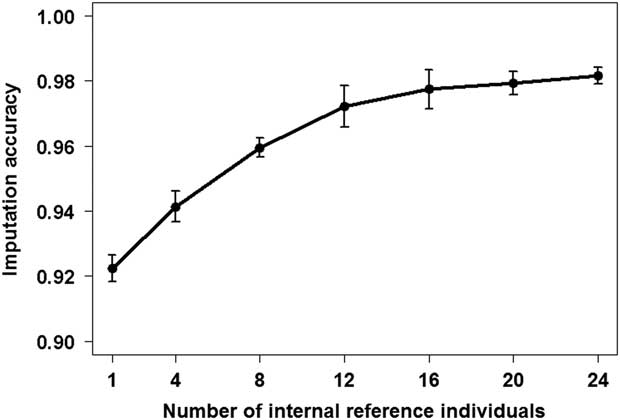
To investigate the effects of the number of internal reference panel individuals (known as special-population individuals) in the combined reference panel, we selected 1, 4, 8, 12, 16 and 20 birds from the 24 key individuals of the yellow-feather dwarf broilers population as an internal reference panel. These internal reference panels were combined with an external reference panel as an imputation reference panel. Imputation accuracy was assessed by the correlation between imputed and masked true genotypes per individual. Average imputation accuracies (five replicates) of each imputation reference panel on chr6 from 600 K to WGS data are shown in Figure 2. We found that larger internal reference panels resulted in greater imputation accuracy. However, the rate of increase of imputation accuracy clearly slowed down as reference panel size increased, especially for reference panels larger than 16. When the size of the internal reference panel was 16, the imputation accuracy was 0.977. Even though the size of the internal reference panel increased from 16 to 24, the imputation accuracy was only increased by 0.005.
Average imputation accuracy of chicken of different numbers of population-specific individuals in a combined reference panel against chromosome 6 among five replications.

External reference panel selection strategies
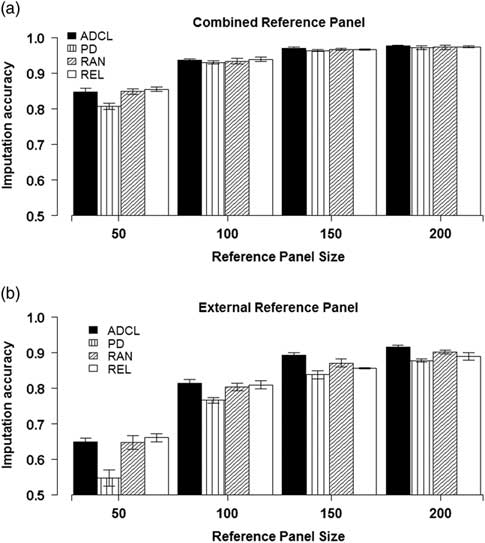
In this scenario, we used four methods (PD, ADCL, REL and RAN) to select an external reference panel for imputation. The average imputation accuracies of different external reference panel selection strategies are shown in Figure 3. When the size of the reference panel was 50, imputation accuracy was greatest with REL, following by ADCL, RAN and PD. When the size of reference panel was larger than 50, there was no obvious difference among these methods for the combined reference panel; but for the external reference panel, ADCL displayed the greatest imputation accuracy and PD displayed the lowest imputation accuracy. Furthermore, REL showed a greater imputation accuracy than RAN when the reference size was smaller than 100.
Average imputation accuracies of chicken of four external reference panel selection strategies against four reference panel sizes (50, 100, 150 and 200) among five replications. The four methods were maximizing phylogenetic diversity (PD), minimizing the average distance to the closest leaf (ADCL), maximizing the relationship with the target panel (REL) and random (RAN) selection of an external reference panel.

The effect of minor allele frequency on imputation accuracy
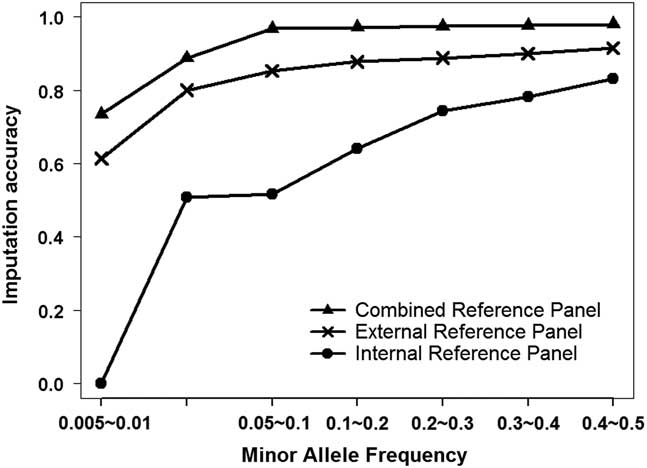
In this scenario, imputation accuracy was assessed by the correlation between imputed and masked true genotypes per SNP over all individuals. All SNPs randomly masked in all five replicates were binned based on their array-derived MAF, and the average correlation in each bin was assessed. The average imputation accuracy of different reference panels against MAF bins is shown in Figure 4. These results showed that imputation accuracy decreased substantially as MAF of the imputed variants declined, especially for the internal reference panel. The external reference panel and the combined reference panel exhibited stable performance with MAFs from 0.05 to 0.5 but were abruptly reduced with MAFs<0.05.
Average imputation accuracies of chicken of different reference panels against minor allele frequency bins among five replications. Single nucleotide polymorphisms (SNPs) were placed into seven bins based on their array-derived minor allele frequency. The imputation accuracy was assessed by the correlation between imputed and masked true genotypes per SNPs.

Discussion
Imputation from SNP panels to WGS data is an attractive approach to obtain highly reliable WGS data with low cost. In the present study, we determined the impact of several key factors as well as a combined reference panel on imputation accuracy. Overall, a combined reference panel improved the accuracy of genotype imputation. When genotype imputation is conducted in a livestock population, several key factors investigated in this study should be considered carefully and comprehensively.
Imputation accuracy
An obvious improvement in the accuracy of genotype imputation with a combined reference panel was observed both in this study (Table 1, Figures 1 and 4) and previous study (Mitt et al., Reference Mitt, Kals, Parn, Gabriel, Lander, Palotie, Ripatti, Morris, Metspalu, Esko, Magi and Palta2017). The main reasons for this improvement might be the size of the reference panel and the genetic similarity between the reference population and the target population. It is reasonable that the size of the reference panel increases with imputation accuracy, and no matter what kind of panel (internal (ref), external or combined (Figure 1)) it is. This is because a larger reference panel appropriately increases the number of imputed variants, as well as their imputation accuracy, particularly for low-frequency variants (Chou et al., Reference Chou, Zheng, Cheng, Yan, Wang, Han, Richards, Karasik, Kiel and Hsu2016). Another key factor is the genetic similarity between the reference population and the target population. Roshyara and Scholz (Reference Roshyara and Scholz2015) found that the higher genetic similarity between reference and target panel would result in higher imputation accuracies. In this study, with the same reference size, the imputation accuracy of the combined reference panel always performed better than the external reference panel (Figure 1). This phenomenon might be because the LD patterns of a specific population cannot be captured comprehensively by the other populations with distinct genetic background (Chou et al., Reference Chou, Zheng, Cheng, Yan, Wang, Han, Richards, Karasik, Kiel and Hsu2016). In addition, imputation accuracy is one of the most important factor effected the genomic evaluation using imputed data (Pimentel et al., Reference Pimentel, Edel, Emmerling and Götz2015). The higher imputation accuracy would result higher accuracy of genomic evaluation (Grossi et al., Reference Grossi, Brito, Jafarikia, Schenkel and Feng2018).
Strategy for improving the accuracy of genotype imputation
Although the accuracy of genotype imputation could be improved using the methods discussed above, especially with the case of adding the external reference panel to a small internal panel, the strategy for the implementation of genotype imputation should be considered carefully. A key question arising from imputation strategies was how many individuals were selected for sequencing as the internal reference panel, and how to balance the reference panel size and computing cost of pre-phasing. It was observed that the rate of increase of imputation accuracy slowed down gradually (Figures 1 and 2) with increasing panel size, but the computing and genotyping cost would not slow down. Hence, computing and genotyping cost should be taken into consideration while pursuing high-quality imputed genotypes. In the following discussion, we assume that the size of reference panel that can be implemented in practice is limited.
For the combined reference panel, there is an optimum reference size to balance high-quality imputed genotypes and cost. With the fixed external reference panel, our results (Figure 2) suggested that sequencing 16 key animals as an internal reference panel was enough to improve the imputation accuracy of a combined reference panel. These 16 key animals could represent up to 97.56% of genetic diversity in the entire chicken population (Ye et al., Reference Ye, Yuan, Lin, Gao, Luo, Chen, Li, Zhang and Zhang2018). It is necessary to select a suitable number of individuals of the target population using a key animal selection model. With the fixed internal reference panel, our results showed that selecting 126 individuals from the external reference panel was enough to improve the imputation accuracy of the combined reference panel (Figure 1). Although larger external reference panels would continually improve the imputation accuracy, the rate of increase would be very small past a certain number of individuals. The rate of increase slows down because the abundant haplotypes of the external reference panel might be relatively unique in the sample, and their inclusion in the reference panel might not contribute substantially to increase imputation accuracy. In addition, larger reference panels would result in higher computing costs for pre-phasing and imputation (Supplementary Table S4).
Because larger reference panels increase costs, it is important to optimize selecting an appropriate subset of individuals to add to the reference panel to improve genotype imputation. In this study, we compared four methods (PD, ADCL, REL and RAN) to select an external reference panel for imputation (Figure 3). In general, there were no significant differences in imputation accuracy using difference external reference panel selection strategies to assemble a combined reference panel. The lack of differences may be related to target population structure. The 24 key animals can represent most of the haplotypes of target population which represent 97.56% of genetic diversity in the entire chicken population (Ye et al., Reference Ye, Yuan, Lin, Gao, Luo, Chen, Li, Zhang and Zhang2018).
If there are budget constraints for WGS, genotype imputation would only require an external reference panel. Different external reference panel selection strategies resulted in differences in imputation accuracy (Figure 3). When the size of reference panel was 50, REL would have a greater imputation accuracy than the other methods, because REL selected individuals based on the genetic similarity among the target populations (Druet et al., Reference Druet, Macleod and Hayes2014). When the size of the reference panel was more than 50, minimizing ADCL would lead to greater imputation accuracy than the other methods. This is because minimizing ADCL can avoid most non-representative branches of a phylogenetic tree (Kang et al., Reference Kang, Zhang, Zollner and Rosenberg2015). In addition, our results showed that maximizing PD to select an external reference panel resulted in lower imputation accuracy than assembling reference panels from RAN, which conflicted with previous studies (Zhang et al., Reference Zhang, Zhan, Rosenberg and Zollner2013; Kang et al., Reference Kang, Zhang, Zollner and Rosenberg2015). This discrepancy may be due to greater variation in diversity between diverse chicken breeds (Lyimo et al., Reference Lyimo, Weigend, Msoffe, Eding, Simianer and Weigend2015). Maximizing PD is a way to ensure that the genetic diversity of diverse chicken populations is well represented (Zhang et al., Reference Zhang, Zhan, Rosenberg and Zollner2013). However, maximizing PD resulted in many haplotypes being mismatched between the reference and target populations, reducing imputation quality.
In practice, low-density SNPs arrays were widely utilized in commercial populations of many species such as beef, dairy and sheep. Imputation from low-density to WGS data using two-step imputation approach was also an effective way to obtain sequencing data (Kreinermøller et al., Reference Kreinermøller, Medinagomez, Uitterlinden, Rivadeneira and Estrada2015). Compared with imputation from 600 K to WGS data directly, the accuracy of imputation from 60 K to WGS data with two-step imputation approach were only less than 4% for FImpute and 9% for Beagle with the internal reference panel (Ye et al., Reference Ye, Yuan, Lin, Gao, Luo, Chen, Li, Zhang and Zhang2018). If utilized the combined reference panel to impute the low-density SNP chip to high-density SNP chip and then to WGS data, the imputation accuracy would be improved.
Minor allele frequency
Rare variants have played an important role in complex traits (Bomba et al., Reference Bomba, Walter and Soranzo2017), and may have greater effects than the common SNPs in the population (Manolio et al., Reference Manolio, Collins, Cox, Goldstein, Hindorff, Hunter, McCarthy, Ramos, Cardon, Chakravarti, Cho, Guttmacher, Kong, Kruglyak, Mardis, Rotimi, Slatkin, Valle, Whittemore, Boehnke, Clark, Eichler, Gibson, Haines, Mackay, McCarroll and Visscher2009). However, imputation of rare variants is still a challenge in livestock. Rare variants are often population-specific (Abecasis et al., Reference Abecasis, Auton, Brooks, DePristo, Durbin, Handsaker, Kang, Marth and McVean2012) and potentially reflect the characteristics of population structure directly (Mathieson and McVean, Reference Mathieson and McVean2012). In this study, using a combined or external reference panel, the imputation accuracies of low-frequency variants were greater than using an internal reference panel. Imputation accuracy may benefit from using more diverse or larger reference populations, which could capture more reference haplotypes. A previous study also showed that a larger and more diverse reference set can improve the imputation of low-frequency variants (Jostins et al., Reference Jostins, Morley and Barrett2011). In addition, adding population-specific individuals to an imputation reference panel led to the lowest number of false positive rare and low-frequency variants (Surakka et al., Reference Surakka, Sarin, Ruotsalainen, Durbin, Salomaa, Daly, Palotie and Ripatti2016).
Conclusions
In conclusion, using a combined reference panel could improve the accuracy of genotype imputation. The optimal imputation strategy with a combined reference panel should take genetic diversity of the study population, availability and properties of external reference panels, sequencing and computing cost, and frequency of imputed variants into consideration comprehensively. This work sheds light on how to design and execute genotype imputation with a combined external reference panel in a livestock population.
Acknowledgements
This work was supported by the National Natural Science Foundation of China (31772556), the earmarked fund for China Agriculture Research System (CARS-35, CARS-41), and the Special Program for Applied Research on Super Computation of the NSFC-Guangdong Joint Fund (the second phase) under Grant No.U1501501.
Declaration interests
The authors declare that they have no competing interests.
Ethics statement
All animal care and handling procedures conformed to the Animal Care Committee of South China Agriculture University (Guangzhou, People’s Republic of China). Animals involved in this study were humanely sacrificed as necessary to ameliorate their suffering.
Software and data repository resources
The SNP data on chromosome 6 are available at the figshare repository (https://doi.org/10.6084/m9.figshare.6230876.v6).
Supplementary material
To view supplementary material for this article, please visit https://doi.org/10.1017/S1751731118002860