


1. Introduction
Previous studies have shown that the microwave brightness temperature is linked to the snow temperature, snow layering, snow density and crystal sizes and shapes (Reference HallHall, 1987; Reference MätzlerMätzler, 1987; Reference Fily and BenoistFily and Benoist, 1991; Reference Rott, Sturm and MillerRott and others, 1993; Reference Surdyk and FilySurdyk and Fily, 1995). These results provided some understanding of the snow characteristics in Antarctica on a large scale. However, studies of local snow properties remain limited, partly due to the lack of ground observations. Thus, gaining a better understanding of microwave–snow interactions is an ongoing process. The recent digital elevation model (DEM) from European Remote-sensing Satellite-1 (ERS-1) (Reference Liu, Jezek and LiLiu and others, 1999) and the bedrock topography model from the BEDMAP consortium (Reference Lythe and VaughanLythe and others, 2001) allow additional data to be used for understanding local features. A correlation between bedrock topography, surface topography and accumulation environment has been established in a few regions in Antarctica (Reference BuddBudd, 1970; Reference GoodwinGoodwin, 1988; Reference Takahashi, Ageta, Fujii and WatanabeTakahashi and others, 1994). Surface undulations created originally by the ice flow over the bedrock topography create an inhomogeneous depositional environment. This process includes inhomogeneous vertical strain rate and wind erosion, modifying the snow-cover characteristics (Reference Parish and BromwichParish and Bromwich, 1987). This paper describes one such case. Hereafter, TB denotes the vertically polarized brightness temperature, with subscripts for frequency (e.g. TB37 is the vertically polarized brightness temperature at 37 GHz).
The map in Figure 1 shows surface elevation and the mean annual TB37. The brightness temperature decreases gradually inland from the coast. The coldest surface air temperatures are at the highest elevation, but these regions are not regions of lowest brightness temperatures (dark area, Fig. 1), because the brightness temperature is also dependent on snow properties. Past investigations indicate that the presence of very coarse snow grains, mainly depth hoar, is a plausible explanation for these low brightness temperatures (Reference Surdyk and FilySurdyk and Fily, 1993). Surface and depth hoar are known to significantly decrease the emissivity (Reference HallHall, 1987; Reference Surdyk and FilySurdyk and Fily, 1995; Reference Abdalati and SteffenAbdalati and Steffen, 1998). The dark area in Figure 1corresponds also to the largest seasonal amplitude of the brightness temperature, 20– 25 K, which suggests that this area undergoes large seasonal changes. Reference GiovinettoGiovinetto (1963) concluded that the large seasonal temperature gradient observed in the region associated with low accumulation rates leads to the development of the observed very coarse snow grains, mainly depth hoar.
Map of the 1984 mean annual 37 GHz brightness temperature in Antarctica with elevation contour lines. The upper-left white area, south of 84˚ S, is a region where no data are available. The black patches bound by 175 K contours are marked 
 and
 . The data along line A-B-C are studied in detail. White circles are stations where the snow properties were analyzed during the McMurdo–South Pole traverse in 1960/61. Position A is 82.24˚ S, 84.03˚ E; B is 80.37˚ S, 116.26˚ E; and C is 78.96˚ S, 145.15˚ E.
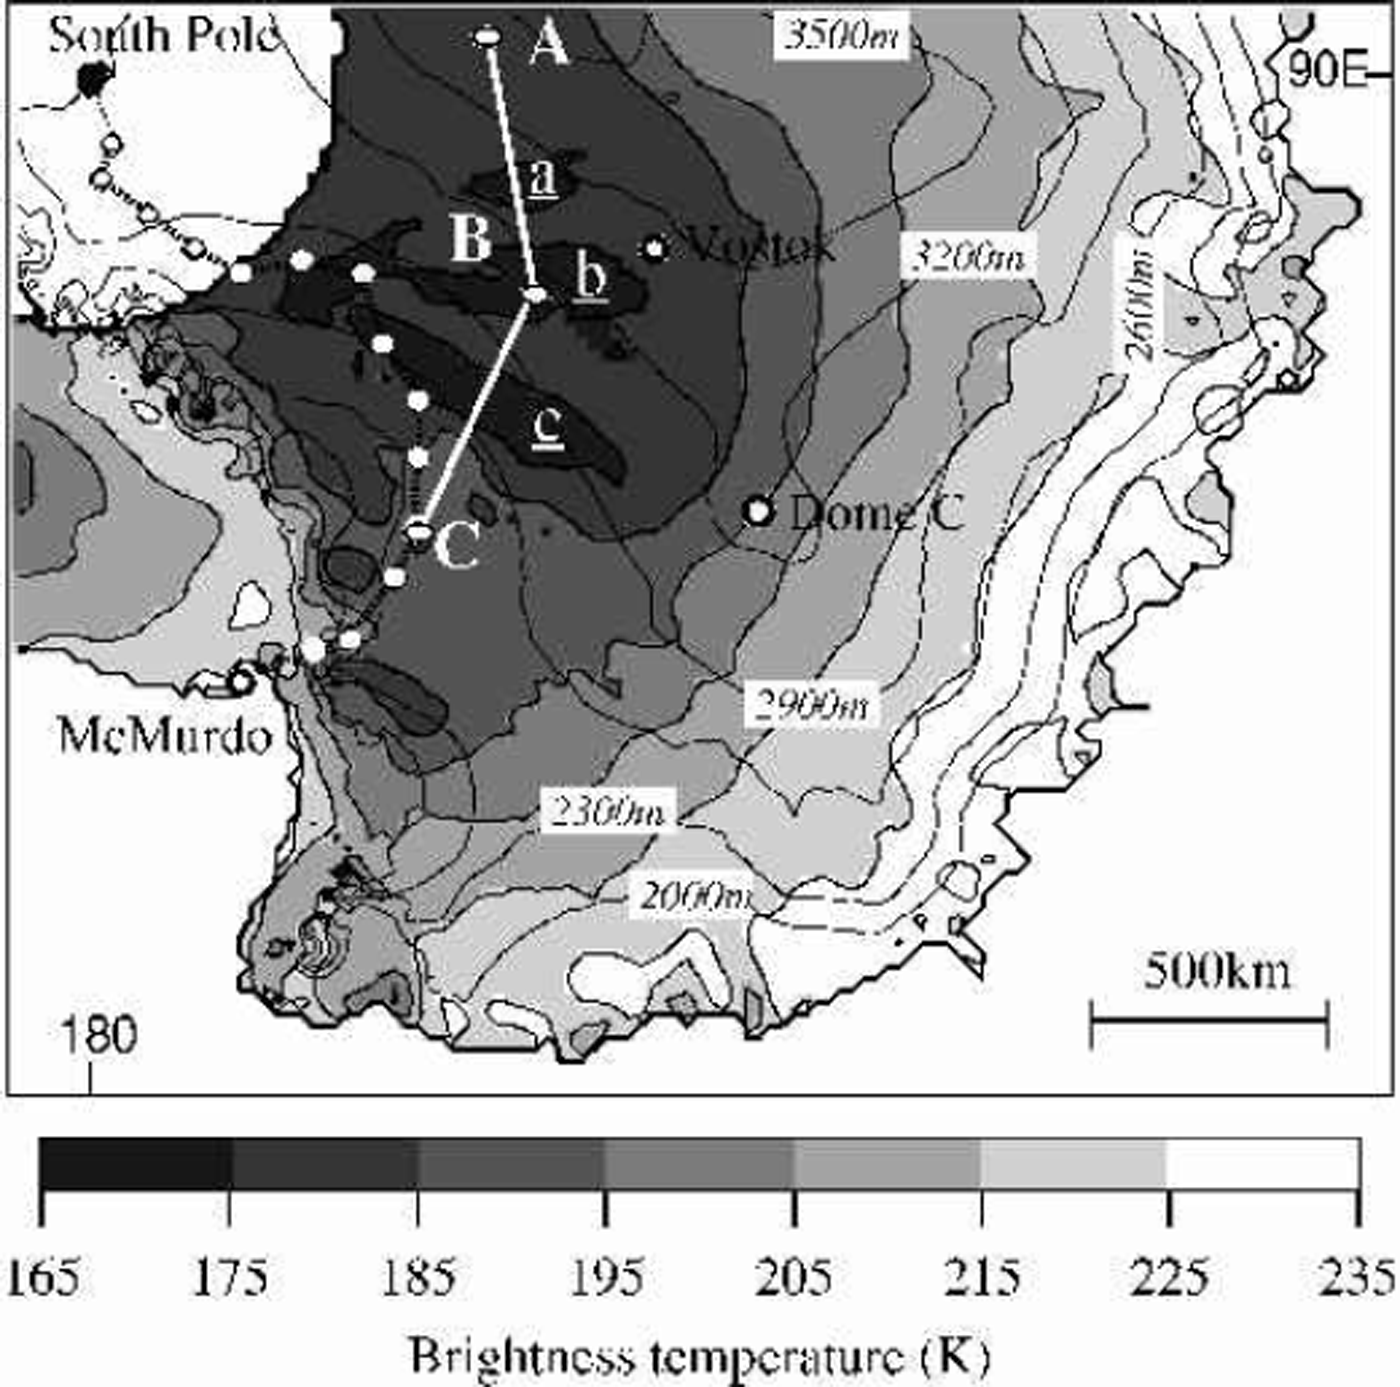
In that dark area, there are three black elongated features with TB37 below 175 K, the lowest brightness temperature observed over Antarctica at 37 GHz. Hereafter, the features are denoted
and patches. The largest patch, patch is about 600 km long and 120 km wide. These patches are persistent at TB37 on vertical and horizontal polarization of Scanning Multichannel Microwave Radiometer (SMMR) and Special Sensor Microwave/Imager (SSM/I) data throughout the year and from 1978 until now. A sharp contrast of brightness temperature inside and outside of this area of about 10 K within 25 km indicates that it can be explained only by a relatively large change in snow-cover properties. Reference Fahnestock, Scambos, Shuman, Arthern, Wine-brenner and KwokFahnestock and others (2000) also mentioned this low-brightness-temperature area when discussing the presence of a snow-megadune field in central Antarctica. They describe megadunes as 2–4km wavelength ripples, observed through Advanced Very High Resolution Radiometer imagery and synthetic aperture radar (SAR) data. Megadunes have an amplitude of a few meters and can extend 100 km (Reference Fahnestock, Scambos, Shuman, Arthern, Wine-brenner and KwokFahnestock and others, 2000). In their analysis, Reference Fahnestock, Scambos, Shuman, Arthern, Wine-brenner and KwokFahnestock and others (2000) placed the dune fields at the location of the low brightness temperature. We note the snow megadunes are found only in this central part of Antarctica where TB is low, but not where it is lowest. The present study reveals that the dune fields are located up- and downslope of the low-TB patches. Apparently unchanged since 1963, these dune fields reflect persistent katabatic wind activity (Reference Fahnestock, Scambos, Shuman, Arthern, Wine-brenner and KwokFahnestock and others, 2000). The dunes are too small to be detected with passive microwave, but their presence is important.
How snow properties relate to the brightness-temperature pattern here is examined using a DEM, the RADARSAT SAR mosaic, some ground observation and previous results on microwave–snow interactions. The bedrock and surface slope are related: the slope of the surface that controls the regional wind activity influences the growth of snow grains into large grains, depth hoar, and the depth hoar reduces the brightness temperature.
2. Description Of The Data
2.1 Passive-microwave dataset
The passive-microwave data used for this study are from the SMMR on board the Nimbus 7 satellite that operated from October 1978 to August 1987. The SMMR sensor measured both vertical and horizontal polarizations at 6.6, 10.7, 18, 21 and 37 GHz. The incident angle was about 50˚ from zenith. No data are available south of 84˚ S. The spatial resolution varied from 150 km at 6.6 GHz to 30 km at 37 GHz, but the data were interpolated to a 25 km grid spacing, which is the same grid as the more recent SSM/I.The latter is a common grid in polar stereographic projection, with 70˚ S as the latitude of true scale and 0˚ E as the central meridian. The exact position of each gridpoint in latitude and longitude was obtained with the program locate provided with the SSM/I dataset.
The mean annual brightness-temperature data from 1984 were used. These data are plotted in one and two dimensions at the various frequencies and polarizations. The two-dimensional gray-scale plots use the gridded dataset. The one-dimensional curves were computed for every 5 km along the defined route, and used linearly interpolated data based on gridpoints within 37.5 km of each plotted point.
2.2 Surface and be drock elevation datasets
To estimate the surface and bedrock elevations, the DEM and the bedrock topography model (BEDMAP), respectively, were used (Reference Liu, Jezek and LiLiu and others, 1999; Reference Lythe and VaughanLythe and others, 2001). They are presented on a 5 km grid in polar stereographic projection, with 71˚ S as the latitude of true scale and 0˚ E as the central meridian. To precisely locate each gridpoint the locate program was used after adjusting the true latitude to 71˚ S, the grid size and the center of the grid.
Surface elevations along the A-B-C route (Fig. 1) used linearly interpolated DEM data based on gridpoints within 7.5 km of each plotted point, computed every 1kmalong the defined route. Surface slope was computed on a 5 km grid from the first derivative of the DEM dataset. Surface slope along the A-B-C route was calculated with the same interpolation as for surface elevations.
2.3. SAR data
The Canadian RADARSAT SAR 125m resolution was used to map the location of the snow-megadune fields (Reference Fahnestock, Scambos, Shuman, Arthern, Wine-brenner and KwokFahnestock and others, 2000). The data used are not the original SAR data but the gray-scale image dataset.
The snow megadunes reported by Reference Fahnestock, Scambos, Shuman, Arthern, Wine-brenner and KwokFahnestock and others (2000) were located visually on the RADARSAT SAR mosaic by a typical pattern of light and dark ripples, extending from wavelengths of a few kilometers to a few tens of kilometers to several hundred kilometers. Because the RADARSAT mosaic uses the same projection as the DEM, the locate program was used to transfer the megadunes to the map of brightness temperatures. Grid size and center of the grid have been adjusted.
2.4. Ground-observation dataset
Direct measurements of snow grain-sizes, snow layering and crust layers came from a traverse during winter 1960/61. This started from McMurdo (77.8˚ S, 166.6°E) and followed the route to the South Pole shown in Figure 1 (Reference GiovinettoGiovinetto, 1963). Although these data are much older than the satellite data, it is assumed here that the general surface characteristics did not change dramatically between 1961 and 1984. This 23 year time gap is a concern due to known climate change in Antarctica (Reference Houghton, Jenkins and EphraumsHoughton and others, 1990); however, the TB gray-scale plots have changed insignificantly between 1978 and 2001, the period for which satellite data are available.
3. Description Of The Brightness Temperature
3.1. General features of the low brightness temperatures
The low-TB patches are most distinct at 37 GHz, but are also discernible at lower frequency. In patch the seasonal amplitude of TB18 is >15K, which is larger than in any other region. This patch also has some of the largest seasonal amplitudes at 10.7 GHz, at little more than 6.5 K. At 6.6 GHz, only a weak seasonal pattern appears in horizontal polarization near patch This decreasing seasonal amplitude with frequency can be partly explained by the corresponding drop in the sensor’s resolution: from 50 km at 18 GHz to 100 km at 10.7 GHz, and 150 km at 6.6 GHz, the latter of which exceeds the width of the largest patch, patch When we degrade the resolution of all the channels to 150 km by applying a running mean, the difference inside and outside of the patches decreased by 50% for patch 65% for patch and 80% for patch The low TBs observed on the patches occur at nearly all frequencies both throughout the year and from year to year. Therefore, the specificity of the patches is not temporal nor is it limited to the near surface.
3.2. Detailed features of the low brightness temperatures
To analyze the patches in detail, I focus on the brightness temperatures at the four SMMR frequencies along the A-B-C route (Fig. 1 map). This route was chosen to cover the three patches.
Brightness temperatures
Figure 2a shows TB6.6, TB10.7, TB18 andTB37 along line A-B-C. All the TBs drop significantly at the three patches, although this is not so clear at 6.6 GHz. The drop is greatest at patch where it is also the sharpest because the patch is only 120 km across. This drop is 14 K for TB37 and TB18, 9 K for TB10.7, and 1 K forTB6.6. Such a significant change over a short distance reflects a drastic change in snow characteristics, not only in the near surface (i.e. TB37, TB18), but also at depth (TB10.7, TB6.6). The penetration depths for frequencies below 10 GHz vary from several meters to a few tens of meters.
Satellite-derived data along line A-B-C. (a) Brightness temperatures from the four SMMR frequencies; (b) polarization ratios (ratio of the difference between vertical and horizontal signals to their sum); (c) gradient ratio (the ratio of the 18 GHz to the 6.6 GHz signal). The horizontal axis is the distance from point A shown in Figure 1. The distance on the abscissa is based on the gridcell dimensions. The local extrema of TB37 are marked by vertical gray lines, and their distances are labeled on the abscissa.
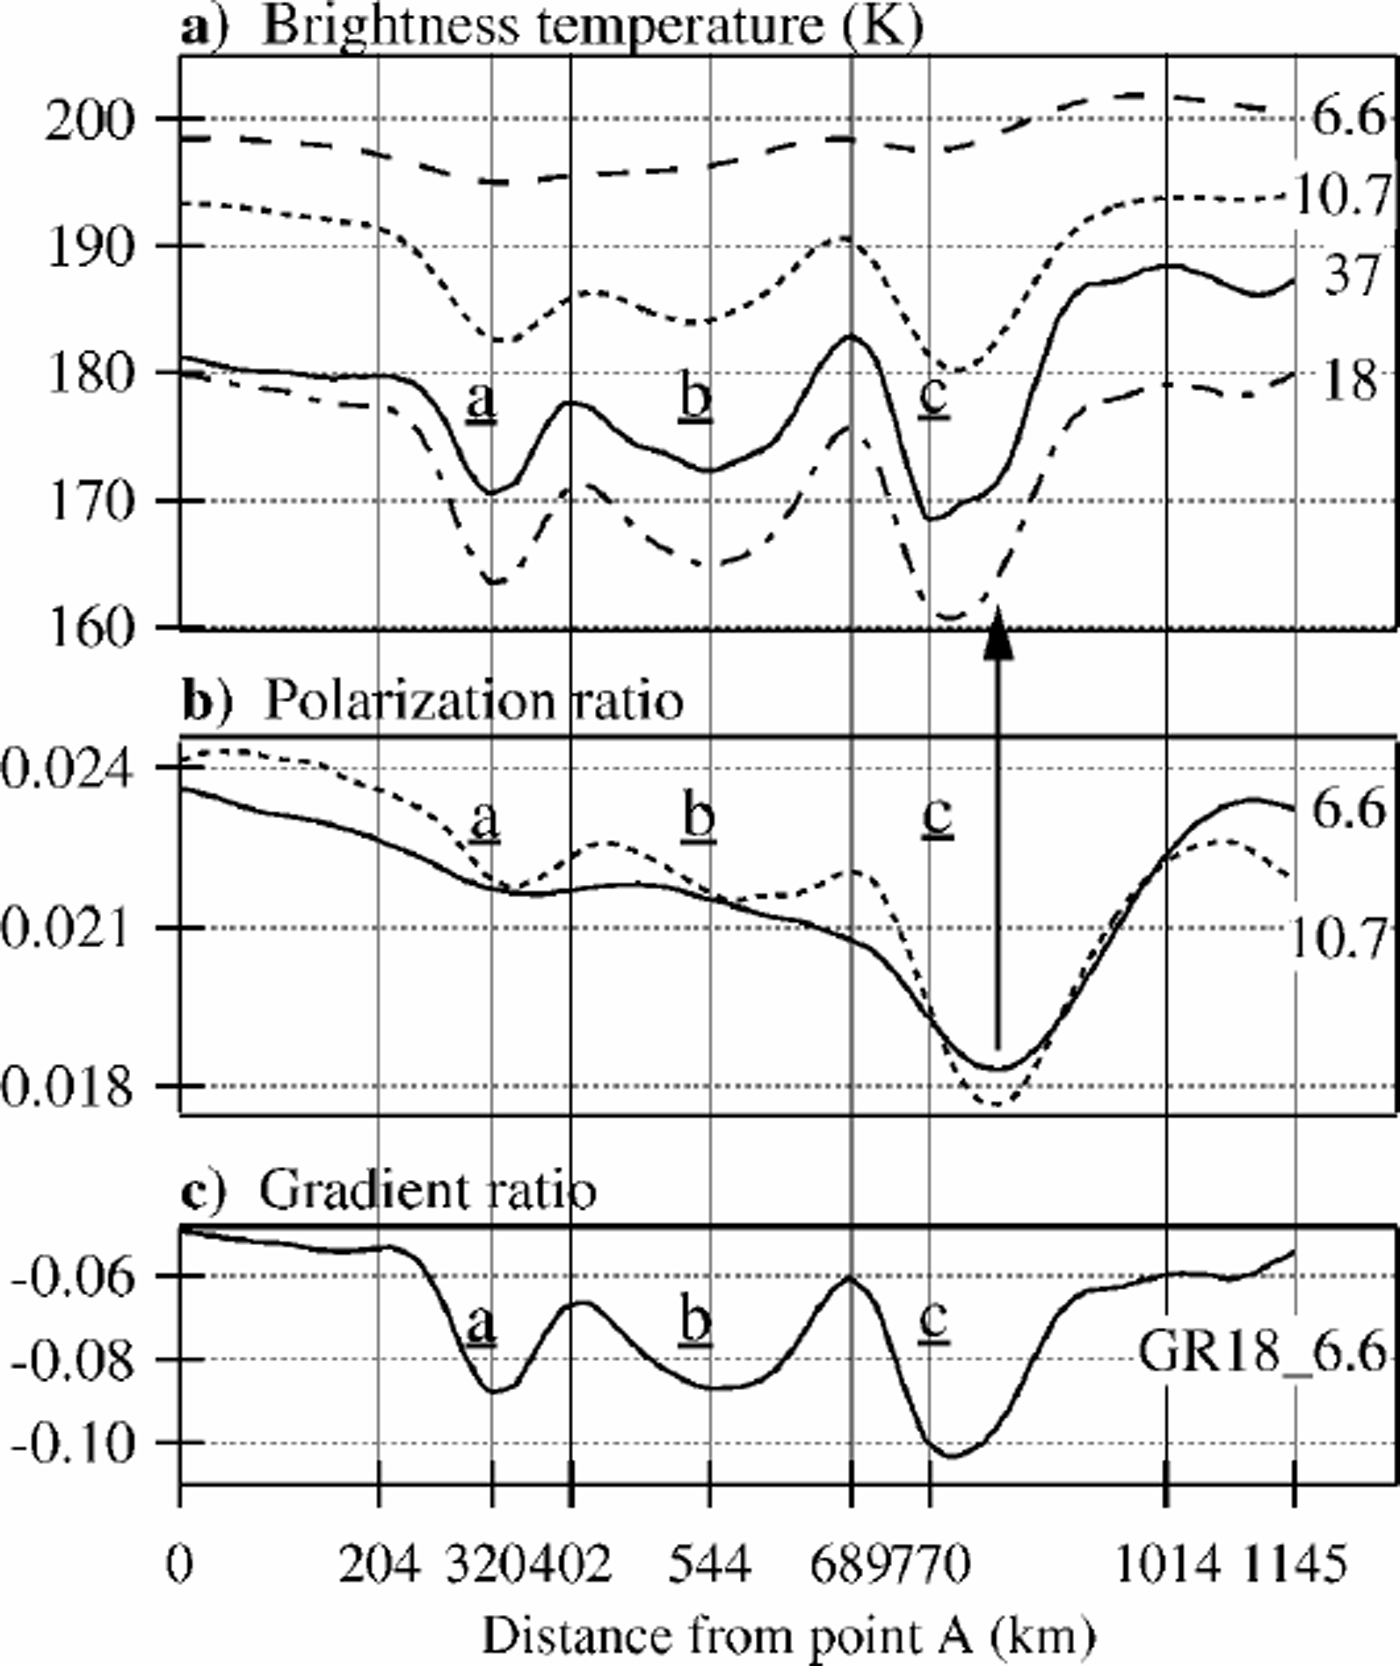
TB37 and TB18 have distinct maxima at 402 and 689 km (Fig. 2a). Assuming that the emissivity equals the observed mean annualTB divided by the mean annual air temperature, the emissivity is approximately 0.82 at the four maxima (204, 402, 689 and 1014 km), whereas it is 0.75–0.78 at the minima. The temperatures were estimated from a –50°C isotherm at 3000m and a previously measured lapse rate of 1.1°C per 100m (Reference GiovinettoGiovinetto, 1963). The same emissivity at each maximummight indicate that the snow cover generally has uniform conditions except at the three patches.
Polarization ratios
The polarization ratio is defined as follows:
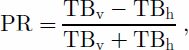
whereTBv andTBh are the vertical and horizontal components of the brightness temperature. Figure 2b displays the profiles of PR6.6 and PR10.7. The PR10.7 shows two clear maxima, like TB37. The minima are also distinct, although the minimum of patch is shifted by about 70 km. A vertical gray arrow in Figure 2b indicates that the location of PR10.7’s minimum does not correspond toTB37’s minimum value but is still within the patch’s minimum values, i.e. <175K. The PR6.6 shows no clear maxima, but a distinct minimum appears on patch as on PR10.7. Reference Surdyk and FilySurdyk and Fily (1993, Reference Surdyk and Fily1995) found that the PRs at frequencies lower than 10 GHz were a good indicator of the stratification into the snow cover: the higher the PR, the larger is the number of strata over the first 2 m. Each stratum is defined when the density or the grain-size of the snow or icy layer changes. Following Surdyk and Fily, the locations of the PR10.7 maxima correspond to places with relatively high stratification (large number of strata over the first few meters) compared to the locations of minima. Therefore, the stratification is lower in the patches area, i.e. either the snow layers are thicker or the number of crust layers is smaller, or both.
Gradient ratio
The gradient ratio discussed here is the frequency gradient between 18 GHz and 6.6 GHz in vertical polarization, GR18–6:6. It is defined as follows:
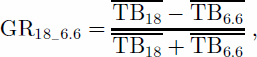
where  and
 are the annual means. Figure 2c displays the profile of GR18–6:6. The ratio GR18–6:6 is strongly correlated withTB37. Reference Surdyk and FilySurdyk and Fily (1993) made an intercomparison of observed 2 m snow stratigraphies, collected over Antarctica during the International Geophysical Year 1957/58, and the brightness-temperature signature at SMMR frequencies. They found a correlation between GR18–6:6 and the mean snow grain-size over the first 2 m: the larger the grains, the lower the ratio (Reference Surdyk and FilySurdyk and Fily, 1993). Therefore, the gradient ratio (Fig. 2c) indicates that higher TB37 corresponds to smaller snow grains than lowTB37, i.e. the snow grains are larger in the patches than outside.
To summarize, the satellite data indicate that high TB37 corresponds to areas where the snow cover is highly stratified with relatively small snow grains, and lowTB37 corresponds to areas with low stratification and large snow grains.
4. Combination With The Dem
In Figure 3,TB37 is displayed along with the corresponding surface DEM and the surface inclination. The DEM was built from ERS-1 radar altimetry and is accurate to 2m over the ice sheet (Reference Liu, Jezek and LiLiu and others, 1999). However, south of 81.5˚ S, beyondthe reach of the satellite’s sensor, the data are interpolated with other existing datasets and are less accurate (Reference Liu, Jezek and LiLiu and others, 1999). For this reason, the surface elevation and inclination curves in Figure 3 are indicated by a dashed line from 0 to 440 km. Beyond 440 km, the surface inclination has short-scale fluctuations, particularly between 800 and 1000 km. By analyzing ERS-1 altimetry data in the area 120–140°E, 74–81˚ S, Reference Brisset and RémyBrisset and Rémy (1996) found a 20 km wavelength undulation with 10 m amplitude, and attributed it to ice flowing over irregular bedrock. The surface inclination curve was smoothed at a 50 km scale to determine the regional trend of the surface inclination. For patch a, the accuracy of the surface inclination is poor (south of 81.5˚ S), but the two remaining patches show a very specific pattern. Assuming an initial stage at a local maximum, TB37 starts to drop just after the slope starts significantly decreasing. The minimum inTB37 occurs in the latter part of the level area. Then in the sloping part, TB37 increases slowly for several tens of km, and finally, as the slope remain steep, increases sharply to reach a new maximum. The bedrock elevation is also drawn in Figure 3; level surfaces are located just above depressions in the bedrock (Reference BuddBudd,1970).
Comparison of brightness temperature to surface topography, bedrock topography and the snow megadunes location along lineA-B-C. (a) The surface inclination derived from the surface elevation dataset; the thick line is a 50 km running average. (b) The brightness temperature TB37 and the surface elevation. (c) The snow megadunes location extracted from the Antarctic RADARSATSAR mosaic. (d) The bedrock topography. Between 0 and 440 km, the surface slope and surface elevation curves are represented as dashed lines (see section 4 for explanation).
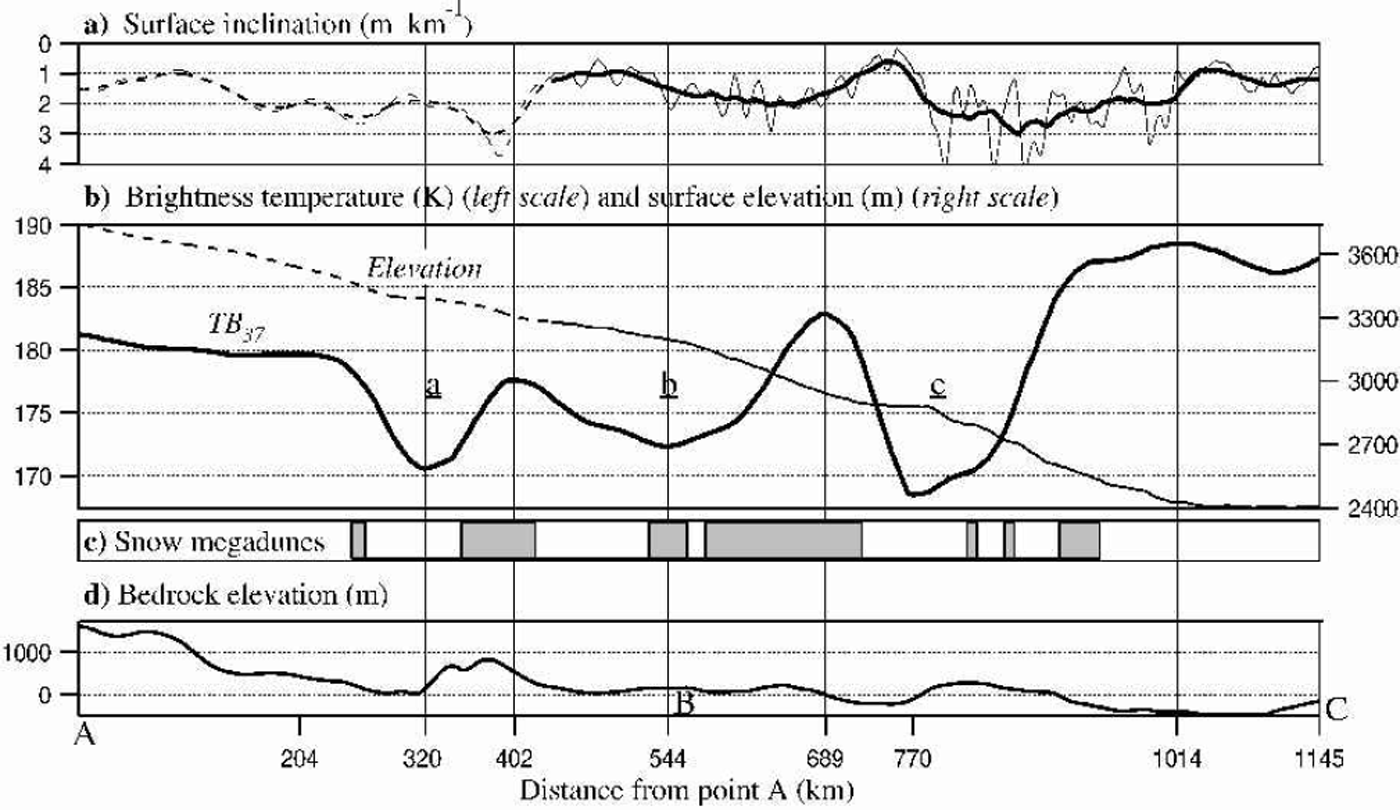
Figure 4 shows the low-TB patches with their 175 K contour lines superimposed on a map of the surface inclination. This two-dimensional image shows, as in Figure 3, that patch contains a flat area (in white) and a sloping area (in black). Patch fits throughout its length to the slope-break area; this probably explains the particular elongated shape of the patch. For patch , the light–dark color contrast over the patch is noticeable but not as marked as for patch . The accuracy of the surface slope over patch a is not sufficient for conclusions to be drawn.
Surface inclinations near the low-brightness-temperature patches that are bound by 175K contour lines. The whitest areas are nearly flat, with a surface inclination <1m km–1.The thick dashed line in patch
marks a boundary line between regions of significantly different slope. Line A-B-C is marked as a thick line. Inland stations (circles) and snow-pit locations along the McMurdo–South Pole traverse (triangles) are also labeled.
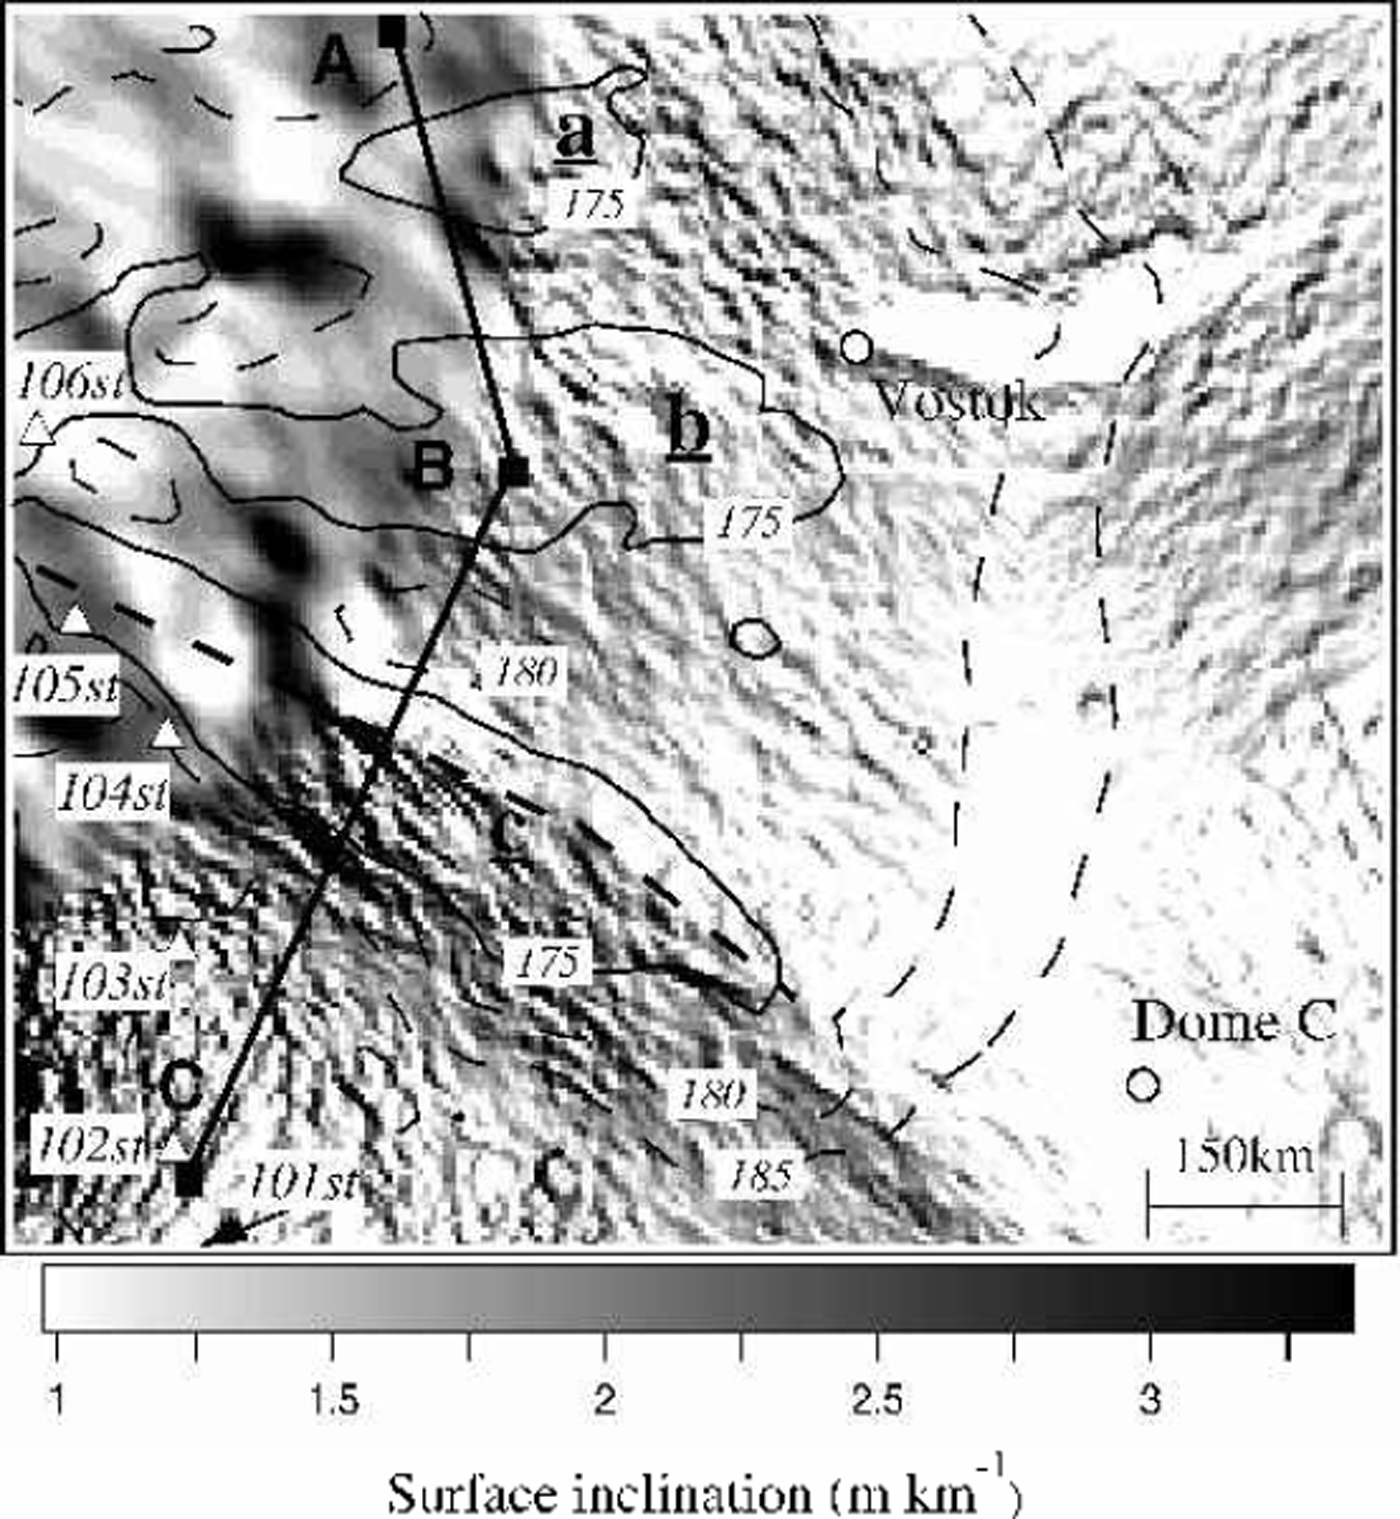
In summary, the strong changes ofTB37 strongly correlate to changes of slope. The lowTB37 values occur in areas where the surface is nearly level, and extend into regions where the elevation starts decreasing.
5. Radarsat Sar Data And The Snow-Megadune Fields
Figure 3 displays the locations of the snow-dune fields along the A-B-C route. The snow megadunes are essentially located up-and downslope of half of the patches. Considering that the patches overlap a level area, this observation would be expected since the snow megadunes reflect the regular katabatic wind activity, itself controlled by the regional surface slope (Reference Fahnestock, Scambos, Shuman, Arthern, Wine-brenner and KwokFahnestock and others, 2000). Figure 5 shows the location of the snow megadunes relative to the low-TB37 patches over the studied area. This two-dimensional representation shows that the snow-megadune locations do not correspond to the patches but are shifted downslope. Patches and are relatively clear of snow megadunes, which cover <20% of the area, but the coverage of patch is about 50%.
Location of the snow-megadune fields (gray color) in the area of the patches. Annotations are the same as for Figure 4; the dashed area in the upper left corner indicates an area with no SMMR data available (south of 84˚ S).

The above observation confirms the conclusion of section 4, that the patches appear in an area where the wind action is weakened or non-existent, i.e. a level area and a few tens of kilometers downslope.
6. Snow-Pit Measurements
Along the traverse that links McMurdo to the South Pole, Reference GiovinettoGiovinetto (1963) reported a uniform depth-firn temperature of –45˚ to –50°C, an average snow density of about 390 kgm–3 with little fluctuation, and an annual accumulation rate of 55 gcm–2 a–1; coarse to very coarse snow grains were found. The combination of low accumulation rate and strong temperature gradient induces snow-grain growth to form coarse grains that are mostly depth hoar, which can become 8 mmacross. Also the sublimation effect causes summer layers to disappear (Reference GiovinettoGiovinetto, 1963).
Figure 6 displays the measured snow grain-sizes and number of layers from the surface down to 2 m. To enable comparison of the snow-pit characteristics, a mean snow grain-size Φm was calculated. Snow grains were classified according to their diameter, Φ, into four classes: fine (Φ50.5mm), medium (0.5 ≤ Φ<1mm), coarse (1 ≤ Φ <2mm) and very coarse grains (Φ ≥ 2 mm). Then a representative grain-size Φl of each snow type was defined: from fine to very coarse: 0.2, 0.75, 1.5 and 3 mm. The mean grain-size was calculated as follows:
Measured crystal sizes and layering in snow pits along the McMurdo–South Pole traverse (Reference GiovinettoGiovinetto, 1963) that are labeled in Figure 5. The bottom graph gives the mean snow-crystal size over the top 30 cm, the top 1m and the top 2 m. The top graph gives the number of snow layers and number of crust layers in the top 2 m. These layers were determined by the traverse expedition, but did not precisely define what constitutes a layer. However, only the trend is important for this work.
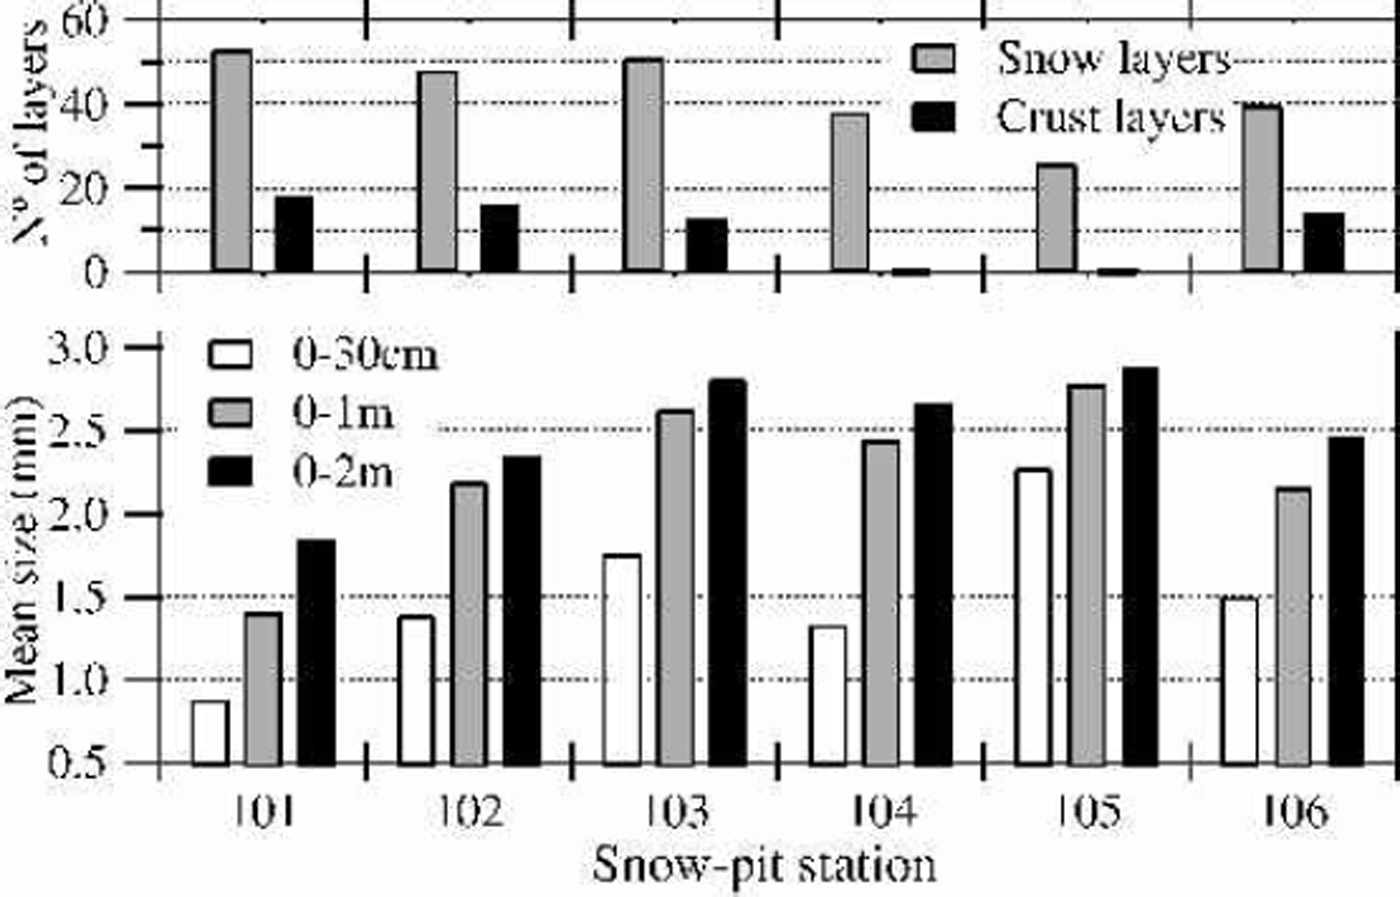

where i is the snow type, and di is the total thickness of layers of type i. Φm was calculated over the first 30 cm, 1m and 2 m. For more details on the snow-pit analysis method, see Reference Surdyk and FilySurdyk and Fily (1993, Reference Surdyk and Fily1995). Snow-pit locations 101–106 are shown in Figures 4 and 5; they deviate from the A-B-C route, but I assume that inside of one contour line the snow condition remains the same over the entire region. Some snow pits are near the 175 K contour line of the main patch. Snow pits101 and 102 are clearly in a high-TB37 area; pits 104 and 105 are near 180 and 175 K, respectively, which are low but not minimum TB37 values. Pit 103 is near the 185 K contour line, which is between the high and low values. In Figure 6, the mean grain-sizes in snow pits 101 and 102 are smaller over 1 and 2 m than those at pits 103, 104 and 105. The largest snow grains are at pit 105 which has a low TB37 value. This agrees with the interpretation of the satellite data: larger snow grains where TB37 is low, and smaller grains where TB37 is high. Moreover, in the first 30 cm at station 105 the snow grains are much larger than anywhere else. The large grains found onthe surface probably are even larger at depth, resulting in very large snow grains below 2 m. Also significant is the number of snow and crust layers. The number of snow layers is about 50 at pits 101–103, drops to 40 at pit 104, then to 30 at pit 105. This also is in good agreement with the interpretation of the satellite measurements. In the low-TB37 area, the PR10.7 indicated a low stratification, thus suggesting a higher net accumulation; the small number of snow layers in the top 2 m means that snow layers are thicker at pit 105. Furthermore, no crust layers were observed in pits 104 and 105. This would suggest weakening of the wind activity or absence of wind.
7. Interpretation
The undulations of the ice-sheet surface created originally by the ice flow over the bedrock topography create an inhomogeneous depositional environment. In a katabatic zone, the net accumulation at a point depends on the precipitation at that point but also on the amount of drift snow redeposited there. The amount of drift snow deposited or eroded by wind is controlled by the surface roughness and its effect on wind activity (Reference GoodwinGoodwin, 1988; Reference Takahashi, Ageta, Fujii and WatanabeTakahashi and others, 1994). The wind speed is controlled by the regional maximum of the surface slope.
A plausible explanation for the change of the brightness temperature over the area is as follows. The wind velocity decreases progressively as the flat area is approached. The sloping area downstream remains in the wind-shadow for tens of km until the wind velocity strengthens again with the descending slope. The absence of crust layers and absence of snow-megadune fields in the low-TB37 region confirms that, in the flat area and about 50 km further away, the wind activity decreases. Newly deposited snow is not blown away, building up thicker layers than up- and downslope. Because the whole region undergoes large temperature gradients and high sublimation effects, very coarse snow grains, mainly surface and depth hoar, grow up near the surface without being broken by the wind, and thus grow even larger in the snow cover than in windier places.
The brightness temperature at 37 and 18GHz is sensitive to the snow grain-size detected by this local change in snow characteristics. The decrease of TB6.6 and TB10.7 can be attributed, not to the increasing snow grain-size, but rather to the absence of wind crusts and weaker snow layering. However, it is not yet clear why the PR10.7 and PR6.6’s minimum value is 70 km shifted compared to the TB37 minimum.
8. Conclusions
In the present study, variations in the snow brightness temperature showed that snow characteristics depend on the local conditions of surface slope, wind action and bedrock topography. This area had particularly large gradients in brightness temperature. It has been shown that these resulted from intense snow metamorphism. However, similar cases of intense snow metamorphism in the snow cover resulting from a wind-shadow have been observed in other regions of Antarctica, including areas that do not have low accumulation rate. However, present satellite-borne sensors will detect only areas of scale as large as the one studied here. The present coarse resolution of passive-microwave data, 25 km at 37 GHz down to 100 km at 10.7 GHz, might not detect small-scale changes, but the physical link between slope and coarse grains like depth hoar should also apply to smaller scale. The coming Advanced Microwave Scanning Radiometer to be launched on board the Advanced Earth Observing Satellite II will surely be an interesting input; the resolution will then be 60 km at 6.9 GHz, about 30 km at 10.6 GHz and about 10 km at 36.5 GHz.
The brightness temperature varied where the surface slope changed, because of emissivity variations. Therefore, surface emissivity might be used to map surface slope changes in regions where other surface elevation estimates are not reliable. For example, patch in Figure 5 has emissivity variations similar to those of patch ; this indicates that the surface slope changes in patch . The surface slope derived from the DEM did not show such a change, but this may be incorrect due to larger DEM errors.
The extensive presence of large depth hoar means that sublimation and condensation processes form most of the ice mass in the ice sheet after deposition. Although microwave signals are only from shallow phenomena at depth scales from 10–2 to 102 m, another possible application of this work is to use microwave emissions to detect the extent of regions where depth hoar is an initial stage of ice crystals inside of the ice sheet.
Acknowledgements
The passive-microwave data used for this study were provided by the U.S. National Snow and Ice Data Center. The DEM and bedrock topography model BEDMAP used for this analysis were downloaded from the British Antarctic Survey Internet site for the BEDMAP database (http:// www.nerc-bas.ac.uk/public/aedc/bedmap/) (Reference Liu, Jezek and LiLiu and others, 1999; Reference Lythe and VaughanLythe and others, 2001). The RADARSAT-1 Antarctic Mosaic is a product of the NASA Pathfinder Project RADARSAT-1 Antarctic Mapping Program (RAMP). Canadian partners included the Canadian Space Agency, the Canadian Centre for Remote Sensing and RADARSAT International. U.S. partners included The Ohio State University, NASA’s Alaska SAR Facility, NASA’s Jet Propulsion Laboratory and Vexcel Corporation. The author thanks R. A. Bindschadler for the critical review and helpful comments.



