As right-wing parties and candidates have gained ground in advanced democracies, political observers have routinely attributed this phenomenon to the working classes. In the UK, commentators claimed that the 2016 Brexit referendum was a “working-class revolt” (e.g., Goodwin and Heath Reference Goodwin and Heath2016; Harris Reference Harris2016; Hobolt Reference Hobolt2016). Following France’s 2017 presidential election, analysts argued that the far-right candidate, Marine Le Pen, advanced to the second round because of her working-class support (Mény Reference Mény2017). And the recent electoral successes of the far-right party Alternative for Germany has been attributed to a “new blue-collar force” (Adorf Reference Adorf2018).
In the United States, the narrative about Donald Trump’s campaign for president emphasized his unique appeal among white working-class Americans more than a year before his election. In September 2015, The Atlantic covered Trump’s campaign with the headline “The Billionaire Candidate and His Blue-Collar Following” (Brownstein Reference Brownstein2015). Robert Reich discussed the “real reason Donald Trump appeals to working-class whites” (Reich Reference Reich2015). The Wall Street Journal wondered what “Trump’s success in attracting white, working-class voters” meant for his general election strategy (Zitner and Chinni Reference Zitner and Chinni2015). And The Guardian marveled at the “working-class white people who make up the bulk of Trump’s fan base” (Frank Reference Frank2016).Footnote 1
All of this harkens back to Lipset’s formulation, sixty years ago, of “working-class authoritarianism” (Lipset Reference Lipset1959). But how much of the recent electoral success of right-wing politicians like Trump actually has to do with the working class?
Although many journalists have embraced the idea that Trump uniquely appealed to white working-class voters—what we refer to as the Trump-centered narrative about white working-class voting in the 2016 presidential election—there is ample cause for skepticism. The earliest news stories that advocated the Trump-centered narrative presented little more than cherry-picked anecdotes about colorful individuals who attended Trump rallies (e.g., Frank Reference Frank2016). When journalists subsequently presented more systematic data—often from exit polls—they used haphazard definitions of the working class. Many commentators have been imprecise about the very nature of their claims, saying things like Trump “appeals to” working-class voters or that “the working class voted for Trump” without specifying what exactly those statements mean, what threshold of support the writer has in mind, or the conditions under which the claim might be falsified. In the media, claims about Trump and the working class have been based on splashy rhetoric, not careful analysis.
Academic researchers began testing this simple narrative as early as April of 2016, before Trump had even been declared the presumptive Republican nominee (in keeping with a tradition of questioning reductionist media narratives about working-class Americans; e.g., Bartels Reference Bartels2006; Bartels and Cramer Reference Bartels and Cramer2019). A slew of studies subsequently disputed the simple idea that the working class was responsible for Trump’s win (Carnes and Lupu Reference Carnes and Lupu2016b, Reference Carnes and Lupu2017; Devega Reference Devega2017; Fiorina Reference Fiorina2017; Manza and Crowley Reference Manza and Crowley2017; Rodden Reference Rodden2017; Silver Reference Silver2016; more recently, see Green and McElwee Reference Green and McElwee2019). After the 2016 election, a related body of research also emerged that argued that Trump’s support had more to do with racism and anti-immigrant sentiment than it did with the economic anxiety that journalists often portrayed as the driving force behind Trump’s alleged working-class appeal (e.g., Mutz Reference Mutz2018a; Schaffner, MacWilliams, and Tatishe Reference Schaffner, MacWilliams and Tatishe2018; Sides, Tesler, and Vavreck Reference Sides, Tesler and Vavreck2018; Smith and Hanley Reference Smith and Hanley2018).
Nevertheless, a growing body of academic research has stridently advocated the Trump-centered narrative about the working class in 2016 (e.g., Lamont, Park, and Ayala-Hurtado Reference Lamont, Park and Ayala-Hurtado2017; McQuarrie Reference McQuarrie2017; Morgan and Lee Reference Morgan and Lee2018).Footnote 2 As Morgan (Reference Morgan2018, 1) recently summarized, a “first wave of sociological research on the 2016 presidential election has now been published, and a prominent theme of that research is the appeal of Trump’s campaign to white, working-class voters.” This literature, however, has often rested on a shaky empirical foundation, in large part because almost none of the studies in this wave of research have used the over-time, individual-level data on class and voting that researchers would need to test claims about how white working-class voting changed in response to Trump’s unique candidacy—or even data on how white working-class citizens voted in 2016.
Lamont, Park, and Ayala-Hurtado (Reference Lamont, Park and Ayala-Hurtado2017), for instance, assess Trump’s appeal among the white working class by analyzing the text of his speeches, not the actual behavior of white working-class votersFootnote 3 (an approach that hinges on the dubious assumption that Trump’s inflammatory rhetoric about women, immigrants, Muslims, people of color, and so on disproportionately energized working-class whites). McQuarrie’s (Reference McQuarrie2017) analysis of “the revolt of the Rust Belt” does not link its keen historical narrative to any individual-level data on how working-class voters actually changed over time. Likewise, Morgan and Lee (Reference Morgan and Lee2017) analyze data on voter turnout and public opinion among different classes of Americans, but not data on whether working-class whites actually voted for Trump.
Other studies have relied on county-level voting data. Monnat and Brown (Reference Monnat and Brown2017, 229) argue that “Trump performed better in counties with more economic distress, worse health, higher drug, alcohol and suicide mortality rates, lower educational attainment, and higher marital separation/divorce rates,” and Morgan and Lee (Reference Morgan and Lee2018) claimFootnote 4 that “Trump’s gains in 2016 above Romney’s performance in 2012 are strongly related to the proportion of the voting population in each area that was white and working class.” But inferring individual behavior from these ecological patterns is problematic.Footnote 5 In the growing literature on the Trump-centered narrative about white working-class voting in 2016, there has been remarkably little research using data on whether white working-class Americans voted for Trump, or whether 2016 was really all that different from prior elections.
We aim to make two empirical contributions to this emerging debate: we bring individual-level data to bear on several variants of the idea that Trump was uniquely appealing to the white working class in 2016, and we use over-time data on white working-class voting behavior to add crucial historical context to a body of research that has so far focused mostly on just one or, at most, two elections.
To our knowledge, ours is the first paper to use data from all of the relevant individual-level academic surveys conducted after the 2016 election to test the four empirical claims that seem to make up the bulk of the popular and scholarly Trump-centered perspective about the white working class in 2016: (1) that most Trump voters were white working-class Americans, (“working-class white people … make up the bulk of Trump’s fan base”; Frank Reference Frank2016); (2) that most white working-class voters supported Trump (“this demographic has embraced Trump”; Rothenberg Reference Rothenberg2019, 1); (3) that large numbers of white working-class voters who had cast ballots for Obama in 2012 switched to Trump in 2016 (“Trump won millions of working-class white voters in the Midwest, the constituency and the region hit hardest by globalization, who had previously voted for Barack Obama”; Douthat Reference Douthat2018, 1); and (4) that white working-class voters were pivotal in several key swing states (“[Trump] breach[ed] the Democrats’ ‘blue wall’ at its weakest point—the blue-collar Rust Belt—and rumble[d] to victory”; Brownstein Reference Brownstein2016, 1).Footnote 6 We find that each of these claims is either false or misleading. Three do not square at all with available survey evidence; and the one that does (that most white working-class voters supported Trump) lacks crucial over-time context that casts doubt on the idea that Trump uniquely appealed to working-class Americans. The white working class was not uniquely central to Trump’s election, and there was nothing unprecedented about his support among this group.
To the contrary, our analyses of over-time data highlight what we think is a more accurate narrative, namely, that white working-class Americans have been gradually supporting Republican presidential candidates at higher and higher rates for the past two and a half decades. This surely deserves more scholarly attention, but we cannot hope to understand this slow-but-steady process by focusing on a single election or candidate. The shift among white working-class voters has been a gradual change, not an abrupt realignment sparked by Trump’s campaign. The focus on Trump’s appeal among working-class voters usefully calls attention to white working-class Americans but badly mischaracterizes important long-term trends.
Surveys from the 2016 Election
To test the four claims that make up the bulk of the Trump-centered narrative about the white working class in 2016, we gathered all of the available academic surveys conducted in 2016 that included questions about how respondents voted in the presidential election. These are the American National Election Studies (ANES), the Cooperative Congressional Election Study (CCES), and the Views of the Electorate Research (VOTER) panel study. We rely primarily on the 2016 waves of these studies, but in some cases we also return to surveys conducted during prior elections as points of comparison: the 2012 wave of the VOTER panel, the individual ANES surveys conducted around presidential elections between 1980 and 2012, the 2008 and 2012 CCES studies, and the 2000–2004 ANES panel study.Footnote 7
These studies provide different kinds of information about the economic or social class backgrounds of survey respondents. Like most class analysts (e.g., Hout, Manza, and Brooks Reference Hout, Manza and Brooks1995; Weeden and Grusky Reference Weeden and Grusky2005; Wright Reference Wright and Hall1997), we prefer to measure social class with occupational data, that is, information about how a person earns a living. However, only the 2016 ANES (and a handful of past ANES studies) included detailed occupational information about respondents. For the sake of comparability, we therefore use a combination of education and household incomeFootnote 8 to identify working-class respondents in our main analysis. Following previous studies (e.g., Bartels Reference Bartels2006), we define working-class respondents as those who do not hold a college degree and report annual household incomes below the median, as reported by the Census Bureau (in 2016, for instance, the median annual household income was nearly $60,000).
Why not simply use income or education in isolation? Income alone is a problematic measure of membership in the working class because incomes fluctuate over the course of careers and in response to short-term shocks. A factory worker and a PhD student at Princeton might both earn household incomes below the median, but it would not make sense to say that both are members of the working class.Footnote 9 As for education, as we highlight in more detail in Section II of the online appendix, educational attainment on its own—although widely used by journalists (and sometimes academics) to define the working class—is also problematic. Many Americans without college degrees achieve a level of affluence that would be difficult to square with any definition of working class. In fact, Bartels (Reference Bartels2006, 205) reports that in 2004 “the economic circumstances of whites without college degrees were not much different from those of America as a whole.” Whites without college degrees run the gamut from lower-income manual laborers and service workers to business leaders and titans of industry, but the latter probably are not what commentators have had in mind when they have written about Trump’s special appeal among working-class Americans.
Why not use occupational data, then? Recent research on the working class has often defined workers as people employed in manual labor, service industry, and clerical jobs (e.g., Carnes Reference Carnes2013, Reference Carnes2018; Carnes and Lupu Reference Carnes and Lupu2015, Reference Carnes and Lupu2016a). When we use a similar approach to study the 2016 ANES’s occupational data (refer to table A1), we reach the same basic conclusions about Trump and the working class (largely because our occupation-based measure and our measure based on income and education classify respondents the same more than 80% of the timeFootnote 10 ). But since most of the other surveys in our analysis do not include data on respondents’ occupations, we rely on income and education to test claims about Trump and the white working class.
Finally, why not use subjective class, that is, whether a person self-identifies with the working class? Subjective class measures can fluctuate and can even respond to political narratives. If journalists converge on the narrative that Trump voters are “working class,” some might reclassify themselves on surveys, making it seem as though a social class has changed its voting behavior when in fact voters have simply changed how they respond to subjective social class questions on surveys. We therefore prefer measures of class rooted in survey questions about occupation, income, or education, although auxiliary analyses with the ANES’s questions about subjective identification as working class (refer to figure A1) do not challenge our basic conclusions. (Among subjective working-class identifiers, Trump still performs like a typical Republican.)
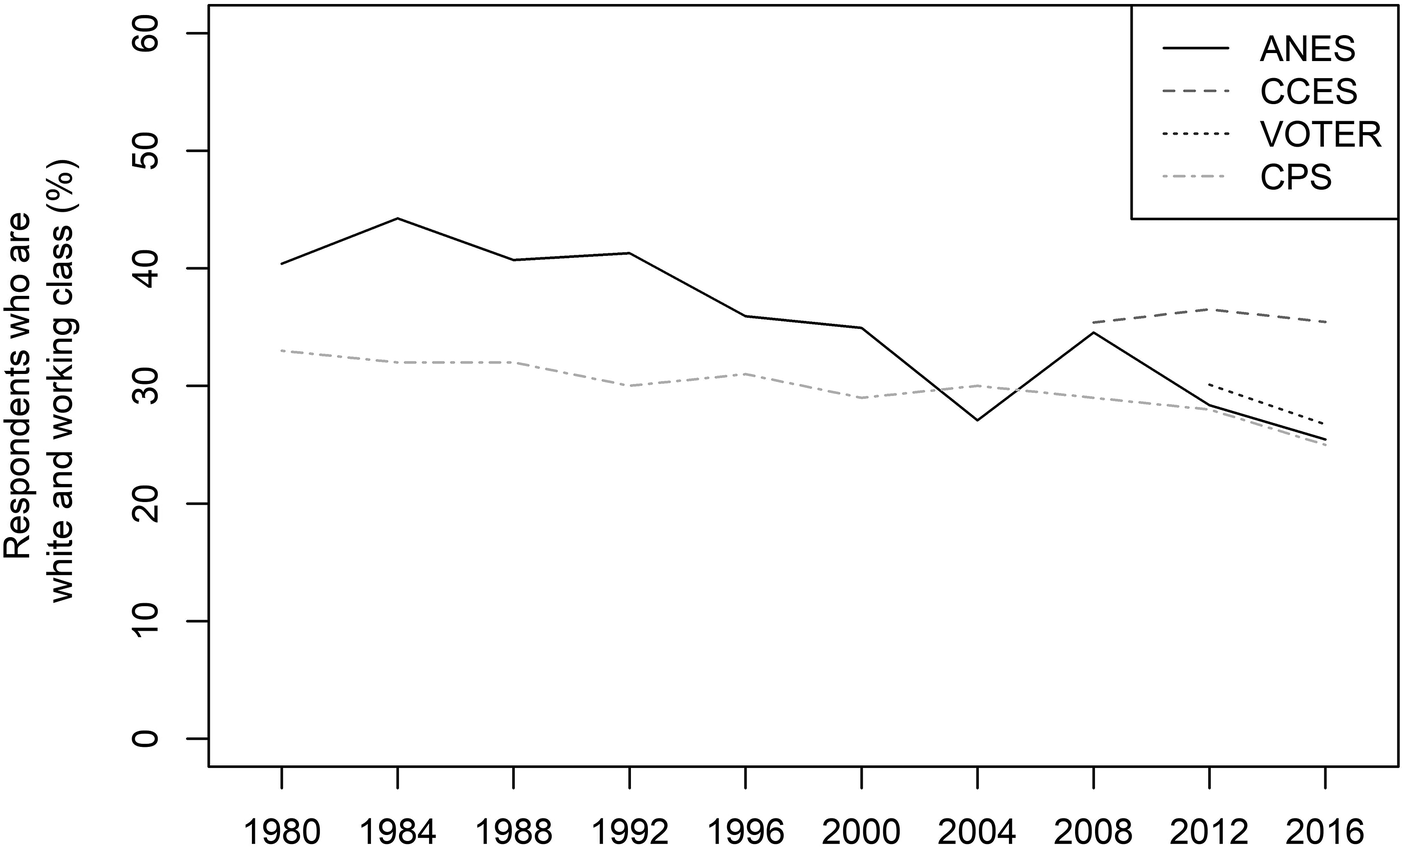
Figure 1 plots the percentages of white working-class respondents—using our income- and education-based measure—in the surveys we analyze, as well as in the U.S. Census Bureau’s Current Population Survey (Flood et al. Reference Flood, King, Rodgers, Ruggles and Warren2018), which provides a benchmark for assessing how over- or underrepresented these Americans are in the ANES, CCES, and VOTER samples. As the United States has become more racially and ethnically diverse and as college attainment has expanded, people who fit our definition of the white working class have become a smaller share of the country (as the Census Bureau’s CPS data illustrates) and a smaller share of the respondents in the longest-running election survey we analyze, the ANES.
The white working class in election surveys
Notes: Values indicate the proportion of respondents in each survey who were white and working class. The white working class are non-Hispanic white respondents with no college degree and annual household incomes below the median.
Sources: ANES 1980–2016; CCES 2008–2016; CPS 1980-2016; VOTER.

Even when we use the weights provided with each survey, white working-class respondents are often overrepresented relative to their numbers in the population as a whole, especially in the ANES prior to the mid-2000s and in the three waves of the CCES that we analyze.Footnote 11 As such, in our analyses we use updated weights that reweight the surveys’ weighted samples to account for the misrepresentation of white working-class respondents relative to Census-based estimates.Footnote 12
Do these data support the idea that Trump uniquely appealed to the white working class in 2016? The sections that follow evaluate four versions of the Trump-centered narrative.
Claim 1: Most Trump Voters Were from the White Working Class
Commentators routinely depict the typical Trump voter as white and working-class. According to this version of the larger Trump-centered narrative about white working-class voting in 2016, the people who supported Trump were mostly white working-class people; that is, if we focus on Trump voters, we will mostly see white working-class Americans. (In the next section we test the related but distinct idea that if we focus on white working-class people, we will mostly see Trump voters.) Was Trump’s appeal among the working class so great that “working-class white people … [made] up the bulk of Trump’s fan base” (Frank Reference Frank2016)?
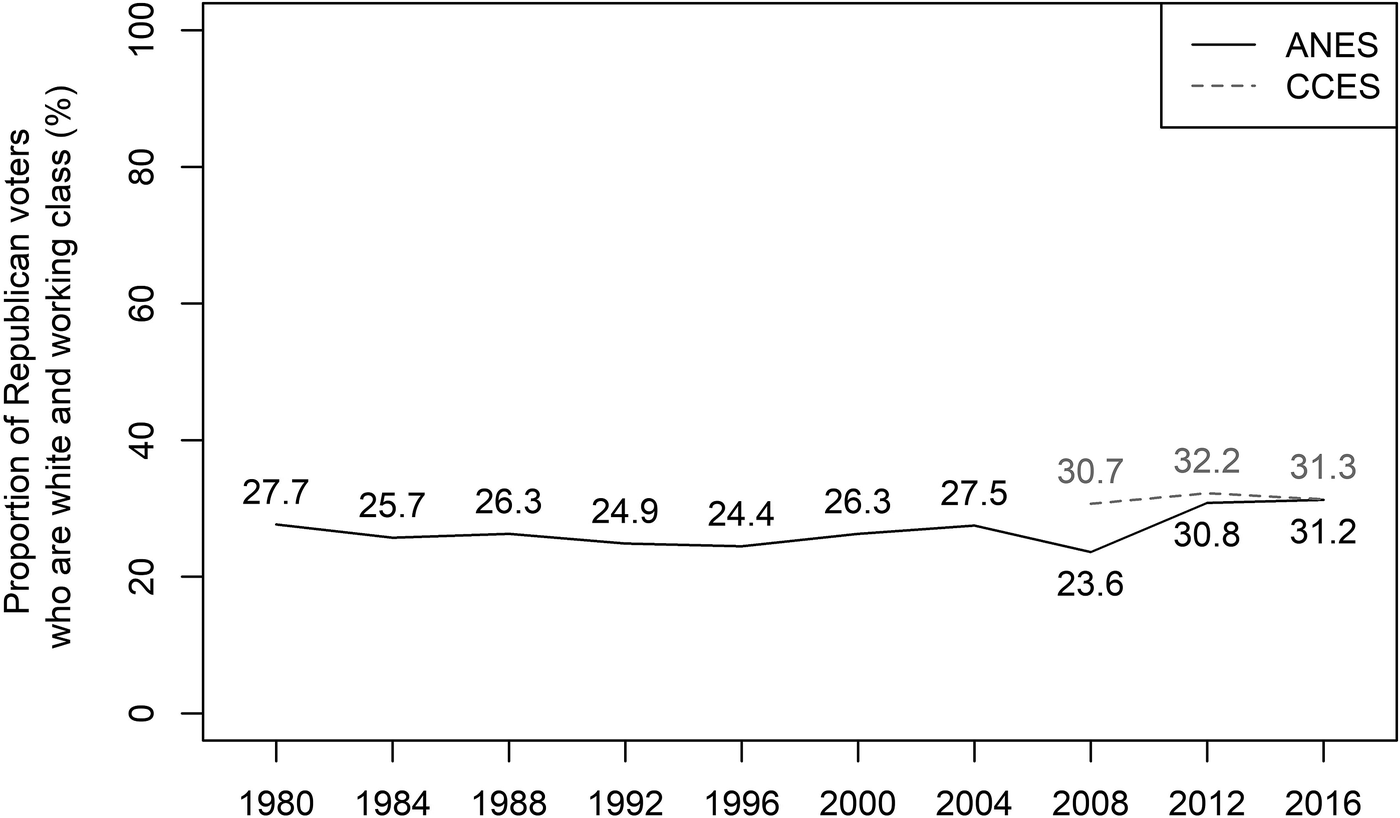
The data simply do not support this popular journalistic refrain. Figure 2 shows the share of voters for the Republican presidential candidate in 2016 who were white and working class, according to both the ANES and CCES studies, as well as the share in earlier CCES waves (2008 and 2012) and earlier ANES waves (from 1980 to the present). It is easy to see from the last data points on the right of the graph that the white working-class was a minority of Trump voters in 2016, just as they have been in other recent presidential elections. In fact, the typical Trump voter was relatively affluent (see also Silver Reference Silver2016).Footnote 13 It is simply factually wrong to claim that the bulk of Trump’s voters came from the white working class.
The white working class’s share of the Republican presidential vote
Notes: Values indicate the white working-class share of Republican presidential voters in each election. The white working class are non-Hispanic white respondents with no college degree and annual household incomes below the median.
Sources: ANES 1980–2016; CCES 2008–2016.

To the contrary, viewed this way, Trump’s relationship to the white working class seems unremarkable: 31% of his voters were white working-class people, almost exactly the same as Mitt Romney before him.Footnote 14 Whereas observers have marveled at Trump’s alleged “success in attracting white, working-class voters” (Zitner and Chinni Reference Zitner and Chinni2015), he seems no more successful than his predecessor was at building a white working-class Republican electoral coalition. As figure 2 illustrates, the white working class has slowly made up a larger and larger share of Republican presidential voters since 1996 (we suspect that the dip in the ANES in 2008 is an artifact of some feature of the survey sample; it is not evident in the CCES or when we use alternative weights; refer to figure A2). In fact, this growth seems to have plateaued in 2016. Far from having a unique appeal to the working class, Trump is the first Republican candidate since Bob Dole to not see an increase in the share of Republican presidential voters who were white and working class.Footnote 15
There is simply no evidence that white working-class people made up most Trump voters, or even that white working-class people made up an unexpectedly large minority of Republican voters in 2016. The white working class has constituted a slowly-growing share of GOP voters in recent elections—an impressive finding given that white working-class people are declining as a share of all Americans (see figure 1)—and that feature of the evolution of the national Republican coalition deserves more attention from scholars and commentators. However, it is not the case that most Trump voters were white working-class Americans, and Trump-centered arguments that cast his 2016 voters as mostly or exceptionally white and working class seriously misrepresent the long-term evolution of the Republican electorate.
Claim 2: Most White Working-Class Voters Supported Trump
A second common Trump-centered claim about the relationship between race, class, and voting in 2016 argues that most white working-class people cast their votes for Trump. Even if middle- and upper-class Trump supporters outnumbered white working-class Trump supporters (as we saw in the previous section), it might still be the case that in 2016 a wave of red hats swept through America’s white working class.
Indeed, journalists and commentators often say that Trump uniquely appealed to the white working class and that they were “uniformly in Trump’s corner” (Rubin Reference Rubin2018). Unlike prior Republican candidates, the narrative goes, Trump’s rhetoric and personal qualities uniquely positioned him to cash in on the disaffection and grievances of the white working class (e.g., Lamont, Park, and Ayala-Hurtado Reference Lamont, Park and Ayala-Hurtado2017).
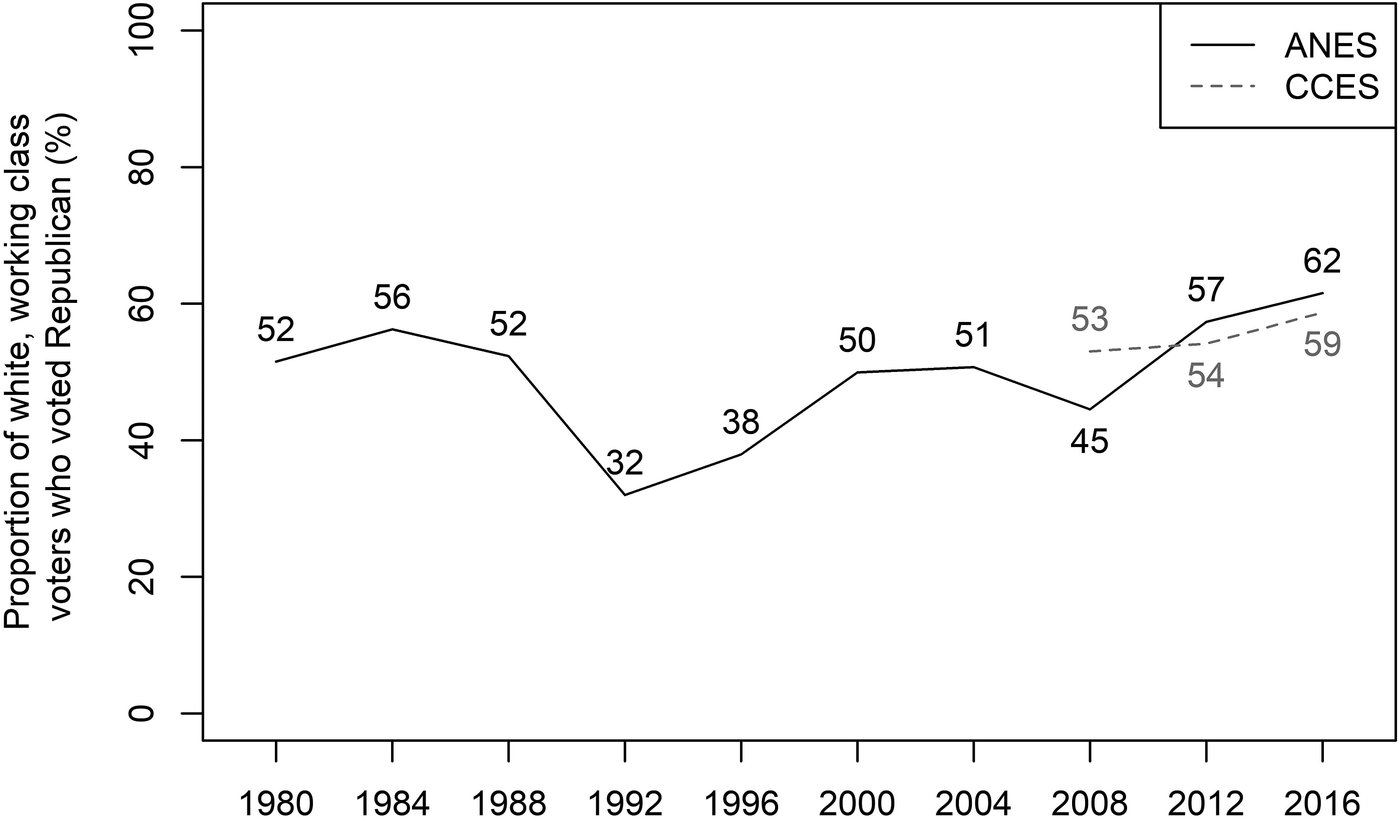
Figure 3 focuses not on Republicans (as figure 2 did), but on white working-class voters, plotting the percentage of them who supported Republican presidential candidates in 2008, 2012, and 2016 (CCES and ANES) and in all other presidential elections since 1980 (ANES only). According to these data, Trump indeed won over a majority of white working-class voters in 2016—but so did Mitt Romney in 2012, George W. Bush in 2004 and 2008, George H.W. Bush in 1988, and Ronald Reagan in 1980 and 1984. In 2016, most white working-class voters supported Trump, but that was not as unusual as Trump-centered narratives make it seem, and the white working class was by no means “uniformly in [Trump’s] corner”—around 40% voted for Hillary Clinton.
Percentage of white working-class voters who supported Republicans
Notes: Values indicate the share of white working-class voters who voted for the Republican presidential candidate in each election. The white working class are non-Hispanic white respondents with no college degree and annual household incomes below the median.
Sources: ANES 1980–2016; CCES 2012–2016.

Of course, the five percentage-point increase between 2012 and 2016 in figure 3 is noteworthy; Trump won over a larger percentage of white working-class voters than any past Republican presidential candidate, at least according to this measure of the working class.Footnote 16 This is perhaps the strongest evidence we find in support of any Trump-centered narrative about white working-class voting in 2016. However, the findings in figure 3 also illustrate that Trump’s gains among the working class were not the sudden spike or abrupt realignment envisioned in many Trump-centered arguments about the white working class in 2016. The share of white working-class voters who cast their ballots for the Republican presidential candidate has been climbing steadily since 1992 (see also Stonecash Reference Stonecash2017). The share of workers voting Republican increased in 2016, but by less than it increased when Bob Dole ran in 1996 or when George W. Bush ran in 2000.
Trump seems to have continued the decades-long expansion of Republican support among white working-class Americans, and indeed a record-setting majority supported him. But a majority also supported his predecessor, and without seeing how subsequent Republicans perform among this group, it is difficult to know whether Trump was uniquely able to attract white working-class voters or simply the beneficiary of long-term growth in Republican support among the white working class. Analysts wondering “why the white, working class voted for Trump” would do well to remember that the white working class also voted for Romney, Reagan, and both Bushes, and consider why these more conventional Republican candidates had been steadily gaining ground among white working-class voters well before Trump.
Claim 3: Working-Class Voters Switched from Obama to Trump at High Rates
A third version of the narrative about Trump and the white working class asserts that working-class voters who had supported Obama in 2012 flocked to Trump in 2016 (Morgan and Lee Reference Morgan and Lee2018).Footnote 17 This claim is slightly more elaborate than the simpler idea that unusually large numbers of white working-class people voted for Trump. In this version, Trump appealed to the white working class, and many of those same white workers had supported Obama just four years earlier.
There are at least three reasons to doubt this claim up front (see also Mutz Reference Mutz2018b). First, some of the evidence for this claim is based on surveys conducted in 2016 that asked voters how they voted in 2012 (Morgan and Lee Reference Morgan and Lee2018). However, survey respondents are notoriously bad at recalling past behavior (Belli et al. Reference Belli, Traugott, Young and McGonagle1999; Tourangeau, Rips, and Rasinski Reference Tourangeau, Rips and Rasinski2000; van Elsas et al. Reference van Elsas, Lubbe, van der Meer and van der Brug2014; Waldahl and Aardal Reference Waldahl and Aardal2002), especially when that behavior took place several years prior. Some studies suggest that voters are more likely to say that they voted for prior winners in vote recall questions (Atkeson Reference Atkeson1999; Wright Reference Wright1993),Footnote 18 especially as more time elapses between the election and the interview. Other analyses find that voters exaggerate their consistency over time (van Elsas et al. Reference van Elsas, Lubbe, van der Meer and van der Brug2014; Waldahl and Aardal Reference Waldahl and Aardal2002). Recent studies even suggest that respondents have begun intentionally “trolling” academic surveys (Lopez and Hillygus Reference Lopez and Hillygus2018). Asking 2016 Trump voters how they voted in 2012—the empirical exercise at the heart of some recent efforts to claim that Trump uniquely appealed to the white working class—is unlikely to yield accurate responses.
The other source of data that scholars have offered in support of the idea that Trump inspired legions of working-class Obama switchers—county-level data on presidential vote outcomes—is also highly suspect. A handful of recent studies argue that in counties with large numbers of white working-class people, Trump performed better than Romney, which the authors interpret as evidence that white working-class people switched their allegiances from Obama to Trump (e.g., McQuarrie Reference McQuarrie2017; Morgan and Lee Reference Morgan and Lee2018). These analyses are textbook ecological fallacies; they wrongly infer individual-level behavior from aggregate trends. It could be that working-class counties shifted to Trump because working-class people shifted to Trump, or it could be that affluent voters living in counties with more white working-class voters turned out for Trump more than they did for Romney (and there are some indications that it was the latter, in fact; see Ogorzalek, Piston, and Puig forthcoming). Researchers armed with county-level data simply cannot make inferences about how individual voters behaved; as Sides, Tesler, and Vavreck (Reference Sides, Tesler and Vavreck2018, 172) put it, “counties do not vote. People do.”
A third problem with popular arguments about working-class Obama switchers is that neither commentators nor scholars have, to our knowledge, described a benchmark for what would constitute an unusually large amount of switching. Vote switching occurs in every presidential election, and observers can always marvel at the number of vote switchers from any given social group. But knowing that there were vote switchers is not the same as knowing that there were an unusually large number of vote switchers. Even if many white working-class voters switched from Obama in 2012 to Trump in 2016, if the level of switching was comparable to switching rates in previous elections—or switching rates in the opposite direction in the same election—it would be difficult to maintain that Trump had a special appeal among the white working class.
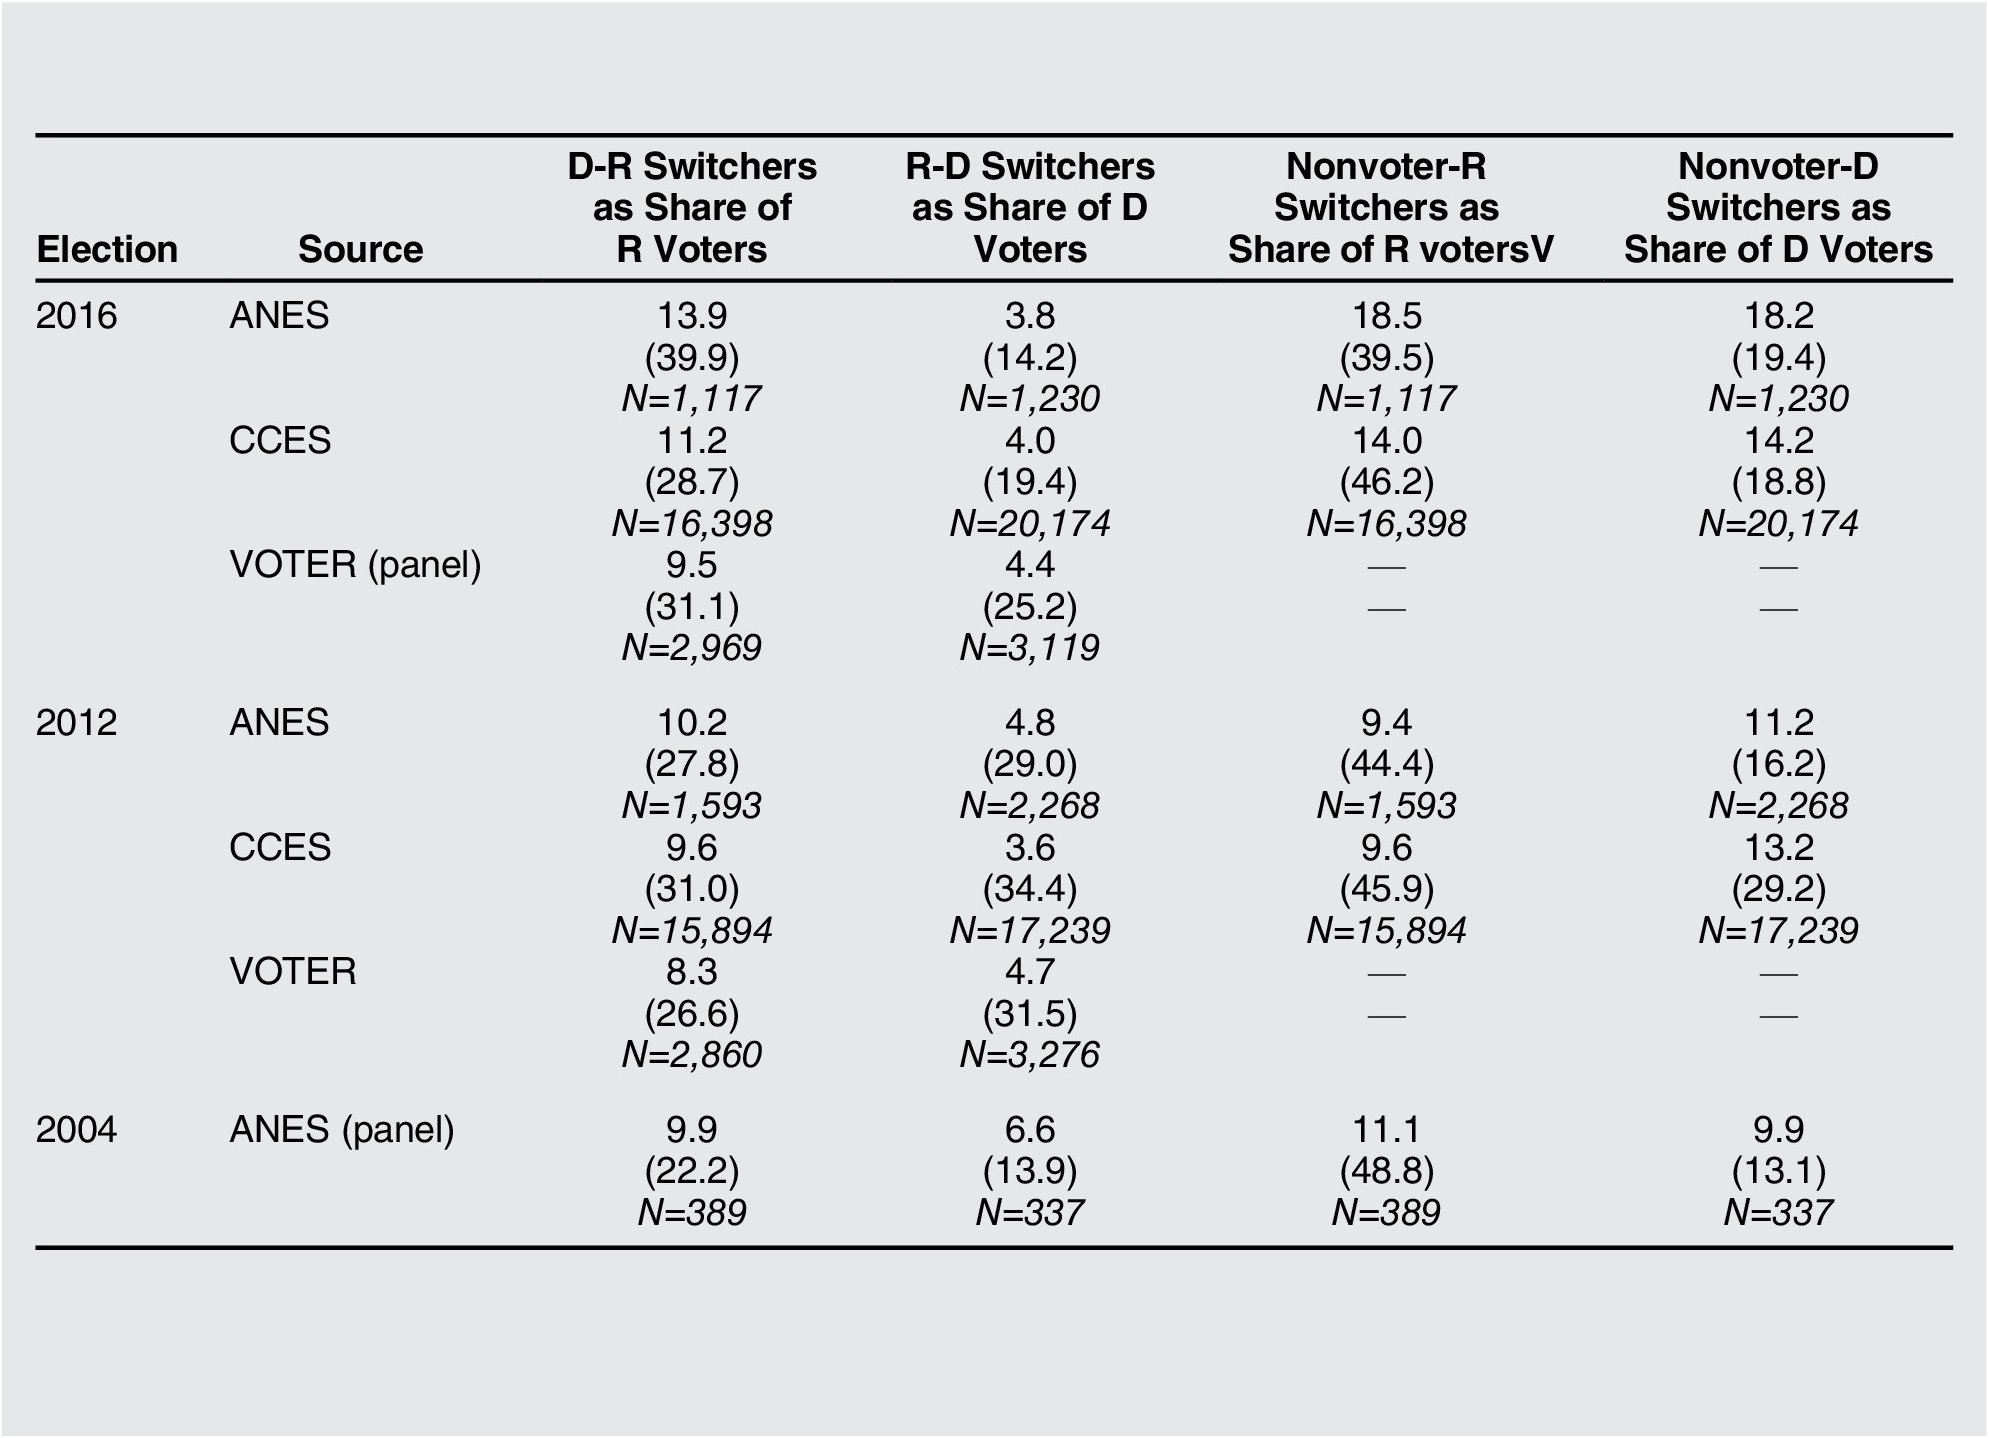
The non-parenthetical numbers in table 1 report the overall rates of vote switching in the entire population in 2012 and 2016, as estimated using the only three relevant academic surveys that we know of, the ANES, CCES, and VOTER studies. According to the ANES—the survey cited by some proponents of the Obama-Trump vote switching claim—roughly 32% of Trump voters reported either voting for Obama in 2012 or not voting at all that year. In contrast, only 22% of Clinton voters in the 2016 ANES said that they had voted for Romney or not voted in 2012. Perhaps Trump really did master the art of the steal.
Vote switching in 2016, 2012, and 2004

Notes: Values indicate the share of respondents who were switchers, by survey. Values in parentheses are the proportion of each type of switcher who were white and working-class. The white working class are non-Hispanic white respondents with no college degree and annual household incomes below the median.
Sources: ANES 2000-04, 2012, 2016; CCES 2016; VOTER.
Then again, when we look beyond the ANES, the picture becomes far less clear (see also Reny, Collingwood, and Valenzuela Reference Reny, Collingwood and Valenzuela2019). In keeping with the idea that vote recall data are unreliable, the same questions in the CCES elicited substantially lower—and considerably more equal—rates of self-reported vote switching. In that survey, people who claimed to be switchers were 25% of Trump voters (compared to 32% in the ANES) and 18% of Clinton voters (compared to 22% in the ANES).
Which of these studies is closer to the truth? We cannot know for certain, because both studies ask voters in 2016 to recall how they voted in 2012. But we can turn to the VOTER panel study to at least assuage concerns about respondents misreporting their 2012 behavior four years after the fact.Footnote 19 The VOTER study is a panel that re-interviewed respondents from the 2012 Cooperative Campaign Analysis Project (CCAP) survey. Since the VOTER study is limited to voters, we cannot validate rates of switching for those who did not vote in 2012. But as table 1 reports, the VOTER estimates of Obama-Trump and Romney-Clinton switching are closer to what the CCES respondents reported. According to the VOTER panel, in fact, the CCES may still overestimate the number of Obama-Trump switchers (consistent with studies that argue that misreporting more often favors the winner). If the VOTER panel is right, the overall shares of Trump and Clinton voters who had cast ballots for the opposing party’s candidate in 2012 were not all that far apart, although Trump still seems to have had an edge.
But what about the white working class? Were white working-class voters the bulk of Obama-Trump switchers?Footnote 20 For each switcher proportion reported in table 1, we also calculated the proportion of those switchers who were white and working class (reported in parentheses). Of course, we need to be careful not to put too much stock in proportions derived from fairly small samples. In the ANES, for instance, Obama-Trump switchers are just 155 respondents. The CCES and VOTER panel provide substantially larger samples.
Again, the ANES is the clear outlier, yielding the highest proportions of white working-class voters among the switchers. According to the CCES and VOTER panel, the proportion of Obama-Trump switchers who were white and working class seems to have been roughly 30%, a figure that is roughly equal to the proportion of all voters in 2016 who were white and working class (refer to figure 1), and the proportion of Trump voters in 2016 who were white and working class (refer to figure 2). It was only slightly higher than the proportion of Romney-Clinton switchers who were white and working class. In both these studies, white working-class respondents made up unremarkable percentages of Obama-Trump switchers; they were not a majority of those who defected to Trump or even overrepresented among those who defected to Trump.Footnote 21
Nor was there anything historically unusual about white working-class switching in 2016 that would lend credence to a Trump-centered account of white working-class voting that year. Table 1 also includes summaries of self-reported switching between the 2008 and 2012 elections, from the ANES, the CCES, and the 2011 wave of the VOTER panel, which asked first-time interviewees how they had voted in 2008. (Unfortunately, we know of no panel survey of presidential voting that re-interviewed the same subjects in 2008 and 2012, so we look at recall data here.) The proportions of switchers were similar across all three studies—and similar when we compared recollections of switching in 2012 to 2016 data on both recollections of switching and switching estimated from re-interviews. In the CCES, the share of Obama-Trump switchers in 2016 was only 1.6 percentage points higher than the share of Obama-Romney switchers in 2012. The share of Romney-Clinton switchers in 2016 was 0.4 percentage points higher than the share of McCain-Obama switchers in 2012. This hardly seems like the momentous shift it has been made out to be. Indeed, with the exception of the 2016 ANES, the rates of switching documented in table 1 were on par with the typical rates of vote switching observed in American politics (Erikson and Wlezien Reference Erikson and Wlezien2012).Footnote 22
The proportion of white, working-class voters among these switchers was also fairly constant over time. Roughly one-third of switchers were white and working class in both 2012 and 2016. In fact, in the CCES, the white working class made up a larger percentage of Obama-Romney switchers in 2012 than Obama-Trump switchers in 2016. Again, we must be extremely cautious about drawing strong conclusions from such small samples and respondents’ self-reports about their behavior four years earlier. But the data we have do not support the narrative that Trump somehow inspired unprecedented numbers of workers to defect.
We also compared switching in 2016 to the data on switching in the most recent previous panel survey conducted by the ANES, which interviewed respondents in 2000 and then again in 2004 (refer to table 1). In that survey, 21% of Bush voters in 2004 had either not voted in 2000 or had cast their ballots for Al Gore, and 17% of Kerry voters in 2004 had either not voted in 2000 or had voted for Bush. These rates of switching were very close to what we observe in the CCES and VOTER studies in 2016.Footnote 23 The proportion of white working-class voters among cross-party switchers was higher in 2016 than in 2004, but not just for Trump; white working-class people also made up greater shares of Republican-to-Democrat switchers.
There simply does not seem to be anything particularly unusual about vote switching in the 2016 election, or the share of vote switchers who were white working-class Americans, at least according to the available data. Obama-Trump switchers were no more numerous or more working class than Obama-Romney or Gore-Bush switchers. Most importantly for our purposes, most switchers were not white and working class, and white working-class voters did not seem to have done more switching in 2016 than they had in prior elections. White working-class voters did not seem to abandon the Democrats for Trump at unusual rates, either compared to past elections or compared to the rates at which they abandoned the Republicans for Clinton.
Claim 4: White Working-Class Voters Were Critical in Swing States
Of course, presidential elections are won and lost in the states, not in the national popular vote. Even if there was nothing unusual about Trump’s appeal among the white working class nationally, it could still be true—as many commentators argue—that white working-class Trump supporters were pivotal in the six states that flipped in 2016 and cost Hillary Clinton the election (Florida, Iowa, Michigan, Ohio, Pennsylvania, and Wisconsin) or in the subset of so-called Rust Belt or “blue wall” states that have been the focus of many authors (Michigan, Pennsylvania, and Wisconsin). Perhaps this is what observers have in mind when they cite Trump’s unique appeal among the white working-class Trump in 2016 (Leonhardt Reference Leonhardt2018).
This claim is the hardest to evaluate empirically (a point that should raise red flags in itself). First, most national surveys do not interview enough respondents in each state to allow researchers to make inferences about how different social groups voted. The 2016 ANES, for instance, includes only 217 cases in Florida, 36 in Iowa, 138 in Michigan, 162 in Ohio, 174 in Pennsylvania, and 97 in Wisconsin—and it is not designed to produce representative samples of respondents within each state. The one exception is the CCES, which uses a much larger national sample that is designed to be representative of the population within each state. In 2016, the CCES interviewed 4,988 respondents in Florida, 688 in Iowa, 2,110 in Michigan, 2,698 in Ohio, 3,524 in Pennsylvania, and 1,354 in Wisconsin.
However, there is a second and more fundamental challenge associated with testing the claim that white working-class voters were critical to Trump’s success in the swing states, namely, that proponents rarely define what exactly it means for a social group to be critical to a candidate’s success. If being critical means being pivotal—being a group that could have changed the outcome by behaving differently—then every large social group would be pivotal by definition, and the claim that any one group was uniquely critical would be false on its face.Footnote 24
Another (more empirically testable) way to think about the claim that the white working class was critical to Trump’s victory in the swing states would be to think of it as a claim that white workers’ support for Trump in 2016 was unusually high in those states. If working-class whites were a substantially larger share of Trump supporters, or went for Trump in larger numbers as a group, or switched from Obama to Trump in larger numbers—in essence, if any of Claims 1, 2, or 3 were more true—in the swing states that cost Clinton the election, it might be reasonable to say that the white working class was uniquely important to Trump’s Electoral College victory (even if we could not prove that they were pivotal per se).
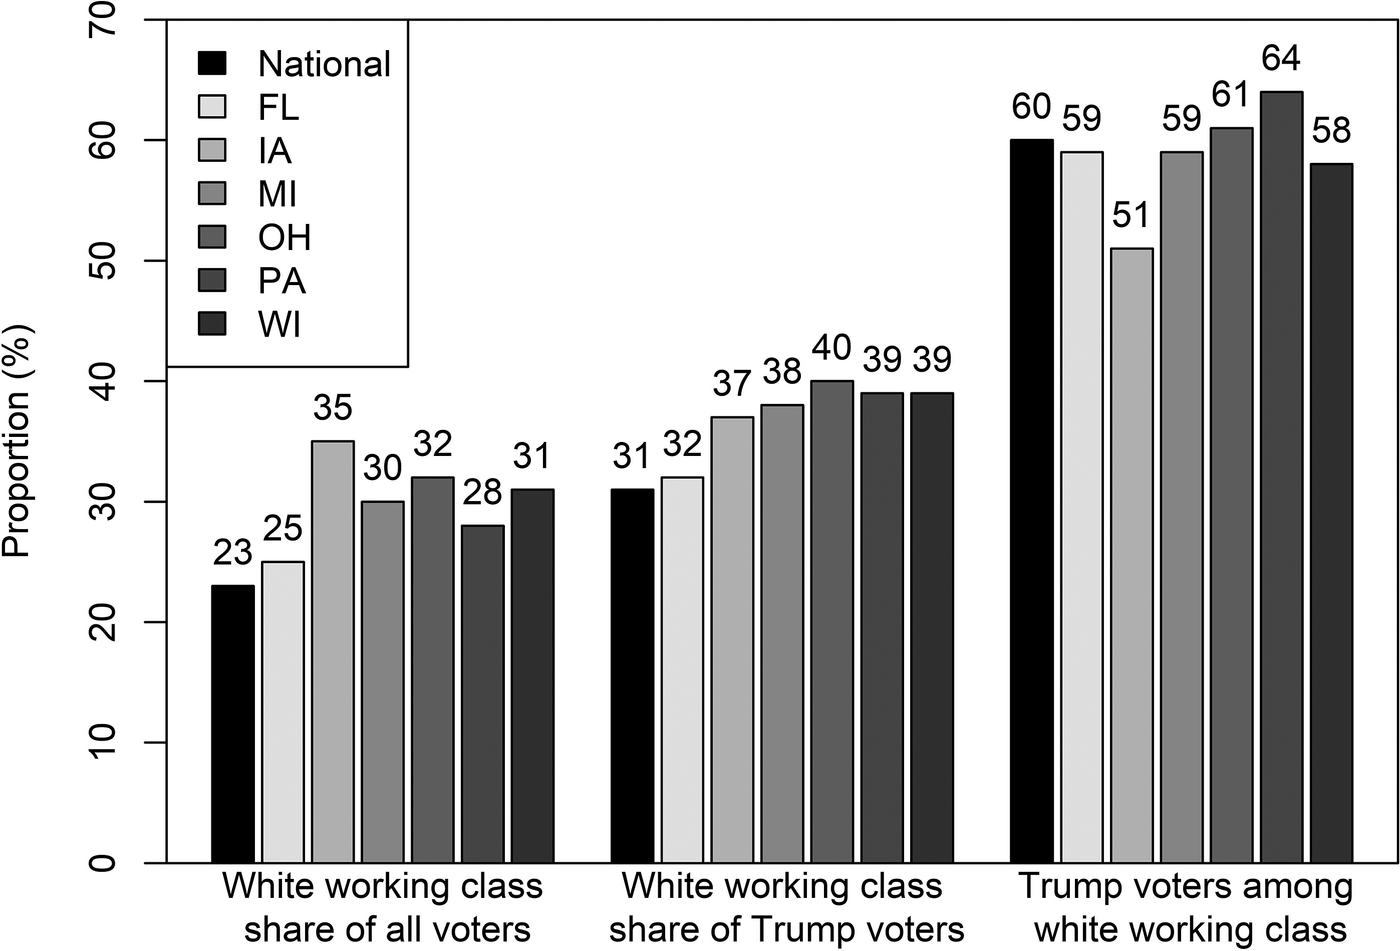
Using this standard, however, there is no evidence that the white working class was critical to Trump in 2016. Figure 4 uses CCES data to compare the voting behavior of white, working-class voters in the swing states to the national patterns discussed earlier (in our discussion of Claims 1 and 2). For comparison, the first set of bars looks at the proportion of voters who were white and working class in each of the states. The middle set of bars asks whether the white working class made up a majority of Trump voters nationally and in the swing states. Finally, the third set of bars asks whether the percentage of white working-class voters who went for Trump was higher nationally or in the swing states.
Voting behavior of the white working class in swing states
Notes: Values indicate the stated proportion nationally and within each swing state. The white working class are non-Hispanic white respondents with no college degree and annual household incomes below the median. The sample sizes for the middle set of bars are 17,392 for the nation, 1,493 in Florida, 203 in Iowa, 584 in Michigan, 772 in Ohio, 1,096 in Pennsylvania, and 385 in Wisconsin. For the right set of bars, the sample sizes are 9,421 for the nation, 796 in Florida, 157 in Iowa, 443 in Michigan, 563 in Ohio, 632 in Pennsylvania, and 262 in Wisconsin.
Source: CCES 2016.

Nothing remarkable stands out. White working-class voters did not make up a majority of Trump voters nationally (as we noted in our discussion of Claim 1) or in any of the six swing states. They did make up a larger proportion of Trump supporters in the swing states than in the nation as a whole, but we would expect as much given that white working-class voters were a larger share of all voters in those states, as the left-most set of bars indicates. Similarly, white working-class voters were also a substantially larger proportion of Clinton’s voter base in all six states (18% in Florida, 34% in Iowa, 22% in Michigan, 22% in Ohio, 18% in Pennsylvania, and 25% in Wisconsin) than they were nationally (15%).
When we focus on the white working class itself, the percentages of Trump supporters are about the same in each of the swing states as the share nationwide. The lone exception is Iowa, where white working-class people were substantially less likely to vote for Trump (on Iowa, see Sherer Reference Sherer2017).
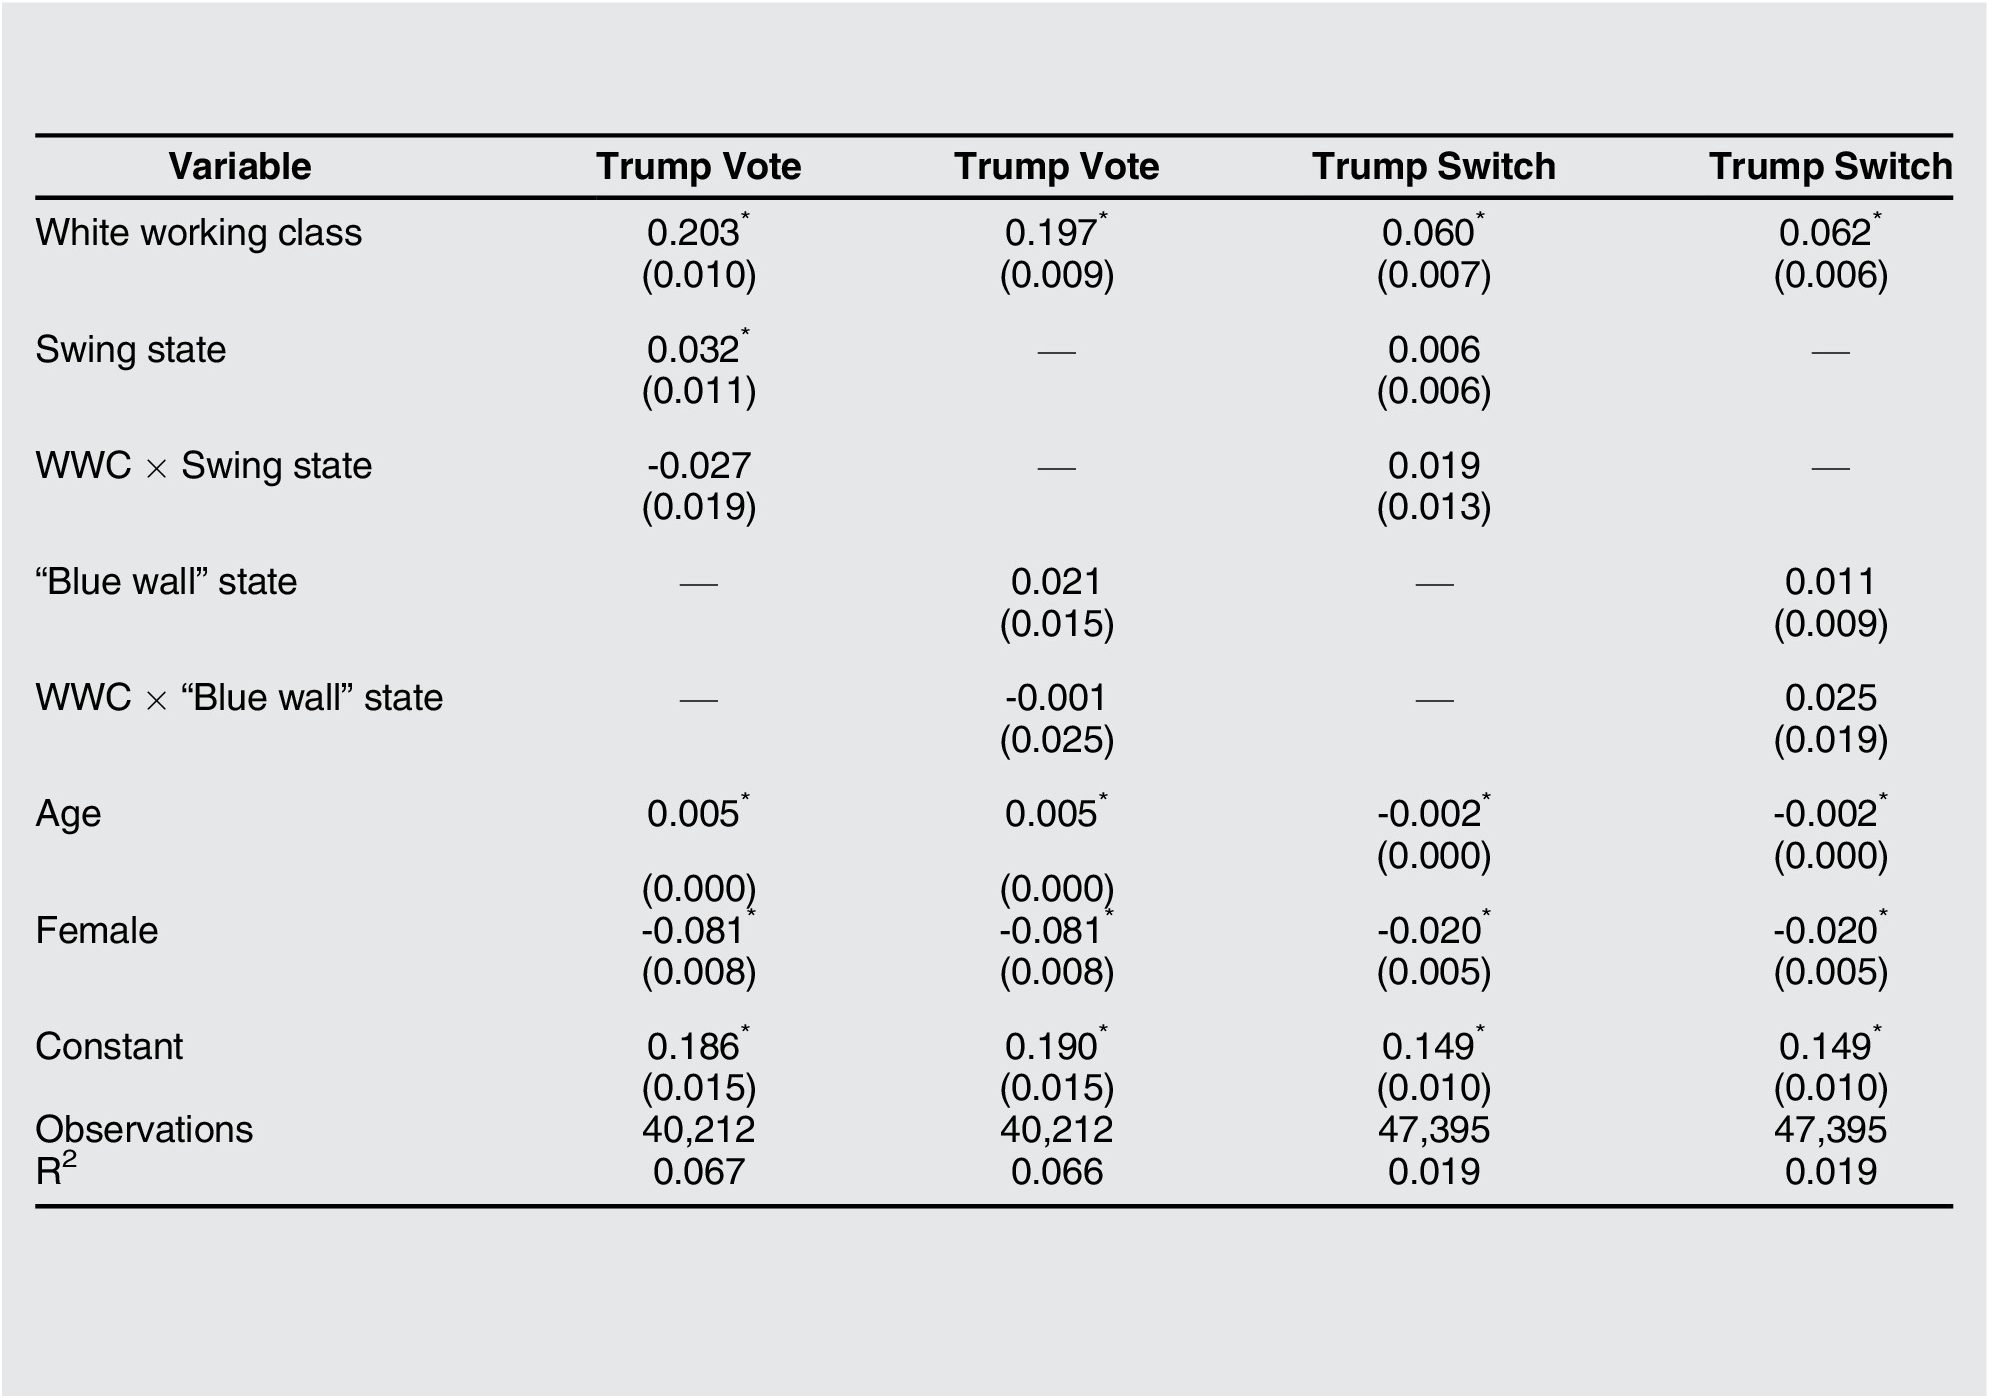
The first two columns of table 2 test these aggregate findings at the individual level. They present regression models that relate an indicator for whether each 2016 CCES respondent voted for Trump to an indicator for belonging to the white working class as well as controls for age and gender. In the first model, we also include an indicator for the six swing states referenced earlier and the interaction between that indicator and our white working-class variable. The coefficient on this interaction term captures how much more or less likely the average white working-class respondent in those states was to vote for Trump; in essence, it tests the hypothesis that white working-class respondents in these particular states were more likely to be Trump voters. The second column does the same, but focuses not on the six swing states but on the three “blue wall” states that went for Trump: Michigan, Wisconsin, and Pennsylvania.
Class and Trump support in swing states

Notes: OLS regression estimates with robust standard errors in parentheses. The white working class are non-Hispanic white respondents with no college degree and annual household incomes below the median. Swing states are Florida, Iowa, Michigan, Ohio, Pennsylvania, and Wisconsin. “Blue wall” states are Michigan, Pennsylvania, and Wisconsin. * p < 0.05
Source: CCES 2016.
As we would expect, in both regression models, the typical white working-class respondent was more likely to vote for Trump than the combined pool of non-white respondents, whites with college degrees, and whites with above-median household incomes. However, these models produce no evidence that white working-class respondents in the six swing states or the three swing “blue wall” states were more likely to vote for Trump. There was nothing exceptional about white working-class voting behavior in these states.
What about the idea that white working-class voters switched en masse from Obama to Trump? Was that claim true in the swing states? As we noted in the section on Claim 3, the 2016 CCES interviewed a fresh sample of voters and learned about how they voted in 2012 by asking them to remember (not by asking them in 2012, then re-interviewing them in 2016). Moreover, even with the relatively large samples of the CCES, when we subdivide the respondents in each state by whether they were partisan switchers and whether they belonged to the white working class, our samples get small enough to give us pause.
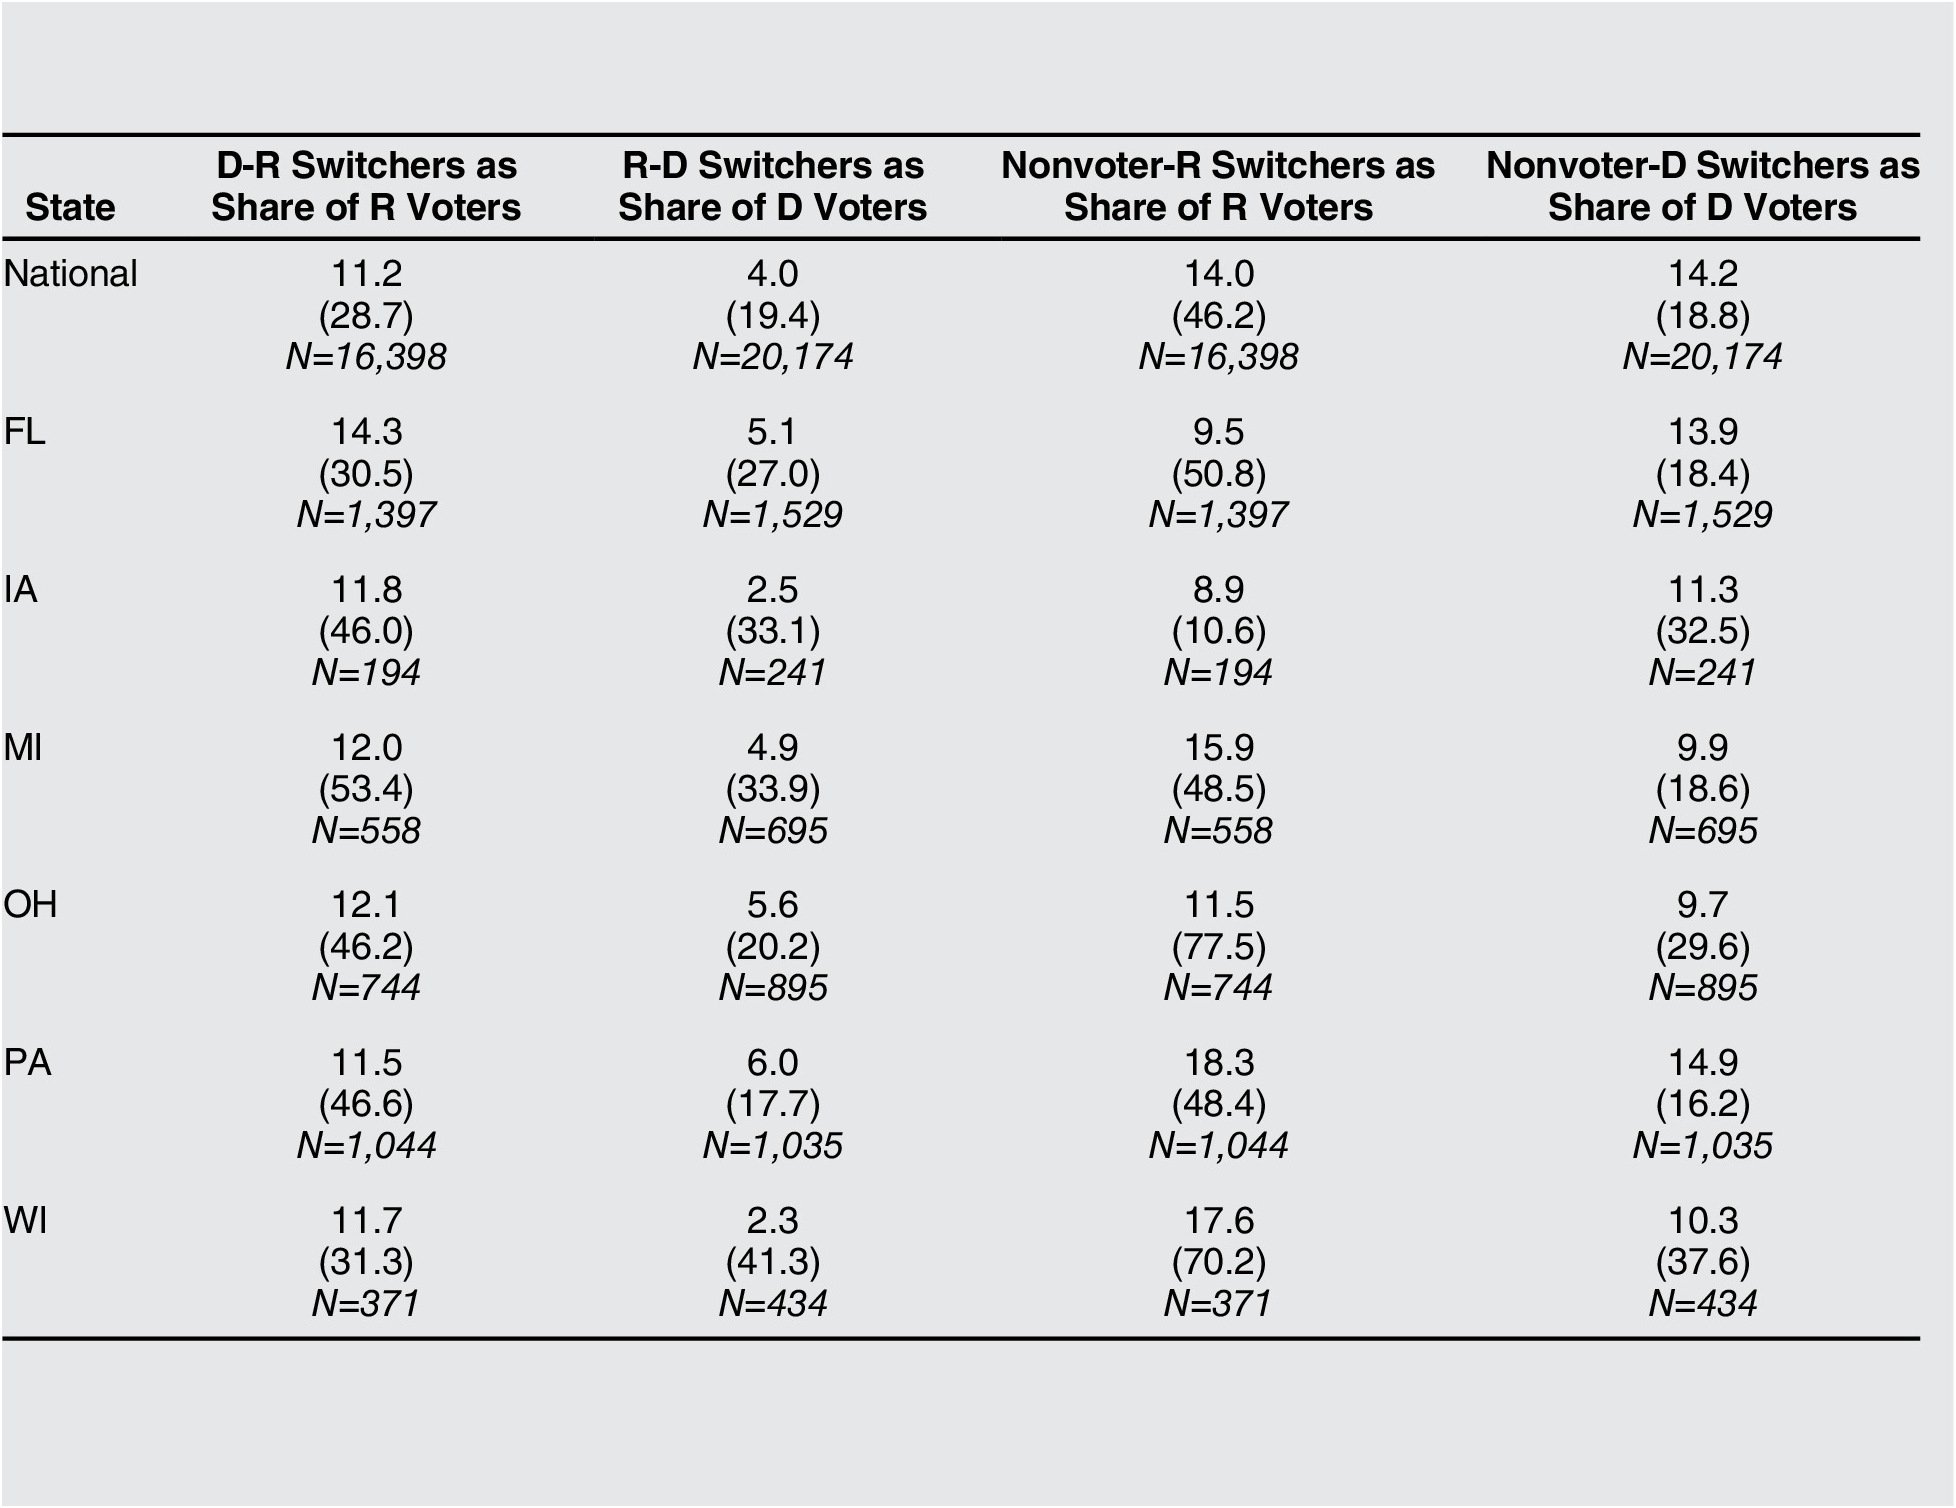
Table 3 makes the most of the available data. In all six of the swing states, voters who said they supported Obama back in 2012 made up slightly higher percentages of Trump voters (11.5% to 14.3%, as opposed to 11.2% nationally). And white working-class respondents made up larger shares of Obama-Trump switchers in all six states, including a majority in Michigan. At the same time, in three of the six swing states, those who said they had not voted in 2012 made up smaller shares of Trump voters than nationally. The share of Clinton voters who said they had cast ballots for Romney in 2012 was also higher in four of the six swing states than it was nationally, and white working-class voters made up larger shares of Romney-Clinton switchers in four of the six states than they did nationally.
Vote switching in swing states

Notes: Values indicate the share of respondents who were switchers nationally and in the swing states. Values in parentheses are the proportion of each type of switcher who were white and working-class. The white working class are non-Hispanic white respondents with no college degree and annual household incomes below the median.
Source: CCES 2016.
The third and fourth columns of table 2 test the statistical significance of these differences. (Compared to the first two columns, these have larger samples because we include nonvoters.) They present regression models that relate switching to Trump⸺an indicator for whether each 2016 CCES respondent both voted for Trump and said they had either voted for Obama or not voted in 2012⸺to an indicator for belonging to the white working class, again with controls for age and gender. As before, we are interested in the interaction between our white working-class variable and the indicators for either the six swing states or the three “blue wall” states. The coefficient on this interaction term captures how much more or less likely the average white working-class respondent in those states was to switch to Trump. These models again produce no evidence that white working-class respondents in the six swing states or the three swing “blue wall” states were more likely to switch to Trump.
Without panel data, we cannot know for certain whether these trends reflect real vote switching or some combination of misremembering and misreporting. And if working-class respondents in these states really did make up larger shares of Obama-Trump switchers, they were essentially “catching up” to white working-class Americans elsewhere, who must have already switched to the Republican Party in earlier elections (since working-class voters in these six states went for Trump at roughly the same rates as working-class voters nationwide; refer to figure 4). In other words, what might be unusual about these voters is that they had voted for Obama in 2012. And again, note that even with the large CCES samples, when we look at the composition of, say, Obama-Trump switchers in Michigan, we are talking about a sample of sixty-seven respondents.
These findings are a far cry from most narratives about Trump and the working class. It is not the case that most Trump voters were white working-class Americans, that the rate of Republican support among white-working voters spiked in 2016, that white working-class Americans disproportionately switched from Obama to Trump, or that white working-class Americans went bigger for Trump in the swing states than they did nationwide. The most we can say is that in the swing states, white working-class voters may have made up larger shares of the Trump voters who said that they had voted for Obama back in 2012. But the evidence for this is noisy at best. We doubt this collection of findings would inspire as many headlines as the racy claim that the white working class handed Trump the election.
What Is Going On?
But surely something is happening with the white working class, right? After all, figure 2 shows that white working-class Americans made up a greater share of Romney and Trump voters than McCain voters, figure 3 shows that growing majorities of white working-class voters cast ballots for Romney and Trump, and table 3 shows that the white working class made up a larger share of Trump supporters who said they voted for Obama back in 2012 in the six states that swung to Trump in 2016. Even if the broad claims about how Trump won because he uniquely appealed to the white working class are wrong, it must be the case that things are changing in American electoral politics, and that 2016 brought those changes to the fore.
We agree completely. A careful examination of the data does not support the simple idea that Trump himself uniquely mobilized the white working class, but the white working class’s participation in presidential elections has been slowly and steadily changing over the last two and a half decades in ways that have favored Republican candidates. The Trump-centered narrative about 2016 is difficult to square with actual data, but its saving grace might be that it usefully focuses our attention on the important ways that white working-class voting has been evolving since the mid-1990s.
Of course, the Trump-centered narrative can also obscure this point. By fixating on Trump and his allegedly unique appeal to the working class, observers have missed larger trends that predate Trump, that have nothing to do with his unique campaign and presidency, and that will likely continue long after he leaves office. The relationship between education, income, race, and presidential voting is evolving. But observers will never understand that evolution if they get stuck on the simple narrative that it was something about Trump that appealed to the working class. The existence of gradual historical changes—the fact that something is happening—gives journalists and scholars an imperative to study those changes carefully, not a license to endorse a loosely-related narrative that is often framed in factually inaccurate terms.
When pundits get the wrong answer, they also jump to the wrong conclusions about how to approach the next race. As Masket (Reference Masket2018) has recently shown, for instance, when voters are reminded of the post-election narrative that economic anxiety drove Trump support, they are less likely to support female and minority candidates. When scholars and pundits fixate on the narrative that Trump uniquely appealed to the working class, they miss broader historical trends, and they also make bad decisions about how to shape elections going forward. Looking ahead to the 2020 election, for instance, many commentators are focusing on how the Democratic party can “win back the [white] working class” (e.g., Flanagan Reference Flanagan2019, 1). But this perspective seems to overlook the fact that the white working class did not shift to the GOP in one election; instead, the shift was a generation-long process that would likely take another generation to reverse. For Democrats, appealing to the working class will require sustained engagement, not be the quick fix optimistically conjured by Trump-centered accounts of the 2016 election. Elections have consequences, but so, too, do our interpretations of elections.
Of course, the claims about Trump and the working class that we have tested in this paper are often phrased in ambiguous terms. It is possible that analysts could devise a version of the narrative about Trump’s special appeal to the working class that implies a hypothesis we have not yet tested. But we believe we have distilled the majority of the sweeping claims about Trump and the white working class into testable hypotheses.
Our findings suggest that it is more important for future research to grapple with questions about the causes and nature of long-term changes in the racial and social class makeup of the two parties’ electoral coalitions. In contrast to Bartels (Reference Bartels2006), who found little reason to suspect that white working-class voters were abandoning the Democratic Party, our analysis shows that they have in fact gradually moved to the GOP since the 1990s. Some scholars have already begun to study this demographic shift (e.g., Bartels and Cramer Reference Bartels and Cramer2019; Cramer Reference Cramer2016; Francis Reference Francis2018; Gest, Reny, and Mayer Reference Gest, Reny and Mayer2018), but many questions remain unanswered. Are recent changes the result of partisan conversion, differential mobilization, cohort effects, and so on? Are there particular issues or policies that Republican candidates have emphasized that are attracting the white working class? Have the seismic changes in the media landscape in the last two decades contributed to the long-term trends documented in this paper? We still have a lot to learn about the white working class’s slow move towards the GOP—but we cannot hope to understand a gradual change over the course of a quarter century by focusing myopically on why people voted for Donald Trump in 2016.
It would also be profitable for scholars to investigate why observers were so quick to embrace the narrative about Trump and the working class, often without evidence, or based on analyses that would normally make critical observers bristle (see Bhambra Reference Bhambra2017). Why did journalists and scholars flock to the idea that Trump had a special relationship with the white working class? We suspect that the answer may have something to do with the fact that most journalists and scholars are not Trump supporters or people who have much contact with the white working class, or the fact that Trump’s own campaign embraced and amplified the narrative about his working-class appeal, essentially claiming credit for working-class voting among Republicans even though much of it predated the 2016 election.
We will leave these hypotheses to future research, however. To assert them now would be to commit the same basic error that journalists did when they wrote that working-class white people make up the bulk of Trump’s fan base, namely, presenting untested intuitions as though they were facts.
Supplemental Materials
Appendix 1. Additional Analyses
Appendix 2. What about the Education Gap in 2016?
Appendix 3. Weighting to Account for Overrepresentation of the White Working Class in Surveys
To view supplementary material for this article, please visit http://dx.doi.org/10.1017/S1537592720001267.