Nomenclature
- A
-
area
- ACE
-
adaptive cycle engine
- BPNN
-
back-propagation neural network
- BPR
-
total bypass ratio
- dA
-
area variation
- dVG
-
angle variation
- dPSI
-
variation of stage loading distribution
- dVIGV1
-
inlet guide vane angle variation for front fan
- dVIGV2
-
inlet guide vane angle variation for rear fan
- ER
-
expansion ratio
- F
-
thrust
- FFan
-
front fan
- HLN
-
number of hidden layers
- HLNN
-
number of hidden layer neurons
- HPC
-
high-pressure compressor
- HPT
-
high-pressure turbine
- IGV
-
inlet guide vane
- LHS
-
Latin hypercube sampling
- LPT
-
low-pressure turbine
- MAE
-
mean absolute error
- N
-
physical speed
- N c
-
corrected speed
- NSGA
-
non-dominated sorting genetic algorithm
- OP
-
operating point
- P
-
power
- Pb
-
back pressure
- PR
-
pressure ratio
- R 2
-
coefficient of determination
- RFan
-
rear fan
- RVABI
-
rear variable area bypass injector
- SFC
-
specific fuel consumption
- SM
-
stall margin
- SPR1
-
first bypass split ratio
- SPR2
-
second bypass split ratio
- SZ
-
sample size
- T 3
-
compressor exit temperature
- T 4
-
turbine inlet temperature
- W c
-
corrected mass flow rate
- W f
-
fuel mass flow rate
- X
-
optimisation variable set
- 0D
-
zero-dimensional
- 0D-1D
-
zero-dimensional and one-dimensional coupled
- 1D
-
one-dimensional
- 8
-
position number at core nozzle throat
- 18
-
position number at bypass nozzle throat
Greek symbol
-
 $\alpha$
-
excess air coefficient
-
$\eta$
-
isentropic efficiency


Subscripts
- AB
-
with afterburner operation
- core
-
core engine
- des
-
design point
- H
-
high-pressure
- ins
-
installed performance
- low
-
lower limit
- L
-
low-pressure
- offdes
-
off-design point
- sub
-
subsonic cruise condition
- t
-
total
- TO
-
take-off condition
- up
-
upper limit
- woAB
-
without afterburner operation
1.0 Introduction
Flying higher, faster, farther and smarter has always been the vision of the aviation industry, resulting in the increasingly stringent requirements for aviation propulsion systems. The traditional aero-engine design is always about compromise. Over recent decades, stringent environmental regulations and escalating operational demands have set aggressive targets. For instance, the NASA N + 3 programme envisions a reduction in fuel consumption by 70% compared to a baseline 2005 aircraft, alongside significant noise and emissions cuts [Reference Ashcraft, Padron and Pascioni1]. Simultaneously, future combat aircraft require engines that deliver substantially higher specific thrust for the supersonic cruise and manoeuvrability. These dual, often conflicting, objectives – dramatically lower fuel burn and significantly higher thrust – push conventional engine architectures to their thermodynamic and geometric limits.
In contrast to conventional turbofan engines with limited variable geometry, the adaptive cycle engine (ACE) introduces revolutionary flexibility. Its core innovation lies in the ability to continuously modulate the bypass ratio across a wide range and employ multiple variable geometry components (e.g. adaptive fan, variable area bypass injector, variable geometry turbines). During subsonic cruise, the ACE can operate in a high-bypass-ratio mode to prioritise fuel efficiency. Conversely, for the subsonic cruise or combat manoeuvres, it can switch to a low-bypass-ratio mode to maximise the thrust. This adaptive capability allows it to optimally cover a vastly expanded flight envelope, effectively bridging the performance gap between high-efficiency turbofans and high-thrust turbojets that conventional engines cannot reconcile. These characteristics make the ACE attractive for next-generation aircraft power plants in supersonic commercial and military fields [Reference Ruffles2–Reference Zenkner, Carvalho, Brakmann and Goinis5]. The XA100 ACE developed by GE Aerospace can achieve a 25% improvement in fuel efficiency while also increasing the thrust by 10 to 20% compared with the existing engines.
However, since the ACE is a multiple design point engine, more control variables, more complex variable geometry characteristics and component matching characteristics pose challenges to exploiting the ACE performance potential in a wide and complicated design space.
In recent years, many researchers have conducted systematic research on multi-objective performance optimisation of ACE, focusing primarily on the application and improvement of various optimisation algorithms. Rallabhandi et al. [Reference Rallabhandi and Mavris6] established an integrated airframe and propulsion system model, and performed multidisciplinary and comprehensive optimisation for supersonic aircraft design with the multi-objective genetic algorithm. Simmons [Reference Simmons7] adopted the genetic algorithm to optimise the three-stream ACE design under three flight missions. The results show that the ACE can save 31∼34% and 12∼17% in fuel consumption compared to the state-of-the-art engine in 2000 and the advanced engine at the time, respectively. Zhou et al. [Reference Zhou, Wang, Zhang and Cao8] and Zhang et al. [Reference Zhang, Wang and Ye9] carried out the multi-objective optimisation for the double-bypass ACE and three-bypass ACE with the improved differential evolution algorithm and the particle swarm algorithm, respectively. In addition, to further enhance computational efficiency and handle complex design spaces, some studies have also focused on the surrogate-based optimisation approaches. Zhang et al. [Reference Zhang, Wang and Shi10] and Ye et al. [Reference Ye, Wang and Zhang11] generated lots of performance samples from the 0D ACE model and constructed the surrogate models and then performed the surrogate-based single-point and multi-point optimisations.
According to the literature review, most of the existing studies on ACE optimisation have adopted the traditional 0D ACE performance simulation method, which is the most widely used method with the advantages of simple model architecture and high computational efficiency [Reference Kurzke and Halliwell12]. In the 0D method, the variable geometry characteristics of the turbomachinery components are generally simulated by scaling the multi-angle generic characteristic maps [Reference Zheng, Chen and Tang13] or using the variable geometry empirical relations [Reference Grönstedt14]. However, the accuracy of these approaches is inherently limited by the lack of embedded physical mechanisms to regulate the flow in response to the changes in geometry. Consequently, they may fail to accurately capture the performance of the variable components like the variable geometry turbines, where flow turning and loss change significantly. Comparative studies indicate that such simplified methods can introduce non-negligible prediction deviations in key performance parameters. The efficiency deviations of variable geometry components between the 0D method and the physics-based method reach 5.0% in the off-design conditions [Reference Zou, Zheng, Liu, Lai and Wang15]. These inaccuracies in component performance directly propagate to system-level predictions, potentially leading to overestimation or underestimation of ACE performance benefits during optimisation, which further affects the design schemes in the conceptual and preliminary design stage.
Based on the deficiencies of the existing research, in this paper, an efficient and automatic zero-dimensional and one-dimensional coupled (0D-1D) ACE performance simulation method is proposed and then applied to the multi-objective optimisation towards the enhancement of the thrust under take-off condition and the fuel efficiency under subsonic cruise condition.
In the following sections, the methodology, parametric study and multi-objective optimisation are described in detail. The three-stream ACE is selected for study. Since the operation characteristics of the high-pressure compressor (HPC) and high-pressure turbine (HPT) in this type of ACE are similar to those of the conventional engine, the components on the low-pressure spool are primarily investigated in this study. For the two crucial components to achieve the variable cycle function, the adaptive fan and the low-pressure turbine (LPT), the physics-based 1D mean-line method is adopted for predicting the component characteristics with variable geometry. The 0D-1D coupled ACE model is established by coupling the 1D mean-line models with the 0D ACE model. The parametric studies are conducted to clarify the ACE operating principle, the influence of different parameters, and the optimisation direction. The back-propagation neural network (BPNN) based multi-objective optimisation is performed based on the proposed 0D-1D model and the traditional 0D model, respectively. The Pareto-optimal performance, design parameters and control laws from the 0D-1D model and the 0D model are compared and analysed.
2.0 Methodology
2.1 0D ACE performance simulation method
This paper focuses on the three-stream ACE, as shown in Fig. 1. The adaptive fan, HPC, combustor, HPT, LPT, rear variable area bypass injector (RVABI), afterburner, core nozzle and bypass nozzle are the major components. The adaptive fan consists of two parts, the front fan (FFan) and the rear fan (RFan). The variable inlet guide vane (IGV) is adopted in the FFan, RFan, HPC and LPT. The RVABI bypass area, the core nozzle throat area and the bypass nozzle throat area are adjustable.
Three-stream ACE configuration diagram.

The 0D thermodynamic model of the ACE is constructed using the Toolbox for the Modelling and Analysis of Thermodynamic Systems (T-MATS), an open-source Simulink-based toolbox developed by NASA Glenn Research Center [Reference Chapman, Lavelle, May, Litt and Guo16]. The reliability and validity of the 0D modelling and simulation methodologies on the multi-stream and mixed-flow engines were demonstrated in the previous works [Reference Zou, Zheng, Liu, Lai and Wang15, Reference Wei, Zou, Song, Wang, Li and Zheng17]. In this study, T-MATS serves as the foundational framework for building the engine system configuration and implementing the overall thermodynamic cycle calculation. The ACE model is constructed by utilising the T-MATS library of generic, physics-based component blocks (e.g. compressor, turbine, burner, duct, nozzle). Significant custom modifications are necessary to model the unique features of the ACE, particularly for the adaptive fan and variable geometry turbine. Therefore, while T-MATS provides a robust and flexible platform, the final model is a highly customised implementation tailored for the ACE analysis.
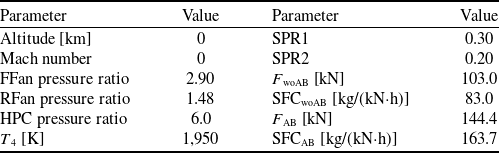
The design point parameters of the ACE are shown in Table 1. T
4 denotes the turbine inlet temperature. First bypass split ratio (SPR1) and second bypass split ratio (SPR2) represent the split ratio of the first and the second bypass, respectively. F denotes the thrust. SFC denotes the specific fuel consumption. The subscripts woAB and AB denote the afterburner on and off, respectively. The total excess air coefficient
 $\alpha$
is set to 1.1 when the afterburner is in operation.
ACE design point parameters

Table 1 Long description
A table with two columns labeled Parameter and Value, and six rows each. Row 1: Altitude, 0 kilometers; Mach number, 0. Row 2: FFan pressure ratio, 2.90; RFan pressure ratio, 1.48. Row 3: HPC pressure ratio, 6.0; T 4, 1,950 Kelvin. Row 4: SPR1, 0.30; SPR2, 0.20. Row 5: F woAB, 103.0 kilonewtons; SFCwoAB, 83.0 kilograms per kilonewton-hour. Row 6: F AB, 144.4 kilonewtons; SFCAB, 163.7 kilograms per kilonewton-hour.
The operating point of each component and the engine performance are calculated by the Newton–Raphson iterative method. The low-pressure shaft physical speed N L is chosen as the engine’s main control variable.
To represent the variable geometry turbomachinery characteristics, multi-angle characteristic maps are adopted for the FFan, RFan, HPT and LPT. These maps are derived from the simulation data of variable geometry turbomachinery in the NASA Technical Reports [Reference Converse18–Reference Converse20], which are widely used in the ACE 0D simulation. The empirical relations to predict the maps with a changed IGV angle are used for the HPC [Reference Grönstedt14]. The constant-area mixer model [Reference Mattingly, Heiser and Pratt21] is used for the RVABI. Its variable geometry is realised by adjusting the bypass area while maintaining a constant total area for the core and bypass. The installation effect simulation is also incorporated with the 0D ACE model, which mainly considers the external flow losses of the inlet and nozzle [Reference Simmons7, Reference Plencner and Snyder22, Reference Kowalski23].
2.2 1D turbomachinery mean-line simulation method
As an efficient and physics-based method, the 1D performance simulation method is very suitable for the rapid design, analysis and optimisation of the turbomachinery, and also suitable for coupling with the engine performance simulation, to quickly analyse the effects of the design parameters, variable geometry, inter-stage bleeding and blade cooling on the component and engine performance under the whole engine environment.
The 1D method adopted in this paper is the mean-line method, which has been experimentally validated in Refs [Reference Zou, Zheng, Liu, Lai and Wang15, Reference Song, Wang, Fan, Zheng and Feng24, Reference Wang, Song, Zou, Yang, Wen, Zhou, Feng and Zheng25] and demonstrated good predictive accuracy over a wide range of operating conditions. The 1D mean-line method is based on the assumptions of steady state, inviscid and adiabatic conditions, and does not consider the changes of aerodynamic parameters along the circumferential and radial directions. Instead, it characterises the blade row by the aerodynamic parameters along the mean streamline. The empirical models of the incidence angle, the deviation angle and the flow losses, derived from a large amount of cascade tests and high-fidelity simulations, are employed to account for the actual flow effects on the turbomachinery performance.
The 1D methods for the adaptive fan and LPT both consist of two parts: the inverse design module (design point mode) and the direct analysis module (off-design point mode). By combining the inverse design module with the direct analysis module, the mean-line geometry, meridional flow path geometry, as well as the characteristic maps at different speeds can be predicted reasonably and rapidly, as shown in Fig. 2.
Calculation flowchart of the 1D mean-line method.

Figure 2 Long description
The flowchart illustrates the calculation process of the 1D mean-line method. It is divided into two main modules: the Inverse design module and the Direct analysis module. The process starts with inputting inlet boundary conditions and design specifications. In the Inverse design module, 1D design parameters are set, and empirical models for the angle, loss, etc., are selected. The 1D inverse design code is then run, outputting aerodynamic and geometric parameters. A decision point checks if the performance meets requirements. If not, parameters are updated and the process returns to setting 1D design parameters. If yes, the process moves to the Direct analysis module. In the Direct analysis module, inlet boundary conditions, inverse design output, N subscript L, and variable geometry are inputted. 1D analysis parameters are set, and empirical models for the angle, loss, etc., are selected. The 1D direct analysis code is run, outputting characteristic maps. Another decision point checks if the performance meets requirements. If not, parameters are updated and transferred back to the Inverse design module. If yes, the process ends.
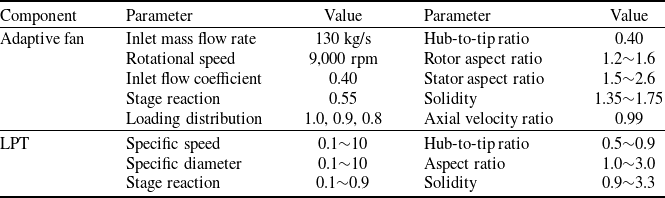
Table 2 presents the main design parameters of the adaptive fan and the LPT in the 1D simulation. The adaptive fan adopts a two-stage FFan and a single-stage RFan. A single-stage design is selected for the LPT. The selection of the adaptive fan parameters refers to the design parameters of the NASA highly loaded fan [Reference Messenger and Keenan26] and GE high-speed variable-geometry fan used in the variable cycle engine [Reference Sullivan and Parker19]. Besides, since an optimisation process is adopted in the 1D LPT inverse design, the ranges of optimisation variables and constraints are given in Table 2. The selection of the LPT parameters is based on the typical parameters used in the preliminary design and optimisation of axial-flow turbines, as described in Ref. [Reference Agromayor and Nord27].
2.3 0D–1D coupled ACE performance simulation method
To achieve the integration of the 0D engine model and the 1D component models, the iterative coupled approach was adopted. The iterative coupled approach progressively corrects the scaling factors of component characteristic maps in the 0D engine model based on discrepancies between the 0D engine model and 1D component models. This process iterates until the convergence criteria are satisfied, yielding consistent performance parameters for both components and the engine.
In this section, a 0D-1D iterative coupled simulation method is proposed by coupling the 1D mean-line models of the adaptive fan and the LPT with the 0D ACE model. The data is transferred bi-directionally between the 1D models and the 0D model through an iterative process. When the iteration is completed, all parameters at the engine level and the component level converge.
Design parameters of adaptive fan and LPT in 1D simulation

Table 2 Long description
A table comparing design parameters of adaptive fan and LPT in 1D simulation. The table has two main components: Adaptive fan and LPT, each with multiple parameters and their respective values. The Adaptive fan section includes parameters such as Inlet mass flow rate, Rotational speed, Inlet flow coefficient, Stage reaction, Loading distribution, Hub-to-tip ratio, Rotor aspect ratio, Stator aspect ratio, and Solidity. The LPT section includes parameters such as Specific speed, Specific diameter, Stage reaction, Hub-to-tip ratio, Aspect ratio, and Solidity. Each parameter has a corresponding value or range of values. For example, the Inlet mass flow rate for the Adaptive fan is 130 kilograms per second, and the Rotational speed is 9000 revolutions per minute. The LPT parameters are given in ranges, such as Specific speed from 0.1 to 10, and Specific diameter from 0.1 to 10.
0D-1D coupled ACE simulation schematic diagram.

Figure 3 shows the schematic diagram of the 0D-1D coupled simulation, which mainly includes the following steps:
-
(i) Run the 0D ACE model to obtain the 0D component performance, engine performance and the boundary conditions of the adaptive fan and LPT.
For the adaptive fan, the boundary conditions include the inlet total pressure P tin, and total temperature T tin, N L, IGV angle variation dVIGV1 (for FFan) and dVIGV2 (for RFan) and SPR2. During the coupled simulation, the pressure ratio (PR) from the 0D simulation is equal to that from the 1D simulation, to uniquely determine the adaptive fan operating point in the 1D simulation.
For the LPT, the boundary conditions include P tin, T tin, N L, stator angle variation dVG, fuel-air ratio (FAR) and cooling parameters. The expansion ratio (ER) from the 0D simulation is equal to that from the 1D simulation, to uniquely determine the LPT operating point in the 1D simulation.
-
(ii) Run the 1D models of the adaptive fan and LPT to obtain the 1D component performance.
-
(iii) Generate the residuals (Res) of the corrected mass flow rate (Wc) and the isentropic efficiency (η), based on the differences between the 0D and 1D component performance, as shown in Equation (1).
(1)where the subscripts 0D and 1D denote the parameters calculated by the 0D model and 1D models, respectively. p denotes W c or
\begin{align} {\mathop{\rm Re}\nolimits} {{\rm{s}}_p} = {{\left| {{p_{{\rm{1D}}}} - {p_{{\rm{0D}}}}} \right|}/{{p_{{\rm{0D}}}}}}\end{align}
$\eta$
.
-
(iv) Update the scaling factors f for the generic characteristic maps of the FFan, RFan and LPT in the 0D model, which can be calculated by Equation (2).
(2)where i-1 and i represent the previous and the current iteration steps, respectively.
\begin{align} {f_{p,i}} = \left[ {\left( {{{{p_{{\rm{1D}}}}} \over {{p_{{\rm{0D}}}}}} - 1} \right) \cdot \delta + 1} \right] \cdot {f_{p,i - 1}}\end{align}
$\delta$
indicates the relaxing factor. The relaxing factor governs the rate of change from the old value to the newly calculated one. A value closer to 1 implies faster updates and potentially quicker convergence, but may risk instability or oscillation. A smaller value (closer to 0) promotes stability by dampening changes but slows down convergence.
-
(v) Repeat the abovementioned steps until the convergence criterion is met.
-
(vi) Output the component performance and engine performance.


The residuals of different performance parameters govern the convergence of the 0D-1D coupled iteration. When the convergence residual changed from 1 × 10⁻³ to 1 × 10⁻⁴, the maximum performance variation was less than 0.03%. Therefore, a convergence residual of 1 × 10⁻³ was selected to balance the simulation accuracy with the computational cost. The relaxing factor for updating the component performance parameters between iterations is set to 0.8. This value was selected based on a sensitivity analysis conducted during the preliminary model development stage, where values ranging from 0.4 to 1.0 were tested. A factor of 0.8 was found to provide the best compromise between stability (avoiding oscillation) and convergence speed. Besides, through sufficient computational practices, it was found that the iteration number would not exceed 10. To allow for some margin, the maximum number of iterations was set to 20. These settings have been validated by confirming that the final converged solution is independent of the initial guesses within a practical range.
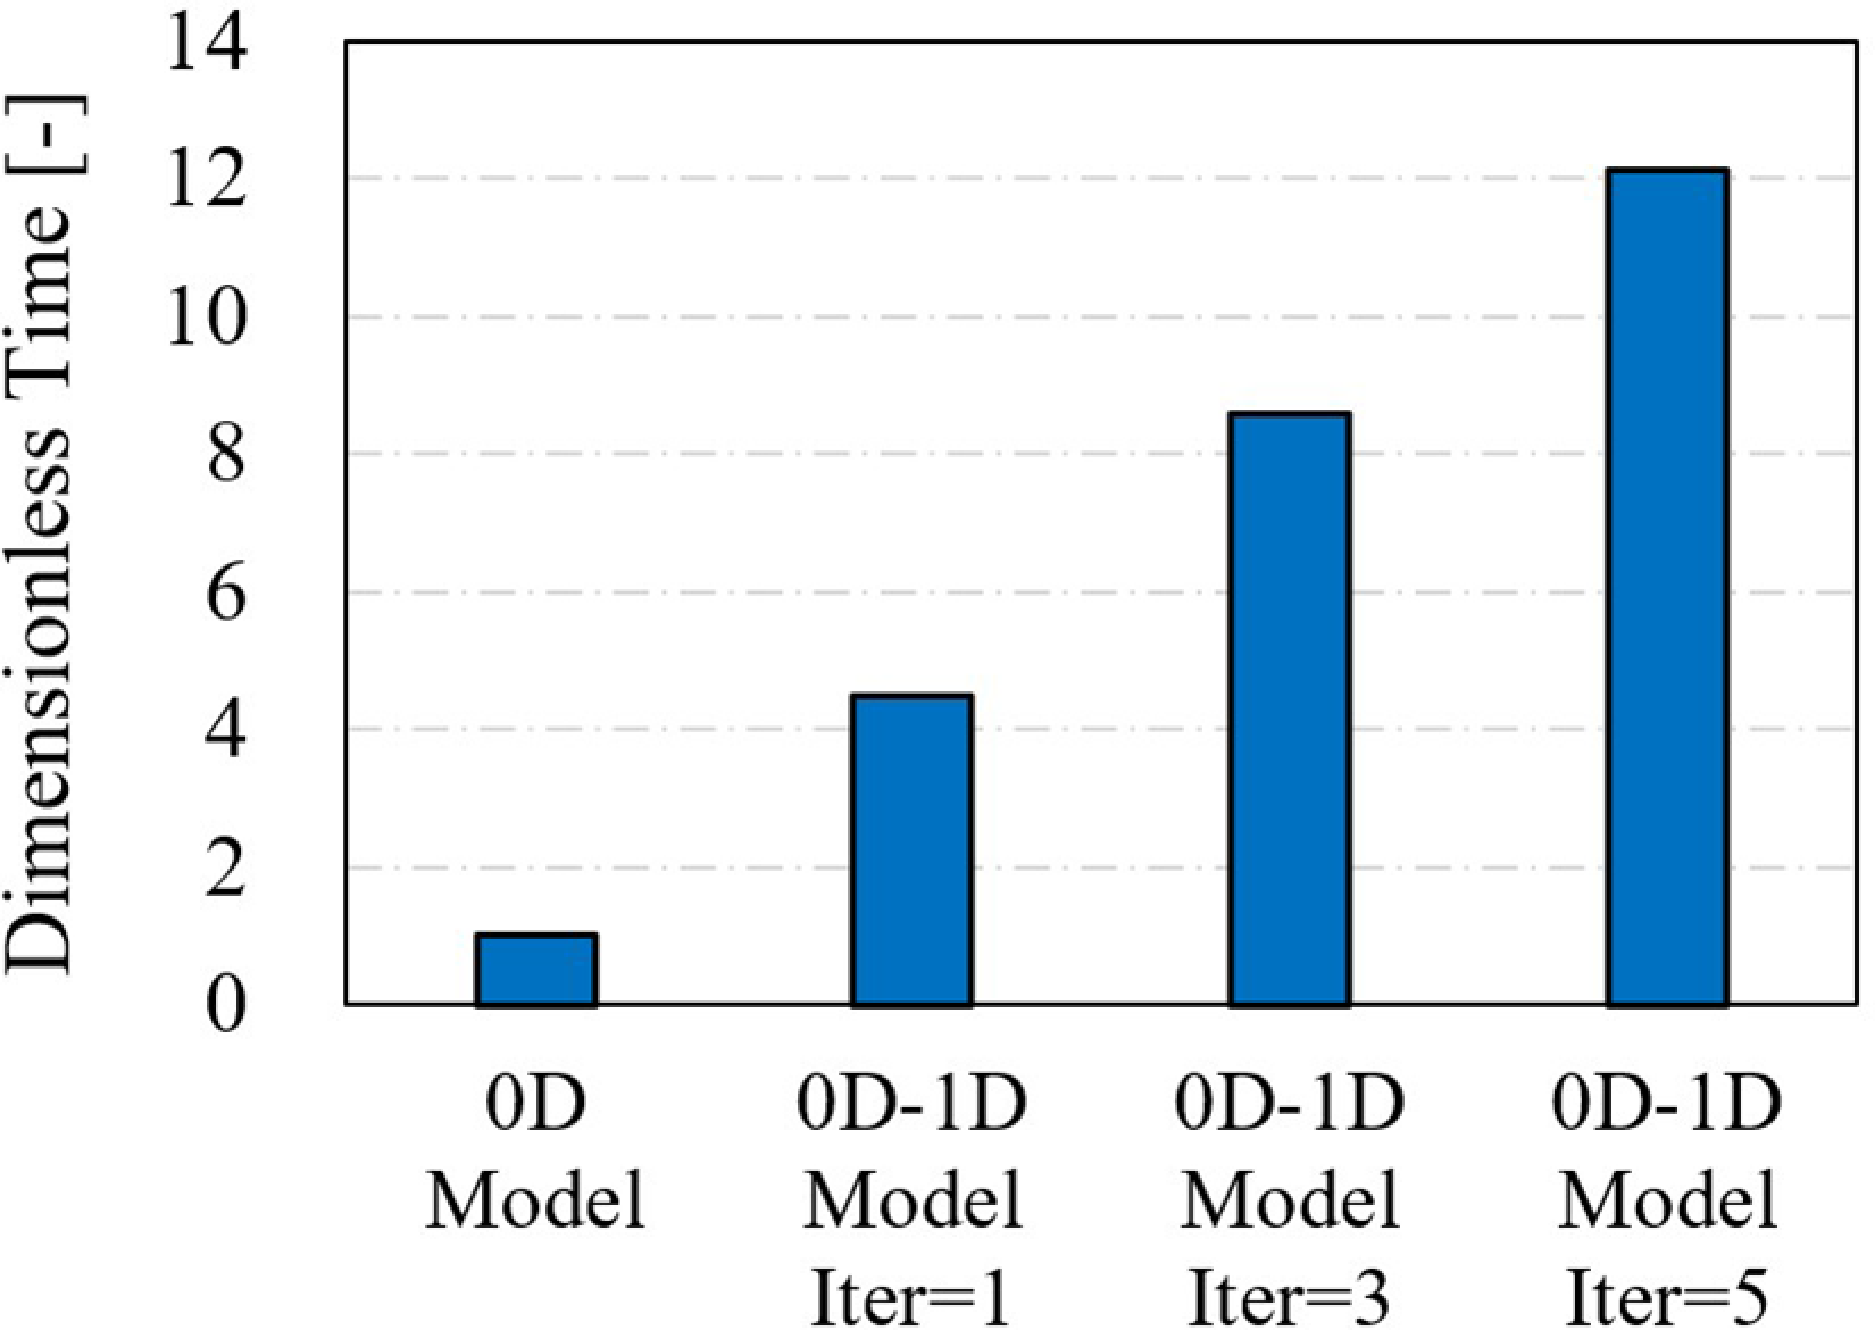
The comparison of computing time between the 0D-1D model and the 0D model is shown in Fig. 4. Iter indicates the iteration number in the 0D-1D coupled simulation. Compared with the 0D model, the 0D-1D model takes more computing time due to the run of the 1D model and the iterative process. Considering that the maximum number of iterations for a single point with the 0D-1D model does not exceed 10 in practice, the corresponding computing time is less than 1.5 min, which is acceptable during the conceptual design and preliminary design stages.
Comparison of computing time between 0D-1D model and 0D model.

2.4 Optimisation method
Although ACE alleviates the performance compromise under different operating conditions by the operating mode adjustment, it is inevitable to adopt the optimisation methods to explore the ACE performance potential due to its more complex engine configuration, design space and control variables.
The ACE performance under different operating conditions is not only affected by the variable geometry parameters but also closely related to the design parameters. Therefore, the design parameters, the variable geometry parameters and the N L are all selected as optimisation variables.
For the 0D model optimisation, the optimisation variables at design point include T 4, SPR1, SPR2, the FFan pressure ratio PRFFan, the RFan pressure ratio PRRFan and the HPC pressure ratio PRHPC. For the 0D-1D model optimisation, the optimisation variables at design point include T 4, SPR1, SPR2, the adaptive fan pressure ratio PRFan, the stage load variation dPSI1 and dPSI2 and PRHPC. dPSI1 and dPSI2 denote the stage load variation of the FFan second stage and the RFan relative to the previous stage, respectively. Different dPSI1 and dPSI2 indicate different distributions of pressure ratio between the FFan and RFan.
In both the 0D model and 0D-1D model optimisation, the variable geometry optimisation variables include the inlet guide vane angle (dVG) of the FFan, RFan, HPC and LPT, the RVABI bypass area variation dA VABI, the variation of the core nozzle throat area dA8 and the variation of the bypass nozzle throat area dA18. The above parameters, together with N L, are the optimisation variables at off-design point.
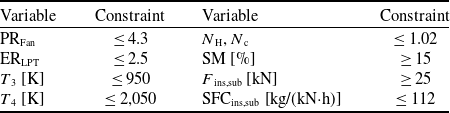
The optimisation constraints that consider the engine design requirements and engineering feasibility are shown in Table 3. At design point, the PRFan and the LPT expansion ratio ERLPT do not exceed 4.3 and 2.5, respectively, to satisfy the performance requirements of the three-stage design and the single-stage design. Within the engine operating envelope, overtemperature, overspeed and surge must be avoided. T 3 denotes the HPC outlet total temperature. N H denotes the high-pressure shaft physical speed. N c denotes the relative corrected speed. SM denotes the stall margin. The subscripts sub and ins denote the subsonic cruise condition and the installed performance, respectively.
Optimisation constraint

Table 3 Long description
The table has six rows and four columns. The columns are labeled Variable, Constraint, Variable, and Constraint. The rows list the following data: Row 1: PRFan, 4.3, N H, N c, 1.02. Row 2: ERLPT, 2.5, SM [%], 15. Row 3: T 3 [K], 950, F ins,sub [kN], 25. Row 4: T 4 [K], 2,050, SFCins,sub [kg/(kNh)], 112.
At take-off condition, the engine is required to provide the maximum thrust to take off as soon as possible, so maximising the thrust is set as the optimisation objective. At the cruise condition, the engine is required to reduce the SFC as much as possible to improve the fuel efficiency while achieving the minimum thrust, so minimising the installed SFC is taken as the optimisation objective.
NSGA-II uses the fast non-dominated sorting algorithm, elitist strategy and crowding distance parameter, which is a widely used multi-objective optimisation algorithm today. Based on the multi-objective optimisation platform PlatEMO [Reference Tian, Cheng, Zhang and Jin28], the NSGA-II algorithm [Reference Deb, Pratap, Agarwal and Meyarivan29] is adopted for the ACE performance optimisation to obtain the Pareto-optimal solutions. In this paper, the population size is set to 150. The maximum number of generations is set to 100. The crossover probability and mutation probability are set to 0.9 and 1/n, respectively (where n is the number of optimisation variables).
Surrogate modelling has attracted increased attention from researchers in various fields of engineering, which statistically relates input data to output data in complicated and computationally expensive system simulations. The common surrogate models involve the Kriging model, response surface model and neural network model. The main idea of the surrogate-based optimisation (SBO) is to obtain the samples based on the original physical model or high-fidelity model at first, and then build a surrogate model with high accuracy to replace the original model to carry out the optimisation [Reference Sun and Wang30, Reference Tao, Wang, Ye, Wang, Luo and Cui31]. SBO can avoid repeated calls to the physical model or high-fidelity model during the optimisation. Besides, the changes in the optimisation variables, constraints, objectives and algorithms can be flexibly considered without a large increase in computing cost and time, which significantly improves the optimisation efficiency. Considering the multiple input variables and strong nonlinear characteristics of the ACE optimisation, a BPNN-based optimisation strategy is proposed for the ACE optimisation. Figure 5 shows the BPNN-based optimisation flowchart.
BPNN-based optimisation flowchart.

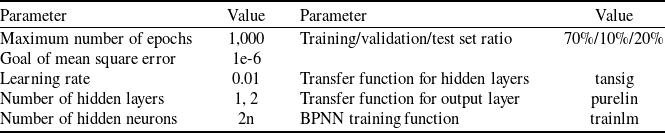
The ACE performance samples are obtained by the Latin hypercube sampling (LHS). The BPNN models are established based on the Neural Network Toolbox in MATLAB. The BPNN model accuracy is judged by the coefficient of determination R 2. The BPNN model setting is shown in Table 4.
3.0 Parametric study at different operating conditions
3.1 Parametric study at design point
At the take-off condition (design point), the effects of the design parameters on the ACE performance with and without afterburner operation are presented in Figs. 6 and 7, respectively. In Fig. 6, PRt denotes the total pressure ratio. The arrow direction indicates the direction of parameter increase. In Fig. 7, the variations of the design parameters are as follows: T 4 from 1950 K to 1750 K, SPR1 from 0.3 to 0.2, SPR2 from 0.2 to 0.3, PRFFan from 2.9 to 3.2, PRRFan from 1.5 to 1.7 and PRHPC from 6.0 to 7.0.
BPNN model setting

Table 4 Long description
A table with two columns and eight rows, listing parameters and their values for a BPNN model. The first column lists the parameters: Maximum number of epochs, Goal of mean square error, Learning rate, Number of hidden layers, Number of hidden neurons, Training/validation/test set ratio, Transfer function for hidden layers, Transfer function for output layer, and BPNN training function. The second column lists the corresponding values: 1,000, 1e-6, 0.01, 1, 2, 70 percent/10 percent/20 percent, tansig, purelin, and trailm.
Effects of design parameters on performance without afterburner operation (a) effects of PRt and T4 (b) effects of SPR1 and SPR2 (c) effects of PRFFan and PRRFan.

Effects of design parameters on performance with afterburner operation (a) FAB variation (b) SFCAB variation (c) η variation.

When T
4 decreases, F
woAB, F
AB and SFCwoAB decrease. However, with the afterburner operation, the temperature rises, and the fuel consumption in the afterburner increases, due to the constant
 $\alpha$
. The energy conversion rate in the afterburner is lower than that of the core combustor, increasing the SFCAB.
When SPR1 decreases, more flow enters the core, leading to an increase in F
woAB and F
AB. Because the total bypass ratio BPRt decreases, SFCwoAB increases. However, with the afterburner operation, SFCAB decreases due to the constant αt and increased F
AB. When SPR2 increases, BPRt increases, F
woAB, F
AB and SFCwoAB decrease. Because the total mass flow into the afterburner decreases, the total fuel flow decreases for the constant
 $\alpha$
, resulting in the decrease of SFCAB.
When PRFFan and PRRFan increase, the PRt increases, resulting in the decrease of SFCwoAB and SFCAB and the increase of F AB, but F woAB changes a little. Increasing PRHPC has a similar effect.
At design point, the main distinction between the 0D model and the 0D-1D model lies in whether the component efficiency changes with the pressure ratio or expansion ratio. Using the design parameters shown in Table 1, when the efficiency of FFan, RFan and LPT increases by 1.0%, F woAB increases by 0.33, 0.12 and 0.22%, respectively, while SFCwoAB decreases by 0.15, 0.05 and 0.22%, respectively. As shown in Fig. 7, although the 0D model adopts the constant component efficiency while the 0D-1D model accounts for efficiency variations, the effect laws and magnitude of the design parameters from the two models are basically the same.
3.2 Parametric study at off-design point
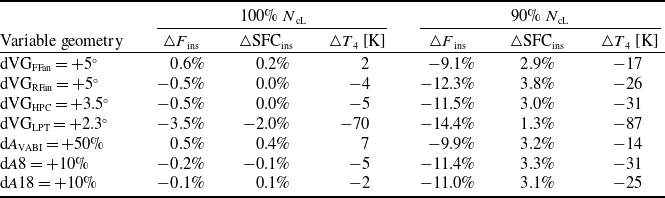
At the subsonic cruise condition, the effects of the variable parameters when the low-pressure corrected speed N cL = 100% and N cL = 90% are presented in Figs. 8 and 9, respectively. The effects of the variable geometry parameters on the component maps and operating points (OP) are shown in Fig. 10. The installed performance deviations after geometry variation are shown in Table 5. The positive dVG indicates the closing of the guide vane. Two models adopt the same empirical relation for the HPC variable geometry.
Effects of variable geometry parameters on performance at 100% NcL (a) FwoAB variation (b) SFCwoAB variation (c) T4 variation.

Effects of variable geometry parameters on performance at 90% NcL (a) FwoAB variation (b) SFCwoAB variation (c) T4 variation.

Effects of variable geometry parameters on component maps and performance (a) effects of dVGFFan (b) effects of dVGRFan (c) effects of dVGLPT.

The effects of the dVGFFan, dVGRFan and dVGLPT are highlighted below.
Turning down the FFan guide vane, the FFan mass flow rate and pressure ratio decrease, while the power consumption decreases, resulting in an increasing trend in N L. To keep N L constant, T 4 decreases, and N H also decreases. As a result, the core flow capacity decreases, and BPRt increases. Finally, both F and SFC decrease. As the FFan guide vane closes, the pressure ratio characteristic shifts to the lower left, and the efficiency characteristic shifts to the left for both the 0D FFan map and the 1D FFan map. However, when N L is reduced from 100 to 90%, the mass flow rate and pressure ratio in the 1D FFan map decrease more than those of the 0D map. Besides, the maximum efficiency of the 1D map tends to decrease, while the maximum efficiency of the 0D map tends to increase. This results in a significant increase in the performance deviation at N cL = 90%, as shown in Table 5.
Turning down the RFan guide vane, the power consumption of RFan decreases. To keep N L constant, T 4 and N H decrease. Due to the decreased flow capacity of the RFan and the core, BPRt increases, and F and SFC decrease. Turning down the RFan guide vane has basically the same effect on the 0D RFan map and 1D RFan map. However, the RFan efficiency of the 0D model is about 2% higher than the 0D-1D model at N cL = 90%.
Turning down the LPT guide vane, the HPT expansion ratio PRHPT and the output work P HPT decrease, and N H decreases, decreasing the core flow capacity W core, then increasing the BPRt. It also has multiple and contradictory effects on the T 4.
Performance deviations between 0D model and 0D-1D model after geometry variation

Table 5 Long description
A table with seven rows and six columns comparing performance deviations between 0D model and 0D-1D model after geometry variation. The columns are labeled as Variable geometry, ΔF_ins, ΔSFC_ins, ΔT4 [K] for 100% N_cL and 90% N_cL. The rows are labeled as dVG_FFan = +5°, dVG_RFan = +5°, dVG_HPC = +3.5°, dVG_LPT = +2.3°, dA_VAB1 = +50%, dA8 = +10%, dA18 = +10%. The values in the table are as follows: Row 1: dVG_FFan = +5°, 0.6 percent, 0.2 percent, 2 K, -9.1 percent, 2.9 percent, -17 K. Row 2: dVG_RFan = +5°, -0.5 percent, 0.0 percent, -4 K, -12.3 percent, 3.8 percent, -26 K. Row 3: dVG_HPC = +3.5°, -0.5 percent, 0.0 percent, -5 K, -11.5 percent, 3.0 percent, -31 K. Row 4: dVG_LPT = +2.3°, -3.5 percent, -2.0 percent, -70 K, -14.4 percent, 1.3 percent, -87 K. Row 5: dA_VAB1 = +50%, 0.5 percent, 0.4 percent, 7 K, -9.9 percent, 3.2 percent, -14 K. Row 6: dA8 = +10%, -0.2 percent, -0.1 percent, -5 K, -11.4 percent, 3.3 percent, -31 K. Row 7: dA18 = +10%, -0.1 percent, 0.1 percent, -2 K, -11.0 percent, 3.1 percent, -25 K.
The LPT expansion ratio PRLPT increases, resulting in an increasing trend of N L. To keep N L constant, the fuel mass flow rate W f should be reduced, resulting in a decreasing trend of T 4.
The core flow capacity W core decreases, resulting in a decreasing trend of the LPT output work P LPT and N L. To keep N L constant, the fuel mass flow rate W f should be increased, resulting in an increasing trend of T 4.
Because W core decreases, the back pressure of the FFan and RFan (Pb FFan and Pb RFan) increases, and the pressure ratio (PRFFan and PRRFan) and power consumption (P FFan and P RFan) increase, resulting in a decreasing trend of N L. To keep N L constant, T 4 increases.
Besides, turning down the LPT guide vane will also affect the component efficiency. The increase (or decrease) in the component efficiency will result in an increasing (or decreasing) trend of N L and a decreasing (or increasing) trend of T 4.
Under the comprehensive influence of the above factors, T 4 increases to keep N L constant. The variations of F and SFC mainly depend on the combined effects of BPRt and T 4.
To further analyse the effects of LPT variable geometry, the effects of the LPT efficiency variation △
 $\eta$
LPT and the mass flow variation △W
cLPT on the ACE performance variation are shown in Fig. 12, which presents the possible variations of the LPT characteristic after turning down the LPT guide vane.
Effects of increased dVGLPT on NL and T4.

Effects of increased dVGLPT on performance (a) FwoAB variation (b) SFCwoAB variation (c) T4 variation (d) BPRt variation.

The variations of F and SFC are linear with △
 $\eta$
LPT, but are nonlinear with △W
cLPT. When different LPT variable geometry characteristics are adopted, the variations of F and SFC may be positive or negative, which means F and SFC may increase or decrease. When the △W
cLPT is small, the variation trends of F and SFC mainly depend on the △
 $\eta$
LPT. If the
 $\eta$
LPT decreases, F and SFC increase due to higher T
4 and lower BPRt, corresponding to the 0D model results in Figs. 8 and 9. If the
 $\eta$
LPT changes slightly or increases, F and SFC decrease, the former corresponding to the 0D-1D model results in Figs. 8 and 9. When the △W
cLPT is large, both F and SFC increase over a large range of △
 $\eta$
LPT.
With the constant N L as the control law, studies in the literature [Reference Lyu, Tang and Chen32–Reference Xu, Tang and Chen34] showed that turning down the LPT guide vane would reduce T 4, F and SFC, while the literature [Reference Zheng, Chen and Tang13, Reference Chen, Zhang and Tang35] drew an opposite conclusion. As shown in Figs. 8 and 9, turning down the LPT guide vane, T 4, F and SFC obtained from the 0D model are increased. However, T 4 from the 0D-1D model increases, but the increasing amplitude is significantly less than that from the 0D model, contributing to the decrease of F and SFC. The main reason is: after turning down the LPT guide vane, the LPT efficiency from the 0D-1D model is significantly higher (3.5∼4.5% higher). Besides, the LPT mass flow rate is also larger, which means the larger HPT expansion ratio (about 4.5% higher), the larger N H and the larger core flow capacity from the 0D-1D model. The above factors result in a lower T 4 compared with the 0D model. Under such circumstances, F and SFC decrease in the 0D-1D model as a result of the lower T 4 and higher BPRt.
In summary, the differences in the component characteristics with variable geometry between the two models make an important impact on the ACE performance, especially when the operating point deviates from the design condition. Particularly, accurate prediction of the mass flow and efficiency characteristics of the variable geometry LPT is critical to the ACE performance prediction. When the variable geometry LPT characteristics deviate significantly from the true values, the performance trends predicted by the 0D model may be opposite to reality.
4.0 Multi-objective optimisation towards take-off and subsonic cruise conditions
4.1 Determination of optimisation variable range
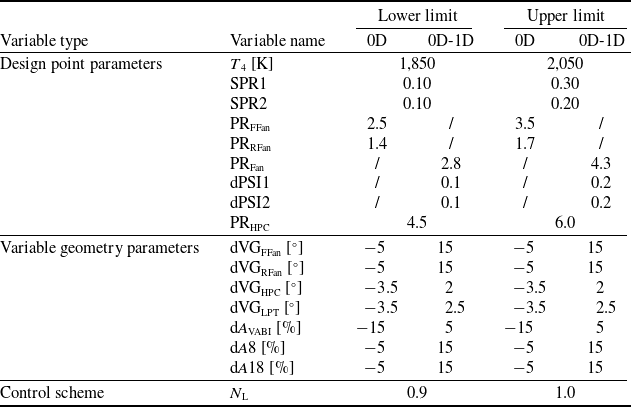
The optimisation variable ranges are shown in Table 6. The design point parameters are specified based on the available literature data and engineering experience. Since the variable geometry parameters work only at the subsonic cruise condition in the optimisation, the adjustment direction of the variable geometry parameters is mainly determined according to the decreasing direction of the SFC. As shown in Fig. 8, the guide vane of FFan and RFan should be turned down (increased dVG), the HPC guide vane should be opened (decreased dVG), the dA VABI should be decreased and dA8 should be increased. The dVGHPC ranges from −3.5° to 2°, which corresponds to the range of the mass flow factor from 115 to 95% [Reference Grönstedt14]. As described in Section 3.2, the effects of variable geometry LPT on engine performance are multifaceted, and its impact on the SFC is not monotonous, which is highly correlated with the mass flow variation of the LPT. Therefore, in this paper, the range of dVGLPT is determined based on the requirements of the mass flow variation. For variable geometry LPT, a typical range of the mass flow variation is from 110 to 90%, corresponding to a dVGLPT range of approximately −3.5° to 2.5° [Reference Converse20].
Optimisation variable ranges

Table 6 Long description
The table has three main sections: Design point parameters, Variable geometry parameters, and Control scheme. Each section lists variable names, lower limits, and upper limits for 0D and 0D-1D. Design point parameters include variables like T4 [K], SPR1, SPR2, PRFFan, PRRFan, PRFan, dPSI1, dPSI2, and PRHPC. Variable geometry parameters include dVGFFan, dVGRFan, dVGHPC, dVGLPT, dAVABI, dA8, and dA18. The Control scheme section lists NL. Each variable has specified lower and upper limits for 0D and 0D-1D. The table provides a detailed comparison of these ranges.
4.2 BPNN prediction model establishment
According to the optimisation variable ranges in Table 6, the LHS is adopted to obtain the ACE performance samples, and then the BPNN model for every engine performance parameter can be established based on the samples. The selection of BPNN hyperparameters, including the sample size (SZ), the number of hidden layers (HLN) and the number of hidden layer neurons (HLNN), is guided by the parametric study.
The effects of the BPNN hyperparameters on the R 2 of the SFCsub in the 0D-1D model are presented in Fig. 13. The model accuracy metrics tend to stabilise when the training set SZ approaches approximately 4,000, indicating that further increasing the samples will not result in a significant improvement in accuracy. Therefore, SZ = 4,000 is selected to ensure the surrogate model accuracy while maintaining a manageable computational cost for data generation. As the HLNN increases, the R 2 on the training set increases when HLN = 1, while it increases first and then decreases when HLN = 2. Besides, the complex network architecture weakens the generalisation ability of the BPNN model. Therefore, with the increase of HLNN, the R 2 on the test set tends to increase first and then decrease. Based on the parametric study results on the BPNN hyperparameters, SZ = 4,000, HLN = 2 and HLNN = 16 are ultimately selected, as they provide an optimal balance between high accuracy (both for training set and test set) and model robustness against overfitting.
Effects of BPNN model hyperparameters on R2 of SFCsub in 0D-1D model (a) HLN = 1 (b) HLN = 2.

With the above setup, the performance comparisons between the 0D-1D model and the BPNN model in the test set are shown in Fig. 14. The R 2 and mean absolute error (MAE) of each performance parameter in the test set are shown in Table 7. The R 2 of F, SFC and T 4 are larger than 0.997, 0.972 and 0.970, respectively, indicating that the established BPNN models have sufficient prediction accuracy for the ACE performance.
Performance comparisons between the 0D-1D model and BPNN model in the test set (a) FTO (b) Wf,TO (c) Fsub (d) Wf,sub.

4.3 Optimisation results and analysis
BPNN-based multi-objective performance optimisation is carried out towards two critical operating conditions, which can be described as follows:
-
1) Optimisation objectives: the take-off thrust F TO is maximised and the subsonic cruise specific fuel consumption SFCsub is minimised, simultaneously.
-
2) Optimisation variables: the design parameters X des and the off-design parameters X offdes are selected (the latter include the variable geometry parameters and control scheme), as detailed in Table 6.
-
3) Optimisation constraints: the optimisation is subject to the engine performance and operational limits specified in Table 3, including the temperature limit, rotational speed limit, surge margin requirement and other key parameters.
The optimisation problem is defined in Equation (3).
 \begin{align} & \left\{\begin{array}{l} \textrm{max}\;F_{\textrm{To}} = f_{\textrm{TO}}(X_{\textrm{des}}) \\\textrm{min}\;\textrm{SFC}_{\textrm{sub}} = f_{\textrm{sub}}(X_{\textrm{des}},X_{\textrm{offdes}}) \end{array} \right. \nonumber \\& s.t. \quad X_{\textrm{des,low}} \leq X_{\textrm{des}} \leq X_{\textrm{des,up}},X_{\textrm{offdes,low}} \leq X_{\textrm{offdes}} \leq X_{\textrm{offdes,up}}\nonumber \\&\qquad \{PR_{\textrm{Fan}},ER_{\textrm{LPT}},T_{3},T_{4},N_{\textrm{H}},N_{\textrm{c,FFan}},N_{\textrm{c,RFan}},N_{\textrm{c,HPC}},SFC_{\textrm{sub}}\} \leq C_{\textrm{up}}\nonumber \\&\qquad \{SM_{\textrm{FFan}},SM_{\textrm{RFan}},SM_{\textrm{HPC}},F_{\textrm{TO}},F_{\textrm{sub}}\}\geq C_{\textrm{low}} \end{align}
where f TO denotes the mapping relation between the optimisation variables at the design point X des and F TO established by the BPNN model. f sub denotes the mapping relation between the X des, the optimisation variables at off-design point X offdes and SFCsub. C denotes the optimisation constraints. The subscripts low and up indicate the lower limit and upper limit, respectively.
R2 and MAE in the test set

Table 7 Long description
A table comparing performance metrics of different models. The table has 2 rows and 10 columns. The columns are labeled as Model Type, F_TO R^2, F_TO MAE, SFC_TO R^2, SFC_TO MAE, F_sub R^2, F_sub MAE, SFC_sub R^2, SFC_sub MAE, and T_4_sub R^2, T_4_sub MAE. The row labels are 0D and 0D-1D. Row 1: 0D, 0.998, 0.207, 0.995, 0.237, 0.997, 0.254, 0.987, 0.419, 0.991, 12.76. Row 2: 0D-1D, 0.999, 0.159, 0.999, 0.185, 0.997, 0.344, 0.972, 0.647, 0.970, 22.33.
Comparison of Pareto front from multi-objective optimisation.

The Pareto fronts obtained by the optimisation are shown in Fig. 15. The optimal solutions of both models exhibit a typical trade-off relationship. On the Pareto front, the greater the sea-level thrust F TO, the higher the subsonic cruise fuel consumption SFCsub. The Pareto front from the 0D-1D model is located at the lower right side of that from the 0D model, which indicates that the engine performance from the 0D-1D model is superior. Moreover, in the region of the smaller F TO and the lower SFCsub, the difference between the Pareto fronts of the two models is even larger.
The comparisons of F sub, SFCsub and T 4,sub during multi-objective optimisation are shown in Fig. 16. The Pareto solutions are also illustrated in the figure. The F sub is overall positively correlated with T 4,sub. The dispersion is mainly due to the differences in the bypass ratio and the component characteristics. The SFCsub and F sub in Pareto solutions also show a generally positive correlation. The performance dispersion of the 0D-1D Pareto solutions is greater than that of the 0D Pareto solutions, mainly because the component characteristics of the 0D-1D model change more significantly than those of the 0D model during the optimisation. The 0D model employs constant component efficiency at design point and multi-angle generic maps to represent the component characteristics. By contrast, the 0D-1D model adopts the physics-based 1D models to predict component characteristics, which enables a more accurate evaluation of the influence of design parameters and variable geometry parameters on the component characteristics. Consequently, at each optimisation point, the 0D-1D model exhibits greater variation in component characteristics compared to the 0D model.
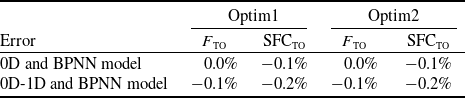
The solutions Optim1 (F TO = 150 kN) and Optim2 (F TO = 159 kN) in Fig. 15 are selected for comparison. The performance errors between the 0D/0D-1D model and the BPNN model in Optim1 and Optim2 are shown in Table 8. The errors of both F TO and SFCsub are within 0.2%, which demonstrates the sufficient accuracy of the BPNN model and the BPNN-based optimisation method.
Comparison of engine performance during multi-objective optimisation (a) scatter plot of Fsub and T4,sub (b) scatter plot of Fsub and SFCsub.

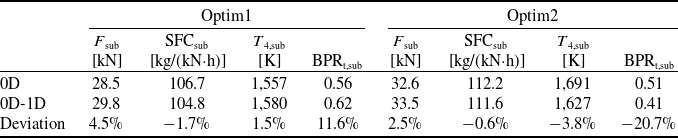
The comparisons of the subsonic performance between the two models under the solution Optim1 and Optim2 are shown in Table 9. The SFCsub from the 0D-1D model is 1.7 and 0.6% lower than that from the 0D model in the solution Optim1 and Optim2, respectively, while the F sub from the 0D-1D model is 4.5 and 2.5% higher, respectively.
The comparisons of the optimisation variables and the component efficiency between the two models are shown in Figs. 17 and 18, respectively.
For Optim1, to achieve lower SFCsub, both models adopt lower T 4, higher SPR1, and higher total pressure ratio at design point, as shown in Fig. 17(a). Meanwhile, to balance the F TO, a lower SPR2 design value is adopted, so that the BPRt design value is not too large. High PRFFan and low PRRFan are adopted, and the design value of the adaptive fan pressure ratio reaches the upper limit of 4.3. Under subsonic cruise condition, both models turn down the RFan guide vane, decrease the dAVABI, and increase the A8, to reduce the T 4 and increase the BPRt, thereby reducing the SFCsub. The inlet guide vane angle of the HPC and the LPT is basically unadjusted in the 0D model, but turned down in the 0D-1D model. The FFan guide vane angle and A18 are adjusted in the opposite direction for both models. The above variable geometry scheme makes the BPRt of the 0D-1D model higher. In addition, under subsonic cruise condition, the efficiency of the RFan, HPT and LPT from the 0D-1D model is higher, but the FFan efficiency is lower than that of the 0D model. The lower SFCsub is achieved by the higher rotational speed, wider range of the variable geometry parameters and higher component efficiency for the 0D-1D model, while it is achieved by the lower rotational speed and the smaller geometry variation for the 0D model. Finally, the 0D-1D model obtains a lower SFCsub than the 0D model, due to a higher T 4,sub (indicating a higher thermal efficiency) and higher BPRt,sub (indicating a higher propulsive efficiency), as shown in Table 9.
Performance errors between 0D or 0D-1D model and BPNN model

Table 8 Long description
A table comparing performance errors between 0D or 0D-1D model and BPNN model. The table has two columns labeled Optim1 and Optim2, each with sub-columns F_TO and SFC_TO. There are two rows labeled 0D and BPNN model, and 0D-1D and BPNN model. Row 1: Optim1 F_TO, 0.0 percent; Optim1 SFC_TO, minus 0.1 percent; Optim2 F_TO, 0.0 percent; Optim2 SFC_TO, minus 0.1 percent. Row 2: Optim1 F_TO, minus 0.1 percent; Optim1 SFC_TO, minus 0.2 percent; Optim2 F_TO, minus 0.1 percent; Optim2 SFC_TO, minus 0.2 percent.
Performance comparisons between 0D model and 0D-1D model under subsonic cruise condition

Table 9 Long description
The table compares performance metrics between 0D and 0D-1D models under subsonic cruise conditions for two optimization solutions, Optim1 and Optim2. It has two main sections, one for each optimization solution, each containing four columns: F_sub in kilonewtons (kN), SFC_sub in kilograms per kilonewton-hour (kg/(kN-h)), T_4sub in kelvins (K), and BPR_sub. Each section also includes a row for deviations. Panel A: For Optim1, the 0D model has F_sub of 28.5 kN, SFC_sub of 106.7 kg/(kN-h), T_4sub of 1,557 K, and BPR_sub of 0.56. The 0D-1D model has F_sub of 29.8 kN, SFC_sub of 104.8 kg/(kN-h), T_4sub of 1,580 K, and BPR_sub of 0.62. The deviations are 4.5 percent for F_sub, -1.7 percent for SFC_sub, 1.5 percent for T_4sub, and 11.6 percent for BPR_sub. Panel B: For Optim2, the 0D model has F_sub of 32.6 kN, SFC_sub of 112.2 kg/(kN-h), T_4sub of 1,691 K, and BPR_sub of 0.51. The 0D-1D model has F_sub of 33.5 kN, SFC_sub of 111.6 kg/(kN-h), T_4sub of 1,627 K, and BPR_sub of 0.41. The deviations are 2.5 percent for F_sub, -0.6 percent for SFC_sub, -3.8 percent for T_4sub, and -20.7 percent for BPR_sub.
Comparison of optimisation variables between 0D model and 0D-1D model (a) Optim1 (b) Optim2.

For Optim2, although the difference in the SFCsub and F TO between the two models is not as large as that of Optim1, the difference in the optimisation variables between the two models is much larger, as shown in Fig. 17(b). In terms of the design parameters, the adaptive fan pressure ratio, HPC pressure ratio and SPR2 are essentially the same for both models. However, the 0D model achieves large F TO through a design combination of high T 4 and high SPR1, while the 0D-1D model adopts a design with lower T 4 and lower SPR1. Moreover, since the design value of the T 4 in the 0D-1D model has not yet reached the limit, the 0D-1D model can realise greater F TO without the limitation of the SFCsub. Under subsonic cruise condition, the analysis results of the variable geometry parameters are similar to Optim1. Due to the RFan guide vane being closed by 15° in the 0D model, the RFan efficiency in the 0D model is much lower than that of the 0D-1D model. Besides, the efficiency of the HPT and LPT from the 0D-1D model is higher, but the FFan efficiency is lower. Finally, the 0D-1D model also obtains a lower SFCsub than the 0D model, as shown in Table 9.
Comparison of component efficiency between 0D model and 0D-1D model under subsonic cruise condition (a) Optim1 (b) Optim2.

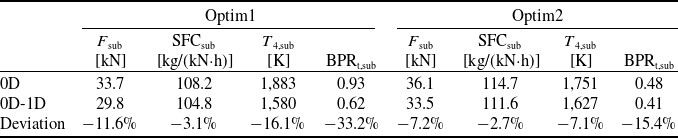
The comparisons of the subsonic performance between the 0D-1D model and the 0D model with the same optimisation variables are shown in Table 10. The 0D model adopts the same optimisation variables as the 0D-1D model in Optim1 or Optim2. The performance deviations between the two models are significantly larger than those in Table 9. By comparing Tables 10 and 9, it can be seen that for both Optim1 and Optim2, the T 4,sub of the 0D model increases significantly. This is mainly due to the increase in N L under subsonic cruise condition (increasing from 0.907 to 0.964 for Optim1, and from 0.90 to 0.95 for Optim2). The increase in T 4,sub leads to an increase in F sub and SFCsub, thereby widening the performance gap between the 0D model and the 0D-1D model. The SFCsub from the 0D-1D model is 3.1% and 2.7% lower than that from the 0D model in Optim1 and Optim2, respectively, and the F sub from the 0D-1D model is 11.6% and 7.2% lower, respectively.
5.0 Conclusions
To accurately exploit the ACE performance potential in a wide and complicated design space, the multi-objective optimisation towards enhancing the thrust and fuel efficiency based on the 0D-1D coupled method is carried out in this study. The main conclusions are summarised as follows:
-
1) An efficient and automatic 0D-1D ACE performance simulation method is proposed. For the adaptive fan and variable geometry LPT, the physics-based 1D mean-line models are established and coupled with the 0D engine model, which is significant for more accurate performance analysis and optimisation of the ACE in the conceptual and preliminary design stage.
-
2) The performance deviations between the 0D-1D model and the 0D model are more noteworthy at off-design and variable geometry conditions. The parametric study shows that the deviations of the thrust and SFC are less than 0.3% at design condition, but increase to 14.4 and 3.8%, respectively, at the subsonic cruise condition, which is caused by the different variable geometry characteristics of the adaptive fan and LPT between the two models.
-
3) Accurate prediction of the variable geometry LPT characteristics is critical to the ACE performance analysis and optimisation. Due to the multiple and contradictory effects of the variable geometry LPT, when the 0D model is inaccurate in predicting the mass flow and efficiency characteristics of the LPT, the engine performance trends with the variable geometry predicted by the 0D model may be opposite to reality, which should be of high concern to designers.
-
4) A multi-objective optimisation method combining the BPNN model and NSGA-II algorithm is proposed. The Pareto-optimal thrust and fuel efficiency of the 0D-1D model are better than those of the 0D model. The optimal design parameters and control laws from the 0D-1D model are different from those of the 0D model. For the Pareto-optimal solution Optim1, the subsonic SFC and thrust from the 0D-1D model are 1.7% lower and 4.5% larger than those from the 0D model, respectively. When the same optimisation variables are adopted in both models, the deviations of the subsonic SFC and thrust increase to 3.1% and 11.6%, respectively.
Performance comparisons with same optimisation variables

Table 10 Long description
The table compares performance metrics between the 0D and 0D-1D models using two sets of optimization variables, Optim1 and Optim2. It has two main sections, one for each optimization set, each containing four columns: F_sub in kilonewtons (kN), SFC_sub in kilograms per kilonewton-hour (kg/(kN-h)), T_4,sub in kelvins (K), and BPR_sub. Each section includes rows for the 0D model, the 0D-1D model, and the deviation between them. For Optim1, the 0D model shows F_sub of 33.7 kN, SFC_sub of 108.2 kg/(kN-h), T_4,sub of 1,883 K, and BPR_sub of 0.93. The 0D-1D model shows F_sub of 29.8 kN, SFC_sub of 104.8 kg/(kN-h), T_4,sub of 1,580 K, and BPR_sub of 0.62. The deviation row shows -11.6 percent, -3.1 percent, -16.1 percent, and -33.2 percent respectively. For Optim2, the 0D model shows F_sub of 36.1 kN, SFC_sub of 114.7 kg/(kN-h), T_4,sub of 1,751 K, and BPR_sub of 0.48. The 0D-1D model shows F_sub of 33.5 kN, SFC_sub of 111.6 kg/(kN-h), T_4,sub of 1,627 K, and BPR_sub of 0.41. The deviation row shows -7.2 percent, -2.7 percent, -7.1 percent, and -15.4 percent respectively.
Acknowledgements
This work was supported by the National Science and Technology Major Project [grant number J2019-I-0021-0020] and the National Science and Technology Major Project [grant number J2019-II-0020-0041].
Competing interests
The author(s) declared no potential conflicts of interest with respect to the research, authorship and/or publication of this article.