1. Introduction
Visual search is an essential process in daily life as it contributes to almost 90% of the information we obtain from the environment (Drury and Clement, Reference Drury and Clement1978). During visual search, people need to deploy visual attention to match target-features with the features of other objects in a specific search area that is filled with distractors (Wolfe, Reference Wolfe1994). Increasing target salience can significantly improve deployment of visual attention (Vecera et al., Reference Vecera, Cosman, Vatterott, Roper and Ross2014). As visual display terminals (VDTs) have matured as a primary medium for human–computer interactions (HCIs) (Shieh and Lin, Reference Shieh and Lin2000), many ergonomists have recommended strategies to heighten target salience by changing stimulus characteristics (e.g., size, shape, density, and colour) (Monk and Brown, Reference Monk and Brown1975; Drury and Clement, Reference Drury and Clement1978; Quinlan and Humphreys, Reference Quinlan and Humphreys1987; Lindberg and Näsänen, Reference Lindberg and Näsänen2003; Krause et al., Reference Krause, Bekkering, Pratt and Lindemann2017; Tao et al., Reference Tan, Wang and Li2018, Reference Tao, Yuan, Liu and Qu2018b). Among these characteristics, colour has been widely utilised as a visual cue, since colour-coded displays draw attention more efficiently than achromatic displays (Laughery et al., Reference Laughery, Young, Vaubel and Brelsford1993; Sanders and McCormick, Reference Sanders and McCormick1993; Ng and Chan, Reference Ng and Chan2018). Proper use of colour can enable people to identify targets easily and quickly within a search area (Silverstein, Reference Silverstein and Durrett1987; Pastoor, Reference Pastoor1990; Shieh and Chen, Reference Shieh and Chen1997; Shieh and Lin, Reference Shieh and Lin2000; Tao et al., Reference Tao, Wang and Wang2017, Reference Tao, Wang, Wang and Qu2018a), make displays more pleasant (Pastoor, Reference Pastoor1990), and influence operators’ cognition and perception (Christ, Reference Christ1975; Braun and Silver, Reference Braun and Silver1995; McKeown, Reference McKeown2008; Or and Chan, Reference Or, Chan, Karwowski and Salvendy2010; Suk and Irtel, Reference Suk and Irtel2010; Solli and Lenz, Reference Solli and Lenz2011; Bloj and Hedrich, Reference Bloj, Hedrich, Chen, Cranton and Fihn2012). On the contrary, if used in an inappropriate way, colours can lead to poor performance, high visual discomfort, and increased visual strain (Radl, Reference Radl, Grandjean and Vigliani1982; Matthews, Reference Matthews1987; Luria et al., Reference Luria, Neri and Schlichting1989; Shieh and Chen, Reference Shieh and Chen1997; Shieh and Lin, Reference Shieh and Lin2000). Hence applications of colour for various scenarios merit further exploration.
The past two decades have seen dramatic growth in equipping the cockpits of various vehicles (e.g., ships, aircraft, spacecraft, and automobiles) with VDTs, meaning that HCIs (e.g., operating radar system and information search) increasingly occur under vibration environments (Lin et al., Reference Lin, Liu, Chao and Chen2010). Exposure to long-term vibration has been reported to degrade HCI operators’ psychological and physiological outcomes (Graham, Reference Graham1990; Suzuki, Reference Suzuki1998; Mansfield, Reference Mansfield2005; Newell and Mansfield, Reference Newell and Mansfield2006; Dodd et al., Reference Dodd, Lancaster, Miranda, Grothe, DeMers and Rogers2014). Changes in search tasks and environment (e.g., static versus vibration) can also affect the amount of energy and effort that operators spend in performing cognitive tasks (e.g., visual search) (Lewis and Griffin, Reference Lewis and Griffin1978; Ishitake et al., Reference Ishitake, Ando, Miyazaki and Matoba1998; Mallick, Reference Mallick2007; Dodd et al., Reference Dodd, Lancaster, Miranda, Grothe, DeMers and Rogers2014; Coutts et al., Reference Coutts, Plant, Smith, Bolton, Parnell, Arnold and Stanton2019). Despite the benefits of proper use of colour in visual search, the effectiveness of colour in a vibration environment is still not clear. Therefore, the present study was conducted to: (1) empirically evaluate the effect of colour combinations on visual performance (search time and accuracy) under three vibration conditions; (2) examine the influence of vibration on participants’ perceptions (visual fatigue, discomfort, and perceived comfort level) and physiological aspects (systolic blood pressure, diastolic blood pressure, and heart rate); and (3) explore participants’ subjective preference to background and target colours, colour polarity, and colour combinations.
1.1. Colour combination
Colour can be perceived to be associated with specific concepts. For instance, people commonly associate red with ‘stop’ and ‘danger’ and green with ‘safe’ and ‘go’ (Bergum and Bergum, Reference Bergum and Bergum1981; Courtney, Reference Courtney1986; Chan and Courtney, Reference Chan and Courtney2001; Or and Wang, Reference Or and Wang2014; Wang and Or, Reference Wang and Or2015; Ng and Chan, Reference Ng and Chan2018), even after taking into account diverse occupational and cultural backgrounds (Or and Wang, Reference Or and Wang2014; Wang and Or, Reference Wang and Or2015). Colour can also be associated with drug effectiveness (De Craen et al., Reference De Craen, Roos, De Vries and Kleijnen1996; Stegemann, Reference Stegemann2005; Tao et al., Reference Tao, Wang and Wang2017, Reference Tao, Wang, Wang and Qu2018a). For example, two-piece capsules coloured in white-red could be perceived by the public as having an analgesic effect, white-orange a depressant effect, and white-blue and white-black a hallucinogenic effect (Tao et al., Reference Tao, Wang and Wang2017).
In addition to direct perceptions of colour, some combinations of colours used for targets and backgrounds can contribute to increased effectiveness in visual search on VDTs (Silverstein, Reference Silverstein and Durrett1987; Luria et al., Reference Luria, Neri and Schlichting1989; Pastoor, Reference Pastoor1990; Huang, Reference Huang2006, Reference Huang2008; Yeh et al., Reference Yeh, Lee and Ko2013). It has been reported that a light target colour on a dark background produces better performance in visual search (Luria et al., Reference Luria, Neri and Schlichting1989; Snyder et al., Reference Snyder, Decker, Lloyd and Dye1990; Shieh and Chen, Reference Shieh and Chen1997; Ling and van Schaik, Reference Ling and van Schaik2002; Westheimer et al., Reference Westheimer, Chu, Huang, Tran and Dister2003; Huang, Reference Huang2008; Humar et al., Reference Humar, Gradisar, Turk and Erjavec2014; Ko, Reference Ko2017). For example, Ko (Reference Ko2017) tested 16 target–background colour combinations, by mixing eight colours (background colours: red, blue, purple, and black; target colours: white, yellow, green, and turquoise) for effectiveness in searching for and recognising brand icons (i.e., letters with various target–background colours). The results showed that yellow on black, yellow on blue, and white on blue were the three most legible colour combinations. Ling and van Schaik (Reference Ling and van Schaik2002) examined the performance of six colour combinations (i.e., black on white, blue on white, blue on yellow, yellow on blue, red on green and green on red) when used for information presentation in web-based navigation bars and found that yellow on blue yielded the shortest reaction times. Shieh and Chen (Reference Shieh and Chen1997) investigated the effects of colour combination on viewing distance when performing VDT tasks. They found that white on blue, white on black, and yellow on blue outperformed black on white and red on green in terms of viewing distance.
As there are innumerable colour combinations, it is nearly impossible to evaluate and compare all combinations. Thus, researchers introduced colour polarity to describe colour combinations and divided colour combinations into positive polarity and negative polarity (Pawlak, Reference Pawlak1986). While different from contrast, which denotes difference in luminance between target colours and background colours (Whittle, Reference Whittle and Gilchrist1994), colour polarity can be interrelated with contrast. Usually, a colour combination with negative polarity has a positive contrast value while a colour combination with positive polarity has a negative contrast value, ranging from zero to –1. Positive polarity refers to presenting a lower luminance colour target on a higher luminance colour background (e.g., black on white), while negative polarity refers to presenting a higher luminance target on a lower luminance colour background (e.g., white on black) (Pawlak, Reference Pawlak1986; Tsang et al., Reference Tsang, Chan and Yu2012; Bhattacharyya et al., Reference Bhattacharyya, Chowdhury, Chatterjee, Pal and Majumdar2014; Humar et al., Reference Humar, Gradisar, Turk and Erjavec2014; Ko, Reference Ko2017). Based on this categorisation, the colour combinations that could yield better task performance in visual discrimination were found to belong to the category of negative polarity (e.g., yellow on blue). Nevertheless, some research has found that positive polarity outperformed negative polarity in enhancing visual discrimination, identification, and perceived comfort (Bauer et al., Reference Bauer, Cavonius, Vigliani and Grandjean1980; Nishiyama, Reference Nishiyama1990; Snyder et al., Reference Snyder, Decker, Lloyd and Dye1990; Taptagaporn and Saito, Reference Taptagaporn and Saito1990; Saito et al., Reference Saito, Taptagaporn and Salvendy1993; Sanders and McCormick, Reference Sanders and McCormick1993; Shieh and Lin, Reference Shieh and Lin2000; Wang et al., Reference Wang, Fang and Chen2003; Chan and Lee, Reference Chan and Lee2005; Feng et al., Reference Feng, Tseng, Chao and Lin2008; Mayr and Buchner, Reference Mayr and Buchner2010; Tsang et al., Reference Tsang, Chan and Yu2012). For example, Shieh and Lin (Reference Shieh and Lin2000) used a visual identification task to investigate 12 colour combinations from four colours (yellow, blue, red, and purple), half with negative polarity and half with positive polarity. The results showed that positive polarity led to a significantly higher accuracy and greater user preference than negative polarity, with blue on yellow having the best performance and the greatest preference rating. Tsang et al. (Reference Tsang, Chan and Yu2012) examined the effect of polarity on visual lobe shape characteristics using a detection task. They suggested using positive polarity to display inspection tasks, as ‘visual lobes charted under positive polarity were larger, smoother, and more regular than those under negative polarity’. It was also reported that positive polarity outperformed negative polarity as the former produced less glare than the latter (Sanders and McCormick, Reference Sanders and McCormick1993). These mixed findings on the effect of polarity deserve further exploration, in particular after taking into account other environmental factors (e.g., vibration).
1.2. Vibration
When exposed to vibration, people lose body balance and thus have to spend more effort to maintain their balance (Graham, Reference Graham1990; Wertheim, Reference Wertheim1998; Lu et al., Reference Lu, Liu, Lee and Lin2019). They may also suffer from health problems (e.g., low back pain) and experience physiological disorders (e.g., dizziness, discomfort, and disturbance) (Suzuki, Reference Suzuki1998; Rosen and Arcan, Reference Rosen and Arcan2003; Mansfield, Reference Mansfield2005; Newell and Mansfield, Reference Newell and Mansfield2006; Sundström, Reference Sundström2006; Okunribido et al., Reference Okunribido, Magnusson and Pope2008; Waters et al., Reference Waters, Genaidy, Barriera Viruet and Makola2008; Thamsuwan et al., Reference Thamsuwan, Blood, Ching, Boyle and Johnson2013; Nastaran et al., Reference Nastaran, Rolf, Thomas and Elke2016). Such adverse influence of vibration could further degrade the efficiency of cognitive performance (e.g., visual search) (Lewis and Griffin, Reference Lewis and Griffin1978; Ishitake et al., Reference Ishitake, Ando, Miyazaki and Matoba1998; Mallick, Reference Mallick2007; Dodd et al., Reference Dodd, Lancaster, Miranda, Grothe, DeMers and Rogers2014; Coutts et al., Reference Coutts, Plant, Smith, Bolton, Parnell, Arnold and Stanton2019). For example, Lewis and Griffin (Reference Lewis and Griffin1980) simulated five levels of sinusoidal whole-body vibration (i.e., for z-axis, vibration frequency between 2⋅8 and 63 Hz; for x- and y-axes, between 2⋅8 and 32 Hz), where a numeral reading task was conducted. The results showed that vibration significantly affected the reading accuracy at all frequencies of the three translational axes. Lin et al. (Reference Lin, Hsieh, Chen and Chen2008) conducted a number identification task to evaluate the influence of vibration on visual performance and visual fatigue while viewing computer display contents. They found that vibration significantly affected accuracy, reaction time, and visual fatigue. They also suggested increasing font size to compensate the influence of vibration. Tan et al. (Reference Tan, Wang and Li2018) utilised a visual search task on Chinese characters to examine the effect of four vibration conditions, i.e., 2 vibration amplitude (2⋅5 Hz and 5 Hz) × 2 vibration amplitudes (small and big, with unreported values). The results uncovered that vibration frequency and vibration amplitude could significantly affect accuracy and reaction time. Meanwhile, they also examined four font sizes (20 pt, 30 pt, 40 pt, and 50 pt) and found that increasing font size could improve search performance and reduce perceived difficulties.
Although these studies proposed some strategies (e.g., increasing font size) to mitigate the effects of vibration on visual search performance (Hsieh et al., Reference Hsieh, Lin and Chen2007; Lin et al., Reference Lin, Hsieh, Chen and Chen2008; Tan et al., Reference Tan, Wang and Li2018), little research was found exploring the effects of colour combinations on visual search under vibration conditions. For example, Mallick (Reference Mallick2007) examined the effect of colour combinations (i.e., white on black and black on white) on people's performance of data entry tasks when using a laptop computing system in moving automobiles along with three levels vibration (0 m/s2, 0⋅85 m/s2, and 1⋅65 m/s2). Although the authors suggested using white on black to present data entry tasks, the findings were limited by the experimental design, with only two colour combinations tested for the data entry tasks. It was thus still unclear which colour combinations could produce the best performance on visual search tasks. Therefore, given the potential benefit of colour for visual search and the increased number of HCIs occurring under vibration conditions, the present empirical study was conducted to explore the effects of colour combinations on visual search under various vibration conditions.
2. Method
2.1. Experimental design
This experiment was based on a two-way (3 × 24) repeated measures design, with vibration and colour combination as the within-subjects factors. There were three levels of vibration: static (serving as a control condition), low vibration, and high vibration. Table 1 presents the parameters for the three vibration conditions. Parameters for low vibration condition was set based on the NATO regulations for naval safety and performance by North Atlantic Treaty Organization (2000), while parameters for the high vibration condition were double the parameter values of the low vibration condition. The weighted root mean square acceleration values for the two vibration conditions were within the range of ‘a little uncomfortable’ level specified in the ISO 2631-1 standard (International Organisation for Standardisation, 1997).
Amplitudes for the three tested vibration conditions in this study

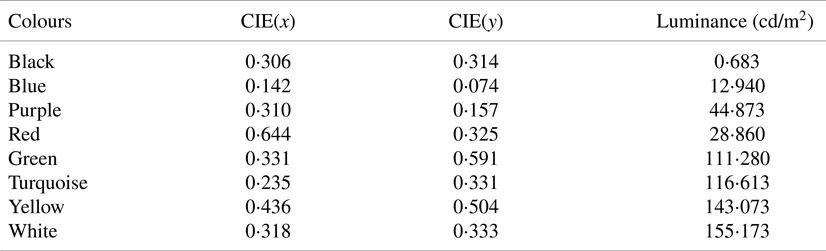
The tests used eight colours specified by the Commission Interational de l'Eclairage (2007) and utilised in previous studies (e.g., Marques, Reference Marques2011; Ko, Reference Ko2017). They were based on a red-green-blue (RGB) colour model: three primary colours: red (RGB: 255, 0, 0), green (RGB: 0, 255, 0), and blue (RGB: 0, 0, 255); three secondary colours created by mixing any two of the three primary colours: yellow (green and red, RGB: 255, 255, 0), turquoise (blue and green, RGB: 0, 255, 255), and purple (red and blue, RGB: 255, 0, 255); and two achromatic colours: black (RGB: 0, 0, 0) and white (RGB: 255, 255, 255). The colour luminance and CIE coordinates for the eight colours were measured (see Table 2).
Chromaticity coordinates of the eight colours examined in this study
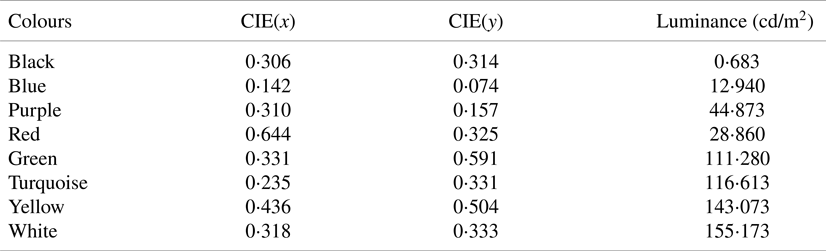
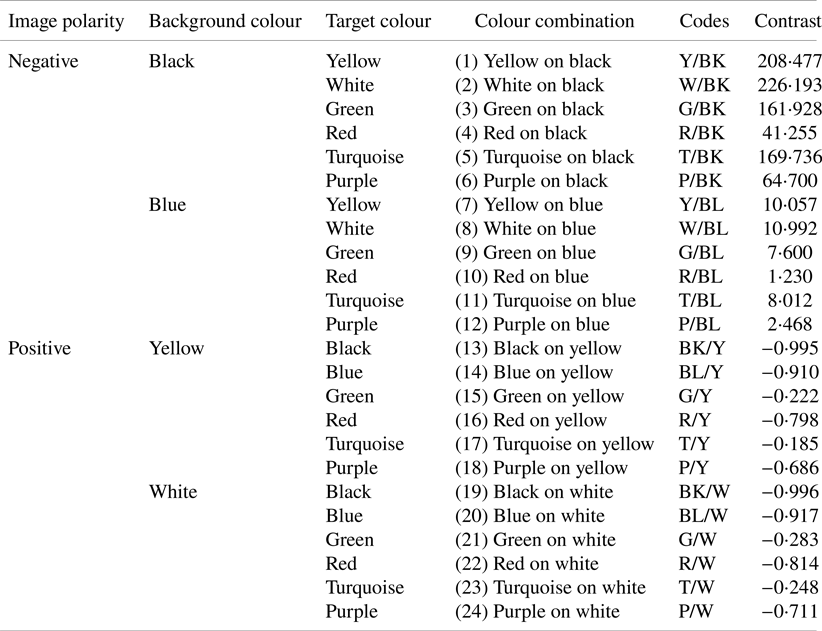
Table 2 also shows that yellow and white yield the highest luminance while black and blue produce the lowest luminance, which made the four colours ideal choices for background colours in positive and negative colour polarity (Shieh and Chen, Reference Shieh and Chen1997; Shieh and Lin, Reference Shieh and Lin2000; Ko, Reference Ko2017). Specifically, for positive polarity, yellow and white were used for background colours and the other six colours for target colours. For negative polarity, black and blue were used for background colours and the other six colours for target colours. Therefore, a total of 24 colour combinations were created (see Table 3). In addition, given the luminance values of the eight colours (see Table 2), the contrast statistics for all the 24 colour combinations were calculated, based on the Weber contrast equation, which fits the situation of presenting small graphic objects on a large uniform background (Whittle, Reference Whittle and Gilchrist1994):
 \[{C_w} = \frac{{({{L_t} - \textrm{ }{L_b}} )}}{{{L_b}}}\]
where, Lt denotes the target luminance and Lb is the background luminance.
The 24 colour combinations by polarity, background colour, and target colour

Nine dependent variables were measured: visual search performance (response time and accuracy), perceptions (visual fatigue, discomfort, and overall comfort), physiological aspects (systolic blood pressure (SBP), diastolic blood pressure (DBP), and heart rate (HR)), as well as subjective preference. Response time was measured as the time that participants required to confirm target information after being presented with the stimuli. Accuracy was calculated as the proportion of correct responses, where a correct response was identified when participants accurately indicated the type and the location of the target(s). Visual fatigue was measured as the level of eye strain using a Likert scale ranging from 0 (no visual fatigue) to 100 (very severe visual fatigue). Discomfort referred to the level of discomfort participants perceived after a visual search task, measured by a Likert scale ranging from 0 (no discomfort at all) to −10 (extreme discomfort) (Kyung et al., Reference Kyung, Nussbaum and Babski-Reeves2008). Overall comfort referred to how much discomfort/comfort participants perceived after a visual search task, measured by a Likert scale ranging from 0 (extremely strong discomfort and no comfort at all) to 100 (extremely strong comfort and no discomfort at all) (Kyung et al., Reference Kyung, Nussbaum and Babski-Reeves2008). SBP, DBP, and HR were measured using a wrist-based wearable healthcare device (Stiger P3, China). Subjective preference represented the target colour, background colour, colour combination, and polarity that the participants preferred to for visual search tasks.
2.2. Participants
Forty-eight undergraduate and postgraduate students (24 females and 24 males; mean age = 20⋅9 years, SD = 2⋅4 years) with an engineering background at Shenzhen University participated in the study. The mean visual acuity for the participants’ left and right eyes was 4⋅83 (SD = 0⋅22) and 4⋅81 (SD = 0⋅25), respectively. All participants self-reported having normal or corrected-to-normal vision, normal colour vision, no cognitive disorder, being able to read and write, and with normal mobility. They confirmed that they were aware of their vision and cognitive disorder status. The university's institutional review board approved the present study. Each of the participants gave their written informed consent prior to attending the experiment.
2.3. Apparatus
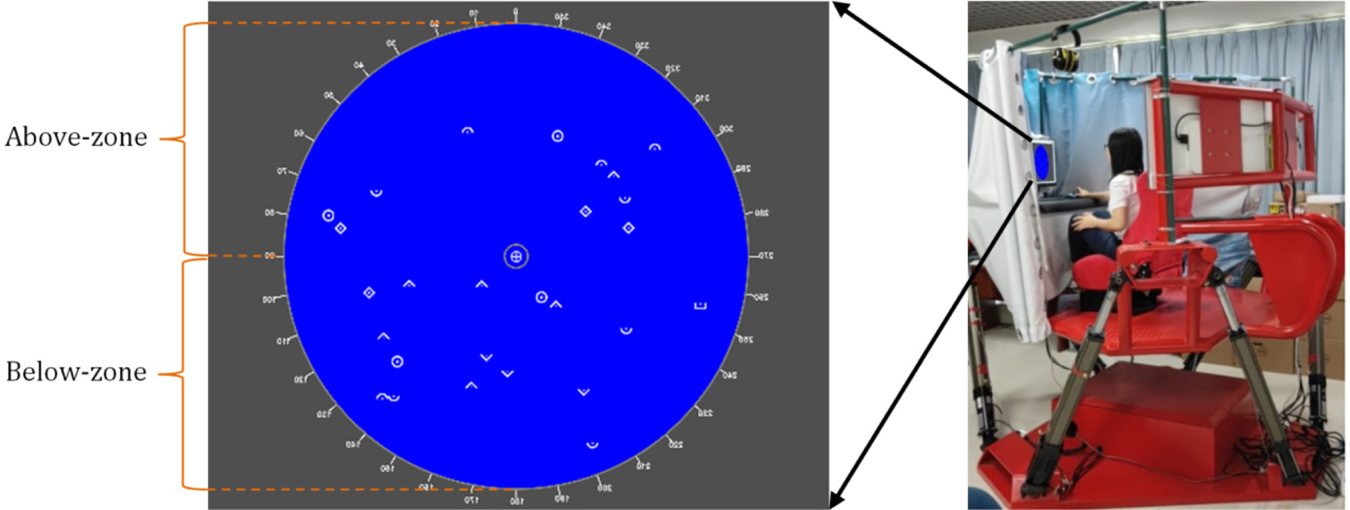
The vibration conditions were simulated by using a Stewart platform (Model: PT-6-75L-1000S, Foshan Yishili Tech) that could freely move in six degrees: heave (y-axis) ±25 cm, sway (x-axis) ±25 cm, surge (z-axis) ±25 cm, pitch ±16°, roll ±16°, and yaw ±25°, and had a peak acceleration of 0⋅5 g (see Figure 1). An application developed using C# was used to display the stimuli, to record participants’ responses, and automatically calculate their performance (e.g., response time and accuracy). The application was operated on a desktop computer with a Dell 23-inch LCD monitor (model: P2418HT; screen refresh rate: 60 Hz; resolution: 1,280 × 1,024 pixels). The illumination on the VDT was 53⋅5 lm/m2. A Snellen eye chart was used to measure participants’ visual acuity, with glasses put on when needed.
An example of the radar interface mock-up, with stimuli in white on a blue background and with an illustration of the target location zones (left), and the six-degrees-of-freedom platform utilised for the simulation of vibration conditions (right)

2.4. Visual search task
Two types of visual search tasks were employed: a single-target task and a dual-targets task. A computer image of a ship radar interface mock-up was designed for the presentation of the experimental stimuli, following the pattern of the classical radar display, i.e., the Plan-Position Indicator (PPI) (Sinclair, Reference Sinclair and Sinclair2011; Bole et al., Reference Bole, Wall, Norris, Bole, Wall and Norris2014). The PPI positioned the radar station in the centre of the display and the circular path denoted the maximum detection distance from the centre (see Figure 1).
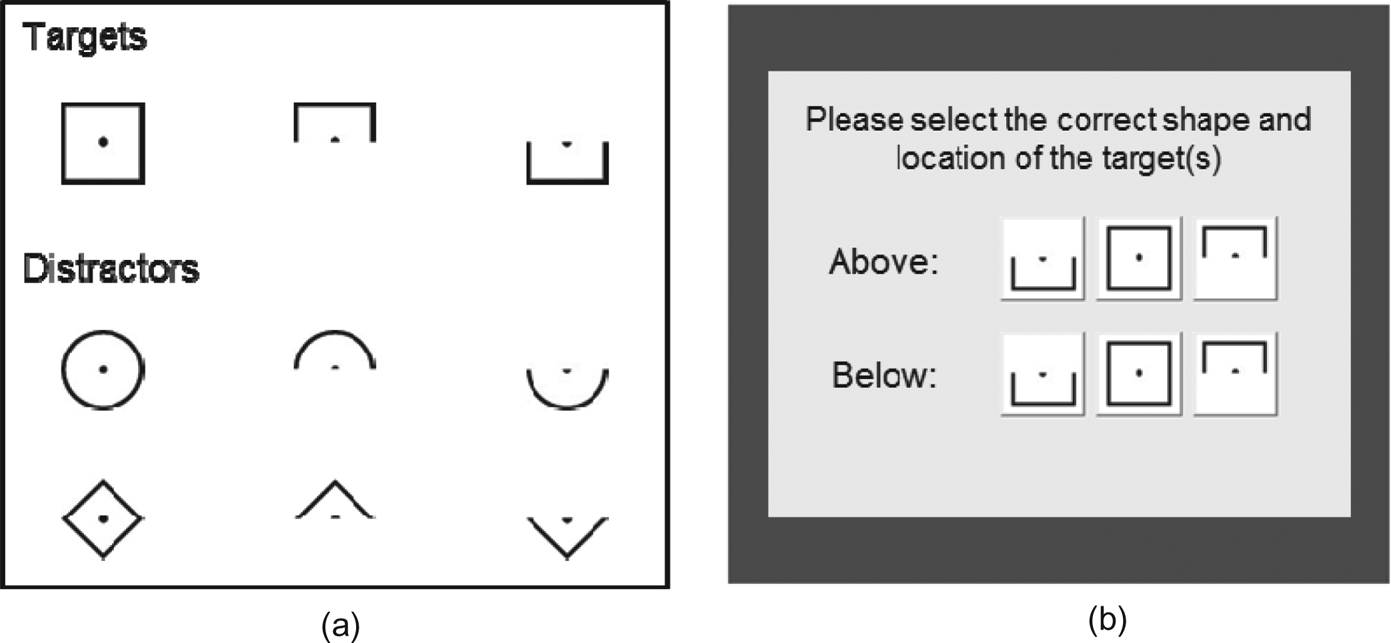
Figure 2(a) shows three target types and six distractor types. In a single-target task, one of the three target types was randomly selected as the target; while in a dual-targets task, two of them were randomly selected as the targets. Figure 2(b) presents the response interface for selection of target types and locations. The two potential target locations are illustrated in Figure 1, i.e., the upper half-circle of the interface as ‘above’ zone and the lower half-circle as the ‘below’ zone.
(a) Experimental stimulus types; (b) the response interface for target types and locations

2.5. Procedure
The participants were first introduced to the study background and were asked to give their written informed consent. Their demographic information was subsequently collected using a questionnaire, followed by measurement of their visual acuity. After being seated in the chair on the Stewart platform, the participants were allowed to adjust the chair-to-desk distance to make themselves comfortable. The experiment comprised of practice and test phases. The practice phase was provided to enable the participants to familiarise themselves with the experimental environment and tasks. Before the test phase, the participants were instructed to close the curtain over the platform, in an attempt to simulate a confined cockpit and to minimise any light reflection on the screen. A pilot test was conducted to confirm that there was no visible reflection or shadow on the VDT. The test phase comprised of 216 trials (3 vibration conditions × 24 colour combinations × 3 repetitions) for each task type. Three repetitions in each experimental combination condition, which is a widely adopted experimental design strategy (Kamarul et al., Reference Kamarul, Ahmad and Loh2006; Koley and Melton, Reference Koley and Melton2010; Liao, Reference Liao2016), was utilised for the stability of the data. Only the data from the test phase was analysed.
In a single-target task, the participants were first shown a cross in the centre of the screen. After one second, the cross was replaced by a radar interface mock-up, on which there were 28 experimental stimuli (including targets). The number of stimuli was determined to show a median level of stimuli density. The types and locations of the experimental stimuli appeared randomly. The participants were subsequently required to search for the target and to identify the target type and location. When the participants believed they had found the target, they were asked to press the space key on the keyboard. After the key was pressed, a response interface was presented on the screen (see Figure 2b). The participants were then required to move the mouse to click the target type and location. The procedure in performing a dual-targets task was exactly the same as the single-target task with two exceptions: (1) there would be two targets simultaneously presented on the radar interface mock-up; (2) the participants were required to identify the types and locations of the two targets one by one, i.e., the response interface (Figure 2b) would be displayed twice. The participants were told to complete each trial as quickly and accurately as possible. No correct answers were given to the participants after each trial.
The 72 trials under each vibration condition were grouped as one block. In order to reduce any order effects, the sequence of the three blocks was counter-balanced and the trials within each block were presented randomly. Between blocks, the participants were given 10 min for rest. Before and after each block, the participants were required to complete questionnaires for their perceived visual fatigue, discomfort, and overall comfort and to measure their SBP, DBP, and HR. The participants were also asked to give their subjective preference for background colour, target colour, colour combination, and polarity, after task performance under each vibration condition. The entire experiment could be completed within two hours.
2.6. Data analysis
Two sets of two-way analysis of variance (ANOVA) tests were employed to analyse response time and accuracy for the effect of vibration-colour combination and vibration-polarity in each task type. Six separate ANOVA tests were conducted to analyse the effect of vibration and time point of measurement on visual fatigue, discomfort, overall comfort, SBP, DBP, and HR for each task type. Greenhouse-Geiser correction was applied for any sphericity violation. Bonferroni post hoc comparison tests were used to evaluate the pair-wise means. Chi-square tests were utilised to analyse participants’ preference on colours.
3. Results
3.1. Response time
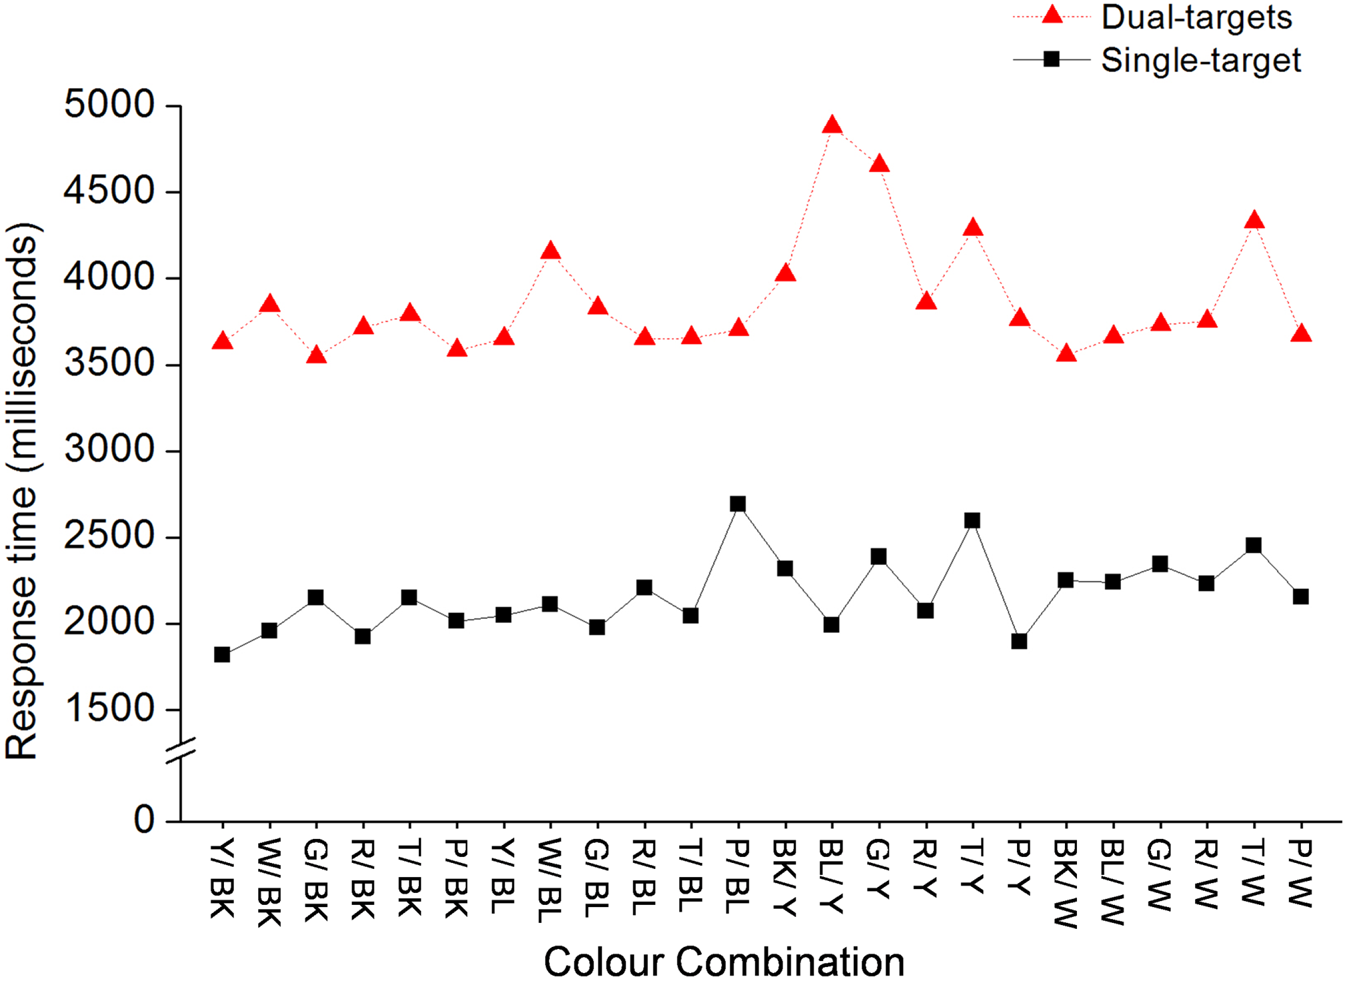
The results of the ANOVA test (24 colour combinations × 3 variation conditions) showed that colour combination significantly influenced response time for both single-target tasks, F(5⋅431, 255⋅260) = 8⋅863, P < 0⋅001, and dual-targets tasks, F(4⋅878, 229⋅247) = 14⋅010, P < 0⋅001. Figure 3 shows the response time of each colour combination for both task types. However, vibration did not significantly affect response time and no significant interaction effect was found for both task types (all P values > 0⋅05).
Response time as a function of colour combination and task type

The results of the ANOVA test (2 polarity × 3 vibration conditions) were that polarity significantly affected response time for single-target tasks, F(1, 47) = 12⋅508, P = 0⋅001, and for dual-targets tasks F(1, 47) = 17⋅119, P < 0⋅001. The results of the post hoc comparison tests showed that response time for negative polarity (mean = 2,089 ms, SD = 430 ms) was significantly shorter than that for positive polarity (mean = 2,243 ms, SD = 613 ms) (P = 0⋅001) in single-target tasks; in dual-targets tasks, negative polarity (mean = 3,729 ms, SD = 782 ms) required shorter response time than positive polarity (mean = 4,014 ms, SD = 1,058 ms) (P < 0⋅001). However, there was no significant effect of vibration for both tasks (all P values > 0⋅05).
3.2. Accuracy
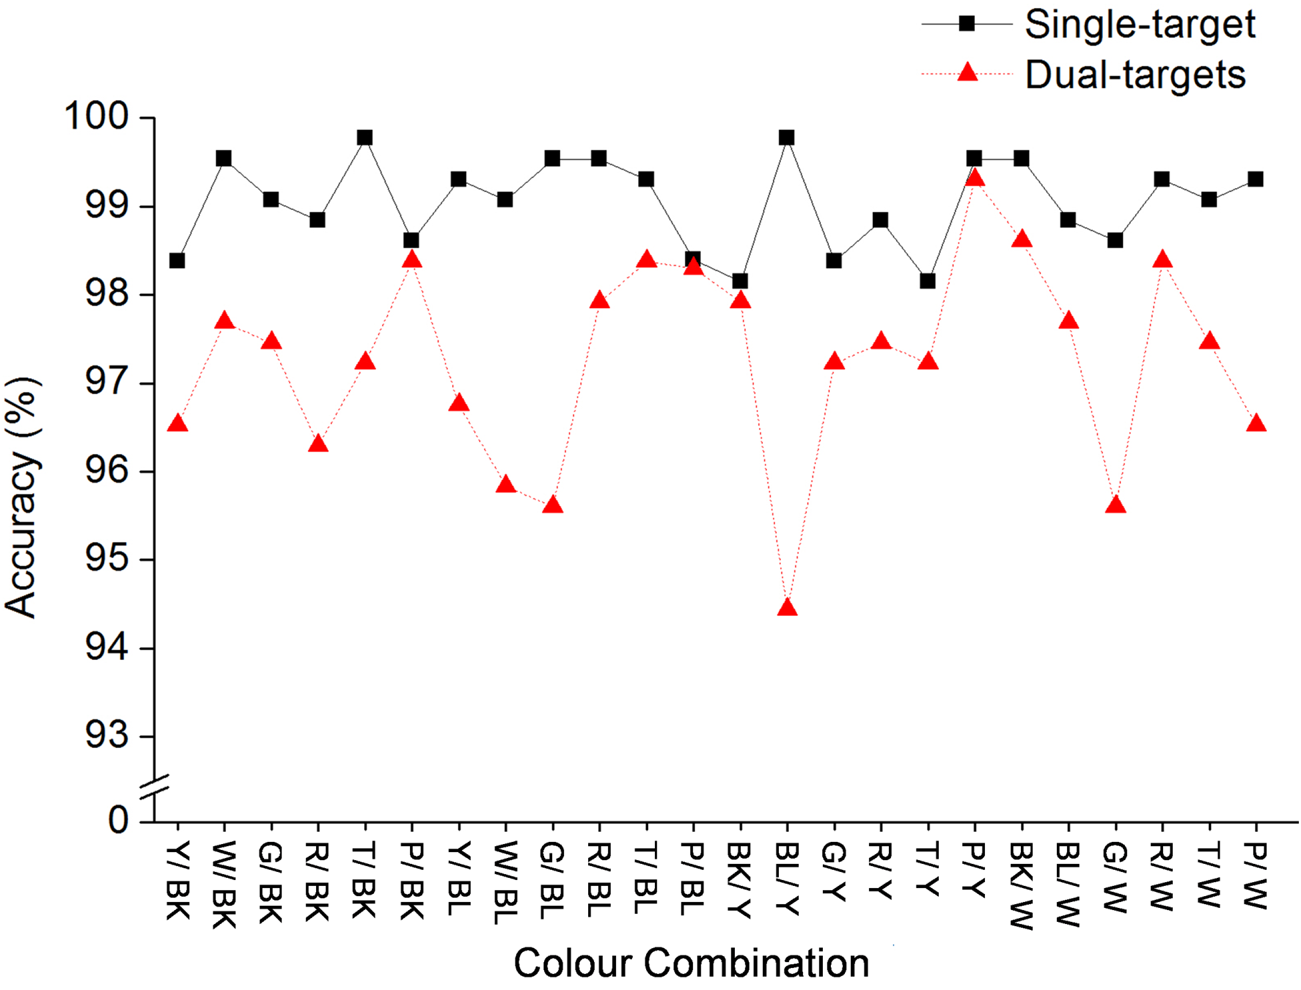
The results of the ANOVA test (24 colour combinations × 3 variation conditions) showed that colour combination only significantly influenced accuracy for dual-targets tasks, F(12⋅609, 592⋅604) = 2⋅021, P = 0⋅018, but not for single-target tasks (P = 0⋅340). Figure 4 depicts the accuracy for each colour combination for both task types. The effect of vibration and the interaction effect on accuracy were not significant for both tasks (all P values > 0⋅05). The results of the ANOVA test (2 colour polarity × 3 vibration conditions) reported no significant effect of colour polarity, vibration, or interaction on accuracy for both tasks (all P values > 0⋅05).
Accuracy as a function of colour combination and task type

3.3. Perceptions
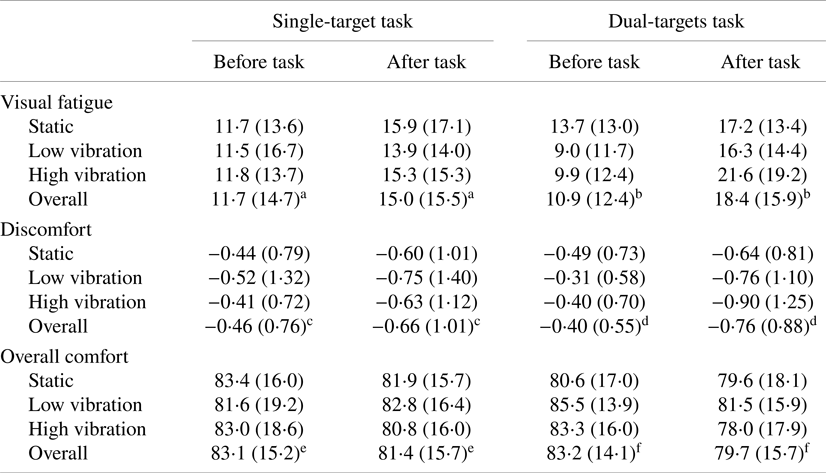
Table 4 presents the mean values (SD) of visual fatigue, discomfort, and overall comfort before and after performing tasks. The results of ANOVA test (3 vibration conditions × 2 measurement time) showed that vibration did not significantly affect visual fatigue, discomfort, and overall comfort for both task types (all P values > 0⋅05), except overall comfort for dual-targets tasks F(2, 94) = 3⋅307, P = 0⋅041.
Mean (SD) of visual fatigue, discomfort, and overall comfort ratings before and after task performance by task type and vibration condition

Note: Values labelled with superscript letters a or c differ significantly at a level of 0⋅01, those with e differ significantly at a level of 0⋅05, and those with b, d, or f differ significantly at a level of 0⋅001.
A significant difference was found in visual fatigue, discomfort, and overall comfort before and after performing single-target tasks and dual-targets tasks (all P values < 0⋅05). No significant interaction effect was found between vibration and time point of measurement for visual fatigue, discomfort, and overall comfort for both task types (all P values > 0⋅05), except the interaction effect for visual fatigue in dual-targets tasks F(1⋅686, 79⋅230) = 5⋅840, P = 0⋅007.
3.4. Physiological aspects
The results of ANOVA tests (3 vibration conditions × 2 measurement time) showed no significant effect of vibration in SBP, DBP, or HR for both task types (all P values > 0⋅05). Also, no significant difference was found for SBP, DBP, or HR before and after performing visual search tasks (all P values > 0⋅05). No significant interaction was found for SBP, DBP, and HR for both task types (all P values > 0⋅05).
3.5. Preference
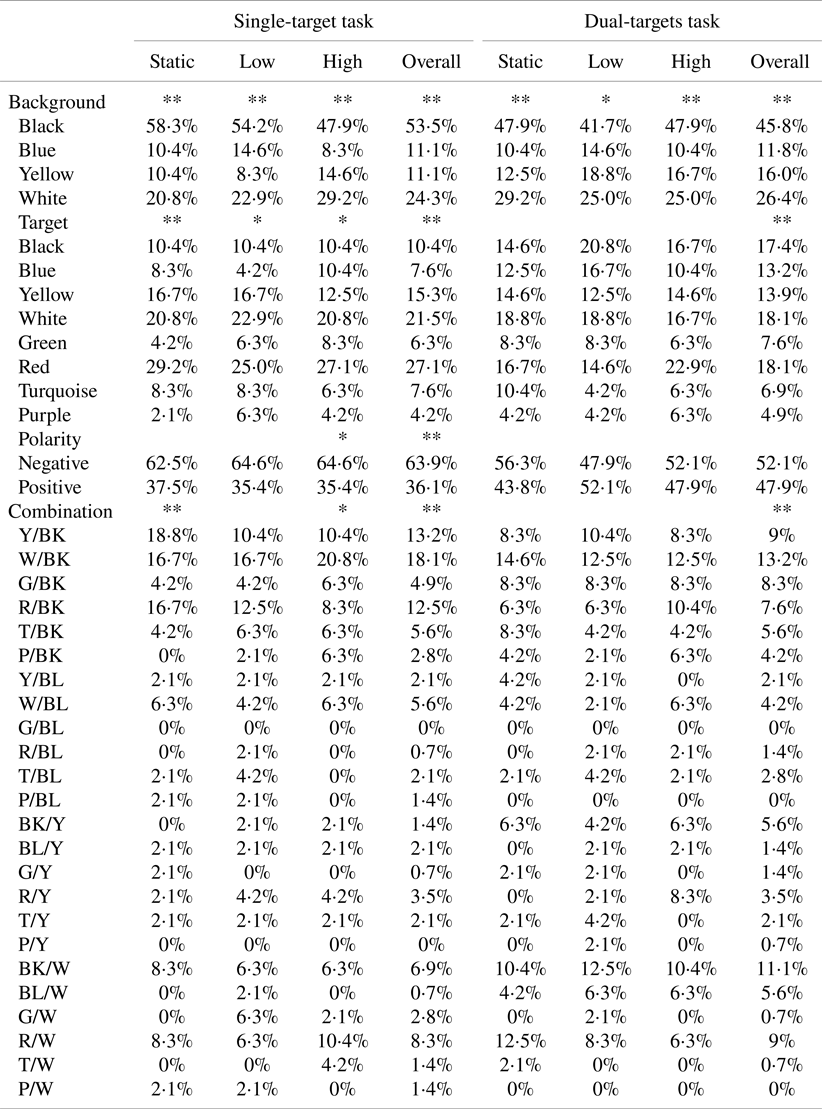
Table 5 presents subjective preference for background colour, target colour, colour polarity, and colour combination under each vibration condition for both task types. Regardless vibration, there was a significant difference among participants in their preferences for background colour, target colour, colour combination, and colour polarity when they performed single-target tasks (all P values < 0⋅01). For dual-targets tasks, there was also significant difference among participants in their preferences for background colour, target colour, and colour combination (all P values < 0⋅05), but not colour polarity (P = 0⋅617). Table 5 also presents the results of Chi-square tests for subjective preference under each vibration condition.
Subjective preference percentage for background colour, target colour, polarity, and colour combination and chi-square test results
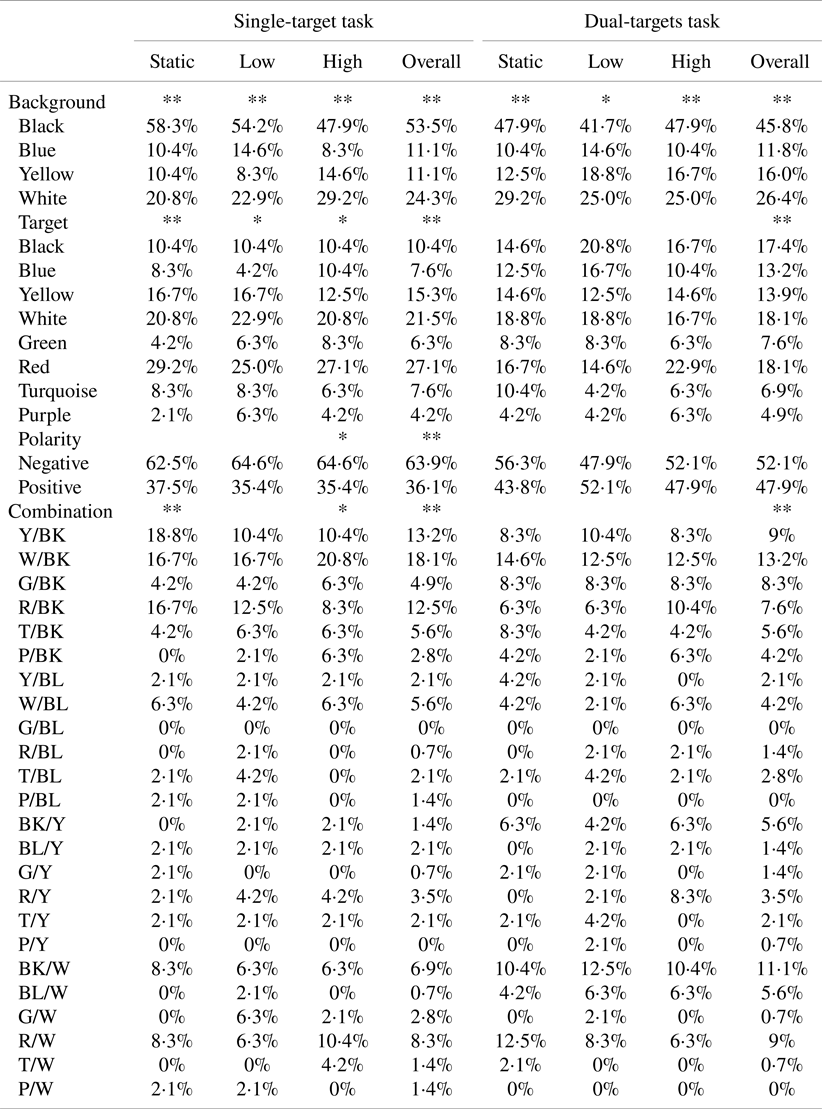
* Note: Chi-square test results show a significant difference at a level of 0⋅05.
** Chi-square test results show a significant difference at a level of 0⋅01.
4. Discussion
This study aimed to examine the effect of colour combination and vibration on visual search in single-target and dual-targets tasks. In general, the findings showed that vibration did not significantly affect visual performance (response time and accuracy), perceptions (visual fatigue, discomfort, and overall comfort ratings), or physiological aspects (DBP, SBP, and HR). Colour combination and colour polarity had a significant effect on response time. There were significant differences in visual fatigue, discomfort, and overall comfort ratings before and after performing both single-target and dual-targets tasks. Significant differences were found among subjective preferences for background colour, target colour, colour polarity, and colour combinations for both task types.
4.1. Effects of vibration
Our results indicated that vibration had no significant influence on visual search performance. This finding may indicate that human beings’ visual search capability can be kept consistent under such vibration conditions as were tested in this study. Lin et al. (Reference Lin, Liu, Chao and Chen2010) utilised similar vibration conditions to evaluate the pointing performance of three input devices (i.e., mouse, trackball, and touchscreen). The results showed that vibration significantly affected the operation performance. It seems to be rational to speculate that vibration tends to affect operations requiring physical movements (e.g., using hand to control input devices) but produces less impact on psychological activities such as information processing. Such a speculation is in the line with the findings of previous studies. For example, Goode et al. (Reference Goode, Lenné and Salmon2012) investigated the effect of vibration on task performance using a touchscreen in-vehicle system and found that vibration significantly affected the performance of text entry tasks (i.e., a physical operation) but not the performance of reading coordinates (i.e., an information processing operation). Although more studies are needed to explore the subject, it appears that ergonomic designs of HCIs under static conditions could be cautiously applied to vibration scenarios close to our experimental designs.
Our findings also showed that vibration had only a mild effect on overall comfort ratings in dual-targets tasks (P = 0⋅041), and vibration did not affect the participants’ perceptions (i.e., visual fatigue, discomfort, and overall comfort) or physiological aspects (i.e., SBP, DBP, and HR) in both task types. This result to some extent supports that the amplitudes of vibration set by the NATO regulations for naval safety and performance (North Atlantic Treaty Organization, 2000), which were used in this study, can ensure good operating conditions for people who are exposed to vibrations. Nevertheless, we also found that participants’ visual fatigue, discomfort, and overall comfort ratings significantly changed after performing visual search tasks (see Table 4). In particular, visual fatigue and discomfort significantly increased, while overall comfort significantly decreased after task performance. Thus indicates that a moderate rest is necessary to mitigate fatigue and discomfort after performing certain search tasks.
It should be noted that visual fatigue, discomfort, and overall comfort ratings, even if they increased after search tasks, still stayed in an acceptable range. For example, after performing dual-targets tasks under high vibration conditions, the participants perceived higher visual fatigue (21⋅6, scale range: 0 to 100), greater discomfort (−0⋅90, scale range: 0 to −10), and lower overall comfort (78⋅0, scale range: 0 to 100). One possible reason is that this study followed the NATO regulations and the high vibration condition was categorised as ‘a little uncomfortable’ level based on the ISO 2631-1 (International Organisation for Standardization, 1997), leading to a mild influence on the participants’ perceptions. The other reason may be due to the fact that the search task for either task type took less than 10 minutes for each combination condition, which would cause a low level of fatigue. In practice, for example, operators on ships often spend hours of visual monitoring and information search activities, leading to increased strain upon their visual systems (Shieh and Chen, Reference Shieh and Chen1997). This may or may not further interact with the influence of vibration or colour combination. More studies are needed to verify such an interaction effect of search tasks in terms of task-period or task-difficulty.
4.2. Effects of colour combination
Colour combination was found significantly to affect response time for both task types and had a significant effect on accuracy in performing dual-targets tasks. In detail, the colour combination resulting in the quickest completion of single-target tasks is yellow on black (mean = 1,815 ms), followed by purple on yellow (mean = 1,894 ms), red on black (mean = 1,923 ms), and white on black (mean = 1,954 ms). In dual-targets tasks, the top four quickest colour combinations are green on black (mean = 3,545 ms), black on white (mean = 3,554 ms), purple on black (mean = 3,583 ms), and yellow on black (mean = 3,628 ms). This indicates that colour combinations with black as background colour (e.g., yellow on black) produced a shorter response time in both task types, consistent with previous studies (Westheimer et al., Reference Westheimer, Chu, Huang, Tran and Dister2003; Huang, Reference Huang2008; Humar et al., Reference Humar, Gradisar, Turk and Erjavec2014; Ko, Reference Ko2017). One reason could be that colour combinations with a lighter colour (e.g., yellow) on a black ground would help to increase the recognisability of the expected targets from the search area (Ko, Reference Ko2017), which was also proved by our findings about negative polarity.
In this study, polarity was found to have a significant effect on response time for both task types, consistent with previous studies (Bauer et al., Reference Bauer, Cavonius, Vigliani and Grandjean1980; Pawlak, Reference Pawlak1986; Shieh and Lin, Reference Shieh and Lin2000; Chan and So, Reference Chan and So2007; Mayr and Buchner, Reference Mayr and Buchner2010; Tsang et al., Reference Tsang, Chan and Yu2012). Specifically, negative polarity (i.e., light target colours on a dark background) reduced response time by close to 8% as compared with positive polarity (i.e., dark target colours on a light background) for both task types. Such a better performance of negative polarity over positive polarity was similar to those of previous studies (Luria et al., Reference Luria, Neri and Schlichting1989; Snyder et al., Reference Snyder, Decker, Lloyd and Dye1990; Shieh and Chen, Reference Shieh and Chen1997; Ling and van Schaik, Reference Ling and van Schaik2002; Westheimer et al., Reference Westheimer, Chu, Huang, Tran and Dister2003; Huang, Reference Huang2008; Humar et al., Reference Humar, Gradisar, Turk and Erjavec2014; Ko, Reference Ko2017). However, this is not a final conclusion about the comparison between negative and positive polarity. Based on our findings, two colour combinations considered as positive polarity produced shorter response times (i.e., purple on yellow for single-target tasks and black on white for dual-targets tasks) compared with other colour combinations. These two colour combinations achieved the highest accuracy. However, our study was a laboratory-controlled experimental design, with control for other factors that may influence visual search performance, e.g., screen glare. When taking such factors into account, the results may or may not be changed as positive polarity would cause less glare or reflection problems than negative polarity (Sanders and McCormick, Reference Sanders and McCormick1993). More studies are needed to verify this.
From the perspective of subjective preference, we found that the participants preferred black as the background colour under all vibration conditions for both task types. Moreover, the participants rated white on black, yellow on black, and red on black as the most preferable colour combinations in single-target tasks, and white on black, black on white, and yellow on black in dual-targets tasks, even taking into consideration different vibration conditions. These results are consistent with our findings on visual performance. It seems that people are more likely to prefer colour combinations that could yield better visual search task performance. It was also found that the participants only rated negative polarity as the better choice when performing single-target tasks. The difference between negative and positive polarity is not quite clear, in particular for dual-targets tasks. This result is also in line with our findings on visual performance. That may be due to the fact that each polarity has many colour combinations, among which there would be one or several combinations with the best performance. These consistent relationships between subjective ratings and objective measurements suggest that separately using preference rating could be an effective approach to evaluate whether a colour combination is appropriate or not, similar to the findings of previous studies (Shieh and Chen, Reference Shieh and Chen1997; Shieh and Lin, Reference Shieh and Lin2000). However, it is also worth mentioning that red was rated as the most favourable colour to display the target in both task types, while its combinations with other colours, e.g., red on black rated as the third most favourable in single-target tasks and the sixth in dual-targets tasks. This may have occurred because people can directly perceive red as ‘caution’ and ‘stop’, which could attract more visual attention than other colours (Chan and Courtney, Reference Chan and Courtney2001; Wang and Or, Reference Wang and Or2015). When rating colour combinations including red, people would like to consider the contrast between red and its background colours before making a decision about their favourable combination(s).
4.3. Practical implications
Some practical suggestions on interface designs have been formulated to facilitate visual search. First, since vibration has no significant effect on visual performance, it seems that the application of colour combinations that perform best in a static condition can be applied cautiously to vibration conditions similar to those applied in the present study. Second, colour combinations significantly affected visual performance, particularly the response time. For search tasks where search speed is important, designers should carefully select colour combinations to display in human–computer interfaces. Based on our findings, black is recommended as the background colour with yellow or white as the target colour. Third, polarity produced a significant effect on response time for both task types. It is suggested to use colour combinations with negative polarity, where possible, for presentation of search interfaces. When positive polarity is indeed to be used, e.g., considering the glare issue, purple on yellow is recommended for single-target tasks and black on white for dual-targets tasks. Fourth, subjective preferences reflect colour combinations that provide strong contrast and produce better visual performance (e.g., white on black and yellow on black), which indicates a consistency between subjective and objective evaluations of colour combinations. Ergonomists can make use of such subjective preferences when designing human–computer interfaces prior to empirical evaluations.
4.4. Limitations
Although the present study was carefully designed, there are some limitations that need to be noted. First, we determined vibration conditions based on the NATO regulations (North Atlantic Treaty Organization, 2000), which regulate the degree of vibration for good operating conditions. Both of the low and high vibration conditions were under the ‘a little uncomfortable’ category based on the ISO 2631-1 (International Organization for Standardization, 1997). This indicates that the vibration conditions we tested may not be severe enough to degrade visual search capability. When exposed to severe vibration conditions, people's psychological and cognitive activities could be seriously affected (e.g., Lewis and Griffin, Reference Lewis and Griffin1980; Lin et al., Reference Lin, Hsieh, Chen and Chen2008; Tan et al., Reference Tan, Wang and Li2018). It is possible that the influence of vibration and colour combination on visual search may change in such severe vibration conditions. Thus, the generalisability of our findings to severe vibration conditions awaits confirmation by future studies. Second, stimuli factors such as size, layout, and density have been reported to have significant effects on visual search (Monk and Brown, Reference Monk and Brown1975; Drury and Clement, Reference Drury and Clement1978; Lindberg and Näsänen, Reference Lindberg and Näsänen2003; Goode et al., Reference Goode, Lenné and Salmon2012; Krause et al., Reference Krause, Bekkering, Pratt and Lindemann2017). However, our study did not take these factors into account. Future studies are needed to evaluate the interaction effect of such stimuli factors with vibration and colour combination on visual search. Third, people may have various perceptions on the target weights (e.g., size) under different target–background colour combinations (e.g., negative and positive colour polarity) (Kahn and Lenk, Reference Kahn and Lenk1998; Grobelny and Michalski, Reference Grobelny and Michalski2015; Magnini and Kim, Reference Magnini and Kim2016), which deserves to be examined in future study.
5. Conclusions
The effect of colour combination on visual search under three vibration conditions was empirically explored using single- and dual-targets tasks. The findings showed no significant effects of vibration on visual performance, perceptions, or physiological aspects. This result indicates that designs of human–computer interfaces using colour coding systems under static conditions could be cautiously applied to environments with similar vibration conditions to those used in this study. Colour combination and colour polarity had significant effects on response time. For visual search tasks that focus on response time, it is recommended to use colour combinations with negative polarity (e.g., yellow on black and white on black) for presenting search interfaces. Also, individuals prefer colour combinations that have the potential to produce better performance. These findings are of importance for designing human–computer interfaces for information search under vibration conditions.
Financial Support
This work was partly supported by the Humanity and Social Science Youth foundation of the Ministry of Education of China (grant no. 20YJCZH146), the Natural Science Foundation of Guangdong Province, China (grant no. 2019A1515010863), the Foundation of Shenzhen Science and Technology Committee (grant no. 20200813225029002) and funding from China Institute of Marine Technology and Economy. The authors thank Qiugu Chen for her assistance in experiment set-up and data collection.
Ethical Standards
The authors assert that all procedures contributing to this work comply with the ethical standards of the relevant national and institutional committees on human experimentation and with the Helsinki Declaration of 1975, as revised in 2008.