INTRODUCTION
Wood-boring bivalves, or shipworms (Bivalvia: families Teredinidae and Xylophagainae), are sometimes called ‘termites of the sea’ (Greene, Reference Greene1994) because of their voracious appetite for nitrogen (N)-poor wood. They are major remineralizers of woody material in coastal and marine environments (Turner, Reference Turner, Costlow and Tipper1984). Shipworms are capable of living on a diet of wood alone (Gallager et al., Reference Gallager, Turner and Berg1981), partly because of a nitrogen (N) supplement to their diet from N2-fixing bacterial endosymbionts (Lechene et al., Reference Lechene, Hillion, McMahon, Benson, Kleinfeld, Kampf, Distel, Luyten, Bonventre, Hentschel, Park, Ito, Schwart, Begichou and Slodzian2006, Reference Lechene, Luyten, McMahon and Distel2007). The endosymbionts reside in specialized bacteriocytes within the gill tissue (Waterbury et al., 1983; Distel et al., Reference Distel, DeLong and Waterbury1991, Reference Distel, Goodell, Nicholas and Schultz2003). Because of the high lignocellulose content and low N content of wood, it has been proposed that shipworms are reliant upon gill-hosted endosymbionts to both produce cellulase enzymes for cellulose digestion and to supplement dietary N through N2-fixation. While reliance upon shipworm endosymbionts for cellulase enzymes has not been experimentally tested, experiments have demonstrated that shipworms obtain N from the endosymbionts. The symbionts fix N in situ, and newly fixed N is transported to non-symbiont-containing host tissue (Lechene et al., 2006, 2007).
Gill bacteriocytes are a curious locale for N2-fixation. Unlike other plant or animal-hosted N2-fixing systems such as the termite (Brune & Friedrich, Reference Brune and Friedrich2000; Ohkuma, Reference Ohkuma2001) or legume-Rhizobium symbioses (Dixon & Kahn, Reference Dixon and Kahn2004), shipworm symbionts are not maintained at high densities within a low oxygen compartment (Waterbury et al., 1983; Distel et al., 2003). Without an obvious oxygen-retardant barrier in symbiont-containing tissue, N2-fixation by symbionts is likely to be inhibited by oxygen, because oxygen is known to deactivate the conserved nitrogenase enzyme in many species (Hill, Reference Hill1988; Dixon & Kahn, Reference Dixon and Kahn2004). As a result, most bacterial N2-fixers are only capable of fixing N under anaerobic or microaerobic conditions (Marchal & Vanderleyden, Reference Marchal and Vanderleyden2000). Many diazotrophs are not anaerobes and either rely on oxygen for respiration or create oxygen in the process of photosynthesis. In these cases, diazotrophs must balance the energy expenditure of oxygen removal with energy limitation due to limited ATP production; it has recently been discovered that energy expenditure related to oxygen toxicity is the largest energy sink in the oceanic diazotrophic cyanobacterium Crocosphaera watsonii (Großkopf & LaRoche, Reference Großkopf and LaRoche2012).
The mechanism of N transfer from symbionts to host, whether (1) through the host digestion of N-rich symbiont cells, (2) the excretion and translocation of a combined N compound from symbiont to host or (3) a combination of the two, remains unknown for the shipworm symbiosis, and poorly studied in other diazotrophic (N2-fixing) symbioses. Moreover, the form of N transferred from the diazotrophic symbiont to the host can have consequences for the host and symbiosis. For example, the translocation of symbiont-excreted dissolved inorganic nitrogen (DIN) may be more effective in complementing the high carbon (C):N ratio of the host diet than the translocation of dissolved organic nitrogen (DON) or the digestion of N-rich symbionts, both of which will contribute C as well as N to the host.
In the shipworm symbiosis, there is limited evidence that fixed N may be incorporated into essential amino acids in the bacteria, which are subsequently digested by the host (Trytek & Allen, Reference Trytek and Allen1980). This method of symbiont–host exchange is utilized in other nutrition-based bacteria–invertebrate symbiosis; for instance, the digestion of symbionts is an important route for nutrient exchange in the tubeworm Riftia pachyptila (Van Dover, Reference Van Dover2000) as well as in bivalves with methanotrophic symbionts (Streams et al., Reference Streams, Fisher and Fiala-Medioni1997). Still, the digestion of symbionts does little to relieve the C:N ratio mismatch between the shipworm diet of wood and the C:N ratio of shipworm tissue (Gallager et al., 1981).
Other organisms that harbour diazotrophic symbionts receive newly fixed N from symbionts via translocation of an N-rich compound from symbiont to host. The percentage of newly fixed N that is excreted from symbionts is usually very high, and the form of released nitrogenous products appears to be species-dependent and often difficult to characterize. For example, the symbiotic cyanobacterium Nostoc releases 90% or more of the fixed N as NH4+ to its angiosperm host Gunnera (Silvester et al., Reference Silvester, Parsons and Watt1996). Waters et al. (Reference Waters, Hughes II, Purcell, Gerhardt, Mawhinney and Emerich1998) demonstrated that alanine is actively excreted by diazotrophic soybean nodule bacteroids, and is probably the only N compound transported to the host soybean plant. Peters (Reference Peters, Hollaender, Burns, Day, Hardy, Helinski, Lamborg, Owens and Volentine1977) reports that in the symbiosis between the cyanobacterium Anabaena and the fern Azolla, at least 50% of the fixed N is released to the host and not incorporated into symbiont biomass. In oceanic Richelia–diatom diazotrophic symbioses, Foster et al. (Reference Foster, Kuypers, Vagner, Paerl, Musat and Zehr2011) showed that up to 97% of the nitrogen fixed by symbiotic Richelia is transferred to its diatom host, but the form of the N translocated from symbiont to host is still not known for this system.
In this study, we aimed to establish a novel and simple ex symbio model in axenic culture in order to explore the N physiology and potential N cycle of shipworm symbionts. To our knowledge, this is the first study to explore the dynamics of growth, N2-fixation, and respiration of shipworm symbionts and the potential pathways of N exchange between shipworms and their diazotrophic symbionts, which is a necessary first step towards a mechanistic understanding of the symbiosis. In this study, we examined growth in the soft agar batch cultures of a shipworm symbionts. We used the cosmopolitan Teredinibacter turnerae (γ-proteobacterium, strain T7902; Waterbury et al., Reference Waterbury, Calloway and Turner1983; Distel et al., Reference Distel, Morrill, MacLaren-Toussaint, Franks and Waterbury2002), a symbiont in at least 24 different shipworm species. Teredinibacter turnerae has previously been shown to fix N in pure culture (Waterbury et al., Reference Waterbury, Calloway and Turner1983; Greene & Freer, Reference Greene and Freer1986; Lechene et al., 2006, 2007). Studies to investigate the form of newly fixed N that is excreted from symbionts in other diazotrophic symbioses have mostly relied upon ex symbio methods (Meeks et al., Reference Meeks, Enderlin, Joseph, Chapman and Lollar1985; Silvester et al., Reference Silvester, Parsons and Watt1996; Waters et al., Reference Waters, Hughes II, Purcell, Gerhardt, Mawhinney and Emerich1998), probably because of difficulties in identifying the form of newly fixed N compounds in a host model. Through our experimental set-up, we aimed to investigate the timing and relationship between N2-fixation and growth in semi-solid medium, the ability of endosymbionts to use inorganic N versus N2-fixation for biosynthesis, the ability to release inorganic N, and we constructed an N budget to identify major N sources and sinks.
MATERIALS AND METHODS
Cultures
Teredinibacter turnerae (T7901, ATCC 39867, courtesy of D. Distel; Distel et al., 2002), isolated from the shipworm Lyrodus pedicellatus (Bivalvia, family Teredinidae), was maintained and grown in the semi-solid (0.2% agar) shipworm basal medium (SBM) of Waterbury et al. (Reference Waterbury, Calloway and Turner1983) with sucrose as a carbon source. The medium was modified to reduce its ammonium content by an equimolar substitution for the iron source: we used ferric iron citrate instead of ferric ammonium citrate. Cultures were grown on a bench-top at room temperature (19–20oC) without physical agitation. We monitored contamination with two methods. First, we struck experimental cultures on LB agar (no growth on LB agar; Distel et al., Reference Distel, Morrill, MacLaren-Toussaint, Franks and Waterbury2002) and SBM agar to actively detect growing contaminants. Second, we used epifluorescence microscopy with DAPI staining.
Experimental design
Teredinibacter turnerae cultures were grown at room temperature in a semi-solid medium in 28 ml Bellco anaerobic test tubes (Bellco glass 2048-18150) that were crimp-sealed with gas-tight rubber septa. Each tube contained 15 ml of SBM and 13 ml headspace. We set up four different headspace oxygen conditions, which spanned a range from 0.07 atmospheres O2 (33.3% O2 saturation) to normal atmospheric saturation (0.21 atmospheres, 100% O2 saturation). To vary the partial pressure of oxygen (pO2) in the vessel headspace, we used a gas proportioner (Cole Palmer EW-03218-50) to mix air and N2. The gas mixture was passed through a 0.45 µm sterile filter, then sparged into the headspace of the culture through a disposable 18 gauge needle. Cultures were sparged long enough to flush the headspace ten times. Direct measurements of dissolved pO2 in blank media indicate that this method maintains the medium at the appropriate oxygen concentration.
At regular intervals during growth (approximately every 4–6 d), we measured headspace pO2 (to assess oxygen depletion through aerobic respiration), N2-fixation rates with the acetylene reduction assay, and total protein content. Acetylene reduction assays and headspace pO2 measurements were conducted on the same subset of cultures (N = 4 for each pO2 treatment) during growth, and three cultures for each pO2 treatment were chosen at random and were sacrificed for total protein content. The headspace for all experimental cultures was sparged to the original headspace pO2 concentration every 4–6 d. We conducted this assay six times during culture growth.
OXYGEN MEASUREMENTS
We determined oxygen consumption rates by measuring the depletion of oxygen following the initial poising of the cultures at their experimental pO2 levels. First, 2 ml of headspace gas (out of 13 ml headspace) was removed from the culture tube with an 18 gauge needle and equilibrated with 6 ml of water in a gas-tight syringe. Then, we measured pO2 of the liquid phase with a StrathKelvin oxygen meter. We had to correct for residual pO2 in the gas-liquid equilibration, and convert the concentration measured in solution to the original pO2 in the gas phase of the equilibrium. For this, we used a standard regression with gas samples of known pO2 concentration ranging from 0 to 0.21 atm. Immediately following the sampling of the headspace for oxygen concentration and before measuring the N2-fixation and respiration rate, cultures were sparged with a gas mixture to restore the original pO2 condition (within 15 min of headspace O2 removal). We estimated the concentration of oxygen in the liquid phase using solubility constants appropriate for our culture conditions (solubility of O2 per volume of seawater, Co* = 374.94 µmol O2 l−1 seawater atm−1; Garcia & Gordon, Reference Garcia and Gordon1992). The headspace pO2 (range 0.07–0.21 atm) in negative controls with sterile medium did not change following the initial poising of the headspace gas concentration.
We were able to measure the dissolved oxygen concentration in the pO2-controlled cultures in late stage (post-exponential phase) cultures grown in the soft agar medium. We used a Clark oxygen microelectrode mounted on a micromanipulator arm, which is capable of measuring O2 concentration with a resolution of 100 µm. We measured the oxygen concentration for three replicate cultures and three blank medium samples for each pO2 treatment.
ACETYLENE REDUCTION ASSAYS
Nitrogen fixation activity was measured with the acetylene reduction assay (Capone & Montoya, Reference Capone and Montoya2001), and incubations were carried out in the Bellco anaerobic test tubes. In brief, 3 ml acetylene was added to each tube, and assay incubations were carried out under standard growth conditions as noted above. The headspace ethylene concentration was measured in duplicate at hourly intervals for approximately 3–4 h by gas chromatography (SRI model 8610c gas chromatograph, SRI Instruments, Torrance, CA USA). The gas chromatograph was fitted with a 2 m Haysep A column (Alltech Associates Inc., Deerfield, IL, USA) and a flame ionization detector (SRI Instruments). We used a 4:1 C2H2:N2 molar reduction ratio to convert from acetylene reduction to N2-fixation rates (Capone & Montoya, Reference Capone and Montoya2001; Holl & Montoya, Reference Holl and Montoya2008). We used trapezoidal integration to obtain total N fixed by each culture during growth. For the random cultures used in the acetylene reduction assay, we sparged the headspace to the original pO2 condition immediately following the assay to remove acetylene and ethylene. Negative controls with sterile medium did not show evidence of ethylene production.
TOTAL PROTEIN
At the same intervals used for measurements of O2 consumption and N2-fixation, we measured total protein in T. turnerae cultures with the Bradford assay in sacrificed cultures (Bradford, Reference Bradford1976; Coomassie Plus – The Better Bradford Assay Kit, VWR PI23236). Previous studies with T. turnerae have also used protein measurements to quantify culture growth (Greene & Freer, Reference Greene and Freer1986). To harvest the cells from the semi-solid medium, we pipetted the cell layer from the culture tube. This cell layer slurry was homogenized using ethanol-washed glass beads, vigorous shaking, and vortexing. We added 50 ml of homogenized cells to 1.5 ml Coommassie blue, then measured the absorbance at 595 nm (Spectronic 20 Genesys spectrophotometer). Absorbance values of blank medium were subtracted from samples. Total protein values were calculated from a standard curve of bovine serum albumin. We calculated growth rates using the change in total protein during growth.
Calculations for N in biomass
Sterner & Elser (Reference Sterner and Elser2002) determined that the average content of N in proteins is about 17%. Using this percentage, we converted total protein from the Bradford assay into N-protein with a conversion factor of 5.88 (total protein:N-protein ratio). Since the Bradford assay measured total protein in the medium, this protein-to-N-protein conversion incorporates N from any secreted proteins from T. turnerae (Beshay, Reference Beshay2003; Greene et al., Reference Greene, Cotta and Griffin1989; Griffin et al., Reference Griffin, Greene and Cotta1992). The variation in the percentage of N mass in proteins has been determined to be very small, around ±1% (Loladze & Elser, Reference Loladze and Elser2011), so we consider variation in the conversion factor to be negligible for our calculations.
We estimated the N in non-protein cellular components by scaling the measured protein content by 9:11, which is the average ratio of non-proteinaceous material (45%) to proteinaceous (55%) cellular material in an Escherichia coli B/r cell (Neidhardt & Umbarger, Reference Neidhardt, Umbarger and Neidhardt1996). The biggest cellular non-proteinaceous sinks for new N are N-rich RNA, lipids, and metabolites (Neidhardt & Umbarger, Reference Neidhardt, Umbarger and Neidhardt1996), none of which were measured directly in this study.
Dissolved inorganic nutrient analysis
Concentrations of dissolved inorganic nitrogen (NH4+ and NO3− + NO2−) were determined by flow-injection analysis (Lachat QuikChem 8000; Strickland & Parsons, Reference Strickland and Parsons1972). Whole semi-solid medium was unsuitable for nutrient analysis with flow-injection analysis because of its high viscosity, so we equilibrated an agar sample with Milli-Q® water, then measured the nutrient content of the supernatant water. Sequential equilibration of standards with Milli-Q® water allowed us to determine the partitioning coefficient for nutrients in the medium–water system. We measured the nutrient concentration for three replicate cultures at each time point.
Rates of inorganic nutrient uptake and regeneration
Net rates of nutrient uptake and regeneration were calculated using a linear regression analysis of the medium nutrient concentration over time. Periods of decreasing medium nutrient concentration were interpreted as nutrient uptake and periods of increasing medium nutrient concentration over time were interpreted as nutrient regeneration (release).
RESULTS
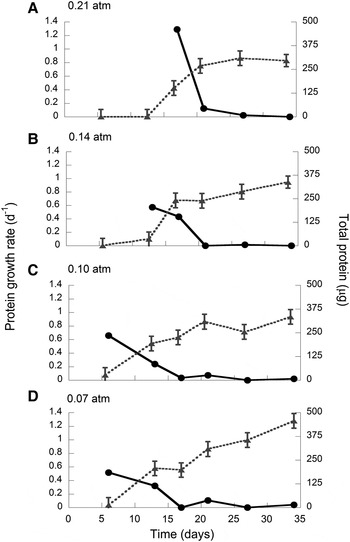
We were able to observe culture growth and measure N2-fixation when Teredinibacter turnerae was incubated with headspace oxygen concentrations ranging from 0.07 to 0.21 atm (Figure 1). All cultures grew as a thin band of cells (<1 mm thick) below the air–agar interface. In the 0.21 atm treatment, the growth curves were similar in duration to those obtained by Greene & Freer (Reference Greene and Freer1986).
Protein growth rate (dark circles and solid line) and total protein (grey triangles and dotted line; mean ±SE) for different headspace pO2 treatments.

Growth, N2-fixation and respiration
The growth time required to reach the maximum protein growth rate after inoculation was influenced by the headspace pO2. Cultures grown under 0.07 atm and 0.10 atm headspace pO2 conditions reached maximum protein growth rate at day 6, 0.14 atm cultures at day 13 and 0.21 atm cultures reached maximum protein growth rate at day 17. Cultures under the highest headspace pO2, 0.21 atm, had a maximum protein growth rate that was double that of the lower headspace pO2 treatments (ANOVA; Figure 1; 0.07 atm, µ = 0.517 ±0.023 d−1; 0.10 atm, µ = 0.517 ± 0.023 d−1; 0.14 atm, µ = 0.574 ±0.023 d−1; 0.21 atm µ = 1.289 ±0.023 d−1; data are mean ±1 standard deviation)
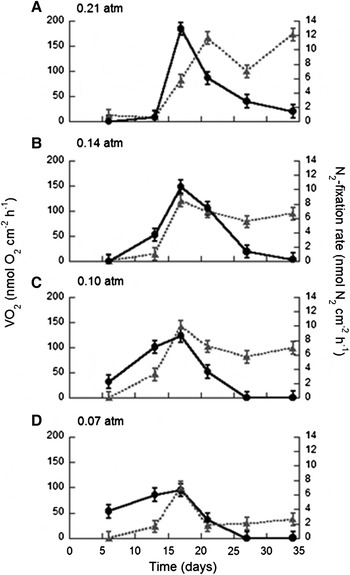
All pO2 treatments showed similar trends in absolute N2-fixation rate during growth; N2-fixation increased for the first 17 d, reached a maximum at day 17, and declined steadily after day 17 (Figure 2, solid lines). During the first two weeks of growth, N2-fixation rates in the 0.21 atm and 0.14 atm pO2 treatments (0.21 atm, Figure 2A; 0.14 atm, Figure 2B) were much lower than N2-fixation rates in the 0.10 atm and 0.07 atm pO2 treatments (0.10 atm, Figure 2C; 0.07 atm, Figure 2D). N2-fixation in the 0.10 atm and 0.07 atm pO2 cultures (Figure 2C, D) ceased earlier than N2-fixation in the 0.21 atm and 0.14 atm pO2 cultures (Figure 2A, B). Respiration rates in all pO2 treatments followed a similar trend of increase early during growth as the N2-fixation rate curves (Figure 2, dotted lines). VO2 and N2-fixation did not covary later during growth (days 27–34); in all pO2 treatments within this interval, there was a steady decrease in N2-fixation while VO2 remained steady (Figure 2B, C, D) or increased (Figure 2A).
Respiration rate (grey triangles and dotted lines) and N2-fixation rate (black solid circles and solid lines) in Teredinibacter turnerae cultures during growth. VO2 and N2-fixation covaried until approximately day 21 for all pO2 treatments, and do not covary late during growth.

We compared the total N2 fixed among all four pO2 treatments. Like protein, fixed N accumulated more rapidly after inoculation in the 0.10 atm and 0.07 atm pO2 treatments than in the 0.21 atm and 0.14 atm pO2 treatments (ANOVA with Tukey's post hoc comparison test, P < 0.0005).
BIOMASS-SPECIFIC RATES
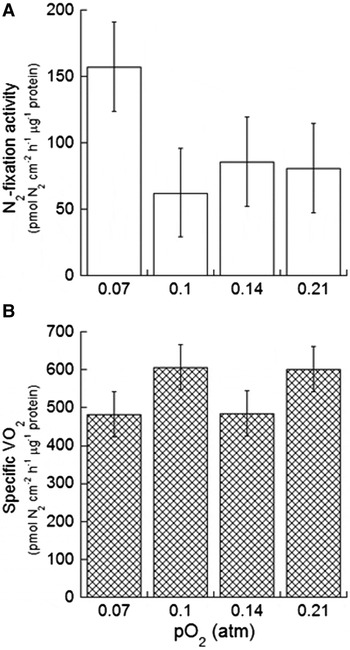
The differences in timing of maximum protein growth rate and N2-fixation rates among pO2 treatments complicated the comparative analysis of biomass-specific N2-fixation and respiration among pO2 treatments over the duration of the experiment. A comparison of maximal values of physiological measurements among pO2 treatments reduced the influence of the differences in timing of growth so that we could directly compare the effects of headspace oxygen upon the physiology of T. turnerae. Maximum biomass-specific rates (rates divided by protein biomass) of N2-fixation and respiration were not significantly affected by headspace pO2 (Figure 3; N2-fixation activity: one-way ANOVA with Tukey's post hoc pairwise comparison, P = 0.253; VO2 activity: one-way ANOVA with Tukey's post hoc pairwise comparison, P = 0.292). Maximum N2-fixation activity coincided with the maximum growth rate in all pO2 treatments (0.07 and 0.10 atm: day 6; 0.14 atm: day 13; 0.21 atm: day 17).
Headspace pO2 did not affect the maximum biomass-specific N2-fixation nor VO2 rates. Data are mean ±1 SE, N = 4.

MEASUREMENT OF OXYGEN IN THE MEDIUM
We measured the oxygen concentration profile through the semi-solid medium, from the air–agar interface to a depth of 4 cm below the band of cells, for cultures that were 15 d old. The dissolved oxygen concentration for all culture replicates (N = 3 for each pO2 treatment) was below the limits of detection.
Inorganic N cycling in the culture
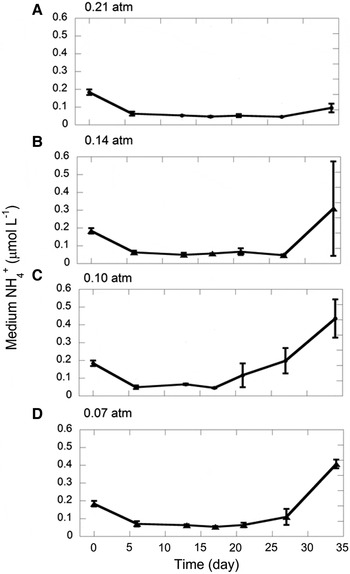
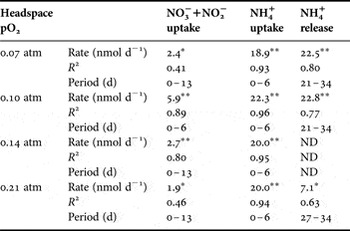
Patterns of medium [NH4+] during growth were similar among pO2 treatments. All pO2 treatments had a high rate of NH4+ uptake during early growth when N2-fixation was low and NH4+ was reduced to less than 0.04 μmol l−1 within the first 6 d (Figure 4). Low NH4+ levels persisted during periods of elevated N2-fixation, and a reappearance of NH4+ occurred late during growth when N2-fixation had declined (Figure 4). There was a significant accumulation of NH4+ in the medium for all treatments except the 0.14 atm treatment (Table 1).
Medium NH4+ concentration (mean ±1 SD, N = 3) during growth of Teredinibacter turnerae. Teredinibacter turnerae is capable of NH4+ uptake, and NH4+ accumulates in the medium late during growth.

Nutrient cycling rates in Teredinibacter turnerae headspace pO2-controlled batch cultures. Measurements were calculated from a linear regression approach of nutrient concentration in the medium during growth. P values for the rate of depletion or accumulation are indicated by an asterisk following the rate; *, P < 0.05; **, P < 0.005; R 2, the linear regression R 2 value of nutrient depletion or accumulation in the medium. Period (d) indicates the time period over which significant nutrient depletion or accumulation occurred. ND, no data; there was no significant nutrient depletion or accumulation.

The shipworm basal medium contained a small amount of NO3− + NO2− (1.22 μmol l−1); because we did not add NO3− + NO2−to the medium and the Milli-Q did not contain NO3− + NO2−, we believe this was a contaminant in the reagents. In all pO2 treatments, Teredinibacter turnerae consumed NO3− + NO2− (Table 1), but in contrast to NH4+, we did not observe any net accumulation of NO3− + NO2− later in the experiment.
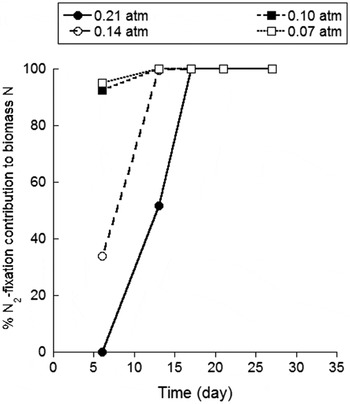
Assuming that there are only two sources of N available for N-biomass, either DIN or N2-fixation, we calculated the relative importance of DIN to N2-fixation for N-biomass. These data can be compared to the N2-fixation rate in Figure 2. During early growth (day 6), N2-fixation contributed a higher percentage of N to N-biomass in low pO2 treatments (0.07 atm and 0.10 atm) than in high pO2 treatments (0.14 atm and 0.21 atm; Figure 5). The 0.21 atm treatment continued to use DIN to support production of N-biomass until day 17, when N2-fixation dominated.
The dependence of N2-fixation and DIN uptake for N biomass. Cultures grown under low pO2 conditions (0.07 and 0.10 atm) derive almost all of N-biomass from N2-fixation for all days measured. Cultures grown under high pO2 conditions (0.14 and 0.21 atm) are dependent upon medium NH4+ for biomass early during growth (before total protein is measurable), but use only N2-fixation later during growth.

We compared the net accumulation of NH4+ in T. turnerae cultures to the amount of N fixed by the culture during growth. NH4+ released into the medium represented a very small percentage of the total N fixed for all pO2 treatments (0.07 atm: 2.52% ±0.51; 0.10 atm: 2.48% ±0.41; 0.21 atm: 0.30% ±0.10; measurements are mean ±95% confidence interval, based on error propagation).
DISCUSSION
Absence of N2-fixation in stationary phase
After day 17, absolute N2-fixation and VO2 did not co-vary; we observed a decrease in N2-fixation rate without a similar drop in respiration rate. Furthermore, specific VO2 did not covary with specific N2-fixation rate, and cultures in the lower pO2 treatments continued to respire after N2-fixation ceased. Collectively, these results suggest that Teredinibacter turnerae did not depend on active N2-fixation to remain viable and physiologically active during stationary phase (indicated by constant protein content). N requirements during stationary phase may be reduced in comparison to exponential phase because of a decreased need for RNA, the second largest sink for N in bacteria (contains 20.5% of total cellular N; Neidhardt, 1996). Other possible sources of N that T. turnerae could utilize for active growth in this period include remineralized cellular biomass (via cell mortality) and uptake of excreted dissolved inorganic or organic N. In fact, we measured an increase in ammonium in the medium late during growth for the 0.07 atm and 0.10 atm pO2 treatments (Figure 4).
Evidence for the development of microaerobic medium conditions
In these batch culture conditions, the co-occurrence of elevated growth rate and maximum specific N2-fixation activity within each pO2 treatment reflects the reliance of T. turnerae upon N2-fixation to support growth in all pO2 treatments. We found that cultures with the highest absolute growth rates did not have significantly higher specific N2-fixation activity: the 0.21 atm treatment had a maximum growth rate double that of the other treatments, but the maximum specific N2-fixation rate and specific respiration rate were not similarly elevated. This implies that the cells have similar physiological rates among the headspace pO2 treatments. Further, the results suggest that the cells in all pO2 treatments experience similar microaerobic conditions in the medium.
The capability of T. turnerae to sustain high N2-fixation under a wide range of headspace oxygen conditions, including under normal atmospheric saturation, contrasts with observations of Waterbury et al. (Reference Waterbury, Calloway and Turner1983) and Greene & Freer (Reference Greene and Freer1986), who found that N2-fixation did not occur under oxygenated conditions in gently shaken broth medium, although they did not report the specific oxygen tolerance of T. turnerae. This difference likely reflects the unique cultivation and assay methods used in this study. Specifically, we maintained cultures in a semi-solid medium (0.2% agar) in air-tight vessels under controlled headspace oxygen conditions. This design established conditions where the dissolved oxygen concentration in the medium reflected both the concentration in the headspace and the impact of respiration by T. turnerae. Our direct microelectrode measurements showed that late-stage cultures had no measurable oxygen anywhere in the medium; this suggests that respiration created a steep oxygen gradient at the air–agar interface and microaerobic and/or anoxic conditions in the non-mixed soft agar medium, which in turn allowed N2-fixation to be sustained.
The phasing of growth in our cultures, specifically the timing of maximal growth rates, is also consistent with the hypothesis that respiration created the microaerobic conditions necessary for N2-fixation. Cultures incubated under higher headspace pO2 took a longer time to accumulate total protein and demonstrate measurable N2-fixation and respiration than cultures grown under lower headspace pO2. This reflects the greater initial pO2 burden dissolved within the agar, and the greater time required to consume it. We calculated integrated respiration for the interval when N2-fixation first appeared after inoculation to determine if the time required to establish micro-oxic conditions (favourable for N2-fixation) is correlated with pO2 treatment. The highest pO2 treatments had higher integrated respiration values than lower pO2 treatments (0.21 atm: 35.0 µmol O2, 0.14 atm: 43.4 µmol O2, 0.10 atm: 19.0 µmol O2, 0.07 atm: 11.0 µmol O2), which indicates that higher pO2 treatments respired more dissolved oxygen before N2-fixation commenced for the first time. Studies of the development of O2 gradients (timing, steepness, and magnitude) among the pO2 treatments remain for future work.
The presence of an O2-gradient in the agar, variation in the time course of growth with pO2, and the time required for creation of microaerobic to anoxic conditions in the medium all indicate that T. turnerae is sensitive to oxygen during growth. The enigma remains that the nitrogenase enzyme of shipworm symbionts is capable of fixing N while symbionts are not held within an apparent and separate O2-tight compartment within the gills. We suggest that respiration by both host gill tissue and shipworm symbionts may create zones of micro-oxia, where free O2 is low enough for normal nitrogenase activity.
Medium NH4+
Teredinibacter turnerae is capable of using DIN as a source of N for biosynthesis. Late during growth, NH4+ accumulates in the medium, which may represent excretion of NH4+ during the late growth stage. We were not able to completely rule out that the increase in medium NH4+ can be attributed to cell mortality and lysis. However, because T. turnerae has the ability to take up DIN, we are also unable to rule out the possibility that NH4+ is continually excreted and taken up during growth, and the NH4+ accumulation occurs as a result of decreased NH4+ uptake by older cultures. Further studies are required to clarify whether newly fixed N is actively excreted as NH4+.
If NH4+ that accumulated in the medium does represent actively excreted DIN, the results of this assay clearly place T. turnerae at the lowest end of N release by well-studied symbiotic microbes. In comparison, the symbiotic cyanobacterium Nostoc releases 90% or more of the fixed N as NH4+ to its angiosperm host Gunnera (Silvester et al., Reference Silvester, Parsons and Watt1996). Peters (Reference Peters, Hollaender, Burns, Day, Hardy, Helinski, Lamborg, Owens and Volentine1977) reports that in the cyanobacterium Anabaena–fern Azolla symbiosis, at least 50% of the fixed N is not incorporated into the symbiont Anabaena but is released to the host. Teredinibacter turnerae may be more similar to free-living microbes with respect to the amount of N release that was measured in this study. Free-living Azotobacter vinelandii releases approximately 5% of total N fixed (Kuhla et al., Reference Kuhla, Dingler and Oelze1985).
The source of N for new biomass
Cultures grown under low pO2 conditions (0.07 and 0.10 atm) derive almost all of biomass-N from N2-fixation for all days measured (Figure 5). Cultures grown under high pO2 conditions (0.14 and 0.21 atm) are dependent upon medium NH4+ for biomass early during growth, but use only N2-fixation later during growth (Figure 5). The difference in timing of the contribution of N2-fixation to biomass-N reflects the differences in timing of growth among the pO2 treatments.
Culture N budget
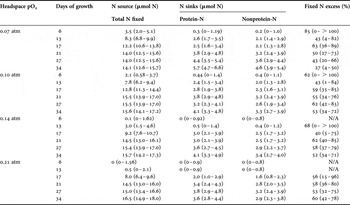
To summarize the experiment, we constructed an N budget for all measured sources and sinks in each pO2 treatment for all six time points during the experiment (Table 2; values are mean and 95% confidence intervals). We considered N2-fixation as the main source of N to T. turnerae, because the contribution of DIN uptake to biomass was at most 1% of N from N2-fixation in all pO2 treatments during periods of growth. Similarly, we did not include potential DIN release as an N sink in our budget, because it accounted for a very small percentage of total N fixed (0.3–2.5%). To determine the error in the source and sink terms, we used an error propagation approach for all measurements (integrated N fixed during growth, protein-N, and non-protein N). The difference between the major N source (N2-fixation) and sum of the major N sinks (N in cellular protein and N cellular non-protein) is represented as ‘fixed N excess,’ and it is expressed as a percentage of the total N fixed by the culture (Table 2).
Major sources and sinks of N in Teredinibacter turnerae, based on error analysis. The excess fixed N is the difference between the mean sum of N sources and the mean sum of N sinks. Values are mean and 95% confidence interval (in parentheses), and were calculated using an error propagation approach. Total N fixed is an integrated N2-fixation rate. N/A, not applicable (no significant fixed N or protein).

Our calculations indicate that there is a clear excess of fixed N in all pO2 treatments on all days (mean: 43–68% of newly fixed N), excluding data from days with insignificant N2-fixation and very little protein in cultures. Because headspace pO2 does not appear to make a difference in the percentage of fixed N excess (Table 2) and all cultures experienced similar dissolved O2 conditions, we do not believe that dissolved O2 was a factor that contributed to the N budget. We consider two additional sinks for new N that were not measured in this study, which may help close the N budget: exopolymeric substances and DON excretion.
Newly fixed N may also have been incorporated into the non-proteinaceous part of the biofilm matrix, termed exopolymeric substances (EPS). Since N in EPS is not accounted for in the cellular N in non-protein calculation of our N budget, it was not measured in this study. Several studies reported the presence of biofilms in T. turnerae cultures (Ferreira et al., Reference Ferreira, Ahuja, Sierks and Moreira2001; Distel et al., Reference Distel, Morrill, MacLaren-Toussaint, Franks and Waterbury2002; Trindade-Silva et al., Reference Trindade-Silva, Machado-Forrera, Senra, Vizzoni, Ypanaguine, Leoncini and Soares2009). However, we believe that EPS is probably a very small sink of newly fixed N, because the N content of the bacterial EPS is usually quite low; Delatolla et al. (Reference Delatolla, Berk and Tufenkji2008) estimated the N content of EPS to be approximately 2.0–2.2% of the cellular dry weight.
Bacteria often act as remineralizers of DIN, but some are capable of excreting DON, such as Azotobacter vinelandii (Kuhla et al., Reference Kuhla, Dingler and Oelze1985) and N2-fixing symbionts of soybeans (Waters et al., Reference Waters, Hughes II, Purcell, Gerhardt, Mawhinney and Emerich1998). Several studies suggest that a significant fraction of new N (37–90%) is excreted as DON in the cyanobacterium Trichodesmium (Capone, Reference Capone1994; Glibert & Bronk, Reference Glibert and Bronk1994; Mulholland & Capone, Reference Mulholland and Capone1999; Mulholland & Bernhardt, Reference Mulholland and Bernhardt2005). Given the potentially trivial amount of NH4+release and the potential for a significant DON pool based on our N budget, we suggest that future studies using this model quantify and characterize potential DON release from Teredinibacter turnerae.
CONCLUSIONS
To our knowledge, this is the first investigation of the relationships among growth rate, N2-fixation, respiration, and inorganic N cycling in a cultivated N2-fixing endosymbiont of shipworms, and is among the few studies of an N budget for any diazotroph. The cultures grew in headspace pO2 conditions 0.07–0.21 atm, and appeared to grow over a period of approximately 30 d. Cultures demonstrated maximum respiration and N2-fixation around 13–17 d after inoculation. Accumulation of biomass in the cultures was dependent upon N2-fixation and the establishment of microaerobic conditions within the medium. In our system, the apparent absence of O2-inhibition of N2-fixation activity likely reflects the physical structure of the medium and the formation of microaerobic conditions in the culture environment through respiration, rather than insensitivity of the nitrogenase enzyme to oxygen. Our results indicate that T. turnerae can take up combined N, but primarily uses newly fixed N for biosynthesis and growth, because cultures did not show substantial growth until N2-fixation commenced. The media accumulated a small quantity of newly fixed N as NH4+, which may have been excreted by the cells. In addition, our data imply that a significant portion of fixed N must accumulate in N sinks that were not measured directly in this study, such as extracellular biofilm and DON.
ACKNOWLEDGEMENTS
We would like to thank D. Distel, T. DiChristina, S. Joye, J. Kubanek for their thoughts and discussions about this research, D. Garton for assistance with statistical methods, and S. Weber and L. Tsai for their assistance in the laboratory.
FINANCIAL SUPPORT
This research was supported by grant NSF-OCE-0425610, and R.H. received partial salary support from grant NSF-ETBC-0934025.