1. Introduction
The workplace is one of the most common places for people to meet a potential marital partner. In the United States, nearly 22% of married people met their spouses at work [Rosenfeld and Thomas (Reference Rosenfeld and Thomas2012)]. As female labor force participation rates have increased [Goldin (Reference Goldin2006)], and women have increasingly pursued careers in traditionally male occupations [Fry and Stepler (Reference Fry and Stepler2017)], the opportunities for workplace interactions between women and men have been increasing. This paper examines how marriage decisions are influenced by the gender makeup of the workplace.
From a theoretical perspective, it is unclear how an increase in the share of workers of the opposite gender in the workplace will impact the likelihood of heterosexual marriage.Footnote 1 Marital search theory predicts that more opportunities to interact with members of the opposite sex yield an increased likelihood of marriage [Becker et al. (Reference Becker, Landes and Michael1977), Becker (Reference Becker1981), Oppenheimer (Reference Oppenheimer1997), Burdett and Coles (Reference Burdett and Coles1999), Shimer and Smith (Reference Shimer and Smith2000), Smith (Reference Smith2006)]. However, overload choice theory [e.g., Iyengar and Lepper (Reference Iyengar and Lepper2000), Schwartz (Reference Schwartz2004)] suggests that more options could actually produce the opposite outcome as people may choose to defer or delay marriage, believing they can find a better match in the future.
Empirically, a substantial number of studies has considered how marriage rates are affected by an unequal gender composition using variation either across geography or across different demographic groups, where geographical changes can be at the nation level [Cox (Reference Cox1940), South and Lloyd (Reference South and Lloyd1992)] or local level [Fossett and Kiecolt (Reference Fossett and Kiecolt1990, Reference Fossett and Kiecolt1993)], and where differences across demographic groups are across immigrant groups [Angrist (Reference Angrist2002), Lafortune (Reference Lafortune2013)] or college majors [Pestel (Reference Pestel2021)].Footnote 2
To my knowledge, only one other paper examines the effect of imbalanced sex ratios in the workplace on the likelihood of partnership. Using data from Denmark, Svarer (Reference Svarer2007) concludes that workplace gender composition does not affect the overall rates of partnership formation.Footnote 3 However, he also finds that among those married, the larger the share of coworkers of the opposite gender, the higher the likelihood that they are partnered with a coworker suggesting that people do search for partners in the workplace. Both of these results may be difficult to interpret causally because people may choose where to work based on their marriage intentions, or alternatively, based on third factors that happen to be correlated with marriage intentions. For example, women who work in male-dominated firms might have more career ambition or economic independence, while those who want to build families may choose jobs with more flexibility and family-friendly policies.
In a related paper, McKinnish (Reference McKinnish2007) examines how opportunities to encounter potential new spouses at work affects the likelihood of divorce among already married workers. She addresses the endogeneity concerns discussed above by focusing, not on sex ratios within a particular workplace, but instead on sex ratios within occupation-industry cells. While her measure does not accurately quantify the number of potential spouses in particular establishments, it suffers less from reverse causality and omitted variable bias to the extent that it is easier to change workplaces, in response to marriage-related preferences than it is to change occupation and industry. In order to estimate causal impact, she estimates models with industry fixed effects and occupation fixed effects thereby exploiting variation in sex ratios (in occupation-industry cells) among people working in the same occupation but across different industries. While concerns about endogeneity bias are mitigated in McKinnish's identification strategy relative to simply focusing on sex-ratios within the same establishment, there are still reasons to be concerned if, for example, among workers in the same occupation, preferences regarding industry of employment are systematically correlated with preferences related to divorce. For instance, if females working as engineers in the finance industry (an industry with relatively few females) have stronger divorce preferences than female engineers working in the fashion industry (an industry with more females), for reasons unrelated to workplace composition, then the estimates using McKinnish's identification strategy will be biased.
This study makes several contributions to McKinnish's analysis. First, like Svarer (Reference Svarer2007), I consider union formation, specifically, marriage – instead of divorce. Second, and perhaps more importantly, instead of exploiting variation across industries within the same occupation in gender composition in a given year, I exploit variation in gender composition within occupation-industry cells over time. This setting enables me to identify whether an increase in the share of female employees in an occupation-industry cell affects the likelihood of marriage. In other words, it compares marriage probabilities for a male engineer working in the finance industry in 1980 to another male engineer who working in the same industry in the 2000, given the change in the number of female engineers employed in finance over that period. This identification strategy allows marriage-related preferences to influence one's occupation and industry choices, but exploits variation over time in gender composition of occupation-industry cells.
This paper uses data from the 5% public use samples of the 1980, 1990, and 2000 U.S Censuses, along with the 2006–2010 5-year American Community Survey (ACS) to determine the percentage female in each occupation-industry cell studied. The variation in this percentage over time within each occupation-industry is then used to examine the impact of changing gender composition on the probability of ever having been married for males and females separately.
The main finding of this paper is that gender composition in the workplace influences individuals' marital choices. The evidence suggests that an increase of one percentage point in the share of own-gender coworkers in a person's occupation-industry increases the probability of being married by 0.09 percentage points for women. For men, an increase of one percentage point in the share of female colleagues in the occupation-industry decreases the likelihood of marriage by 0.05 percentage points. These findings align with overload choice theory, suggesting that people who are exposed to more people of the opposite gender on the job may defer or forgo marriage, perhaps believing that better options may present themselves in the future.
This paper also relates to Pestel (Reference Pestel2021) in subject and research design. Pestel (Reference Pestel2021) finds that a higher share of own gender students in the field is associated with a higher probability of being married for male, but a lower probability of being married for female among German university graduates. In his settings, he uses university education as a marriage market for high-skilled individuals; when the own gender is scarce in the field, women often become pickier and want to have a partner with the same education level. At the same time, men are more willing to marry down with respect to their education level. In contrast, I show that in a more mixed-skilled environment, the higher share of own gender employees positively correlates with the likelihood of being married for both female and male.
The remainder of this paper is structured as follows. Section 2 reviews previous literature. Section 3 describes the data. Section 4 presents the identification strategy, and section 5 describes the baseline results and robustness checks. Section 6 discusses additional checks. A conclusion and some further discussions are presented in section 7.
2. Theoretical relationship between workplace gender composition and marriage
In Becker's marriage model (Reference Becker1981), people choose to marry if others can provide something they want or need (e.g., income, housework, reproduction, etc.). He argues that a change in the gender composition of a marriage market (as defined by age, geography, social status, etc.) affects marriage rates. For instance, when men start outnumbering women in a marriage market, the demand for wives increases, and this increases the odds that marriage-minded women will find a partner. Oppenheimer (Reference Oppenheimer1988) utilizes the ideas of job-search theory to analyze the “marriage matching process,” contending that a rational individual who searches for a spouse accepts a given proposal if the expected value of entering the marriage is greater than that of remaining single. In her framework, if women or men are scarce in a marriage market, it is more likely they will accept the proposal from a potential spouse with a quality at or above their reservation level as more options are available during the mate-selection process.
Marriage market participants may search for spouses on the job for several reasons. First, on-the-job search implies that an individual will not need to pay out of pocket costs of dating (either for the dates themselves or preparing for the dates by purchasing a new outfit). Second, the time costs of going on dates in order to get to know potential spouses is lower when dating a coworker. Third, because people are exposed to coworkers on the job, they may find an attractive potential partner even without actively searching for a spouse.
If it is true that many marriage market participants either actively or implicitly search for potential spouses at work due to lower search cost, then Oppenheimer's (Reference Oppenheimer1988) theory suggests that the more exposure participants have to opposite-sex coworkers, the higher the reservation value for partner's quality will be set. In such an environment, the search duration of marital matches for an individual is important. Individuals may find a potential spouse relatively easily and quickly, given large amounts of available proposals on the job. In contrast, individuals may become more selective about who they accept the proposal, as an increase in the arrival rate of proposals will also increase an individual's reservation level for partner's quality. Though the net effect on search duration is ambiguous, Van den Berg (Reference Van den Berg1994) shows that the first effect dominates for a large set of distributions of offers. In a related paper, Mansour and McKinnish (Reference Mansour and McKinnish2014) study whether preferences or lower search costs explain why there are so many same occupation couples. They find that lower search costs within occupations is the primary reason individuals marry within their occupations so often. Furthermore, Angrist (Reference Angrist2002) argues that when men outnumber women in a marriage market, women are able to attract higher quality men given their enhanced female bargaining power in the marriage market.
While marital search theory suggests that more opportunities to interact with members of the opposite gender increase the odds of marrying, recent literature on overload choice theory argues that as choices increase, people may have difficulty managing them [e.g., Iyengar and Lepper (Reference Iyengar and Lepper2000), Schwartz (Reference Schwartz2004)]. This theory considers the relationship between the number of alternatives and the actual choices people make, arguing that a surfeit of choices leads to a decrease in people's desires to make a decision. There are several reasons why an abundance of choice may lead to demotivation. Iyengar and Kamenica (Reference Iyengar and Kamenica2006) claim that variety of options make an exhaustive comparison of all options which could induce a fear of making a choice. Similarly, Todd et al. (Reference Todd, Fasolo and Mcclelland2007) suggest that more options are likely to make the process of making a choice more difficult. Further, Liu et al. (Reference Liu, Sela and Berger2008) argue it is difficult to justify the choice of any particular option because the most attractive options become more similar as the number of choices increases.
Based on this theory, increasing the pool of potential mates in the workplace could complicate the selection process, and accordingly will, lead people to avert or delay marriage. Consistent with this idea, Turkle (Reference Turkle2016) uses online dating data to study overload choice theory, finding that an abundance of potential partners available online reduces an individual's commitment to marriage. In addition, Thomas et al. (Reference Thomas, Binder and Matthes2022) find that dating app users in the high partner availability condition report more choice overload than those in the low or moderate partner availability condition.
3. Data
This analysis uses data drawn from a 5% sample of 1980, 1990, and 2000 U.S. Census data and from a 5-year sample of the 2006–2010 ACS, which were downloaded from the Integrated Public Used Microdata Series (IPUMS) [Ruggles et al. (Reference Ruggles, Flood, Goeken, Grover, Meyer, Pacas and Sobek2020)]. These are nationally representative surveys providing comprehensive information about U.S. population characteristics, including industry of employment and occupation, demographics, and other socioeconomic characteristics. This section describes the overall gender variation in the labor market and follows with a brief description of changes in marriage rates over the past three decades.
2.1 Gender composition in occupation-industry
Following McKinnish (Reference McKinnish2007), this paper measures gender composition in occupation-industry groups. In order to make occupation-industry combinations consistent and comparable across the selected analysis period, I use the IPUMS-provided consistent classification of occupations and industries based on the 1990 coding scheme. In cases where an occupation or industry is not available in all four data sets, I drop the combination from the analysis.Footnote 4 The analysis further restricts the sample to occupation-industry cells that have at least 50 employees and at least 5 male workers and 5 female workers with wages in the range of $2–$200/h. These restrictions are made because occupation-industry cells containing only a few individuals and higher wage variation are subject to more measurement error. Females included in the sample are aged 18–38 and males are aged 20–40, the age groups when marriages are most likely to occur.Footnote 5 Additionally, because I measure local marriage markets using information at the metropolitan statistical area (MSA) level, I drop individuals who either do not reside in an MSA or do not report it. Finally, the sample also excludes institutionalized, agricultural, and non-wage workers. In total, the sample consists of 178 industry categories and 249 occupation categories, generating a total of 1952 occupation-industry cells.
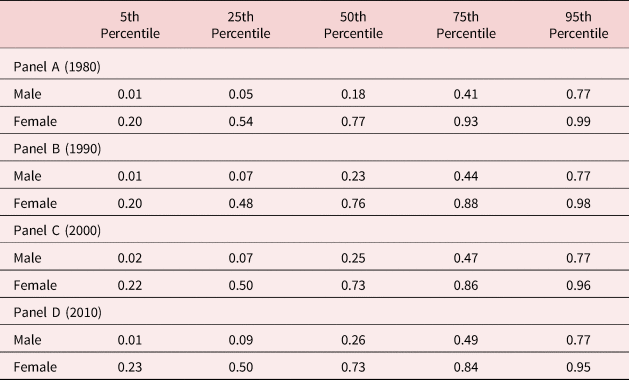
Table 1 shows the share of female workers within occupation-industries by year for the years between 1980 and 2010. As can be seen in the table, the percentage of female employees in occupation-industry cells in which the median male workers worked increased from 18% in 1980 to approximately 26% in 2010. In contrast, the percentage of female workers in occupation-industry cells in which the median female employees worked decreased from 77% in 1980 to 73% in 2010. However, this substantial variation is not uniformly distributed across all occupation-industries. As shown in Table 1, 5% of men worked in occupation-industries that were 1% female in 1980, and this figure was the same in 2010. This indicates that male-dominant workplaces have remained predominantly male and female-dominant workplaces have remained predominantly female, even after 30 years.
Distribution of share female in occupation-industry

Note: Table 1 presents the share of female employees in people's occupation-industry separately by gender and year. The sample consists of workers who are between the ages of 18 and 40, are non-institutionalized, are non-agricultural workers and who report occupation-industry and do not work as non-wage workers.
Source: 1980, 1990, and 2000 U.S. Census, and 2006–2010 ACS.
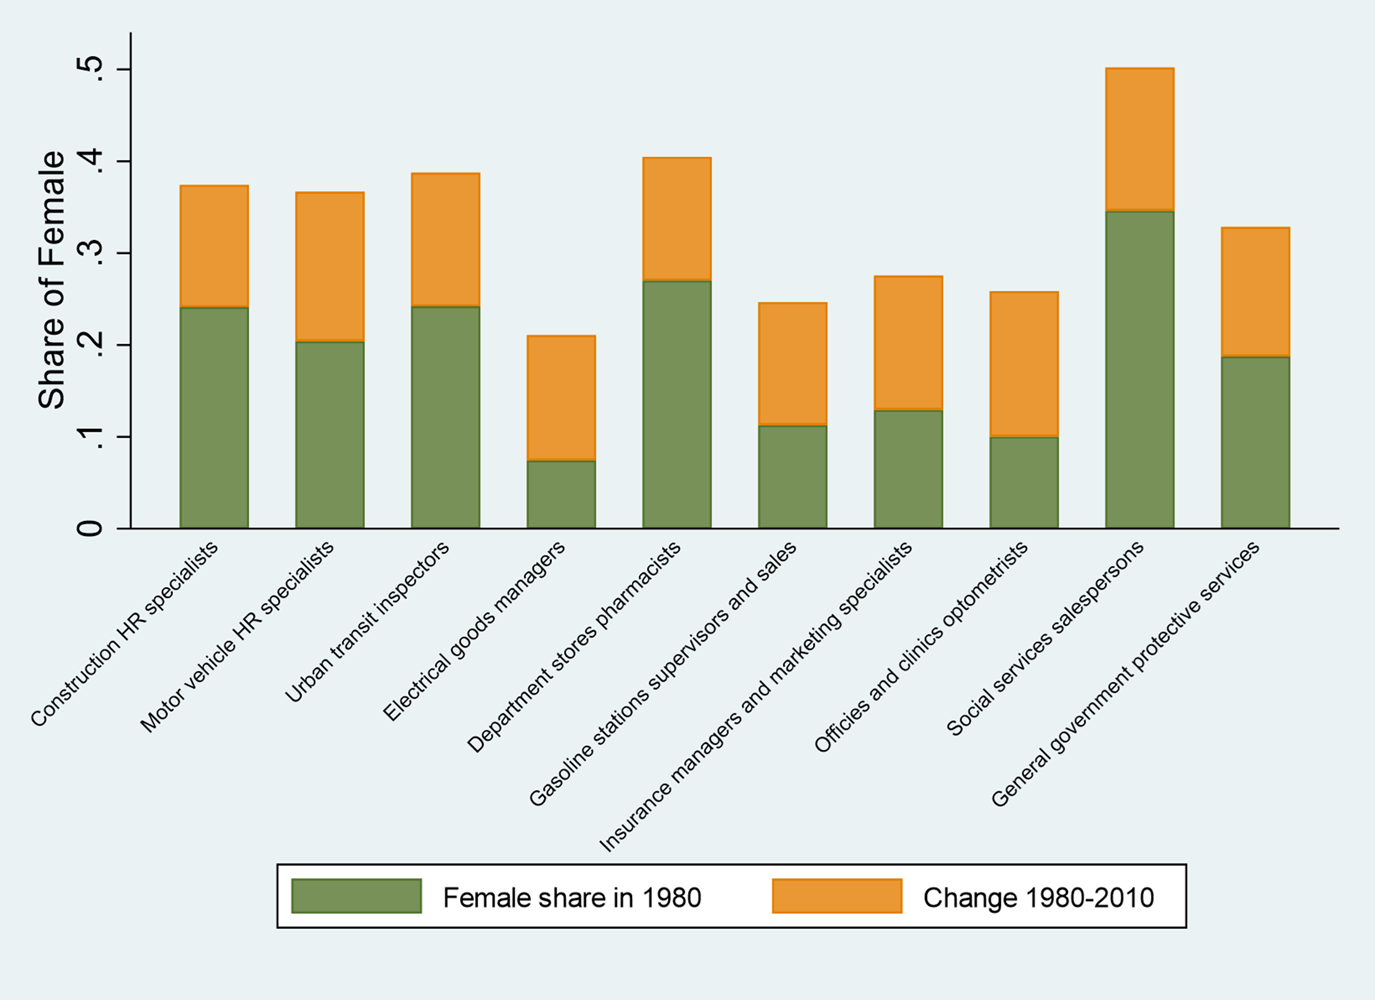
Figure 1 indicates the share of female employees in 1980 and average changes from 1980 to 2010 among the 10 occupation-industry groups that had the greatest increase in the share of female workers. As shown in Figure 1, the “personnel, HR, training, and labor relations specialist” occupation in the motor vehicles and motor vehicle equipment industry experienced the largest increase in female workers among those 10 occupation-industry groups. It increased an average of 17% points in the past three decades. In addition, salespersons in the social services sector have shifted from being predominantly male to almost evenly balanced.
Gender distribution in occupation-industry among the 10 occupation-industry groups that indicated the greatest increase in female workers.
Source: 1980, 1990, and 2000 U.S. Census, and 2006–2010 ACS, own calculations.
Notes: Figure 1 shows the share of females in 1980 and its average change from 1980 to 2010 among the 10 occupation-industry groups that indicated the greatest increase in female workers.

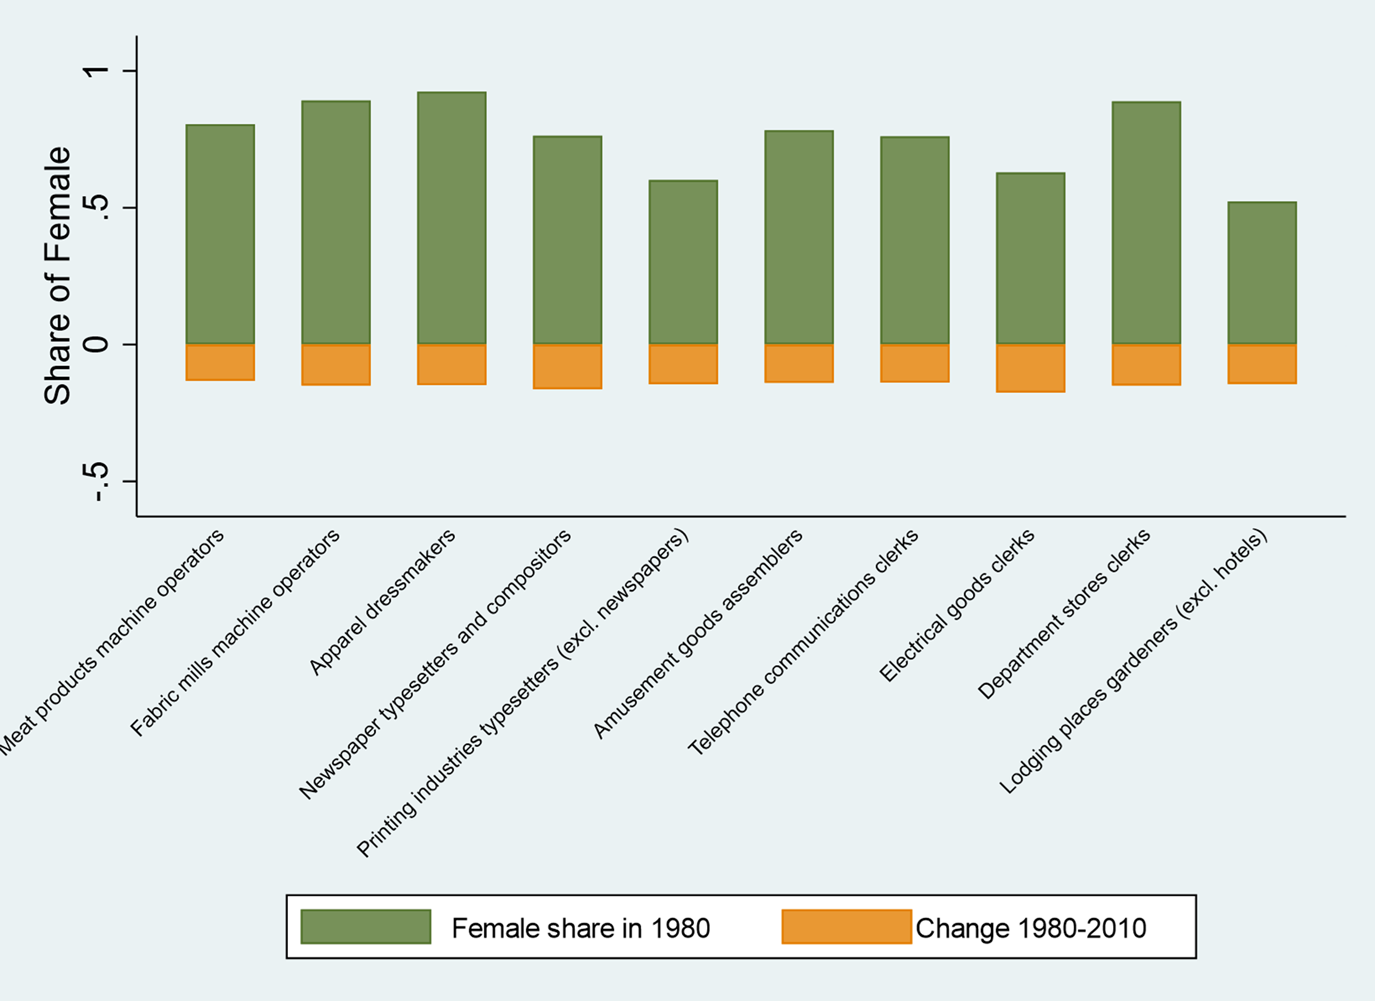
Figure 2 presents the same information but for the 10 occupation-industry groups with the greatest declines in the share of workers who are female. As shown in Figure 2, the “material recording, scheduling, production, planning, and expediting clerks” in the electrical goods sector moved from being predominantly female workers to having more male workers, though female workers are still the majority. Others, such as newspaper-publishing-industry's typesetters, apparel-industry's dressmakers, and textile-sewing-machine operators from the fabric mill industry remain predominantly female, though the share of female employees decreased dramatically.
Gender distribution in occupation-industry among the 10 occupation-industry groups that indicated the greatest decline in female workers.
Source: 1980, 1990, and 2000 U.S. Census and 2006–2010 ACS.
Notes: Figure 2 shows the share of females in 1980 and its average change from 1980 to 2010 among the 10 occupation-industry groups that indicated the greatest decline in female workers.

2.2 Marriage rates, gender composition and occupation-industry
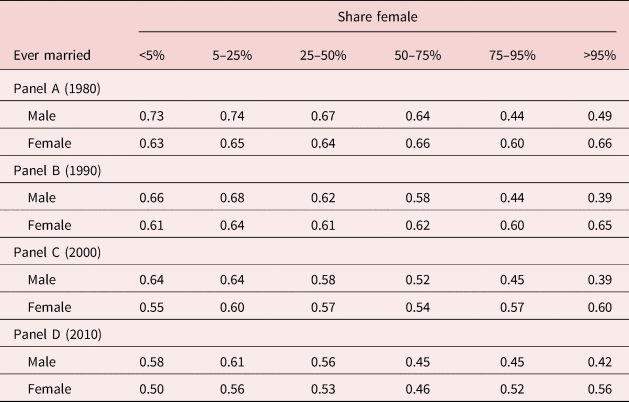
Ever-married individuals are defined as those who report being either married—spouse present, married—spouse absent, separated, divorced, or widowed. It would be ideal to use recently married individuals because people might get married while in a different occupation-industry cell. Unfortunately, year of recent marriage is only available after 2008. Alternatively, I include people's age at the first marriage as an additional check in the later section. Table 2 presents ever-married rates conditional on the percentage of females in occupation-industry cells between 1980 and 2010. The table separates the share of female in the given occupation-industries as follows: less than 5%, 5–25%, 25–50%, 50–75%, 75–95%, and 95% and above. For both women and men, the overall numbers of individuals who had ever been married declined from 1980 to 2010. In general, for men, marriage rates decrease as the percentage of female coworkers increase in occupation-industries across all 4 sample years. For women, marriage rates have a U-shape as the number of female coworkers in an occupation-industry increased. Specifically, the marriage rates for women increase first until the share of female coworkers reached 25%, and then decrease between 25% and 95% female coworkers, and then increase again when occupation-industry groups are comprised of more than 95% females.
Marriage Rates by fraction of female in occupation-industry between 1980 and 2010

Source: 1980, 1990, and 2000 U.S. Census, and 2006–2010 ACS.
Note: Table 2 presents ever-married rates conditional on the percentage of females in occupation-industry cells between 1980 and 2010. It divides the percentage female in given occupation-industry cell as follows: less than 5%, 5–25%, 25–50%, 50–75%, 75–95%, and 95% and above. The sample consists of workers who are between the ages of 18 and 40, are non-institutionalized, are non-agricultural workers and who report occupation-industry and do not work as non-wage workers.
3. Empirical strategy
The analysis uses variation in the percentage of female employees within occupation-industry combinations over time to estimate the impact of workplace interactions on the probability of ever having been married.
The baseline equation is the following:

where Y ionmt is equal to one if person i who works in occupation o and industry n in year t has ever been married and zero otherwise. Specifically, it equals one if the person is married, divorced, separated, or widowed and zero if is single. The main variable of interest is ShareFem ont, which represents the share of all marital age workers in the person's occupation-industry who are female. The vector ${W}^{\prime}_{ont}$ is a set of average wage controls at the occupation-industry level in year t.Footnote 6 The vector includes average hourly wages for both female and male workers, separately, and the logarithms of female and male hourly wage variance in each occupation-industry in the corresponding year. The vector ${M}^{\prime}_{mt}$
 contains time-varying metropolitan area specific controls including the number of female residents, the share of females who are employed, the mean male and female hourly wage and the logarithms of male and female wage variance in each MSA at year t. The vector ${X}^{\prime}$
 includes individual level characteristics such as age, age-squared, race dummies (Black, Asian, white, and other races), and education dummies (high school degree, some college degree, college degree, higher than a college degree, and others).
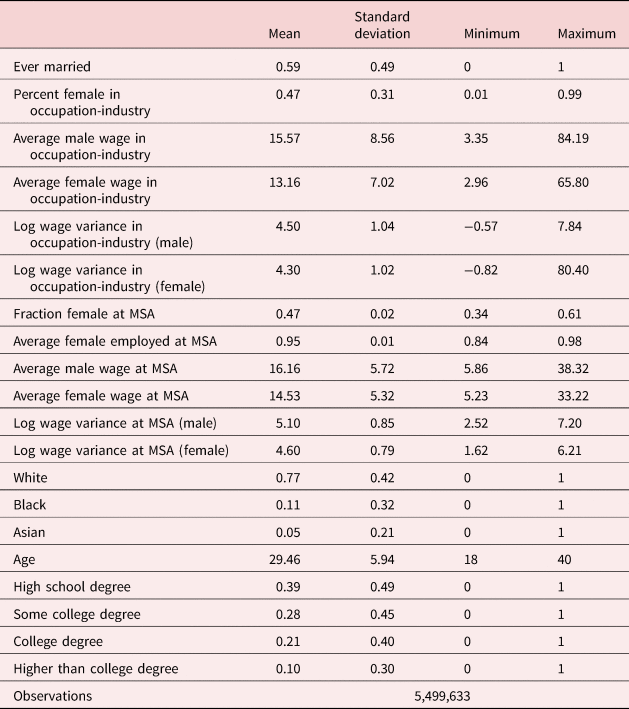
In addition, τ t denotes year fixed effects and φm denotes MSA fixed effects, and they control for unobserved factors that induce differences in marriage outcomes across years and MSAs. Most importantly for the analysis, δ on denotes occupation-industry fixed effects. Adding occupation-industry fixed effects allows for the removal of any time-invariant unobserved characteristics of individuals who select into jobs with different gender distributions in ways that are correlated with their marriage preferences. By controlling for occupation-industry choice, I exploit only variation in gender composition within occupation-industry cells over time. Changing in the gender composition in different occupations and industries are difficult to predict at the start of people's careers. Moreover, switching occupations or industry is costly after a few years of investing in occupation and industry-specific human capital. For both these reasons, exploiting plausibly exogenous variation over time in the gender composition of a person's occupation-industry can yield arguably causal impacts of gender composition in the workplace on marriage decisions especially considering the extensive list of controls included in the model. The regression is estimated separately for women and men using linear probability models with standard errors clustered at the occupation-industry level. All of the regressions are weighted using individual weights from ACS. Table 3 shows summary statistics of the sample used in this analysis.
Summary statistics

Source: 1980, 1990, and 2000 U.S. Census, and 2006–2010 ACS.
Note: The sample consists of workers who are between the ages of 18 and 40, are non-institutionalized, are non-agricultural workers and who report occupation-industry and do not work as non-wage workers. Moreover, occupation-industry cells are restricted for fewer than 50 observations overall and fewer than five observations each for women and men with hourly wage in the range of $2 −200. The fraction of females within occupation-industry cell is a weighted average, which is weighted by a person's weight in the sample.
4. Empirical findings
4.1 Baseline results
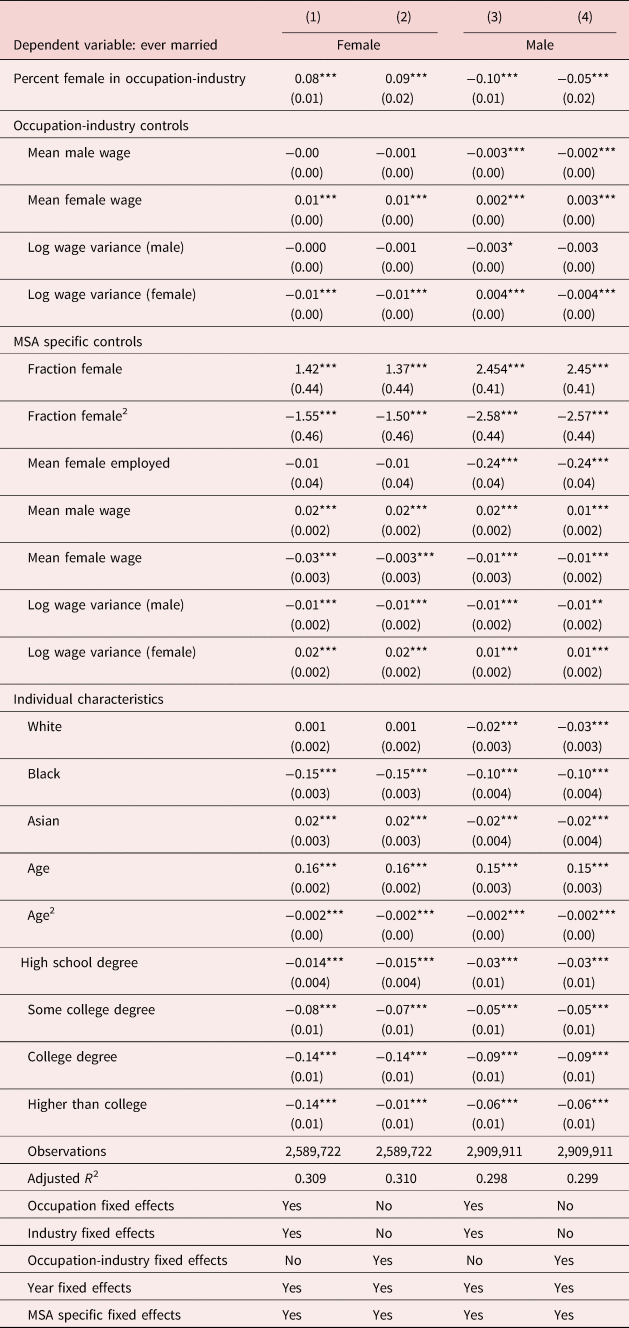
The main regression results are in Table 4. Columns 1 and 2 show the results for females while columns 3 and 4 show the results for males. I start by estimating McKinnish's (Reference McKinnish2007) model with just the occupation fixed effects and industry fixed effects but using more years of data. The results, shown in column 1 for females, reveal that a higher share of female employees is positively associated with a woman's probability of being married. In particular, an increase in the share of female employees by one percentage point increases the likelihood of marriage by 0.08 percentage points for women. This implies that females are more likely to enter marriage when the own-gender share is larger in their occupation-industry. Column 2 replaces the occupation and industry fixed effects (included separately) with occupation-industry fixed effects. The results again suggest that a higher percentage of female coworkers increases the probability of being married for females, and the magnitude of the coefficient estimate is slightly larger. Specifically, a one percentage point increase in the share of own-gender coworkers in an occupation-industry cell raises a woman's probability of being married by 0.09 percentage points. Both of these results are in line with overload theory. An excess of own-gender in a woman's occupation-industry seems to lead women to worry more about availability of marriageable men, and as a result, women enter marriage more easily. The similarity of the estimates constructed from two very different sources of variation also provided some deal of comfort that they might be interpreted as causal.
Impact of fraction female in occupation-industry on marriage rates

Source: 1980, 1990, and 2000 U.S. Census, and 2006–201014 ACS.
Note: ***p < 0.01, **p < 0.05, *p < 0.1. The sample consists of workers who are between the ages of 18 and 40, are non-institutionalized, are non-agricultural workers and who report occupation-industry and do not work as non-wage workers. Moreover, occupation-industry cells are restricted for fewer than 50 observations overall and fewer than five observations each for women and men with hourly wage in the range of $2–200. All of the models are weighted by a person's weight provided by the IPUMs. Standard errors are clustered at the occupation-industry level.
Columns 3 and 4 display the results for males. Again, I show results from a model with occupation fixed effects and industry fixed effects in column 3 followed by one with occupation-industry fixed effects is shown in column 4. Both models predict that a higher share of female employees within an occupation-industry is associated with a significantly lower probability of being married for males, but this time, the magnitude is slightly smaller in model with occupation-industry fixed effects. In the model with occupation-industry fixed effects, the results imply that a one percentage point higher share of women in occupation-industry decreases the probability of being married by 0.05 percentage point.
For both women and men, the results presented above are consistent with overload choice theory. As people are faced with more alternatives, they may have difficulty choosing one. Indeed, Schwartz (Reference Schwartz2004) argues that people become picky if the potential partners are surfeit, and therefore, less inclined to make any choice.
Apart from the main variable of interest, variables measuring the average wages in each occupation-industry cell suggest that in occupation-industries where women earn higher wages, both males and females are more likely to have ever been married at the time of the survey. Also, higher wage dispersion is negatively associated with the incidence of being married for both genders. Furthermore, there is a statistically significant U-shaped relationship between the number of females residing in the MSA and the incidence of marriage of both males and females. Additionally, the probability of ever having been married increases with age, while educational attainment decreases the incidence of marriage. Finally, black workers are less likely to have ever been married than white and Asian workers.
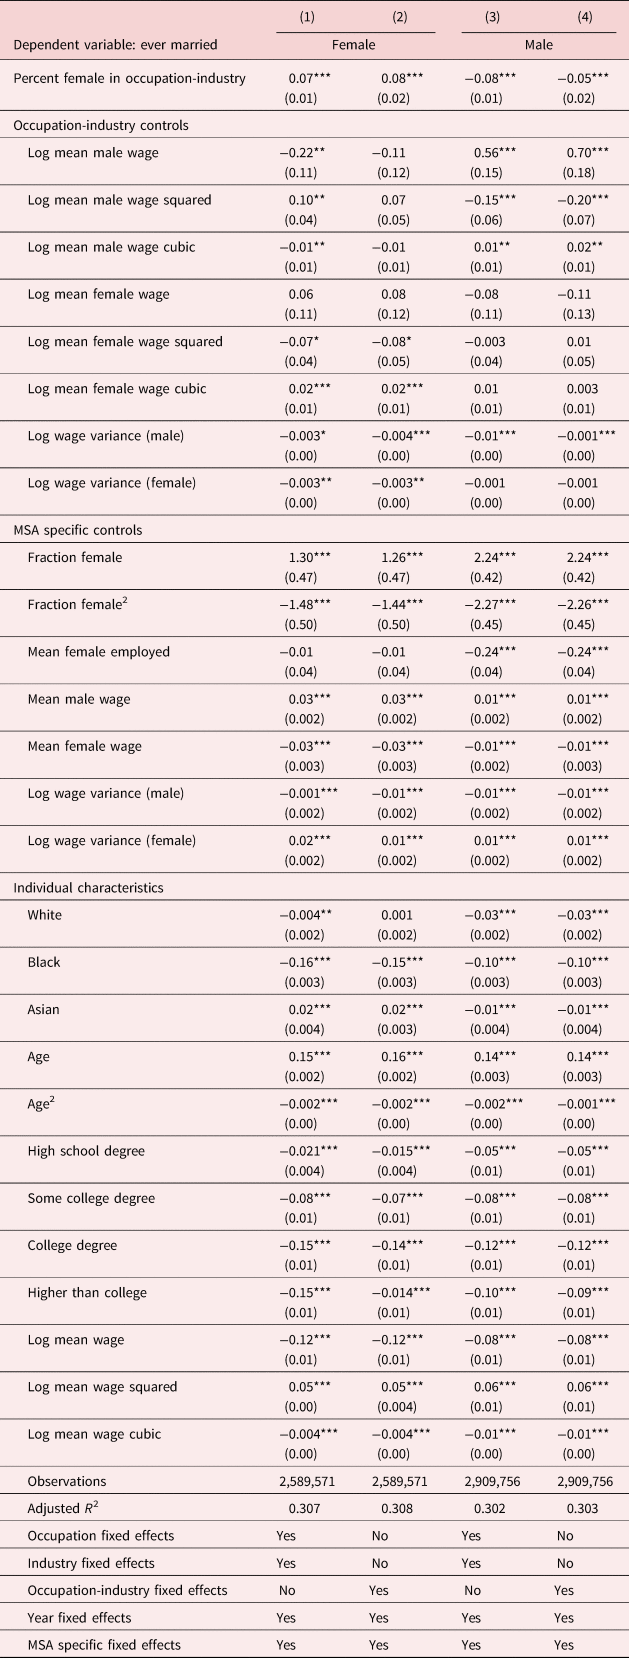
Table 5 replicates the results reported in Table 4 but adds more wage controls. Specifically, I include the natural log of average hourly wage, the quadratic form of the logged average hourly wage, and the cubic form of the logged average hourly wage in each occupation-industry cell for both male and female employees. In addition, I include the natural log of hourly wage, the quadratic form of the logged hourly wage, and the cubic form of the logged hourly wage for all individuals in the sample. For both female and male employees, the estimated coefficients on the share of female employees in occupation-industry cells are similar to the corresponding estimates reported in Table 4, and all estimates are statistically significant.
Impact of fraction female in occupation-industry on marriage rates with additional wage controls

Source: 1980, 1990, and 2000 U.S. Census, and 2006–2010 ACS.
Note: ***p < 0.01, **p < 0.05, *p < 0.1. The sample consists of workers who are between the ages of 18 and 40, are non-institutionalized, are non-agricultural workers and who report occupation-industry and do not work as non-wage workers. Moreover, occupation-industry cells are restricted for fewer than 50 observations overall and fewer than five observations each for women and men with hourly wage in the range of $2–200. All of the models are weighted by a person's weight provided by the IPUMs. Standard errors are clustered at the occupation-industry level.
4.2 Heterogeneity by race
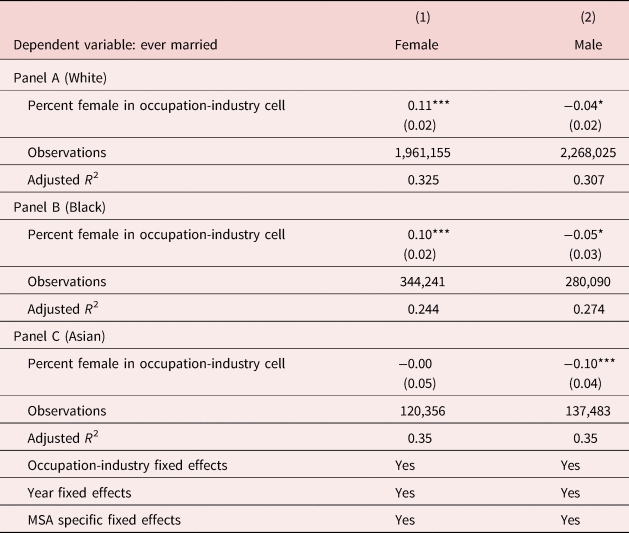
Table 6 presents results separated by race. In these models, both the left- and right-hand side variables are constructed separately by race. For example, to construct the estimates shown in Panel A, I calculate occupation-industry variables (including the share of the occupation-industry that is female) by only using white workers. As seen in Panel A, the larger the share of females among white workers in the occupation-industry, the more likely it is that white females are married (column 1) and the less likely it is that white males are married (column 2) – again, consistent with choice overload theory. The same pattern can be observed in Panel B for Black workers. Specifically, a one percentage point increase in the own-gender share among workers of the same race in an occupation-industry cell increases the probability of being married by 0.11 for white females and 0.10 for Black females. Similar effects are also shown between white men and Black men. For Asian men, also in line with the baseline result, increasing the fraction of Asian female coworkers decreases the marriage probability when including occupation-industry fixed effects, and it is shown to be statistically significant at the 1% level. For Asian women, the estimate of interest has the opposite sign as the baseline result, but it is statistically insignificant. This finding may be driven by the smaller sample of Asian women in the workplace. The smaller sample sizes may induce measurement error in the variable of interest.
The effect of the fraction of female in occupation-industry on marriage rates: race specific results

Source: 1980, 1990, and 2000 U.S. Census, and 2006–2010 ACS.
Note: ***p < 0.01, **p < 0.05, *p < 0.1. Table 6 reports coefficient of the fraction female in occupation-industry in different racial groups. The sample consists of workers who are between the ages of 18 and 40, are non-institutionalized, are non-agricultural workers and who report occupation-industry and do not work as non-wage workers. Moreover, occupation-industry cells are restricted for fewer than 50 observations overall and fewer than five observations each for women and men with hourly wage in the range of $2–200. All of the models are weighted by a person's weight provided by the IPUMs. Standard errors are clustered at the occupation-industry level.
4.3 Heterogeneity by educational attainment
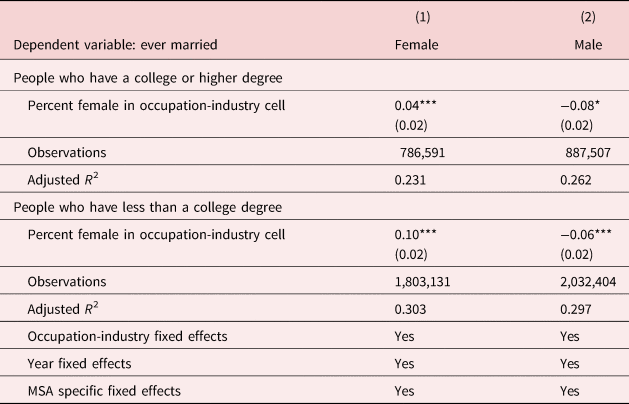
Next, I show the results separated by education. Here, I partition the sample by whether people have a college degree. The results, which can be seen in Table 7, are consistent with the findings using the full sample. In particular, as shown in panel A for people who held a college degree or higher, a one percentage point higher share of female in occupation-industries rises the likelihood of ever been married by 0.04 percentage points for women, and decreases the probability of being married by 0.08 percentage points for men. For people with less than a college degree, the corresponding results are similar to people who had at least a college degree while the magnitude is larger for female and lower for male. This result is however not surprising, given that higher educated people is often associated with greater economic independence and higher socio-economics status [Chiappori et al. (Reference Chiappori, Fortin and Lacroix2002)]. Therefore, people with higher educational attainment have more bargaining power in marriage and they could become choosy in finding a “perfect” match.
The effect of the fraction of female in occupation-industry on marriage rates, education specific results

Source: 1980, 1990, and 2000 U.S. Census, and 2006–2010 ACS.
Note: ***p < 0.01, **p < 0.05, *p < 0.1. The estimation model for this table is the same as those used in Table 4, with separating sample analysis to those who have at least a college degree and to those who have less than a college degree. All of the models are weighted by a person's weight provided by the IPUMs. Standard errors are clustered at the occupation-industry level.
4.4 Heterogeneity by age
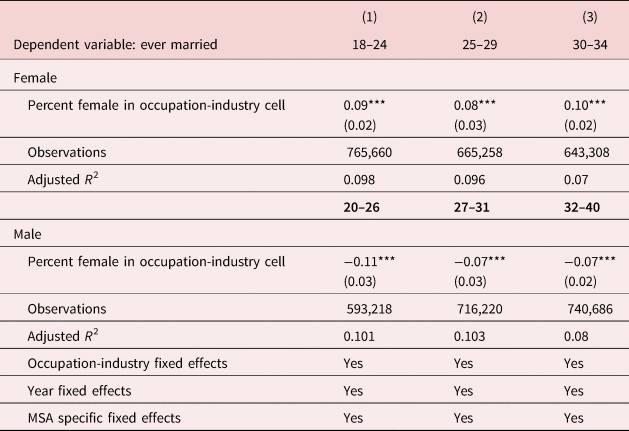
Table 8 presents the results separately by age. This is important for two reasons. First, it may help to address concerns that people switch jobs, after getting married, to their spouse's occupation-industry perhaps as a result of getting married. Second, heterogeneity by age also provides insight on whether gender ratios within occupation-industry affect the timing of marriage or the likelihood of ever having been married. If it is the former, then we should see stronger results among the youngest individuals, but if it is the latter, we should see similar results across the age distribution. In Table 8, I split the sample based on age and then run the main regression. For women, there is not much of a variation across age groups. However, for men, a one percentage point increase in the share of female employees reduces the odds of men between 20 and 26 getting married by 0.11 percentage points; however, for the two older age groups (27–31, 32–40) the coefficient for men is 0.07, a 36% drop. The age variation for the youngest group (20–26) can be explained by those men usually have their first marriage at age 27 [U.S. Census (2019)]. Thus, there are not a lot of marriages happening between age 20 and 26 for men.
The effect of the fraction of female in occupation-industry on marriage rates, age specific results

Source: 1980, 1990, and 2000 U.S. Census, and 2006–2010 ACS.
Note: ***p < 0.01, **p < 0.05, *p < 0.1. The estimation model for this table is the same as those used in Table 4, separating sample analysis to specific age groups. All of the models are weighted by a person's weight provided by the IPUMs. Standard errors are clustered at the occupation-industry level.
4.5 Using MSA-specific workplace gender compositions
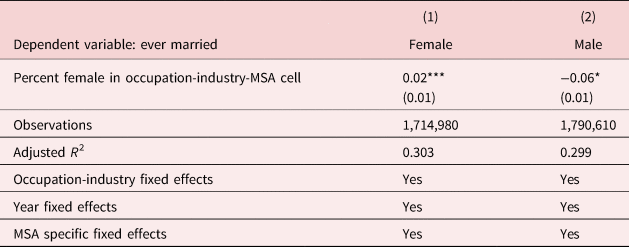
Table 9 presents the results with occupation-industry combinations calculated at the MSA level instead of the national level. This is important if the gender composition of an occupation-industry differs across geographic area in a way that happens to be correlated with marriage tendencies. For example, the gender composition of the entertainment industry in Las Vegas might be different from that in Salt Lake City and marriage tendencies are surely higher in Salt Lake City than they are in Las Vegas. Overall, after adjusting gender variation within occupation-industry groups at the MSA level, the results for both females and males are consistent with the main results, with relatively smaller effects of gender composition on marriage for women than for men, a result potentially explained by attenuation bias when calculating gender composition over smaller numbers of observations.
The effect of the fraction of female in occupation-industry on marriage rates, at the MSA level

Source: 1980, 1990, and 2000 U.S. Census, and 2006–2010 ACS.
Note: ***p < 0.01, **p < 0.05, *p < 0.1. The estimation model for this table is the same as those used in Table 4, with re-estimating the percentage of female within each occupation-industry cell at the MSA level. All of the models are weighted by a person's weight provided by the IPUMs. Standard errors are clustered at the occupation-industry level.
4.6 Robustness checks
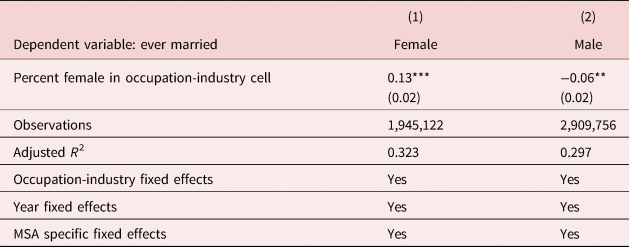
One concern about the analysis is that the result may be driven by female or male heavily dominated occupation-industry cells. For example, if more females voluntarily choose lower-pay jobs because they want fewer demanding from jobs or more family responsibility outside of work, therefore, men from female-dominated occupation-industries are more likely to be single as the gains from marriage decrease over time in these occupation-industries. To address this concern, I eliminate all occupation-industry cells where the share of female employees has the value of standard deviation higher than its median, and run the same specifications based on equation (1). As shown in Table 10, the estimated coefficients are consistent with the results in Table 4.
The effect of the fraction of female in occupation-industry, with excluding gender-dominated occupation-industry

Source: 1980, 1990, and 2000 U.S. Census, and 2006–2010 ACS.
Note: ***p < 0.01, **p < 0.05, *p < 0.1. The estimation model for this table is the same as those used in Table 4, with eliminating the share of female within occupation-industry cells that has the value of standard deviation larger than its median. All of the models are weighted by a person's weight provided by the IPUMs. Standard errors are clustered at the occupation-industry level.
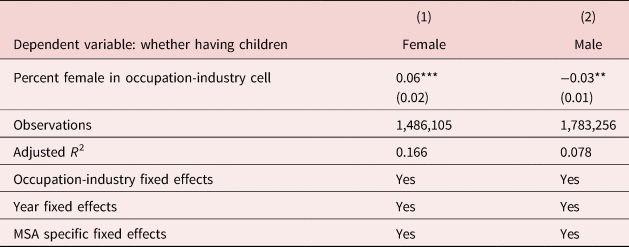
Another potential concern about the analysis is that the selection of women into certain occupation-industry is changing over time in ways that cannot be captured by the occupation-industry fixed effects. For instance, it is possible that changes in “family friendly” policy over time within an occupation-industry cell draws different types of women/men into these types of workplaces in a way that is related to marriage preferences. To address this concern, I estimate the same regression specifications by restricting the sample to ever married individuals and using a dummy for whether having children as the dependent variable (=1 if having a child, =0 if childless). The idea is that if married women in male-dominated occupation-industries are less likely to have children, then the negative effects of having more male coworkers on women's probability of being married could be explained by women in those jobs disproportionately exit after childbearing or women in those jobs have different preference in fertility (then presumably different marriage preference). The results are presented in Table 11 and indicate that it may not completely rule out the possibility that women/men select into certain workplaces because of their marriage preferences. I further calculate the share of married women who are not currently working but report occupation and industry of the most recent job in the past five years. I find that married women who work from less female occupation-industries, particularly those with at least one child, are more likely to report that they are not currently working.Footnote 7 One explanation could be that some unknown factors affect women after childbearing and force women to leave these occupation-industries, and therefore the changes are not due to differences in fertility and marriage preferences. It is also possible that the negative relationship between share of male workers and share of women ever married in the main finding (Table 4) can be an artifact of women disproportionate exit from those occupation-industries. However, without additional information, it is difficult to determine the exact reason.
The effect of the fraction of female in occupation-industry on whether having children for ever married individuals

Source: 1980, 1990, and 2000 U.S. Census, and 2006–2010 ACS.
Note: ***p < 0.01, **p < 0.05, *p < 0.1. The estimation model for this table is similar as those used in Table 4, but restricting the sample to ever married individuals and change the independent variable to a dummy for whether having children. All of the models are weighted by a person's weight provided by the IPUMs. Standard errors are clustered at the occupation-industry level.
5. Workplace gender composition and age at marriage
In this section, I further investigate the impact of gender composition in the workplace on people's age at first marriage. The estimates of the main regression suggest that an increase in the share of own gender in the workplace decreases the incidence of ever having been married for both men and women. This could be driven either by changes in the likelihood of ever marrying or simply delays in marriage. Here, I look directly at the relationship between occupation-industry gender composition and age at first marriage.
The dataset I use in this section is derived from the 2008–2017 ACS. The advantage of using this survey is that it collects information on year of the most recent marriage, which enables me to calculate the ages at first marriage for those who have only been married once. It is worth noting that, due to data limitations of only having information about individuals' most recent marriage, I restrict the sample to people who have married only once.Footnote 8 The problem is that instead of being able to exploit changes over four decades, I can only exploit variation over ten years making it more difficult to identify impacts.
The estimating equation used in this analysis is the same as equation (1), but with age at first marriage as the dependent variable.
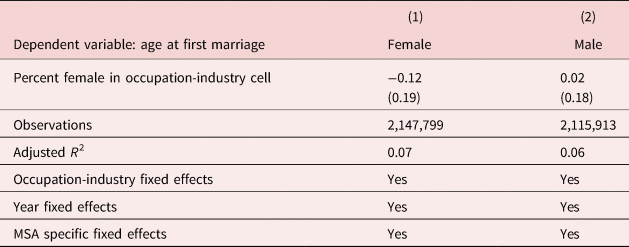
The results are shown in Table 12. As with the previous analysis, the point estimate suggests that the larger the share of people of the opposite gender in a person's occupation-industry, the older they are at first marriage. However, the estimated coefficients of interest are not statistically significant – a result that may be explained by the much smaller sample sizes and the fact that there is much less variation in workplace gender composition over the most recent ten years than in the previous four decades.
The effect of fraction of female in occupation-industry on people's age at first marriage

Source: 2008–2017 ACS.
Note: ***p < 0.01, **p < 0.05, *p < 0.1. The estimation model for this table is the same as those used in Table 4, with the dependent variable is people's age at first marriage. Additionally, the sample limit individuals who have only been married once. The fraction of females within occupation-industry cell is a weighted average, which is weighted by a person's weight in each sample. Standard errors are clustered at the occupation-industry level.
6. Conclusion
This paper studies whether the growing share of females in the workplace is related to changes in the incidence of ever having been married for both men and women. Marital search theory suggests that a higher share of one's opposite gender in an environment is associated with less competition and lower search costs which could increase the likelihood of marriage. On the other hand, it could be possible that as more and more women enter to the job market, the gains from marriage for women (men) decreases over time in male- (female-) dominated occupation-industry cells, and thus, more likely to delay marriage. Another possibility, however, is that the more marriage prospects there are, the more marriage market participants delay marriage in hopes of finding a better match later. It is even possible that the inability to make decisions and delays of marriage ultimately result in increased likelihoods of never having been married even at older ages. The main finding is that an individual's marriage decision is related to gender composition in the workplace, but that the more opposite-gender workers there are in a person's occupation-industry, the less likely that person is to be married by any given age.
Overall, the result in this paper is consistent with overload choice theory [e.g., Iyengar and Lepper (Reference Iyengar and Lepper2000), Schwartz (Reference Schwartz2004)]. If marriage market participants delay, and ultimately potentially forgo, marriage when confronted with many suitable marriages as a result of a belief that a more attractive mate would appear in the future. This implies that workplace gender composition is important and may alter one's marriage decision. However, we should be cautious about making any inference beyond the data patterns as the nature of marriage is often unpredictable and complex. Further research might randomly allocate different shares of potential spouses to a person's workplace, but this type of study might be difficult or impossible to implement.
Acknowledgement
I am grateful to Delia Furtado, Kenneth Couch, Jorge M. Aguero, graduate forum participants at University of Connecticut and participants of the CSWEP session at the 2018 Eastern Economic Association Conferences for helpful comments and suggestions.