I. INTRODUCTION
Since dye-sensitized solar cells (DSSCs) based on the photosensitization of titania nanoparticles were first designed by Oregan and Graetzel,Reference Oregan and Gratzel1 the concept has become one of the most promising alternative candidates to conventional photovoltaic cells.Reference Yang, Kim, Jha, Lee, Paul and Schmuki2 Research on the anode materials, such as TiO2, ZnO, and Nb2O5, is one of the most valued fields.Reference Fernandez-Garcia, Martinez-Arias, Hanson and Rodriguez3–Reference Shang, Xu, Gao, Zhao and Chen6 Among these wide-band oxides, nanostructured porous TiO2 polycrystalline films have been the focus of a great deal of research,Reference Lu, Mou, Wu, Zhang, Zhang, Huang, Xu and Huang7 due to their low cost and acceptable energy conversion efficiency. Various methods are used to modify the TiO2, and doping has drawn much attention due to its convenience and performance diversification.
TiO2 used as the anode material in DSSCs, in general, should be an n-type semiconductor. The n-type TiO2 can be obtained in various ways, either by Ti cation substitution with nonisovalent elements (Nb, Sb, V, Mo, and Ni)Reference Kubacka, Colon and Fernandez-Garcia8,Reference Devi, Murthy and Kumar9 or by O2− anion replacement with extrinsic impurities (F, N, and S),Reference Sun, Du, Liu, Tao and Zhai10 as well as by chemical reduction (oxygen vacancies, Ti interstitials).Reference Di Valentin, Pacchioni and Selloni11
Nb-doped TiO2 is obtained via the replacement of tetravalent Ti with pentavalent Nb during formation of Ti3+ species, which contribute to a higher conductivity.Reference Liu, Szeifert, Feckl, Mandlmeier, Rathousky, Hayden, Fattakhova-Rohlfing and Bein12–Reference Noh, Lee, Kim, Lee, Han, Cho, Cho, Jung and Hong14 Nb-doped TiO2 has been reported to hold promising applications in the DSSCs.Reference Lee, Noh, Han, Yim, Kim, Lee, Kim, Jung and Hong13,Reference Siddiki, Munoz-Rojas, Oro, Li, Qiao, Galipeau and Lira-Cantu15 However, the mechanism and structural characteristics of the effects caused by ion doping are still controversial. In addition, expensive niobium chloride or niobium alkoxide is used as the Nb-doping source in most preparations of Nb-doped TiO2 semiconductor, and these preparation techniques require numerous tedious steps,Reference Ruiz, Dezanneau, Arbiol, Cornet and Morante16 which limit the development of this material to some extent.
F-doped TiO2, which is realized via the substitution of O2− anion by single-charged F− anion, has also attracted close attention, since nonmetal-doped TiO2 is less expensive and more thermally stable.Reference Lv, Yu, Cui, Chen and Li17 Most of the previous studies focused on its photocatalytic performance, where the existence of a certain amount of the Ti3+ states in F-doped TiO2 played an important role, such as the reduction of the electron and hole recombination rate and the enhancement of the photocatalytic activity.Reference Yu, Yu, Ho, Jiang and Zhang18
Ti3+ has been found to be important to the enhancement of electron injection and the increase of the charge-transfer ability.Reference Di Valentin, Pacchioni and Selloni11,Reference Xie, Huang, You, Liu, Sebo, Liang, Fang, Liu, Guo and Zhao19 It is obvious that Ti3+ can be formed by either metal-doping or nonmetal-doping. However, the superfluous amount of some single dopant would act as the recombination centers and result in the increase of electron scattering and electron trapping. Thus, the use of codoping by two or more elements is expected to result in a significant improvement. TiO2 codoped with two or more nonmetal elements as photocatalyst has been reported.Reference Sakai, Obata, Hashimoto and Irie20,Reference Li, Yin, Yao and Li21 However, few studies have been done on the TiO2 codoping with metal and nonmetal elements.Reference Breault and Bartlett22,Reference Yu, Shu, Zhang, Xie and Fan23 And to the author's knowledge, none of them are applied in the DSSCs. Considering that Nb-doping has shown favorable performanceReference Liu, Szeifert, Feckl, Mandlmeier, Rathousky, Hayden, Fattakhova-Rohlfing and Bein12–Reference Siddiki, Munoz-Rojas, Oro, Li, Qiao, Galipeau and Lira-Cantu15 and F-doping could not only be used as a donor dopant but also to improve the crystallinity of anatase TiO2,Reference Yu, Yu and Chan24 Nb and F codoping would be expected as an desirable collocation. In addition, in our previous work, titania micron beads codoped with Nb and F were synthesized and used in DSSCs with beneficial result.Reference Gao, Xu and Bai25 However, since the rather large dimensions of those micron-order beads limit the surface area of the photoanodes, the high efficiency of the DSSCs has been prevented from being achieved.
In this study, Nb, F-codoped TiO2 (NFT) nanoparticles were synthesized via hydrothermal treatment, using low-cost inorganic Nb2O5 as Nb source and hydrofluoric acid as F source. The structure of as-prepared NFT nanoparticles and the performance of DSSCs with the NFT photoanodes were investigated. The mechanism of the improvement caused by Nb, F-codoping was also discussed.
II. EXPERIMENTAL
A. Materials and synthesis
All chemicals were purchased commercially and used without further purification. Tetrabutyl titanate (chemically pure), niobium oxide (Nb2O5) powder (99.5% purity), hydrofluoric acid (pure, 40%), and lactic acid (analytically pure, 85%) were used as starting materials. First, the tetrabutyl titanate was chelated with lactic acid under continuous stirring to obtain the Ti-precursor. Nb2O5 was added into hydrofluoric acid at 60 °C and kept for 4 h to make sure Nb2O5 be dissolved completely, which can be described by reaction Eq. (1),
 $${\rm{Nb}}_{\rm{2}} {\rm{O}}_{\rm{5}} + 10{\rm{HF}} \rightleftharpoons 2{\rm{H}}_{\rm{2}} {\rm{NbOF}}_5 + 3{\rm{H}}_{\rm{2}} {\rm{O}}\quad {\rm{.}}$$
Then the solution was added into the Ti-precursor with continuous stirring. Deionized water was added afterward to obtain clear aqueous sol-precursor. The sol-precursor was transferred into a Teflon autoclave (100 mL capacity, 70% filling) after placed overnight, then the autoclave was put into the furnace at 110 °C for 20 h for gelation process. The crystallization was completed by heating the autoclave to 180 °C at a rate of 2 °C/min and maintained at this temperature for a define reaction duration (20 h). The resulting precipitates were centrifuged and washed with deionized water and alcohol for three times, and then dried at 50 °C in an oven overnight.
According to Eq. (1), Nb and F were doped into TiO2 at the ratio of about 1:5. In this work, the Nb, F-codoped TiO2 (NFT) powders with the Nb/(Nb + Ti) molar ratio of 0.01, 0.03, and 0.05 were prepared and designated as A1, A3, and A5, respectively. A corresponding undoped TiO2 (TO) was also prepared as a reference and was named as A0.
B. Material characterization
X-ray diffraction (XRD) measurements were performed on a X'pert PRO (PANalytical Ltd., Almelo, Netherlands) diffractometer, working with the Cu Kα1 (1.540598 Å) at 40 kV and 40 mA. Transmission electron microscopy (TEM) images were obtained on a JEM-2100 (JEOL Ltd., Tokyo, Japan). X-ray photoelectron spectroscopy (XPS) was recorded on a AXIS-ultra DLD (KRATOS, Manchester, UK), with a monochromatized Al Kα x-ray source (hν = 1486.6 eV).
C. Preparation of photoanodes and assembling of DSSCs
For the fabrication of the TiO2 paste, ethyl cellulose was first dissolved in terpinol (weight ratio = 1:9) at 60 °C, 20 wt% of nanoparticles previously prepared was added with enough grind, followed by the addition of a little Triton and acetyl acetone, and then the mixture was fully ground until the particles were homogeneously dispersed.
To prepare the photoanode, the fluorine-doped SnO2 (FTO) conducting glass (NSG, 2.2 mm thickness, 14 ohm/sq) used as a current collector was first cleaned and precoated with a layer of sol–gel film, which was prepared according to a similar method as reported in the literature.Reference Yu, Zhao and Zhao26 Then the substrates coated with sol–gel films were heated at 500 °C for 30 min in air to get the compact films. The NFT and TO pastes were then repetitively screen-printed on the substrates (0.5 × 0.5 cm), dried at 70 °C for 10 min and then calcined at 500 °C for 30 min. These NFT and TO films were posttreated with 40 mM TiCl4 solution at 70 °C for 30 min afterward, rinsed with water, and sintered at 500 °C for 30 min. After cooling to 80 °C, these TiO2 electrodes (about 13 ± 0.5 μm thickness) were immersed into a 5 × 10⁻⁴ M ethanol solution of N719 (Solaronix, Aubonne, Switzerland) overnight to complete the sensitizer uptake. The dyed electrodes were finally rinsed with ethanol and dried in air to achieve TiO2 photoanodes.
The Pt-counter electrode was obtained by vacuum sputtering (JS-1600, Beijing, China) Pt on the FTO glass substrate. The TiO2 photoanode and Pt-counter electrode were assembled into a sandwich type cell and sealed with a 25-μm-thick thermoplastic frame (Surlyn1702, Dupont, Wilmington, DE). A hole was introduced in the counter-electrode to allow the internal space between the two electrodes to be filled with electrolyte via vacuum backfilling. The electrolyte solution was composed of 0.3 M LiI, 0.05 M I2, 0.4 M 1,2-dimethyl-3-propyl imidazolium iodine (DMPII), 0.1 M guanidinium thiocyanate (GuSCN), and 0.5 M tert-butylpyridine (TBP) in acetonitrile. Finally, the hole was sealed with the hot-smelt film and a cover glass sheet (0.1 mm thickness).
D. Photovoltaic characterization
An AM 1.5G solar simulator (Newport) was used to give a simulated light irradiance, and photovoltaic measurements were performed at an intensity of 100 mW/cm2, which was calibrated with a reference Si cell. The current–voltage characteristics of the cell under these conditions were obtained by applying external potential bias to the cell and measuring the generated photocurrent with a Keithley model 2400 digital source meter (Keithley, Cleveland, OH). The incident photo-to-current conversion efficiency (IPCE) measurements were performed on a 7-SCSpec II solar cell spectral measurement system (Beijing 7-STAR, Beijing, China). The electrochemical impedance spectroscopy (EIS) data were collected with CHI-660D (CH, China). The spectra were achieved at bias of 0.8 V in the frequency range of 0.1 Hz–100 kHz with the alternating potential amplitude of 10 mV at room temperature under darkness. The photoanode was connected to working electrode, while the Pt counter electrode was linked together with the auxiliary electrode and the reference electrode. The obtained impedance data were fitted with the Z-view software.
III. RESULTS AND DISCUSSION
A. Crystal structure and morphology
XRD measurements were performed to identify the phase and crystal structure. Figure 1 shows the XRD patterns of the as-prepared TO and NFT samples. Both pure and doped nanoparticles show only the anatase phase. The structure of the TiO2 does not change after doping. The diffraction peaks shift to lower angles with the increase of the doping contents, which means that the d-spacing increases because of Nb and F doping, as shown in the inset of Fig. 1. This can be explained by the expansion of the unit cell caused by the replacement of Ti4+ ions (radius 0.605 Å) by slightly larger Nb5+ ions (radius 0.64 Å)Reference Shannon and Prewitt27,Reference Shannon28 while the radius of F− ions approaches to that of O2−.Reference Di Valentin, Pacchioni and Selloni11
XRD patterns of TO (A0) and NFT (A1, A3, and A5) nanoparticles. The inset shows the details of the patterns around the (101) peak.

In Fig. 1, the diffraction peak intensities of NFT nanoparticles are obviously strengthened compared with that of TO sample. In addition, the profiles of NFT are also much more distinct and intact compared to TO's, and the peaks of the A3 sample are sharper than others. These results indicate that the crystallization of TiO2 particles can be enhanced through Nb and F doping, which makes the NFT more outstanding in electron carrier transfer.
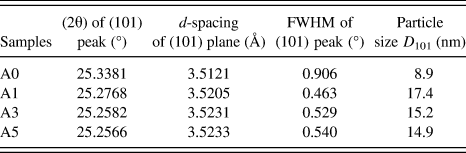
It can be discovered by further observation that the full widths at half maximum (FWHM) of the TO peaks are much broadened compared to those of NFT, and the FWHM of NFT powders are slightly widened with the incremental Nb and F contents. Such a variation of FWHM implies the change in the crystallite size, which was quantitatively calculated by the Debye–Scherrer equation, meanwhile the (101) reflection plane was selected to estimate, and the calculated results were listed in Table I.
Diffraction parameters of (101) peaks and calculated particle sizes of TiO2 powders.
As shown in Table I, the average particle size of TO powder is less than 10 nm, while those of the NFT nanoparticles are much larger, but slightly decreases from 17.4 to 14.9 nm as the doping content increases.
TEM images of NFT and TO were used to display the morphology of the samples. As shown in Fig. 2, all the samples are nanocrystals with anatase structure (based on electron diffraction), and their d-spacing obtained from HRTEM images rise as the doping content increases, which are well in accordance with the results obtained by XRD. In addition, the average particle sizes of the NFT nanoparticles are distinctly larger than that of the TO sample and seem to slightly decline with the increase of the doping contents. These findings show the same tendency with that in Table I.
TEM images of the TO (A0) and NFT (A1, A3, and A5) nanoparticles. The insets show the corresponding HRTEM images of these samples.
This phenomenon might be attributed to the presence of F− ions in the hydrothermal precursor. On one hand, F− ions facilitate the formation of the anatase phaseReference Yu, Yu and Chan24,Reference Yang, Sun, Qiao, Zou, Liu, Smith, Cheng and Lu29 ; moreover, the low pH value of NFT sol precursor is also helpful for crystallite growth. The crystallite sizes of NFT nanoparticles are hence evidently larger than that of TO. On the other hand, excess F− ions hinder the growth of the nanoparticle,Reference Yang, Sun, Qiao, Zou, Liu, Smith, Cheng and Lu29 and the crystallite sizes slightly decrease as F content increases.
B. Chemical analysis of NFT nanoparticles
XPS spectrum of NFT sample A1 is illustrated in Fig. 3. The curve shows obviously Nb 3d 5/3 and F 1s peaks at about 207 and 685 eV, respectively except Ti and O peaks. Scanning transmission electron microscopy (STEM) elemental mapping was also performed to investigate the distribution of Nb and F in the NFT nanoparticles. Figure 4 shows the STEM images and the corresponding elemental mapping of sample A3, demonstrating the expected homogeneous spatial distribution of Nb and F in TiO2 lattice.
XPS spectrum of sample A1.
STEM image of A3 and the corresponding elemental mappings of Ti, O, F, and Nb.
High-resolution XPS spectra are used to study the effects of Nb, F-codoping on chemical states of the samples. Figure 5(a) presents the high-resolution XPS spectra in the Ti 2p region for the TO and NFT samples. The binding energy of Ti shifts to lower values when Nb and F are introduced. The shape and position of the Ti peaks could be assigned as mixture of Ti4+ and Ti3+ states, as shown in Fig. 5(b). For the Ti 2p 3/2 peak, the binding energy of Ti3+ (457.8 eV)Reference Werfel and Bruemmer30 is lower than that of Ti4+ (458.8 eV).Reference Wangner, Riggs, Davis and Moulder31 Therefore, a clear shift to lower binding energies is observed in Fig. 5(a) as doping contents of Nb and F raise. This supports that there is an increase of Ti3+ proportion. Moreover, the radius of Ti3+ ion (0.67 Å)Reference Shannon28 is much larger than the unreduced state, and the increase of Ti3+ proportion is thus another reason for unit cell expansion (i.e., d-spacing enhancement), which agrees well with the XRD results.
Ti 2p XPS spectra. (a) All samples and (b) sample A5 assigned with Ti3+ and Ti4+.
The high-resolution XPS spectra of the O 1s region for the as-prepared nanoparticles were also performed. The results in Fig. 6 indicate a negative shift of binding energy with increasing doping contents. To investigate the reason for this change, the chemical compositions for oxygen should be analyzed, as shown in Fig. 7. The O 1s spectrum for every sample is observed to be asymmetric, which is attributed to the existence of different chemical compositions for oxygen.
O 1s XPS spectra of the TO and NFT nanoparticles.
High-resolution XPS spectra of the O 1s region.
All curves show a dominant peak around 530 eV, which can be assigned to the O–Ti bonds, and the small peak appearing around 533.10 eVReference Wagner, Zatko and Raymond32 is related to H2O adsorbed on the surface of nanoparticles. Since the binding energy of O with trivalent Ti (529.6 eV)Reference Werfel and Bruemmer30 is lower than that of O with tetravalent Ti (530.0–530.5 eV),Reference Kubacka, Colon and Fernandez-Garcia8,Reference Slink and DeGroot33–Reference Ingo, Dire and Babonneau35 the main reason for the shift of O–Ti binding energy to lower value can be related to the increase of Ti3+ proportion.
A new peak at 529.6 eVReference Wojcieszak, Jasik, Monteverdi, Ziolek and Bettahar36 is seen for the NFT samples, which can be assigned to O–Nb bonds, indicating that the substitution of the Ti sites with Nb in the TiO2 lattice, and this peak is distinctly enhanced with increasing Nb content. Therefore, the negative shift of O 1s peak with increasing doping contents can be attributed to the combined action of both left-shifting O–Ti peak and climbing O–Nb portion with low-binding energy.
The peak around 531.6–531.9 eVReference Wagner, Zatko and Raymond32,Reference Samadpour, Boix, Gimenez, Zad, Taghavinia, Mora-Sero and Bisquert37 is derived from –OH bonds. This peak intensity declines with increasing F content because some surface hydroxyl groups on the surface of NFT nanoparticles are replaced by F− ions, as described by Eq. (2) (Ref. Reference Samadpour, Boix, Gimenez, Zad, Taghavinia, Mora-Sero and Bisquert37) and illustrated in Fig. 8.
 $${\rm{Ti}} - {\rm{OH}} + {{\rm{F}}^ - } \to {\rm{Ti}} - {\rm{F}} + {\rm{O}}{{\rm{H}}^ - }\quad .$$
F− ions replace some OH- groups at the particle surface.
These analyses confirm that Nb and F are doped into TiO2 lattice as expected. As reported,Reference Di Valentin, Pacchioni and Selloni11,Reference Hitosugi, Kamisaka, Yamashita, Nogawa, Furubayashi, Nakao, Yamada, Chikamatsu, Kumigashira, Oshima, Hirose, Shimada and Hasegawa38,Reference Zhang, Liu, Gao, Teng, Song, Wang and Han39 when Nb is introduced into TiO2 lattice, Nb5+ substitutes Ti4+, and one delocalized electron is released to occupy the states near the bottom of the conduction band. Similarly, an extra electron is also left after the replacement of O2− by F−, which occupies a fully delocalized state at the bottom of the conduction band.Reference Di Valentin, Pacchioni and Selloni11,Reference Zhang, Liu, Gao, Teng, Song, Wang and Han39,Reference Im, Yun, Lee and Lee40 Both of these two processes would promote the electron density in the conduction band of semiconductor, leading to a higher conductivity. The content of Ti3+ species thus increases as the dopants increase, which lowers the conduction band minimum (CBM) of the samples.Reference Im, Jung and Lee41,Reference Im, Yun and Lee42
C. Photovoltaic performance
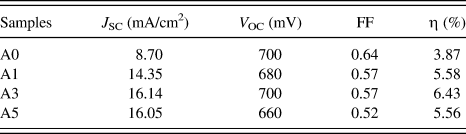
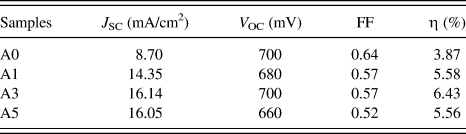
Figure 9 shows the photocurrent–voltage (J–V) curves of the cells based on NFT and TO photoanodes. The corresponding data are summarized in Table II. An energy conversion efficiency (η) of 6.43% is achieved for A3 NFT DSSC (Nb:F:Ti ratio is about 0.03:0.15:0.97), which is 66.1% higher than that of the TO cell. To be specific, a pronounced increase in the photocurrent density (J SC) for DSSCs based on NFT is found, and a maximum of 16.14 mA/cm2 is achieved, after which the uptrend is reversed as the dopant content further increases. In contrast, it is found that a negative influence of Nb and F doping on the open-circuit potential (V OC) is observed, and a rebound occurs at an appropriate dopant content (A3 cell), which is similar to the situations when sole niobiumReference Lu, Mou, Wu, Zhang, Zhang, Huang, Xu and Huang7 or chromiumReference Xie, Huang, You, Liu, Sebo, Liang, Fang, Liu, Guo and Zhao19 is used as the dopant. Additionally, the fill factor (FF) is observed to be slightly attenuated along with doping.
J–V curves of DSSCs based on TO (A0) and NFT (A1, A3, and A5) photoanodes under AM 1.5G solar illumination at 100 mW/cm2.
Performance of DSSCs based on TO and NFT photoanodes.
The generation of photocurrent depends on electron-injection processes and the charge-transfer ability, which are the main factors that contribute to the enhanced J SC.
When Nb5+, F− substitute Ti4+ and O2−, respectively, excess electrons are released to occupy the states near the bottom of the conduction band, and the CBM of NFT is hence lowered. On one hand, the driving force for electron injection, namely the D-value between CBM and the lowest unoccupied molecular orbital of dye,Reference Wang, Yamaguchi, Sugihara and Arakawa43 is increased by Nb, F-codoping, which correspondingly promotes the enhancement of the electron-injection efficiency. On the other hand, these delocalized electrons existing in conduction band contribute to the increase of the electron concentration, which is beneficial to the charge transfer process on the basis of the theoretical model of electron conductivity (σ) described by the following equation
 $${\rm{\sigma }} = ne{\rm{\mu }}\quad {\rm{,}}$$
where n is electron concentration, e denotes elementary charge, and μ stands for the electron mobility. Based on the notion about electron transport through mesoporous TiO2, electron transfer is controlled by a trapping–detrapping process of electrons from the Ti3+ states.Reference Snaith and Schmidt-Mende44 Considering that the band structure near the bottom of the conduction band is more dispersed due to Ti3+ states and the crystallinity of NFT is enhanced after doping, μ is highly improved. Accordingly, the charge transfer ability is increased. As a consequence, the increase of the photocurrent density of NFT DSSCs is achieved by the enhanced electron injection ability and improved electron transport efficiency compared to that of the TO cell, and it continues to increase as the doping contents of Nb and F increase at the beginning.
However, charge recombination increases with the increase of electron concentration. In addition, as the dopant content further increases, the crystallinity declines (as verified by XRD), electron scattering and electron trapping caused by high density of defects increase. Thus, the electron mobility decreases, which result in the descending of the electron transfer ability. Therefore, J SC of DSSCs falls with excessive doping.
This variation can also be confirmed by action spectra. The IPCE of the DSSCs based on NFT photoanodes display a significant enhancement compared to that of TO cell, as shown in Fig. 10. The result indicates that the codoping of Nb and F would enhance the photoelectric conversion efficiency of the DSSCs at the total visible-light region and thus directly lead to higher photocurrent of NFT cells. However, excessive doping makes counterproductive, which agrees well with the change of J SC in Fig. 9.
IPCE curves of DSSCs based on TO (A0) and NFT (A1, A3, and A5) photoanodes.
V OC is mainly dependent on the D-value between the E f of TiO2 and the redox potential of the  ${I^ - }/I_3^ -$ couple, and it can be described in the following equationReference Wang, Yamaguchi, Sugihara and Arakawa43:
 $${V_{{\rm{OC}}}} = {1 \over q} \times \left( {{E_{{\rm{f,Ti}}{{\rm{O}}_{\rm{2}}}}} - {E_{R/{R^ - }}}} \right)\quad .$$
As expounded above, CBM of the NFT nanoparticles are lowered due to the high electron concentration and the enhanced Ti3+ proportion, which is attributed to the increased codoping of Nb and F. Thus, E f of the material behaves a negative shift as the same trend. Moreover, the enhanced charge recombination caused by the increased electron concentration would lead to the decline of the V OC as well. Consequently, V OC of DSSCs reduces when the Nb and F codoping increases, and the fluctuation for A3 cell results from the compensation caused by the high conductivity of the crystal.
FF is affected by the built-in voltage (V in), the series resistance, fabrication technology, and so on.Reference Han, Koide, Chiba and Mitate45 The series resistance and fabrication technology are similar in both TO and NFT DSSCs. With regard to V in, it is defined by the difference between the work function (E w) of the photoanode material and the redox potential of the  ${I^ - }/I_3^ -$ couple of the electrolyte.Reference Koide, Islam, Chiba and Han46 Since that E w = E f, and E f decreases as the doping content increases, V in would decrease with increasing doping content. This explains the attenuation of the FF in Table II.
As a consequence, the energy conversion efficiency of the NFT cell is effectively enhanced for the strong improvement of the photocurrent density, while V OC and FF reduce lightly.
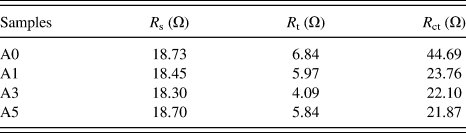
The effects caused by Nb and F doping on transfer and recombination of the DSSCs is further discussed with the aid of EIS. The spectra of the DSSCs based on TO and NFT photoelectrodes were achieved, as shown in Fig. 11.
EIS curves of DSSCs based on TO (A0) and NFT (A1, A3, and A5) photoanodes.
The response in high-frequency region above 104 Hz is assigned to charge transfer behavior occurring at the Pt/electrolyte interface, while that in low-frequency region below 0.5 Hz relates to the Nernst diffusion process within the electrolyte; the intermediate frequency arc at the 103–0.5 Hz is corresponded to the electron motion at the nanoparticles/dye/electrolyte interface, which is the major concern here.Reference Hsiao, Tung and Teng47
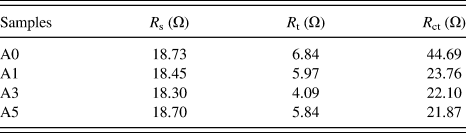
These electronic processes in the DSSCs are well described by the transmission line model reported in Ref. Reference Wang, Chen, Humphry-Baker, Zakeeruddin and Gratzel48, and the corresponding simulate data are listed in Table III. R s means the series resistance, which was nearly unchanged. R t stands for the electron transport resistance, namely the resistance for the electron transport through the TiO2 nanoparticles, and it can be described by the overlap between the borders of the first and the second arcs in EIS spectrum. In Table III, R t declined at the beginning and bounced back with further Nb and F codoping. In addition, the recombination resistance can be defined as R ct, indicating that the recombination between redox electrolyte and electrons in the TiO2 conduction band, and the radius of the second semicircle in the EIS curve stands for it. As shown in Fig. 11 and Table III, R ct remarkably decreased with the increasing doping content, which is different from previous reports.Reference Lu, Mou, Wu, Zhang, Zhang, Huang, Xu and Huang7 Obviously, the variation of these parameters agrees well with the process discussed in J–V section. The electron-transfer ability affects R t directly, and the high electron concentration of NFT leads to the decline of R ct as the dopants increase.
Equivalent-circuit parameters of DSSCs assembled with TO and NFT films.
IV. CONCLUSIONS
Nb, F-codoping TiO2 (NFT) nanoparticles were successfully obtained by a hydrothermal synthesis method and the doping elements are homogeneously distributed. When used in DSSCs as photoanode materials, they show prominent performances. The codoping of Nb and F improves the crystallinity of the TiO2 crystals and increases the Ti3+ proportion, leading to the increase of electron injection and the enhancement of charge-transfer ability in DSSCs. Therefore, the photocurrent densities of DSSCs were significantly increased, resulting in the enhancement of the overall energy-conversion efficiency, and when the Nb:F:Ti molar ratio is about 0.03:0.15:0.97, the relative energy conversion efficiency can be 66.1% higher than that of the cell based on pure TiO2. These results signify that NFT nanoparticles with appropriate doping ratio of Nb and F would be a promising alternative candidate for DSSCs.
ACKNOWLEDGMENTS
The authors are grateful to the National Natural Science Foundation of China (Grant Nos. 21203145 and 50902109), the Natural Science Foundation of Shaanxi Province (Grant No. 2010JQ6002), and the Fundamental Research Funds for the Central Universities (Grant No. XJJ2012076) for the financial support.