



1. Introduction
Group-living is one of the six major evolutionary transitions (Maynard Smith & Szathmáry Reference Maynard Smith and Szathmáry1997). However, group-living is much more challenging than is usually assumed, for two very different reasons. One is that living in close proximity to others generates stresses that negatively impact female fertility (in particular), creating a centrifugal force that, all else equal, naturally drives animals apart (Dunbar & Shultz Reference Dunbar and Shultz2021a). Among males, these stresses often lead to heightened levels of violence that can become disruptive as well as having lethal consequences (baboons: Wittig et al. Reference Wittig, Crockford, Lehmann, Whitten, Seyfarth and Cheney2008; chimpanzees: Wittig et al. Reference Wittig, Crockford, Langergraber and Zuberbühler2014; humans: Dunbar Reference Dunbar2022a). The second is a natural tendency for animals that are foraging together to drift apart as their activity schedules become desynchronised, resulting in the inevitable fragmentation of social groups (Sigg & Stolba Reference Sigg and Stolba1981; King et al. Reference King and Cowlishaw2009; Harel et al. Reference Harel, Loftus and Crofoot2021).
In less social species, this gives rise to unstable herds that convene and disperse as circumstances dictate. In contrast, species that live in stable social groups, as most primates do, face both problems simultaneously, and solutions that counteract these forces are necessary if they are to be able to live in large groups. Hamadryas baboons (Papio hamadryas) provide a particularly clear example of this. The modular structure of their groups allows very considerable dispersal of the constituent harems (distances of up to 1 km); without behaviours such as “notifying” that allow harem males to negotiate the general direction of travel during the day, and hence which midday waterholes and evening sleeping sites the units will converge on (Kummer Reference Kummer1968; Sigg & Stolba Reference Sigg and Stolba1981), it would be impossible to maintain band coherence during foraging. In the absence of such solutions, stable social groups of more than a dozen animals could not exist (Dunbar & Shultz Reference Dunbar and Shultz2021a). Yet primates (including humans), together with a handful of other mammals, live in large stable groups.
I argue here that it was the need to manage these two problems that selected for many of the distinctive behavioural and cognitive features that are characteristic of primates and, by extension, underpin much of human sociality. To set the scene, I first review these stresses in more detail and then suggest three ways in which primates have dealt with them. The three strategies are not mutually exclusive alternatives; rather, they represent a suite of strategies that, I suggest, were adopted stepwise as the need to evolve ever-larger groups in response to environmental challenges in some lineages led to increasing levels of stress.
1.1. Why group-living is stressful
Living in groups incurs costs that act as dispersive forces that drive individuals apart. Ecologists have always assumed that these costs are ecological, but in fact, the costs of ecological competition are modest and by far the least important. The substantive costs are entirely social. They come in two forms: animals drifting apart when their activities become desynchronised and the fact that group-living is highly stressful.
Over the course of a day, animals naturally drift apart simply because some individuals continue feeding while others go to rest (Ruckstuhl & Kokko Reference Ruckstuhl and Kokko2002; Ruckstuhl & Neuhaus Reference Ruckstuhl and Neuhaus2002; Calhim et al. Reference Calhim, Shi and Dunbar2006; Dunbar & Shi Reference Dunbar and Shi2008). This is largely a consequence of differential rates of gut-fill in small and large-bodied individuals (Ruckstuhl & Neuhaus Reference Ruckstuhl and Neuhaus2002). However, when group size is large and/or day journeys are long, even primate groups are likely to become dispersed and, in the limit, fragment during the day’s foraging (chimpanzees; Lehmann et al. Reference Lehmann, Korstjens and Dunbar2007a; baboons: Dunbar & Dunbar Reference Dunbar and Dunbar1975; Anderson Reference Anderson1981; Sigg & Stolba Reference Sigg and Stolba1981; Dunbar Reference Dunbar1992; King & Cowlishaw Reference King and Cowlishaw2009; Castles et al. Reference Castles, Heinsohn, Marshall, Lee, Cowlishaw and Carter2014; Harel et al. Reference Harel, Loftus and Crofoot2021). Fig. 1 illustrates this with data from baboon (Papio) populations.
Fissioning index for 24 baboon (Papio) populations plotted against study group size. Unfilled symbols: group size <35; grey symbols: groups 35-75; filled symbols: groups >75. Fission index: 0 = never (compact groups that always travel together); 1 = sometimes (groups become dispersed during foraging but always sleep together); 2 = often (groups fragment during foraging and sometimes sleep apart). Source of data: Dunbar & Shultz (Reference Dunbar and Shultz2023).

One reason for this is that animals of different body size have different walking speeds (Harel et al. Reference Harel, Loftus and Crofoot2021). Although all cursorial mammals pace at approximately the same rate (strides per minute), larger-bodied animals have longer legs, and therefore cover more ground per stride (Alexander & Jayes Reference Alexander and Jayes1983; Schmidt-Nielsen Reference Schmidt-Nielsen1984). As a result, when travelling long distances, longer-legged individuals quickly outdistance the shorter-legged members of their group. This is compounded by the fact that smaller-bodied individuals have smaller stomachs that fill more quickly, obliging them to go to rest when larger-bodied animals want to continue foraging. This is a particular problem for ruminants and other foregut fermenters (e.g., howler monkeys and Old World colobine monkeys): because the microbiota that are responsible for fermentation are highly sensitive to heat, fermentation can only occur when the animal is at complete rest (van Soest Reference van Soest1994). If a group of animals is to remain together, some mechanism is needed to ensure that individuals are motivated to synchronise their activity cycles so as to overcome the centrifugal forces that would naturally result in group fragmentation. In effect, they have to suppress the temptation to continue foraging when others want to rest (or continue resting when others want to forage). Failure to do this results in the dispersal of groups, as can readily be observed in many herd-forming ungulates and flock-forming birds.
The second problem is a consequence of the fact that mammalian menstrual endocrinology is extremely sensitive to social stress: even modest levels of stress result in lowered fertility as group size increases across a wide range of mammal taxa (sciurid rodents: Hoogland Reference Hoogland1981; Armitage Reference Armitage1991; Geraghty et al. Reference Geraghty, Muroy, Zhao, Bentley, Kriegsfeld and Kaufer2015; ungulates: von Borell et al. Reference von Borell, Dobson and Prunier2007; Einarsson et al. Reference Einarsson, Brandt, Lundeheim and Madej2008; primates: Rowell Reference Rowell1970; Bowman et al. Reference Bowman, Dilley and Keverne1978; Abbott Reference Abbott1984; Abbott et al. Reference Abbott, Keverne, Moore and Yodyingyuad1984; humans: Zacur et al. Reference Zacur, Chapanis, Lake, Ziegler and Tyson1976; Schenker et al. Reference Schenker, Meirow and Schenker1992; Sheiner et al. Reference Sheiner, Sheiner, Potashnik, Carel and Shoham-Vardi2003; An et al. Reference An, Sun, Li, Zhang and Ji2013; Pettay et al. Reference Pettay, Lahdenperä, Rotkirch and Lummaa2016; Schliep et al. Reference Schliep, Mumfored, Vladutiu and Ahrens2015). In some cases, conflict between females can even cause the complete suppression of puberty (callitrichid primates: Abbott et al. Reference Abbott, McNeilly, Lunn, Hulme and Burden1981; most canids: Moehlman & Hofer Reference Moehlman, Hofer, Solomon and French1997; suricates: Young et al. Reference Young, Carlson, Monfort, Russell, Bennett and Clutton-Brock2006; Clutton-Brock et al. Reference Clutton-Brock, Hodge, Flower, Spong and Young2010; mole rats: Bennett Reference Bennett1994; Faulkes et al. Reference Faulkes, Abbott and Jarvis1990). This effect is essentially a by-product of the mechanism that manages postpartum amenorrhoea so as to prevent female mammals becoming pregnant while lactating or under reproductively adverse circumstances (Prior Reference Prior2022). Just how sensitive the system is to stress is demonstrated by the fact that simply removing a subordinate female from her social group will, within a matter of weeks, trigger puberty and initiate menstrual cycling in callitrichids (Abbott et al. Reference Abbott, McNeilly, Lunn, Hulme and Burden1981; Saltzman et al. Reference Saltzman, Schultz-Darken and Abbott1997). This physiological response to stress imposes strict limits on group size (the “infertility trap”: Dunbar & Shultz Reference Dunbar and Shultz2021a).
This infertility effect is completely independent of access to food, as has been demonstrated in both wild (chimpanzees: Pusey & Schroepfer-Walker Reference Pusey and Schroepfer-Walker2013; Dunbar Reference Dunbar2019; baboons: Dunbar Reference Dunbar1980; Hill et al. Reference Hill, Lycett and Dunbar2000; Huchard & Cowlishaw Reference Huchard and Cowlishaw2011) and captive (baboons: Garcia et al. Reference Garcia, Lee and Rosetta2006) populations. This is a well-studied problem in domestic stock: crowding has an insidious effect on fertility even when forage is unlimited (Dobson & Smith Reference Dobson and Smith2000; Dobson et al. Reference Dobson, Fergani, Routly and Smith2012; Pierce et al. Reference Pierce, Hemsworth, Rivalland, Wagenmaker, Morrissey, Papargiris, Clarke, Karsch, Turner and Tilbrook2008). In fact, food intake only seems to influence fertility adversely under conditions of near-starvation (i.e., when loss of body mass is >15%) (ungulates: Clutton-Brock et al. Reference Clutton-Brock, Guinness and Albon1983; Albon et al. Reference Albon, Mitchell and Staines1983; mongoose: Creel et al. Reference Creel, Dantzer, Goymann and Rubenstein2013; primates: Williams et al. 2007; Gesquiere et al. Reference Gesquiere, Altmann, Archie and Alberts2018; humans: Dean Reference Dean1949; Stein & Susser Reference Stein and Susser1975; Arends et al. Reference Arends, Cheung, Barrack and Nattiv2012).
The mechanism that causes this infertility effect is now well understood. Endorphin upregulation is triggered by any social or physical stress as part of the organism’s natural adaptation to physical or psychological pain (the main function of the endorphin system). However, as with most biological processes, chronic overactivation has deleterious consequences (Amir et al. Reference Amir, Brown and Amit1980). One of these is that it inhibits the production of gonadotropin-releasing hormone (GnRH) in the hypothalamus, thereby blocking the luteinising hormone (LH) surge that precipitates ovulation (Ferin Reference Ferin1984; Howlett & Rees Reference Howlett and Rees1986; Laatikainen Reference Laatikainen1991; Kalra & Kalra Reference Kalra and Kalra1996; Ziegler et al. Reference Ziegler, Widowski, Larson and Snowdon1990; Seifer & Collins Reference Seifer and Collins1990; Gordon et al. Reference Gordon, Hodgen and Richardson1992; McNeilly et al. Reference McNeilly, Forsyth and McNeilly1994; McNeilly, Reference McNeilly2001a; Son et al. Reference Son, Ubuka, Millar and Kanasaki2012; Iwasa et al. Reference Iwasa, Matsuzaki, Yano and Irahara2017). This has been confirmed experimentally using naloxone (an endorphin antagonist that counteracts the uptake of endorphins) or by disengaging the hypothalamus, thereby re-engaging the ovulatory hormonal cascade (Li et al. Reference Li, Knox and O’Byrne2010; Geraghty et al. Reference Geraghty, Muroy, Zhao, Bentley, Kriegsfeld and Kaufer2015). In some species (e.g., rats), this system is so sensitive that even the stress induced by being physically handled for short periods can be sufficient to block the cyclic release of gonadotrophins necessary for ovulation (Euker & Reigle Reference Euker and Riegle1973).
These two processes act in tandem. Fragmentation during foraging is an unavoidable natural process (an outcome of random foraging decisions), but it is exacerbated by the infertility trap – and any other factor (e.g., direct conflict) that causes animals to move apart from each other. Herd-living species like many large-bodied ungulates solve the infertility trap but ignore the fragmentation problem (the cheap solution), but group-living species like primates have to be able to solve both at the same time if they are to maintain group coordination (the expensive solution).
1.2. How mammals defuse the stresses of group-living
In mammal species that have simpler social arrangements (e.g., some rodents and carnivores, as well as many artiodactyl ungulates that live in small, unstructured, usually unstable groups), the infertility trap is so insidious that it limits the number of adult females that can live together as a group to about five – and then only when environmental conditions make it worth the females’ while bearing the cost of declining fertility. In these species, fertility declines linearly and steeply with the number of females in the group (Fig. 2, thin linear “basal mammal” line on the left side of the graph). This is also true of some primates (e.g., callitrichids: dotted linear line immediately adjacent to basal mammal line). In these species, females actually do best to live on their own (i.e., not with other females), but if environmental circumstances make group-living preferable, they can do so – but only up to a point, and at an increasing cost in terms of fertility.
The infertility trap results in declining fertility in mammals as a direct result of stress created by low-level conflict between reproductive females. In basal mammals, birth rate per adult female per year (adjusted for litter size) declines linearly with the number of females in the group, thereby placing a severe limit on group size. In order to live in larger groups, primates (and some other more social mammals) use coalitions to buffer themselves against this effect, but are unable to prevent the infertility trap eventually imposing a limit on group size. Thin solid line: mean slope for 5 weakly social mammals (European badger, feral goats, babirousa, marmots and a Neotropical ctenomyid rodent); heavy dotted line: callitrichids; heavy dashed and solid lines: representative genera for four distinct grades of primates illustrating increasingly ∩-shaped fertility curves created by females using coalitions to defuse the stresses of group-living. Horizontal line demarcates replacement rate (defined as the production of two surviving offspring at the end of a lifetime); any population that falls below this line will go extinct. For details and data: Dunbar & Shultz (Reference Dunbar and Shultz2021a).

In primates, with their multi-generational groups, a group of five females equates to a total group size of 15-20 individuals (Dunbar et al. Reference Dunbar, MacCarron and Shultz2018a). Many primates live in stable groups of this size. However, a significant number of primates live in much larger groups, and their fertility is a ∩-shaped function of group size (Dunbar & Shultz Reference Dunbar and Shultz2021a). These ∩-shaped distributions turn out to be trade-off between the infertility cost (driven by female-female interactions) and the benefits provided by group-living (driven by group size as a whole, principally reflecting protection from predators, but in some cases also by the presence of males) (see Dunbar et al. Reference Dunbar, MacCarron and Robertson2018b; Dunbar & MacCarron Reference Dunbar and MacCarron2019; Dunbar Reference Dunbar2019; Dunbar & Shultz Reference Dunbar and Shultz2021a). These ∩-shaped distributions cluster into four distinct groupings (Dunbar & Shultz Reference Dunbar and Shultz2021a). Fig. 2 illustrates these four clusters with a representative genus in each case (Lemur, Semnopithecus, Papio, and Theropithecus, respectively). For these ∩-shaped distributions, fertility is maximised, respectively, at 6, 11, 16, and 45 adult females (equivalent to total group sizes of approximately 15, 35, 50, and 135). The first three turn out to be the mean values for the different group/brain size grades in the primate Social Brain relationship (Dunbar et al. Reference Dunbar, MacCarron and Shultz2018a; Dunbar & Shultz Reference Dunbar and Shultz2021b). The fourth (largest) cluster is characteristic of a small number of herd-forming species such as Papio hamadryas and Theropithecus gelada (both of which have a modular form of fission-fusion sociality).
Those mammals that live in larger groups typically adopt one of two strategies to deal with the infertility trap. The great majority do so by forming unstable herds that convene as and when necessary (e.g., the appearance of a predator or the appearance of a temporarily rich resource patch) and then disperse once proximity to others is no longer necessary (Sutcliffe et al. Reference Sutcliffe, Dunbar and Wang2016). These herd-forming species (mostly large-bodied ungulates and mysticete cetaceans) avoid the infertility trap by allowing individuals to join and leave on a daily or even hourly basis; in this way, they can defuse the stresses without necessarily sacrificing the benefits of being able to form large groups when they need to do so. In these species, individuals are effectively anonymous, with personalised relationships beyond mother and young-at-heel being rare. Conflicts are typically managed on an ad hoc basis using directly observable dyadic power differentials, often based on simple visual cues. The cognitive demands are minimal beyond those required for the more conventional functions of foraging.
The problem faced by herding species, however, is that they run the risk that individuals might be caught by a predator after they have left a herd and are alone. Most animals foraging on their own or in small groups devote a lot more time to monitoring the environment (both for predators and for hostile conspecifics) (Lazarus Reference Lazarus1978; Bertram Reference Bertram1980; Underwood Reference Underwood1982; Shi et al. Reference Shi, Dunbar and Beauchamp2010; Beauchamp et al. Reference Beauchamp, Li, Yu, Bednekoff and Blumstein2021), as indeed do humans (Dunbar et al. Reference Dunbar, Cornah, Daly and Bowyer2002). In contrast, primates (and a small number of other largely species-poor intensely social taxa, including equids, tylopods [camelids], some sciurids and suricates, elephants and delphinids: Shultz & Dunbar Reference Shultz and Dunbar2010a; Dunbar & Shultz Reference Dunbar and Shultz2021a) have opted to form stable social groups: doing so means that individuals minimise the risk of being caught on their own when a predator happens to appear. The cost they bear is that groups can only downsize by undergoing fission, and, if predation risk is to be reduced to acceptable levels, fission cannot happen unless the group is at least twice the habitat-imposed minimum size (Dunbar et al. Reference Dunbar, Korstjens and Lehmann2009). The effect is to force the animals into the region of the infertility trap as reflected in the right-hand side of the ∩-shaped fertility curve. To do so, they need to evolve strategies to move the infertility trap as far to the right as possible.
In most cases, the stability of larger bonded groups is underpinned by female-female (but sometimes female-male) coalitions that buffer individuals against the pressures created by the close proximity of too many other individuals. These species, both primate and non-primate alike, are characterised by relationships that involve repeated, often exclusive affiliative interactions and are often lifelong (Dunbar & Shultz Reference Dunbar and Shultz2010). In contrast to herding species, where vigilance is directed out of the group to the environment, vigilance behaviour in bonded species is mainly directed inside the group, with a strong focus on social partners (and especially so in pair-living species) (Dunbar Reference Dunbar1983; Dunbar & Shultz Reference Dunbar and Shultz2010). These coalitions allow females to defer the impact of the infertility trap, thereby enabling them to live in (somewhat) larger groups without incurring a fertility penalty.
1.3. The mechanisms of social bonding
In primates, bonded relationships (“friendships”: Silk Reference Silk2002; Dunbar & Shultz Reference Dunbar and Shultz2010; Massen et al. Reference Massen, Sterck and de Vos2010; Brent et al. Reference Brent, Chang, Gariépy and Platt2014) are established and maintained by a dual process mechanism that involves two distinct neural channels that work independently, but in tandem with each other. One involves the brain’s endorphin system and is underpinned by social grooming; it operates below the consciousness “horizon” in that it involves emotional “raw feels” (Kirk Reference Kirk1994). In effect, this provides the pharmacological “glue” that creates an emotional bond that draws two individuals towards each other (Depue & Morrone-Strupinsky, Reference Depue and Morrone-Strupinsky2005; Dunbar Reference Dunbar2010a, Reference Dunbar2018a; Machin & Dunbar Reference Machin and Dunbar2011; Loseth et al. Reference Loseth, Ellingsen and Leknes2014). The other is more explicitly cognitive and involves the evaluation of relationship quality, and gives rise to the Social Brain Hypothesis (SBH) (Dunbar & Shultz Reference Dunbar and Shultz2017, Reference Dunbar and Shultz2021b).
The bonding function of grooming is a consequence of the fact that grooming (“soft touch”) triggers the release of endorphins in both primates (Fabre-Nys et al. Reference Fabre-Nys, Meller and Keverne1982; Keverne et al. Reference Keverne, Martensz and Tuite1989) and humans (Nummenmaa et al. Reference Nummenmaa, Tuominen, Dunbar, Hirvonen, Manninen, Arponen, Machin, Hari, Jääskeläinen and Sams2016; Fidanza et al. Reference Fidanza, Polimeni, Pierangeli and Martini2021). The sweeping hand actions involved in grooming trigger the central endorphin system via a highly specialised peripheral nerve system, the afferent c-tactile (CT) nerves (Björnsdotter et al. Reference Björnsdotter, Löken, Olausson, Vallbo and Wessberg2009; Olausson et al. Reference Olausson, Wessberg, Morrison, McGlone and Vallbo2010; Jackson et al. Reference Jackson, McGlone and Haggarty2021). The receptors for these nerves in the skin respond only to light, slow stroking at exactly 3 cm/sec (Croy et al. Reference Croy, Luong, Triscoli, Hofmann, Olausson and Sailer2016), approximately the speed of hand movements during grooming. In humans, light stroking on the torso has been shown, using positron emission tomography neuroimaging, to upregulate the central endorphin system (Nummenmaa et al. Reference Nummenmaa, Tuominen, Dunbar, Hirvonen, Manninen, Arponen, Machin, Hari, Jääskeläinen and Sams2016). Aside from the fact that the sense of bonding created by the endorphin system ensures that social partners stay near each other, the frequency of social interaction has been shown to predict willingness to provide coalitionary support in primates (Fig. 3) (Seyfarth & Cheney Reference Seyfarth and Cheney1984; Dunbar Reference Dunbar1980, Reference Dunbar2018b), as well as altruistic aid in humans (Sutcliffe et al. Reference Sutcliffe, Dunbar, Binder and Arrow2012; Burton-Chellew & Dunbar Reference Burton-Chellew and Dunbar2015).
Grooming relationships build defensive coalitions. Mean (±se) probability that an individual gelada female will come to the support of another female from her harem if the latter is threatened by members of a neighbouring harem, as a function of whether the pair devote more or less than 5% of their available social time to grooming each other. Redawn from Dunbar (Reference Dunbar2018b).

Although much has been made of oxytocin as a social hormone, in fact its role is much more limited than that of the endorphin-dopamine system (which acts in tandem in a push-pull arrangement) (Pearce et al., Reference Pearce, Wlodarski, Machin and Dunbar2017a, Reference Pearce, Wlodarski, Machin and Dunbar2018). In humans, oxytocin plays an important role in facilitating dyadic (mainly romantic) relationships, but it plays little or no role in social predispositions or in managing larger-scale effects relating to social networks (Pearce et al. Reference Pearce, Wlodarski, Machin and Dunbar2017a, Reference Pearce, Wlodarski, Machin and Dunbar2018). Even so, many of the effects it produces in the context of dyadic relationships may actually be due to the fact that the circumstances that elicit an oxytocin response also elicit endorphins (Pearce et al. Reference Pearce, Wlodarski, Machin and Dunbar2017a). More importantly, endorphins have two major benefits over oxytocin as a bonding agent. First, they have a much longer half-life. Oxytocin has a half-life measured in minutes, whereas endorphins have a half-life measured in hours, and so remain functional in the system for much longer (Dunbar Reference Dunbar2021a). Second, oxytocin works by influencing only your personal behaviour: it is something you either have or don’t have, depending on the particular genetic alleles you possess for its receptors (Pearce et al. Reference Pearce, Wlodarski, Machin and Dunbar2017a). In contrast, you can influence someone else’s endorphin response by, for example, grooming them. For more details, see Dunbar (Reference Dunbar2021a).
The social relationships created by this bonding mechanism turn out to have direct fitness consequences. Longitudinal field studies have yielded considerable evidence that, at least in species that live in large groups, socially well-embedded females recover faster from injuries, have lower stress responses to disruptive events, live longer, give birth to more offspring and have more surviving offspring than socially less successful females (chimpanzees: Wittig et al. Reference Wittig, Crockford, Weltring, Langergraber, Deschner and Zuberbühle2016; baboons: Silk et al. Reference Silk, Alberts and Altmann2003, Reference Silk, Beehner, Bergman, Crockford, Engh, Moscovice, Wittig, Seyfarth and Cheney2009, Reference Silk, Beehner, Bergman, Crockford, Engh, Moscovice, Wittig, Seyfarth and Cheney2010; Wittig et al. Reference Wittig, Crockford, Lehmann, Whitten, Seyfarth and Cheney2008; Archie et al. Reference Archie, Altmann and Alberts2012; Cheney et al. Reference Cheney, Silk and Seyfarth2016; macaques: McFarland & Majolo Reference McFarland and Majolo2013; Lehmann et al. Reference Lehmann, Majolo and McFarland2016; Brent et al. Reference Brent, Ruiz-Lambides and Platt2017; wild horses: Linklater et al. Reference Linklater, Cameron, Minot and Stafford1999; Cameron et al. Reference Cameron, Setsaas and Linklater2009; Nuñez et al. Reference Nuñez, Adelman and Rubenstein2015; dolphins: Frère et al. Reference Frère, Krützen, Mann, Connor, Bejder and Sherwin2010). The evidence for humans is even greater, and in many cases based on extremely large prospective samples: the number and quality of close friendships is the single best predictor of mental health and wellbeing, physical health and wellbeing, and even future longevity (see, for example, Holt-Lunstad et al. Reference Holt-Lunstad, Smith and Layton2010; Rosenquist et al. Reference Rosenquist, Fowler and Christakis2011; Cruwys et al. Reference Cruwys, Dingle, Haslam, Haslam, Jetten and Morton2013; Yang et al. Reference Yang, Boen, Gerken, Li, Schorpp and Harris2016; Kim et al. Reference Kim, Benjamin, Fowler and Christakis2016; Cundiff & Matthews Reference Cundiff and Matthews2018; Santini et al. Reference Santini, Jose, Koyanagi, Meilstrup, Nielsen, Madsen, Hinrichsen, Dunbar and Koushede2021). One reason for the direct health benefits of sociality is that the endorphin system upregulates natural killer (NK) cells in the white blood cell system and hence, in effect, tunes the immune system (Mandler et al. Reference Mandler, Biddison, Mandler and Serrate1986; Puente et al. Reference Puente, Maturana, Miranda, Navarro, Wolf and Mosnaim1992; Sarkar et al. Reference Sarkar, Sengupta, Zhang, Boyadjieva and Murugan2012).
The second component of the dual process mechanism involves a suite of high-order cognitive skills that include causal reasoning, analogical reasoning, one-trial learning, the comparison of alternative strategic outcomes (so as to be able to choose the best), self-control (inhibition), and mentalising (understanding others’ intentions). These are all associated, in particular, with the brain’s frontal pole (Brodman Areas BA10), a brain region found only in anthropoid primates (Passingham & Wise Reference Passingham and Wise2012). These form the underlying basis for the SBH, and are a reminder that the SBH is not simply a matter of memory capacity and associative learning. In anthropoid (but apparently not strepsirrhine) primates, these forms of meta-cognition allow relationships to be managed in a more nuanced, fast tracked way (Dunbar Reference Dunbar1998, Reference Dunbar2018a; Brent et al. Reference Brent, Chang, Gariépy and Platt2014) by allowing individuals to make rapid, reliable inferences about others’ intentions, as well as allowing them to evaluate whom they have coalitions with, how powerful those allies are, and how likely they are to come to their ally’s aid (Datta Reference Datta and Hinde1983). In large part, this is made possible by the capacity, unique to anthropoid primates, to engage in one-trial learning (i.e., the ability to infer a generalisation from a single observation), in contrast to the more laborious process of associative learning on which all other mammals and birds have to rely (Passingham & Wise, Reference Passingham and Wise2012). The cognitive processes that underpin the SBH are computationally (Dávid-Barrett & Dunbar Reference Dávid-Barrett and Dunbar2013) and neurophysiologically (Lewis et al. Reference Lewis, Birch, Hall and Dunbar2017) very expensive.
2. Primate solutions to the fragmentation problem
While coalitions might solve the problem of the infertility trap, they do not per se solve the problem of how to maintain group coordination. When groups become larger, they will inevitably disperse and fragment, thus setting an upper limit to their size. In the limit, groups will simply fragment into their constituent coalitions. To ensure that the group as a whole remains coordinated and stays together (and hence provides the benefits that accrue from group-living), those species that need to live in large groups must find some mechanism that enables group cohesion to be maintained. There are, in principle, three possible ways to solve this problem. They focus on structural, behavioural, and cognitive solutions. These strategies are not necessarily alternatives, but rather are additive in that they may be solutions to successive glass ceilings on group size. Essentially, they differ in terms of the costs that the animals have to incur in terms of investment in time-costly activities like grooming or energy-expensive brain tissue to support sophisticated cognition.
2.1. Structural solutions (Hypothesis H1)
The simplest option for maintaining group cohesion is to use network structure to solve the coordination problem. When seen from the perspective of the individual, social networks naturally partition into two distinct components: grooming cliques (in network terminology, their degree, defined as the number of grooming partners an individual has) and grooming chains (n-cliques, defined as the set of individuals linked together by a chain of such ties, even though they do not all individually groom each other) (Kudo & Dunbar Reference Kudo and Dunbar2001; Lehmann & Dunbar Reference Lehmann and Dunbar2008; Escribano et al. Reference Escribano, Doldán-Martelli, Cronin, Haun, van Leeuwen, Cuesta and Sánchez2022). To some extent, the distinction reflects that drawn by Granovetter (Reference Granovetter1973) between “strong” and “weak” ties in human social networks.
Fig. 4 illustrates the difference when seen from the perspective of one individual (the black square at the centre). The strong ties consist of those in the inner circle with whom the individual has direct grooming connections (white squares), making up its degree; the weak ties are those in the outer circles with whom Ego has only indirect ties (triangles) (making up its n-clique when added to its degree). If we map the personal chains of every group member on top of each other, we have a highly interconnected web-like structure with pairs of individuals often connected via several different intermediaries (a feature characteristic of robust networks). Well-connected networks have a spider’s web structure, and are less likely to fragment than hub-and-spoke networks, where the links that hold the clique together are only those between Ego and its individual partners, with no ties between the partners themselves.
A schematic representation of the layered structure of primate and human egocentric social networks, as seen from the perspective of an individual ego (central black square). Unfilled squares: individuals that form strong links to Ego (direct grooming connections); unfilled triangles: individuals that form weak links to Ego (indirect grooming connections, or “friends-of-friends”). Width of lines connecting triangles indicates strength of relationship; dashed ties indicate indirect connections. The layers of the network are indicated by the shaded circles. Inset: bond strength indicating gravitational drag on dyads willingness to disperse as a function of network layer (i.e., relationship strength).

When an individual cannot afford the time to groom every member of its group, the extended chains of indirect relationships formed by n-cliques allow groups to maintain coordination during travel even when groups become moderately dispersed (Castles et al. Reference Castles, Heinsohn, Marshall, Lee, Cowlishaw and Carter2014). Each individual simply has to monitor its principal partner(s), and a “friends-of-a-friend” effect will keep the group together as an extended chain. This is essentially the mechanism bird flocks and fish schools use to maintain coordination: the rule “do whatever your neighbour does” is about as complicated as it needs to get (Ballerini et al. Reference Ballerini, Cabibbo, Candelier, Cavagna, Cisbani, Giardina, Lecomte, Orlandi, Parisi and Procaccini2008; Sumpter Reference Sumpter2010; Vicsek & Zafeiris Reference Vicsek and Zafeiris2012). This solution allows an animal to focus its attention on a very small number of individuals and then, in effect, get the other relationships for free through a form of gravitational drag. However, because the gravitational “force” created by the bonding will decline with each successive step removed from the individual (Fig. 4, inset), its “reach” (in respect of the size of group it can integrate) will inevitably set a limit on group size because of fracture lines between subnetworks (Fig. 5). As a strategy, however, it has the obvious advantage that it requires minimum investment in either additional grooming time or high-order cognitive abilities.
Schematic representation of the impact of increasing group size on network integrity (and hence group-level social cohesion) when individuals are limited in the number of others they can groom with (their degree). When animals can only groom with 2-3 other individuals, small groups of 4-5 individuals are well integrated (most individuals can groom with each other, or with two friends of a third party); but as group size increases, network chains become elongated and less integrated, until finally in large groups individuals are forced to choose which subgroup to focus on (creating natural fracture lines between subgroups that are only weakly linked).

If primates solve their coordination problem solely by structural means, four predictions follow: (H1a) degree size and (H1b) the size of grooming chains should both increase proportionately to group size as individuals try to maintain relationships with as many group members as possible within the limits of the time they have available. Furthermore, (H1c) grooming chains should encompass most (if not all) of the adults in a group so as to hold them in a structural web, but (H1d) there is likely to be a limit beyond which effective coordination is difficult to maintain. The main issue is what the limiting group size is if only this mechanism is available.
2.2. Behavioural solutions (Hypothesis H2)
In primates (and humans), the functionality of a bonded relationship (as indexed by willingness to provide a service) depends directly on the time invested in it (Fig. 3; see also Madsen et al. Reference Madsen, Tunney, Fieldman, Plotkin, Dunbar, Richardson and McFarland2007; Sutcliffe et al. Reference Sutcliffe, Dunbar, Binder and Arrow2012; Roberts & Dunbar Reference Roberts and Dunbar2015; Dunbar Reference Dunbar2018a; Dunbar et al. Reference Dunbar, Frangou, Grainger and Pearce2021a). In addition, the fact that, so far as we know, endorphin upregulation only occurs in the recipient of grooming, not the groomer, means that bond strength depends on grooming being reciprocated: grooming pairs have to take it in turns to groom each other. The obvious solution is to increase the time devoted to social grooming. However, there are two issues. One is whether animals have sufficient spare capacity in their time budgets to devote more time to grooming. The other issue is whether it is better to groom with more individuals (increase the degree) or devote more time to existing grooming partners in order to maximise relationship quality so as to guarantee their willingness to provide coalitionary support.
The time budgeting issue is more serious than many might suppose. Grooming has to compete with other pressing ecological demands (foraging, travel, rest, etc). Unlike ungulates and many other mammals, anthropoid primates have an active day limited to 12 hours (they are either nocturnal or diurnal, but never both). As a result, most species’ time budgets are close to their limit with little genuinely free time to play with (Pollard & Blumstein Reference Pollard and Blumstein2008; Dunbar et al. Reference Dunbar, Korstjens and Lehmann2009). Spare capacity becomes available only when animals can reduce the demand for other activities.
Although all species rest at some point during the day, and this might seem like free time, much of it is actually forced on the animals by the twin demands of digestion and thermoregulation, and so is not available for other activities (Dunbar et al. Reference Dunbar, Korstjens and Lehmann2009; Korstjens et al. Reference Korstjens, Lehmann and Dunbar2010). The brain is extremely sensitive to overheating, and all tropical mammals are obliged to rest during the middle of the day when high ambient temperatures exceed the very narrow thermal tolerance of brain tissue (Mount Reference Mount1979; Roberts & Dunbar Reference Roberts and Dunbar1991). Korstjens et al. (Reference Korstjens, Lehmann and Dunbar2010) showed that “enforced rest” (as opposed to idle time) was mainly determined by ambient temperature (see also Dàvid-Barrett & Dunbar Reference Dávid-Barrett and Dunbar2016). Even humans are not exempt from this in the tropics (the well-known siesta phenomenon: Yetish et al. Reference Yetish, Kaplan, Gurven, Wood, Pontzer, Manger and Siegel2015). Indeed, Monsivias et al. (Reference Monsivais, Bhattacharya, Ghosh, Dunbar and Kaski2017) showed that the latitudinal variation in the length of the siesta in southern Europe correlates with ambient temperature. In addition, the thermal costs of digestion are a particular problem for folivores, because the bacteria responsible for fermentation in the foregut are very sensitive to heat and, since any activity necessarily generates endogenous heat, fermentation will automatically shut down if animals are active (van Soest Reference van Soest1994). Nor is time sharing by grooming while resting an option: grooming itself generates significant quantities of internal heat (Giorgi et al. Reference Giorgi, Arlettaz, Christe and Vogel2001).
Travel time offers some scope for adjustment: in poor quality habitats where longer day journeys are required, for example, Papio baboons travel up to four times faster than they do in rich habitats so as to reduce the time they need to devote to moving between food patches without having to sacrifice foraging time (Dunbar Reference Dunbar1992). The scope for adjusting time in this way is, however, limited: walking faster is energetically expensive and this then has to be made up either by increased foraging or by reducing day journey length. Since all cursorial mammals walk at the same pace (strides per minute), the only way of increasing travel speed without incurring an energetic cost is to increase leg length (Alexander & Jayes Reference Alexander and Jayes1983; Schmidt-Nielsen Reference Schmidt-Nielsen1984), a solution adopted by some open country primates (e.g., patas monkeys) but more specifically by early Homo. However, the savings appear to be modest and limited to cursorial rather than arboreal species.
Realistically, the only activity category that can easily be adjusted to free up significant quantities of time is feeding, and the only viable way of doing this is to switch to a diet that offers higher nutrient extraction rates. That usually means a more frugivorous diet since fruits are nutrient-dense compared to leaves (whose nutrients are locked up within indigestible cellulose cell walls: van Soest Reference van Soest1994). When feeding time demand is experimentally reduced by providing access to high-quality food sources, monkeys typically devote the time freed up to additional grooming rather than, say, resting (Altmann & Muruthi Reference Altmann and Muruthi1988; Bourgeaud et al. Reference Borgeaud, Jankowiak, Aellen, Dunbar and Bshary2021). In one experimental manipulation, for example, free-living animals in a food-rich environment fed for 5-15% less time than in a food-poor environment, and invested that extra time in social interaction (Bourgeaud et al. Reference Borgeaud, Jankowiak, Aellen, Dunbar and Bshary2021). The biggest benefits come for folivores, however: in colobines, it is possible to switch between the small groups characteristic of the folivorous species (Colobus) and the much larger groups characteristic of frugivorous species (Piliocolobus) simply by switching feeding time equations between the models for the two genera (Korstjens & Dunbar Reference Korstjens and Dunbar2007).
How this extra grooming time is used, however, will depend on how time invested impacts on relationship quality. Broadly speaking, in both primates (Dunbar Reference Dunbar1980) and humans (Sutcliffe et al. Reference Sutcliffe, Dunbar, Binder and Arrow2012; Burton-Chellew & Dunbar Reference Burton-Chellew and Dunbar2015), the more time devoted to a relationship, the stronger it will be. However, this relationship could take one of two forms. If the relationship between grooming time and relationship strength is asymptotic (i.e., there is an upper limit beyond which relationship quality does not improve even if more time is invested in it), then the best use of extra social time would be to invest in creating additional allies. On the other hand, if the effect is essentially linear (i.e., the more time spent grooming a partner, the stronger the relationship, with no upper limit), then the best strategy would be to continue investing more heavily in existing grooming partners so as to maximise bond strength.
This option, then, would predict that (H2a) as group size increases, animals will increase the amount of time devoted to social grooming. If tie quality is an asymptotic function of investment, (H2b) degree will be unrelated to group size (and might even decrease if core allies become more important as group size increases: Dunbar & Shultz Reference Dunbar and Shultz2007a), but (H2c) grooming time per degree will increase with group size (more time is invested in existing allies). However, if tie strength is an increasing linear function of investment, the opposite predictions will hold: (H2b*) degree will correlate with group size, but (H2c*) average time devoted to individual grooming partners should be unrelated to group size. A final prediction is (H2d) that, given the resting (fermentation) demand imposed by folivory, there will be a trade-off between time devoted to social grooming and the species’ degree of dietary folivory.
2.3. Cognitive solutions (Hypothesis H3)
If the combined structural and behavioural options are insufficient to allow large groups to form, a third possibility is that animals could resort to more sophisticated cognitive mechanisms that allow them to manage relationships with those individuals with whom they do not themselves groom (weak ties). There are two potential ways this might increase the stability of large groups. One is by allowing animals to synchronise their activities rather than pursuing their own immediate interests by continuing to feed and move when others want to rest, as we observe in ungulate herds. As the famous Stanford marshmallow experiments (Mischel & Ebbesen Reference Mischel and Ebbesen1970) demonstrated, inhibiting desired behaviour does not come easily, even in humans. The second is more subtle and involves being able to manage relationships with individuals with whom one does not interact regularly (i.e., those beyond the immediate circle of direct grooming relationships). Minimising the risk of triggering or escalating unnecessary conflict with these individuals becomes crucial if the aim is to avoid driving them out of the group. This requires the ability to understand intentions (mentalising) as well as inhibit behaviour.
A number of studies have rather naively used inhibition as an index of foraging skill (among many others, see MacLean et al., Reference MacLean, Hare, Nunn, Addessi, Amici, Anderson, Aureli, Baker, Bania, Barnard, Boogert, Brannon, Bray, Bray and Brent2014; Stevens Reference Stevens2014; Isaksson et al. Reference Isaksson, Urhan and Brodin2018; Johnson-Ullrich & Holekamp Reference Johnson-Ulrich and Holekamp2020). In fact, self-control plays a much more important role in social contexts: it allows us to decide whether to escalate a conflict or walk away from it, and is central to the capacity to maintain behavioural synchrony with other group members (i.e., being willing to go to rest when the others want to rest, rather than continuing to feed) (Dunbar & Shultz Reference Dunbar and Shultz2023b). In humans, this capacity has been shown to be negatively associated both with the monoamine oxidase-A gene (the so-called “warrior gene” linked with antisocial behaviour) and positively associated with the volume of specific brain regions (Moffitt et al. Reference Moffitt, Caspi, Rutter and Silva2001; Carlisi et al. Reference Carlisi, Moffitt, Knodt, Harrington, Ireland, Melzer, Poulton, Ramrakha, Caspi, Hariri and Viding2020). A number of long-term human studies have shown that the capacity for self-control during early childhood is a very strong predictor of adult social competencies, relationship stability, and antisocial behaviour (Tremblay et al. Reference Tremblay, Pihl, Vitaro and Dobkin1994; Moffitt et al. Reference Moffitt, Caspi, Rutter and Silva2001; Bari & Robbins Reference Bari and Robbins2013; Pearce et al. Reference Pearce, Wlodarski, Machin and Dunbar2018, Reference Pearce, Wlodarski, Machin and Dunbar2019).
On its own, however, inhibition is not sufficient to manage relationships. Being able to read others’ behavioural cues correctly, especially when both signal repertoire and group size are very large, is an essential requirement. Knowing how to finetune one’s responses to others’ threats or entreaties, or knowing whom to avoid conflict with because they have more allies (third-party knowledge), allows animals to minimise the risk of triggering group fragmentation unintentionally by escalating conflict.
In humans, individual differences in mentalising competences correlate with differences in the volume of the default mode neural network – the single largest integrated connectome in the brain that links together, via massive white matter connections, processing (grey matter) units in the prefrontal cortex, the temporo-parietal junction and the temporal lobe, with important extensions down into the limbic system and the cerebellum (Andrews-Hanna et al. Reference Andrews-Hanna, Reidler, Sepulcre, Poulin and Buckner2010; Mars et al. Reference Mars, Neubert, Noonan, Sallet, Toni and Rushworth2012; Li et al. Reference Li, Mai and Liu2014). In humans, the volume of the default mode network correlates with mentalising competences and other indices of social skill (Carrington & Bailey Reference Carrington and Bailey2009; van Overwalle, Reference van Overwalle2009; Andrews-Hanna et al., Reference Andrews-Hanna, Reidler, Sepulcre, Poulin and Buckner2010; Powell et al. Reference Powell, Lewis, Dunbar, García-Fiñana and Roberts2010, Reference Powell, Lewis, Roberts, García-Fiñana and Dunbar2012, Reference Powell, Kemp, Dunbar, Roberts, Sluming and García-Fiñana2014; Lewis et al. Reference Lewis, Rezaie, Browne, Roberts and Dunbar2011; Kiesow et al. Reference Kiesow, Dunbar, Kable, Kalenscher, Vogeley, Schilbach, Marquand, Wiecki and Bzdok2020; Bzdok & Dunbar Reference Bzdok and Dunbar2020, Reference Bzdok and Dunbar2022; Smallwood et al. Reference Smallwood, Bernhardt, Leech, Bzdok, Jefferies and Margulies2021). Analogous findings have also been reported for macaques (Hayashi et al. Reference Hayashi, Akikawa, Kawasaki, Egawa, Minamimoto, Kobayashi and Hasegawa2020; Roumazeilles et al. Reference Roumazeilles, Schurz, Lojkiewiez, Verhagen, Schüffelgen, Marche and Sallet2021). Individual differences in the volume of the default mode network, but especially its grey matter processing units, also correlate with the size of individuals’ personal social networks in both monkeys (macaques: Sallet et al. Reference Sallet, Mars, Noonan, Andersson, O’Reilly, Jbabdi, Croxson, Jenkinson, Miller and Rushworth2011; Testard et al. Reference Testard, Brent, Andersson, Chiou, Negron-Del Valle and Sallet2022; baboons: Meguerditchian et al. Reference Meguerditchian, Marie, Margiotoudi, Roth, Nazarian, Anton and Claidière2020) and humans (Lewis et al. Reference Lewis, Rezaie, Browne, Roberts and Dunbar2011; Powell et al. Reference Powell, Lewis, Roberts, García-Fiñana and Dunbar2012; Kanai et al. Reference Kanai, Bahrami, Roylance and Rees2012; Kwak et al. Reference Kwak, Joo, Youm and Chey2018; Noonan et al. Reference Noonan, Mars, Sallet, Dunbar and Fellows2018). Powell et al. (Reference Powell, Lewis, Roberts, García-Fiñana and Dunbar2012) used path analysis to show that, in humans at least, the causal structure is: prefrontal cortex volume determines mentalising ability, which in turn determines personal social network size.
The default mode network exhibits significant enlargement in anthropoid primates compared to Lemur catta (the most social of the strepsirrhines) in ways that correlate with their much more sophisticated social relationships (Roumazeilles et al. Reference Roumazeilles, Lange, Benn, Andersson, Bertelsen, Manger and Mars2022). Similarly, semi-solitary nocturnal strepsirrhines like Galago lack the diversified temporal lobe connections characteristic of the more intensely social Old World monkeys and apes (Braunsdorff et al. Reference Braunsdorf, Freches, Roumazeilles, Eichert, Schurz, Uithol, Bryant and Mars2021). Unusually for anthropoids, callitrichids lack a frontal pole (Passingham & Wise, Reference Passingham and Wise2012), which may account for the fact that their groups are more role-based than relationship-based as in all other anthropoids (Dunbar Reference Dunbar1995a,b; Lukas & Clutton-Brock Reference Lukas and Clutton-Brock2018; Dunbar & Shultz Reference Dunbar and Shultz2021b; Shultz & Dunbar Reference Shultz and Dunbar2022). In primates, the default mode neural network, with its substantial white matter connections and grey matter processing units, makes up a very large proportion of the non-visual cortex, thereby contributing significantly to the disproportionately large brains characteristic of anthropoid primates (Finlay et al. Reference Finlay, Darlington and Nicastro2001; Yeo et al. Reference Yeo, Krienen, Sepulcre, Sabuncu, Lashkari, Hollinshead and Buckner2011). At some level, this even applies in birds: controlling for body mass, phylogeny, and relevant ecological variables, species that have lifelong pairbonds (which are inevitably demanding in terms of behavioural coordination and trust) have significantly larger brains than either annual pairbonders or those species that mate promiscuously (Shultz & Dunbar Reference Shultz and Dunbar2010c).
This option predicts that species with larger groups will (H3a) have disproportionately larger neocortices, (H3b) score higher on executive function skills, (H3c) exhibit greater capacity for self-control, and (H3d) have greater mentalising skills than those that habitually live in smaller groups. Note that hypothesis H3a differs from the conventional analysis for the SBH, which normally plots group size against brain size. Here, we are asking whether differences in group size predict differences in neocortex size, and this will not necessarily yield the same result (see Dunbar & Shultz Reference Dunbar and Shultz2023).
3. Testing the hypotheses
It is important to be clear about the analytical strategy I adopt here. We are not comparing between mutually exclusive explanations. Rather, we are trying to establish whether primates adopted any or all of the three solutions, and if so, whether they were adopted at specific group sizes. Hence, I do not test between the hypotheses; rather, I test the efficacy of each hypothesis in turn by asking whether there are limits on the size of group each could bond. Note also that we are only interested in the constraints on evolving large groups, and not the reasons why large groups evolve. Consequently, I make no assumptions about why animals should want to live together in groups. Any plausible explanation will do. Instead, my question is: if animals want to live in large groups, how do they maintain group cohesion against the powerful internal (Infertility Trap, ecological competition) and external (activity scheduling, vegetation density) forces that cause groups to disperse.
3.1. Data and analyses
More detailed discussion of the data, indices, and analyses is provided in the Supplementary Information (SI). I summarise here only the main points that bear directly on the analyses that follow.
Although many studies have combined data on grooming and proximity for constructing social networks, I consider only networks based on grooming because my focus is specifically on how animals create bonded relationships. Spatial proximity is a consequence of having a relationship, not the mechanism used to create it. More importantly, proximity and grooming networks often correlate poorly (Castles et al. Reference Castles, Heinsohn, Marshall, Lee, Cowlishaw and Carter2014; Smith-Aguilar et al. Reference Smith-Aguilar, Aureli, Busia, Schaffner and Ramos-Fernández2019; Collier et al. Reference Collier, Albery, McDonald and Bansal2022), suggesting that they have different underlying motivations.
Data on the distribution of dyadic grooming frequencies were obtained for 92 social groups (953 adults) from 36 species (mean = 2.4, range 1-13, groups/species) belonging to 20 genera (mean = 1.8, range 1-7, species/genus). Only data for post-puberty individuals are included in the analyses (for present purposes, termed adults), since immatures always side with their mothers during group fission and are not themselves party to decisions to stay or go. To avoid the common problem of network matrix saturation (i.e., everyone grooms with everyone else), I follow conventional practice and consider only strong ties, using the mean number of grooming bouts per available dyad (i.e., total grooming divided by total number of dyads) as a criterion for differentiating between strong and weak ties (for technical justification, see Fig. S1).
The strong tie grooming matrix for each group was used to calculate two structural indices: the number of adult grooming partners for each individual (its degree) and the number of individuals connected to each other directly through a grooming relationship or indirectly through a chain of such relationships (an n-clique, indexed as all the individuals linked together by an unbroken chain of strong ties). Each individual in the group has a degree value between 0 and N-1 (where N is the total number of adults in the group). In contrast, n-cliques are a characteristic of a group, not an individual; they can vary between 1 (every individual is in a separate n-clique) and N (all group members belong to a single n-clique), but the total number of individuals in all the n-cliques of a group must sum to total group size. In Fig. 4, the individual identified by the black square has a degree of 3, but belongs to an n-clique of 19 (every symbol in the graph can be reached from every other symbol via a chain of direct grooming relationships). Each of these indices was averaged first for each group, then for each species, and finally for each genus.
I include both males and females in the data. I do so for two reasons. First, while some primate species (e.g., Papio, Cercopithecus) are female-philopatric (females provide the stable core to the group), others (e.g., Ateles, Pan) are male-philopatric. Both face the same cohesion problem, despite engineering group cohesion in very different ways. Second, even in female-bonded species, females who lack female grooming/coalition partners sometimes use the group’s male(s) as substitutes, treating the male in much the same way as they would a female grooming partner. Examples include Theropithecus (Dunbar Reference Dunbar1984), Papio (Smuts, Reference Smuts1985), Pan (Rawlings et al. Reference Rawlings, van Leeuwen and Davila-Ross2023), and Gorilla (Harcourt & Stewart Reference Harcourt and Stewart2007).
Group size is uncontroversial for most primate species, but open to misinterpretation in those species that have fission-fusion social systems (Dunbar & Shultz Reference Dunbar and Shultz2021b, Reference Dunbar and Shultz2023). I use community size for species that have an atomistic fission-fusion social system (i.e., live in communities that disperse into small foraging parties during the day: Ateles and Pan) and the reproductive unit (harem) for species with a modular fission-fusion system (Theropithecus). However, it is important to be mindful, in the latter case, that some functions may be subserved by higher grouping levels (e.g., the clan of 3-5 harems that regularly associate together). Where group size is potentially an issue (mainly grooming), I run separate analyses for both group types. For further details, see SI.
Although data are available for a much wider range of taxa on some behavioural ecology variables, in order to maintain sample homogeneity, I consider only taxa that are included in the network analyses. As an index of inhibition (self-control), I combine data on two tasks: the A-not-B task from MacLean et al., Reference MacLean, Hare, Nunn, Addessi, Amici, Anderson, Aureli, Baker, Bania, Barnard, Boogert, Brannon, Bray, Bray and Brent2014) and the temporal discounting task from Stevens (Reference Stevens2014). To combine these, I converted the original data for each task to standard deviations and then averaged the two scores (see Dunbar & Shultz Reference Dunbar and Shultz2023). Note that I did not include the data on the cylinder task of MacLean et al., Reference MacLean, Hare, Nunn, Addessi, Amici, Anderson, Aureli, Baker, Bania, Barnard, Boogert, Brannon, Bray, Bray and Brent2014) because, although it has been mistakenly used as an inhibition task in many studies, it is in fact a causal reasoning task (Dunbar & Shultz Reference Dunbar and Shultz2025).
For the reasons given in more detail in the Supplementary Information, the analyses are not corrected for phylogenetic autocorrelation for three reasons. First, there is no phylogenetic signal for group size or any other behavioural ecology variables in primates (Kamilar & Cooper Reference Kamilar and Cooper2013; Dunbar & Shultz Reference Dunbar and Shultz2021a, Reference Dunbar and Shultz2023a). Phylogenetic methods assume that traits are genetically inherited. The social traits considered herein are not genetically inherited as such in primates; they are primarily a response to environmental and demographic factors, hence their often remarkable variability across populations of the same species (Strier et al. Reference Strier, Lee and Ives2014). Second, in no analysis of primate data has any result ever differed when the same analysis has been run with and without phylogenetic correction (Shultz & Dunbar Reference Shultz and Dunbar2022). Third, and of more importance, the data are clearly characterised by grades. Current phylogenetic methods do not allow grades in datasets to be differentiated, unless they are strictly taxonomic. If there are natural grades in a dataset, we risk falling foul of the Simpson-Yule Paradox (a version of the Ecological Fallacy): this causes conventional ordinary least squares regression analyses to radically underestimate the slope (Dunbar & Shultz Reference Dunbar and Shultz2021b, Reference Dunbar and Shultz2023).
Data for both individual groups and genus averages are given in online SI Dataset-1 and Dataset-2, respectively. All statistical tests are 2-tailed. Where directional hypotheses are being tested, I use a 1-tailed test and indicate so. For graphical clarity, all analyses are shown at genus level; the equivalent results for all group- and species-level analyses are given in the SI.
3.2. Results
I first used statistical clustering methods to determine whether distinct grades can be discerned in the distribution of group sizes in the sample of taxa included in the present analysis (for details, see SI). We have used these methods to identify natural partitions in demographic datasets in a wide range of species and contexts (see SI). These methods essentially search for natural breaks in the cumulative distribution of data. The two methods I use here both agree that the sampled species can be differentiated into two distinct clusters (grades) in respect of group size (Fig. S2). Mean genus level group sizes for the two grades are 14.8±5.24 SD (with 5.6±1.96 adult females, N=13 genera; species-level mean = 13.9±5.3 with 7.6 females) for the lower grade and 36.0±5.39 (with 13.4±1.25 females, N=7 genera; species mean = 36.7±11.4 with 14.3 females) for the upper grade, with a natural breakpoint between the two grades at a group size of ∼25 (see SI, Fig. S2).
The basis of the analyses that follow, then, is how species manage to get from one adaptive state (small groups) to another (large groups). This question is not trivial: West et al. (Reference West, Massari, Culbreth, Failla, Bologna, Dunbar and Grigolini2020, Reference West, Dunbar, Culbreth and Grigolini2023) have shown that the fractal structure in both the distribution of primate group sizes (Dunbar et al. Reference Dunbar, MacCarron and Shultz2018a) and the internal structures of their groups (Hill et al. Reference Hill, Lycett and Dunbar2000; Dunbar Reference Dunbar2020; Dunbar & Shultz Reference Dunbar and Shultz2021b; Escribano et al. Reference Escribano, Doldán-Martelli, Cronin, Haun, van Leeuwen, Cuesta and Sánchez2022) are criticalities (points at which information flow round a social network is optimised). Network efficiency is maximised at the fractal values 5, 15, 50, 150, 500, and drops off significantly between them. In the valleys between the peaks, groups become less coherent. This makes it difficult to transit across the valleys between two optima. Instead, a phase transition is required in which novel traits need to be evolved to bridge the gap and allow a rapid transition to the next level. Needless to say, the implication is that the selection pressure must have been very considerable to make this necessary.
Note that, although the two strepsirrhine species (both highly social lemurs) and the New World platyrrhine monkeys are included in the lower grade, and the only ape (Pan) is in the upper grade, Old World monkeys appear in both grades, cutting across taxonomic families. This indicates a functional division rather than a phyletic one (as is also the case with the social brain data: Dunbar & Shultz Reference Dunbar and Shultz2021b). In all three analyses, Semnopithecus, Piliocolobus, Chlorocebus, Erythrocebus, Macaca, Papio, and Pan are assigned to the upper grade, and Lemur, Eulemur, Callithrix, Cebus, Sapajus, Saimiri, Alouatta, Ateles, Trachypithecus, Nasalis, Colobus, Cercopithecus, and Theropithecus (based on harem size) to the lower grade.
In the subsections that follow, I test the predictions for the three successive strategies as listed in section 2, distinguishing between these group size grades.
3.2.1. Structural solutions (Hypothesis H1)
In this subsection, I ask whether there is an upper limit on the size of group that can be bonded by a simple structural solution based on a friends-of-friends chain structure. I first plot n-clique size against mean degree in order to determine whether the number of individuals an animal can groom with directly (its degree) sets a limit on the reach of its grooming chain. I then plot group size (and, separately, the number of females in a group) against n-clique size to determine whether groups are structurally integrated through a grooming chain or have structural weaknesses (disconnections between n-cliques) where groups are likely to fragment while foraging. The key issues here are: (1) whether primate social groups consist of a single n-clique (group:n-clique ratio =1 – i.e., all adults are bound together in a single chain) or several unconnected n-cliques (group:n-clique ratio >1), and (2) at what group size the transition between these two occurs. In each case, I compare small and large clusters in order to determine whether they differ in their metrics.
Fig. 6 plots mean n-clique size against mean degree for the different genera as a function of the two group size clusters (see Fig. S3 for species- and group-level results). Overall, there is a significant linear regression (β=0.774, r2=0.599, t18=5.33, p<0.0001). However, the data clearly form two distinct grades: the slope (and the goodness-of-fit) is lower in genera with large social groups (β=0.558, r2=0.311, p=0.151) than in those with small social groups (β=0.827, r2=0.685, p<0.001), suggesting that the overall relationship may actually be asymptotic in the range of the upper grade.
Mean n-clique size plotted against mean degree for individual genera, differentiating genera with mean group size <25 (unfilled symbols, dashed regression) versus >25 (filled symbols, solid regression). Numbers beside symbols indicate genus: 1, Lemur; 2, Eulemur; 3, Callithrix; 4, Cebus; 5, Sapajus; 6, Saimiri; 7, Alouatta; 8, Ateles; 9, Trachypithecus; 10, Semnopithecus; 11, Colobus; 12, Piliocolobus; 13, Nasalis; 14, Cercopithecus; 15, Chlorocebus; 16, Erythrocebus; 17, Macaca; 18, Theropithecus; 19, Papio; 20, Pan. Data are given in SI Dataset-1.

An asymptotic relationship would suggest a maximum n-clique size of ∼9.7 at a degree size of ∼2.5, with further increases in degree not yielding a significant increase in n-clique size. The asymptotic relationship suggests that, in larger groups, individuals are making extra effort to groom personally with disproportionately more of their n-clique members. This suggests that, at this point, there is a switch in emphasis, with more emphasis being placed on strong ties than on weak ties. Fig. S7 gives the results of a contrasts analysis for the data in Fig. 6, just to confirm that the grades are not taxonomic in origin: in fact, the grades seem to represent mosaic adaptation within closely related taxa, not phase shifts between distantly related ones.
Fig. 7 plots the mean total group size and the mean number of adult females, respectively, against mean n-clique for each genus, differentiated by group size cluster. (Species and group-level plots are given in Figs. S4 and S5.) It is evident that the data form two parallel grades that differ in their number of reproductive females (5.6±2.0 versus 13.4±1.3; t18=9.48, p<0.0001). The mean ratio between the two grades is 2.4 for both the number of females and total group size. The grades do not differ significantly in n-clique size (means of 5.3±2.1 versus 7.1±1.9; t18=1.93, p=0.070), although they do differ significantly in degree (means of 2.12±0.72 versus 2.80±0.40, respectively; t18=2.88, p=0.010).
(a) Mean number of adult females per group and (b) mean group size for individual genera plotted against mean n-clique size, differentiating genera with mean group size <25 (unfilled symbols, dashed regression) versus >25 (filled symbols, solid regression). The social unit for Theropithecus is identified with the harem reproductive unit. Numbers beside symbols indicate genus, as defined in Fig. 6. Data are given in SI Dataset-1.

The female:n-clique ratios are of particular significance. A ratio of ∼1.0 would indicate that the number of females in the group is linearly determined by the size of the grooming chain (all the females in the group belong to a single n-clique); a ratio >1.0 indicates that each chain typically includes only a proportion of the females (implying that there are structural holes, or fracture lines, in the group’s grooming network that are fission risk points). In the lower grade, the female:n-clique ratios are not significantly different from unity (mean 1.29±0.72: t[ratio=1.0] = 1.27, df=11, p=0.247), indicating that most of the group’s females are included within a single grooming chain. In contrast, in the upper-grade genera, the ratio differs significantly from unity (t[ratio=1.0] = 4.92, df=8, p=0.001), and approximates 2 (mean 1.96±0.36), indicating that the females are typically divided between two (occasionally more) such chains. This implies that, in the upper-grade genera, there are natural fracture points where the group is partitioned into two or more disconnected subnetworks.
These results are summarised in the upper section of Table 1. They indicate that, although degree increases linearly with group size (albeit with some suggestion of an asymptotic relationship), the size of grooming chains (n-cliques) does not correlate with the number of individuals who need to be bonded together in large groups. While small groups typically consist of a single n-clique, structural constraints mean that large groups become subdivided into disconnected cliques, and hence are more at risk of fragmentation. It is striking that, as group size increases, upper-grade genera attempt to increase the number of the n-clique members they groom with in order to reinforce their ties (something that presages the behavioural solutions that we will examine in more detail in the next subsection).
Summary of predictions and results

* 0 = no relationship; +/- = significant positive/negative correlation. A pattern displayed as “0 … +” in the two columns implies an exponential relationship: the dependent variable is initially unrelated to group size, but increases exponentially after a threshold group size (e.g. 2a, 2b, 3c).
§ Larger groups score significantly higher (>) or lower (<) on trait than small groups, or do not differ (=)
These results suggest that simple structural adjustments to networks indices offer an effective solution for maintaining the cohesion and stability of small groups – but only up to group sizes of ∼25. Hence, this option cannot account for the structural stability of large groups. Some other mechanism is, therefore, needed if group coherence is to be maintained in these cases. The next subsection considers the extent to which a behavioural solution (principally, changes in grooming time) could achieve this.
3.2.2. Behavioural solutions (Hypothesis H2)
The behavioural option proposes that larger groups could be bonded by increasing grooming time, and devoting the extra time available either to strengthening existing relationships or to increasing the number of grooming partners (in effect, increasing the size of the grooming chain). I test three specific predictions: whether total time devoted to grooming increases with group size (and whether this differs between group size grades), whether the two group size grades differ in key grooming time indices (grooming time per group member, per adult female, and per degree) and, finally, whether the additional grooming time is created by shifting to a more frugivorous diet. Between them, these allow us to determine the extent to which animals are able to increase grooming time, and, if they can, how they choose to invest the extra grooming time gained. The latter depends on the functional relationship between the time invested in a relationship and its resulting strength, and the implication this has for how time can best be used.
Fig. 8 plots time devoted to grooming against group size. Note that the gelada (Theropithecus) is plotted in two positions (grey symbols): according to its harem size (datapoint 18) and according to its clan size (datapoint 21). Time spent grooming increases exponentially with group size (excluding gelada: linear: r2=0.504, F1,15=15.2, p=0.001; exponential: r2=0.402, F1,15=10.1, p=0.006; concave quadratic: r2=0.588, F2,14=7.1, p=0.002). The datapoint for gelada clan size clearly fits this overall distribution much more closely than that for gelada harem size, and with a greatly improved fit for the overall distribution (including gelada: exponential: r2=0.497, F1,16=15.8, p=0.001; concave quadratic: r2=0.795, F2,15=29.0, p<0.0001). The fact that a nonlinear (quadratic) regression gives a better fit than a linear one indicates that time devoted to grooming increases disproportionately as group size increases, compared to what we would expect if they were simply grooming additional individuals at a constant rate. This suggests that the animals are investing increasingly more heavily in bonding as group size increases.
Mean time devoted to grooming for individual genera plotted against mean group size, differentiating genera with mean group size <25 (unfilled symbols) versus >25 (filled symbols). Theropithecus (grey symbols) is shown for two different definitions of group size: 18, harem size; 21, clan size (typically 3-4 harems). The regression line is the exponential fit to the data excluding gelada. The upturn on the left-hand side is due mainly to callitrichids and might reflect the fact that they are pair-living. Numbers beside symbols indicate genus, as defined in Fig. 6. Data are given in SI Dataset-2.

If more time is available for grooming, it can be used in one of two ways: by grooming more individuals (increased degree) or devoting more time to the same number of primary allies (stronger bonding). To determine which strategy upper-grade taxa prefer, I compare values for total grooming time as well as grooming time per group member, per adult female and per degree for the two grades in Fig. 9. In order to plot these on the same graph, all scores were converted to standard deviates from the respective overall mean for each index. Given the results in Fig. 8, Theropithecus is included with clan size in the upper grade for Fig. 9. The difference between the two grades is significant for total grooming (t16=3.55, p=0.001) and grooming time per degree (t16=2.20, p=0.021), but not for grooming time per group member (t16=0.06, p=0.476) or per adult female (t16=0.223, p=0.409) (1-tailed tests in each case as a directional prediction is specified). This suggests that upper-grade genera (including Theropithecus) devote more time to social grooming than the lower-grade genera, and that they invest the additional time disproportionately in their existing core grooming partners – at the same time as slightly increasing the size of their grooming circle (i.e., degree: Fig. 6).
Mean (±1se) standard deviations for grooming variables, differentiating genera with mean group size <25 (unfilled symbols) versus >25 (filled symbols). The social unit for Theropithecus is identified with the harem reproductive unit. Total groom is the mean percent of the day devoted for grooming by all sampled populations of the genus (from Dunbar 2022). Groom/group, groom/female, and groom per degree defined as the mean total grooming time for species divided by mean group size (from Dunbar et al. Reference Dunbar, MacCarron and Shultz2018a), by mean number of adult females (from Dunbar et al. Reference Dunbar, MacCarron and Shultz2018a) and by mean network degree (this study), respectively. Grooming data from Lehmann et al. (Reference Lehmann, Korstjens and Dunbar2007b).

Animals’ time budgets are not infinitely flexible, and in most cases they have little spare capacity to devote to additional grooming (Pollard & Blumstein Reference Pollard and Blumstein2008; Dunbar et al. Reference Dunbar, Korstjens and Lehmann2009). The easiest way of solving this problem is to switch to a more frugivorous diet since fruits require less processing time than leaves (which have high digestion costs) or insects (which have high search time costs). Fig. 10 plots the mean percent of time that individual genera devote to social grooming against the mean percentage of leaf in their diet. The pattern is very different for lower and upper-grade taxa (which includes Theropithecus). For lower-grade taxa, there is no relationship between grooming time and diet (linear regression: r2=0.085, p=0.445), but for upper-grade taxa, there is a significant negative relationship (r2=0.530, p=0.041) that asymptotes at the same level as the lower-grade taxa. It seems that a switch to an increasingly fruit-based diet frees up significant additional time from the foraging and resting time budgets to allow more time to be devoted to grooming.
Mean time spent in social grooming (percent of 12-hour day) for individual genera as a function of the percentage of the diet composed of leafage for upper grade (filled symbols) and lower grade (unfilled symbols) taxa. Numbers beside symbols indicate genus, as defined in Fig. 6. Data are given in SI Dataset-2.

In a comparative analysis of brain size in primates, Grabowskia et al. (Reference Grabowskia, Kopperud, Tsuboib and Hansen2023) found that, in primates, the switch from polygynandry-with-frugivory to polygynandry-with-folivory was invariably accompanied by a reduction in brain size – of a magnitude sufficient to result in a 50% reduction in brain size for folivores over the time span of the phylogeny. Not only do folivores not have sufficient spare capacity in their time budgets to provide for extra grooming, but it seems that they also have smaller brains as a result of the constraint on nutrient throughput – which means less neural tissue to support smart cognition.
The results for these tests are summarised in the middle section of Table 1. None of the grooming indices correlates with group size in the lower grade, but two (total grooming time and grooming time per degree) do so in the upper grade, giving rise to an exponential overall relationship between group size and total grooming time. In addition, it seems that only upper-grade genera resort to a trade-off between grooming time and diet; hence, it is only in these taxa who can opt for a behavioural solution for maintaining cohesion in large groups.
Overall, these results suggest that, once group size exceeds ∼25, animals seek to strengthen their core alliances by investing more heavily in grooming with allies, and that to be able to do so, they have to alter their diet so as to free up extra time. However, there is a limit to which time budgets can be adjusted to allow extra grooming time to be created. More importantly, it is clear from the structural analyses in Figure 7 that the increase in grooming time is mainly used to allow individuals to reinforce bonds with their n-clique members, not with the group as a whole. We are still left with the problem of how they prevent the other n-clique(s) in their group from drifting away during foraging once groups get large enough to consist of several disconnected subgroups. In the next subsection, I explore the possibility that they use “smart (social) cognition” to manage relationships with the weak-tie members of their group.
3.2.3. Cognitive solutions (Hypothesis H3)
In this subsection, I test the hypothesis that the upper-grade genera use “smart social cognition” to manage weak ties with individuals that they do not interact with directly on a regular basis. Testing this by examining the way cognition is used to manage relationships is challenging for two reasons. First, demonstrating that individual differences in specific cognitive skills correlate with relationship management would require data at a level of detail that would be extremely difficult to collect, never mind study experimentally. Second, our current understanding of how specialised forms of social cognition are used is extremely limited, even in humans (the best studied species). For example, there is considerable experimental and neuroimaging evidence for humans showing that individual differences in mentalising correlate with social network size (Dunbar Reference Dunbar2018a), but in reality, we have no idea how these skills are actually used to do this. I will, instead, test this hypothesis indirectly by asking whether, in general, upper-grade genera have better social cognitive capacities than lower-grade genera. To do this, I compare the two group size clusters for performance on four relevant cognitive indices (neocortex ratio, executive cognition, self-control, and mentalising). We know from the human literature that the latter two indices are directly involved in managing social relationships; the first two provide the neural and cognitive underpinnings that make these skills possible (Deaner et al. Reference Deaner, Isler, Burkart and van Schaik2007; Shultz & Dunbar, Reference Shultz and Dunbar2010a).
Fig. 11 plots the data for the four cognitive indices, with scores again transformed to standard deviations of the respective means. There are no data for Theropithecus for any of these indices. I consider only genera that are included in the sample of network data. However, in the case of the mentalising index, data are available for only three such genera; I therefore included all seven genera studied by Devaine et al. (Reference Devaine, San-Galli, Trapanese, Bardino, Hano, Saint Jalme, Bouret, Masi and Daunizeau2017) and assigned these to the lower and upper grades as appropriate for the mean group size for their genus. For all four indices, upper-grade genera score at higher levels than lower-grade genera. Although the differences are individually significant only for neocortex ratio and executive cognition (neocortex: t16=2.29, p=0.018; executive cognition: t8=3.74, p=0.003; self-control: t7=1.26, p=0.124; mentalising: t4=0.80, p=0.118; 1-tailed tests in each case as the hypotheses being tested are directional), the results are all in the same direction. Using all the taxa available for executive function from Shultz & Dunbar (Reference Shultz and Dunbar2010c) yields the same result for a significantly larger sample (t18=2.10, p=0.003). Combining the four tests using Fisher’s meta-analysis for small independent samples (Sokal & Rolf Reference Sokal and Rolf1995) yields χ2=28.10 (df=2*4=8, p=0.0005), indicating that, overall, the results are consistently more positive than would be expected by chance if there was no underlying trend.
Mean (±1se) standard deviations for four cognition variables, differentiating genera with mean group size <25 (unfilled symbols) versus >25 (filled symbols). A score of 0 indicates the overall mean value for the sampled genera. Neocortex ratio data are from Dunbar & Shultz (Reference Dunbar and Shultz2021b); executive cognition is the arcsin transform of the proportion of correct trials on 8 standard executive function tasks, not including inhibition tasks (from Shultz & Dunbar Reference Shultz and Dunbar2010b); self-control is performance on an A-not-B task (from Shultz & Dunbar Reference Shultz and Dunbar2010b); the mentalising data (excluding one orangutan datapoint for an individual deemed to have Down syndrome) are from Devaine et al. (Reference Devaine, San-Galli, Trapanese, Bardino, Hano, Saint Jalme, Bouret, Masi and Daunizeau2017). All data except those for mentalising are for the sampled genera only; since there only three of the sampled genera have mentalising index scores, all the genera sampled by Devaine et al. are included and assigned to the relevant grade.

Although all three cognitive indices increase with group size, they are in fact better described as forming a set of three grades similar to those observed with neocortex ratio (see Dunbar & Shultz Reference Dunbar and Shultz2021a) (executive cognition: F2,7=34.16, p=0.0002, ΔBIC2vs3=−39.1 vs -46.1 = 7.0; inhibition: F2,6=49.3, p=0.0002, ΔBIC2vs3=55.2 vs 46.1 = 9.1; mentalising: F2,3=41.7, p=0.006, ΔBIC2 vs 3=32.7 vs 25.1 = 7.6; with the smaller Bayesian Information Criterion value comparing a partition into 2 versus 3 grades being the more significant, where ΔBIC=2 indicative of a significant difference at p≈0.05). This suggests that these cognitive indices change in a stepwise rather than a continuous fashion, just as neocortex ratio does, signalling the presence of grades in the data.
A principal components analysis of the three indices with the largest common sample (neocortex ratio, executive cognition, and inhibition) indicates that these are best explained by a single dimension with high individual factor loadings (λ=0.853, 0.933, and 0.860, respectively, explaining 78.0% of the variance). (If we include mentalising with values for the other genera estimated from total brain size using the regression equation from Devaine et al., this also yields a single factor with equally high loadings: λ=0.962, 0.998, 0.998, and 0.896, respectively, explaining 93.0% of the variance.)
Given this, I created a single index by summing the standard deviations for the three indices (neocortex ratio, executive cognition, and self-control), and plotted this generalised cognitive index against mean taxon group size (Fig. 12). Overall, there is a significant linear relationship (dashed line: F1,6=12.48, p=0.012). However, there is a clear suggestion of a series of phase shifts (or grades) with successive uplifts to new stable levels at group sizes of 15-20 and ∼40 (indicated by the stepwise solid line). The species in the lowest grouping in Fig. 12 are those from the lowest grade (I) in the social brain relationship (see Dunbar & Shultz Reference Dunbar and Shultz2021b); those in the middle grouping from grade II; and those in the upper grouping from grade III.
Summed cognition index (sum of standard deviation score on three cognition indices, excluding mentalising) plotted against mean group size for individual genera. Dashed line is the linear regression through the data. The stepped thick line indicates what appears to be successive phase shifts in the data (see text).

The results from these tests are summarised in the bottom section of Table 1. As predicted, genera that live in large groups perform better on high-order socio-cognitive functions than those that live in small groups. Although cognitive skills evolve piecemeal as group sizes increase across the primates, Fig. 12 suggests that they only reach their fullest development at a third phase of evolution when groups exceed about 40 in size. This suggests that there may be a series of glass ceilings that, when they are successfully breached, act to lift species onto successively higher socio-cognitive planes in such a way as to extend the range of group sizes that can be supported.
4. Patterns in primate social evolution
Overall, the results suggest that, in terms of network structure, this sample of primates divides into two distinct social grades: (1) genera that have small groups with fewer females, and grooming chains (n-cliques) that include all the adult females in the group, versus (2) genera that have large groups with more adult females and significant substructuring (more than one n-clique per group). Female:n-clique ratios approximating unity (as in the lower grade) suggest that the reach of direct and indirect grooming imposes a limit on the number of females that can live together without resulting in substructuring. In contrast, the scaling ratio of ∼2 for the upper-grade genera suggests that larger groups arise by postponing fission that, in the lower-grade genera, would inevitably have occurred at the size of the n-clique (and, under conditions of low predation risk, does in fact occur even in upper-grade genera: Dunbar et al. Reference Dunbar, MacCarron and Robertson2018b; Dunbar & MacCarron Reference Dunbar and MacCarron2019). The distribution of genera in these two grades is essentially the same as those that appear in grades I/II and III in the social brain graph of Dunbar & Shultz (Reference Dunbar and Shultz2021b).
In both grades, the size of the female cohort and total group size are an asymptotic function of extended grooming subnetwork (n-clique) size, suggesting that there are structural limits to the size of group that can be maintained as a coherent entity through personalised relationships. To increase group size beyond this limit, additional behavioural and cognitive mechanisms are needed in order to maintain cohesion. This suggests that only certain group sizes are possible, a finding confirmed both by the fractal distribution of primate group sizes (Dunbar et al. Reference Dunbar, MacCarron and Shultz2018a; Dunbar & Shultz Reference Dunbar and Shultz2021b) and by the fact that these numbers appear to act as attractors in terms of the efficiency of information flow through the system (West et al. Reference West, Massari, Culbreth, Failla, Bologna, Dunbar and Grigolini2020, Reference West, Dunbar, Culbreth and Grigolini2023). Fig. 7b suggests that the limits on the number of females in the two grades are ∼6 and ∼14, respectively. This is in close agreement with the finding that, in primates, fertility is optimised at female cohort sizes of 6.9 and 13.6 respectively (Dunbar & Shultz Reference Dunbar and Shultz2021a) in the two grades that correspond to those in Fig. 7b. These equate to upper limits on group size of ∼18 and ∼37 (Fig. 7a), close to the previously identified mean values for group size at ∼16 and ∼31 (Dunbar et al. Reference Dunbar, MacCarron and Shultz2018a).
Table 1 indicates whether each of the predictions was confirmed separately for genera with either small or large groups, and then, in the right-hand column, whether genera with large groups performed at a higher level on the trait than those with smaller groups. Taken together, these results suggest that species with smaller group sizes (those between about 10 and 25) rely on structural solutions to hold the group together. Once group size exceeds ∼25, novel behavioural and/or cognitive solutions are needed if a species is to maintain coherent groups. Both social grooming and social cognition provide ways of doing this, but do so by exploiting different processes at different costs. The first may necessitate a switch in diet to make more time available for grooming, whereas the second requires investing in energetically expensive brain tissue in order to upgrade cognitive abilities. Investing in grooming time allows animals to increase the number of individuals they maintain personalised grooming relationships with (degree, and hence indirectly n-clique) and hence appears first. Cognitive solutions seem to be especially important once group size exceeds ∼40, probably because they allow animals to manage weak ties beyond the number of individuals they can groom with.
Species are not, of course, obliged to pursue any of these options. At any given glass ceiling, they can: (a) stick with their current group sizes, and, as a result, remain in the habitats they have successfully occupied hitherto, (b) accept some degree of social disorganisation by living in less cohesive, more herd-like groupings in order to occupy a new riskier habitat without paying the cognitive cost required to change grade (but at some risk of being caught in a group of less than optimal size) or (c) opt to upgrade to one of the higher levels so as to be able to occupy new more risky habitats with more coherent groups.
That species do sometimes adopt the second option is evidenced by Saimiri (datapoint 6 in Fig. 12). In contrast to its sister-genus Sapajus (datapoint 5), Saimiri seems to have increased group size without a change in cognitive style. Despite being closely related, these two genera differ significantly in social style: Sapajus lives in cohesive, coherent social groups of modest size (mean sizes for four species = 16-21) whereas Saimiri groups are larger, notoriously chaotic and socially rather disorganised such that field workers have often had difficulty understanding their dynamics (mean sizes for three species = 18-54) (Dunbar et al. Reference Dunbar, MacCarron and Shultz2018a). Saimiri has much larger groups for its brain size than any of its sister genera, and sits on the least social grade of the primate Social Brain distribution that otherwise consists only of semi-solitary strepsirrhines (Dunbar & Shultz Reference Dunbar and Shultz2021b). The Old World monkey genus Miopithecus also has much larger (and much more disorganised) groups than its sister-genus Cercopithecus, and also sits on this least social grade with Saimiri (Dunbar & Shultz Reference Dunbar and Shultz2021b). Further examples are discussed in Dunbar & Shultz (Reference Dunbar and Shultz2021b).
The fact that advanced cognitive abilities may be necessary for the evolution of very large, stable groups might also explain the unusual modular fission-fusion social systems of Theropithecus gelada and Papio hamadryas with their characteristic herd-like organisation. To date, there has been no convincing explanation as to why these two species have this unusual kind of social arrangement. The habitats they occupy (montane alpine grasslands and subdesert scrubland, respectively) are ecologically very different, and the two species differ radically in their foraging patterns: one has very short day journeys with small harem-based groups that converge into large herds, while the other has unusually long day journeys in which large groups disperse into small harem-based foraging parties. This suggests that foraging strategies are not the explanation. The one environmental feature that does unite them, however, is that both live in high predator risk habitats with very few large trees available as refuges. The need to be able to form very large groups when under threat from predators appears to be critical to their ability to occupy these habitats.
One possibility, then, is that their peculiar social systems are a consequence of the fact that they lack the social cognitive skills of their congeners (both species have somewhat smaller brains than other baboons). In both species, the intermediate clan unit of 3-5 harems (30-40 animals) is a much better fit for their brain size to the Social Brain relationship than either the small harems or the larger herd-like groupings (bands) in which they are often found. Hence, their solution has been to develop a flexible herd-like fission-fusion social system capable of responding to circumstances by forming temporary herds out of small stable groups (in both cases, clans substructured into harems) while using increased investment in grooming to reduce the stresses involved. Both species devote a great deal more time to social grooming than any other primate, including their congeners (18.3% and 17.2% of the day, respectively, compared to 5.7-12.2% for the three woodland Papio baboon species: Dunbar Reference Dunbar1991). To maintain their largest natural groupings (bands that average 116.4 and 82.5, respectively, in size) as coherent stable groups would require an increase in cognitive skills and neocortex size that would place these two species midway between chimpanzees and modern humans. In effect, they seem to have been forced by their environment to go far beyond the group size that they can comfortably maintain, and their only way of coping with this is a form of fission-fusion sociality that is cognitively less demanding.
Several other primate genera may exhibit adaptations of a similar kind. Rhinopithecus and Nasalis, for example, have stable harem-like groups that sometimes form larger, unstable herds during foraging. Conversely, the Guinea baboon (Papio papio) and the two species of the terrestrial forest-living monkey Mandrillus (drills and mandrills) have groups that are (by conventional woodland baboon standards) unusually large (up to several hundred strong) and chaotic, but with hints of a weak harem-like structure (P. papio: Dunbar & Nathan Reference Dunbar and Nathan1972; Patzelt et al. Reference Patzelt, Zinner, Fickenscher, Diedhiou, Camara, Stahl and Fischer2011; Mandrillus: Hoshino Reference Hoshino1985; Abernethy et al. Reference Abernethy, White and Wickings2002; Brockmeyer et al. Reference Brockmeyer, Kappeler, Willaume, Benoit, Mboumba and Charpentier2015). It is notable that P. papio, at least, has rates of social grooming (18.9%: Dunbar Reference Dunbar1991) comparable to those observed in the gelada and hamadryas, and much as would be predicted for the typical size of their groups.
Humans may provide another example. In their “natural” state as hunter-gatherers, humans live in small, relatively stable bands (camp groups) of 35-50 that coalesce locally into larger communities (or clans), and beyond that into tribes (Dunbar Reference Dunbar1993; Zhou et al. Reference Zhou, Sornette, Hill and Dunbar2005; Hamilton et al. Reference Hamilton, Milne, Walker, Burger and Brown2007; Bird et al. Reference Bird, Bird, Codding and Zeanah2019). Clans appear to provide protection against external threats (Lehmann et al. Reference Lehmann, Lee, Dunbar, Dunbar, Gamble and Gowlett2014), but would create insurmountable stresses (reflected in a linear relationship between camp group size and homicide rates: Dunbar Reference Dunbar2022a) if they lived together. Instead, the stresses are defused by allowing the families of a clan to disperse between several bands, and then move between bands of the same clan when they feel the need. It seems that to lift group sizes from ∼50 (as in chimpanzees) to ∼150 and beyond (as in humans) required significant additional investment in cognition, as well as more efficient ways to increase grooming time via chorusing, dancing, and conversation (Dunbar Reference Dunbar2018a). Later, when there were significant pressures to live in very large permanent settlements, this had to be done not by further increases in cognitive abilities (brain size may actually be at its limit in modern humans), but by introducing a series of social institutions that allow the stresses to be defused (Dunbar Reference Dunbar2022a). These institutions were added stepwise as settlement sizes increased (Dunbar Reference Dunbar2022a) in a manner similar to the demographic glass ceilings suggested for primates.
5. The trade-off between bonding and cognition
Grooming provides the basis for coalition-formation in anthropoid primates (Dunbar Reference Dunbar1980, Reference Dunbar2018a; Seyfarth & Cheney Reference Seyfarth and Cheney1984), and this clearly serves a crucial function in buffering females against the stresses created by living in close proximity to others (Dunbar & Shultz Reference Dunbar and Shultz2021a). However, while formal coalitions are characteristic of all the upper-grade genera, they are rare (if not completely absent) among lower-grade genera (Shultz & Dunbar Reference Shultz and Dunbar2022). Nonetheless, while coalitions might solve the stress problem on their own, they do not directly solve the associated coordination problem, and this becomes increasingly problematic in very large groups. In large groups, animals beyond the immediate grooming circle may not necessarily have direct personal knowledge of who has allies and who does not.
Managing peripheral relationships beyond one’s own immediate grooming circle depends on the capacity to understand others’ relationships, often on the basis of very limited knowledge. This rests on being able to make rapid judgments about the meaning of signals, to infer rules from single observations (one-trial learning), and to understand the nature of third-party relationships so as to know when to escalate conflicts and when to avoid doing so (depending on whether or not the opponent has allies). Failure to be able to do this risks precipitating conflict and ultimately group fission.
Understanding third-party relationships has been reported for many of the upper-grade genera (Pan: Wittig et al. Reference Wittig, Crockford, Langergraber and Zuberbühler2014; Mielke et al. Reference Mielke, Samuni, Preis, Gogarten, Crockford and Wittig2017; Papio: Kummer et al. Reference Kummer, Götz and Angst1974; Gore Reference Gore1994; Macaca: Judge Reference Judge1991; Sinha Reference Sinha1998; Kubenova et al. Reference Kubenova, Konecna, Majolo, Smilauer, Ostner and Schülke2017; Chlorocebus: Cheney & Seyfarth Reference Cheney and Seyfarth1986; Cercocebus atys: Mielke et al. Reference Mielke, Samuni, Preis, Gogarten, Crockford and Wittig2017), but convincing evidence for such behaviour in any of the lower-grade genera has not so far been reported. Similarly, many upper-grade genera are able to evaluate the status of another individual on two or more dimensions simultaneously (e.g., kinship versus rank: chimpanzees: Mielke et al. Reference Mielke, Samuni, Preis, Gogarten, Crockford and Wittig2017; baboons: Bergman et al. 2003; macaques: Schino et al. Reference Schino, Tiddi and Polizzi di Sorrentino2006), whom an individual has alliances with (chimpanzees: Wittig et al. Reference Wittig, Crockford, Langergraber and Zuberbühler2014; baboons: Kummer et al. Reference Kummer, Götz and Angst1974; Cheney & Seyfarth Reference Cheney and Seyfarth1999; macaques: Datta Reference Datta and Hinde1983; Silk Reference Silk1999) and, on the basis of observed reputation, how trustworthy an individual might be (chimpanzees: Russell et al. Reference Russell, Call and Dunbar2008). Again, with the exception of Cebus (and even then they prioritise rank over relationship quality: Kajokaite et al. Reference Kajokaite, Whalen, Panchanathan and Perry2019), similar competences have not, so far, been reported for any of the lower-grade genera. Reconciliation (repairing relationships destabilised by conflict), a behaviour that depends on the ability to recognise that a relationship has been weakened (thus implying some minimal capacity to understand the social consequences of actions), has also been widely reported from upper-grade genera but rarely (and usually with mixed results – and then only in the form of physical proximity without involving conciliatory signals or active grooming) in lower-grade genera (Arnold et al. Reference Arnold, Aureli, Campbell, Fuentes, MacKinnon, Bearder and Stumpf2007).
These abilities are all dependent on executive function skills, and seem to play a crucial role in allowing primates in large groups to live together without destabilising the group either by misinterpreting others’ intentions or by acting in ways that are disruptively aggressive or demanding. They may thus explain why, in primates, rates of conflict within female dyads are negatively correlated with species’ group size (when controlling for neocortex size) (Cowl & Shultz Reference Cowl and Shultz2017; see also Dunbar Reference Dunbar2018b) when, all else equal, we might have expected aggression rates to increase with group size simply because, in large groups, there are more dyads that might fall out with each other, as well as the animals being under greater stress from crowding.
Being able to make rapid judgments about others’ intentions depends on being able to read signals accurately and quickly (Roberts & Roberts Reference Roberts and Roberts2020), and it is notable that, in primates, the complexity and size of both vocal and gestural communication repertoires are greater in species that live in larger groups and/or have bigger brains (McComb & Semple Reference McComb and Semple2005; Dobson Reference Dobson2009, Reference Dobson2012; Dunbar Reference Dunbar2012; Fichtel & Kappeler Reference Fichtel and Kappeler2022). Damjanovic et al. (Reference Damjanovic, Roberts and Roberts2022) found that chimpanzees that had larger social networks (i.e., n-cliques) used a wider range of gestural signals, with these being supplemented by vocal signals when addressing the weaker ties beyond the immediate set of grooming partners.
The capacity to infer intentions from behavioural signals (mentalising) may play a particularly important role in maintaining group cohesion (Roberts & Roberts Reference Roberts and Roberts2020). Some species, for example, have evolved signalling mechanisms explicitly designed to coordinate the timing and direction of travel. Examples include the “notifying” rituals of hamadryas baboons and some macaque species that allow group members to negotiate the foraging route they will take during the day (Kummer Reference Kummer1968; Sigg & Stolba Reference Sigg and Stolba1981; Sueur et al. Reference Sueur, Deneubourg and Petit2011; Smith et al. Reference Smith, Fichtel, Holmes, Kappeler, van Vugt and Jaeggi2022). Understanding the significance of these signals is only possible if others’ intentions can be correctly inferred (and generalised across circumstances).
The capacity to inhibit prepotent responses plays a particularly important direct role in managing conflict. However, for this to be socially effective, it must be combined with the capacity to mentalise (which might explain why the two capacities seem to co-evolve). In hamadryas baboons, for example, it allows many males to live together without competing directly for each others’ females (the phenomenon of “triadic differentiation” or “pairbond respect”: Kummer et al. Reference Kummer, Götz and Angst1974). A somewhat analogous form of behaviour is exhibited by gelada: young adult males trying to enter a harem as a follower (secondary male) typically identify and target a peripheral female who has only weak bonds with the harem male (Dunbar Reference Dunbar1984). If the male can persuade a peripheral female to groom with him, he will quickly become integrated into the social fabric of the harem because the harem male is rarely concerned enough to bother with him so long as he remains submissive – despite being very quick to detect when males are intent on taking over the whole harem (Dunbar Reference Dunbar1984).
In both species, triadic differentiation depends on an ability to infer something about other individuals’ relationships and intentions on the basis of very limited information. Kummer et al.’s (Reference Kummer, Götz and Angst1974) experiments on hamadryas baboons established that as little as 15 mins spent observing a pair interacting is sufficient for an observer male to infer whether or not the female is bonded to (or interested in) the male with whom she has been arbitrarily paired. If she appears to show little interest in her male, the observer male will make a concerted bid to wrest her from the male. Something similar occurs in humans: being seen to be attached to a male reduces the risk of harassment for women (Mesnick’s “bodyguard” hypothesis: Mesnick Reference Mesnick and Gowaty1997; see also Wilson & Mesnick Reference Wilson, Mesnick and Gowaty1997; Dunbar Reference Dunbar, Dunbar, Gamble and Gowlett2010b). These forms of behaviour make it possible for many adult males and females to coexist in large groups without constant conflict over females (“Deacon’s Dilemma”: Deacon Reference Deacon1997; Dunbar Reference Dunbar, Dunbar, Gamble and Gowlett2010b). Triadic differentiation in primates contrasts starkly with the situation in many colonially nesting birds, where females are at constant risk of harassment as they leave and return to their nests if they are not accompanied by their mate (e.g., bee eaters: Emlen & Wrege Reference Emlen and Wrege1986).
In summary, living in large groups imposes significant behavioural demands on animals if they are to be able to hold the group together for any length of time in the face of the pressures that will otherwise push the animals apart. Although we are inclined to take these behaviours for granted, the cognitive costs involved are far from trivial. They demand neurologically very expensive abilities that have to be paid for with energetically expensive neocortical investment (Dávid-Barrett & Dunbar Reference Dávid-Barrett and Dunbar2013; Lewis et al. Reference Lewis, Birch, Hall and Dunbar2017). These findings thus provide a direct answer to the question raised by Healy & Rowe (Reference Healy and Rowe2007) as to why larger brains should be necessary for more social species. Finding solutions to both the need for extra grooming time and the additional nutrient capacity to evolve a larger brain requires species to make adjustments to their diet – both to free up time for additional grooming and to fuel the evolution of a larger brain. This reinforces the evidence from all previous analyses of the SBH (including those by DeCasien et al [Reference DeCasien, Williams and Higham2017] and Powell et al. [Reference Powell, Isler and Barton2017]: for re-analysis of these studies’ findings, see Shultz & Dunbar Reference Shultz and Dunbar2022; Dunbar & Shultz Reference Dunbar and Shultz2023) that a change in diet and foraging strategy was a necessary prerequisite (not the selection factor) for fuelling the additional energetic costs involved (Shultz & Dunbar Reference Shultz and Dunbar2022).
6. Wider Implications
I have argued that the central problem that all mammals have to deal with is how to manage the stresses that arise from living in large, stable groups when these are necessitated by the kinds of environments a species is attempting to occupy. These stresses are in part due to the psycho-physiological pressures of living in close proximity (giving rise to the “infertility trap”), but also in part to the fact that, as group size increases, it becomes increasingly difficult to maintain coordination and group cohesion during foraging. The two together create a strong centrifugal force that will cause large groups to fragment unless active steps are taken to mitigate these effects.
Primates face this problem especially intensely because of the kinds of bonded social groups they have evolved. I have suggested that, in order to manage this, primates successively exploited three different kinds of strategy: structural strategies that seek to exploit network characteristics, behavioural strategies based on creating more intense social bonds that protect females (in particular) from the destructive effects of the infertility trap, and novel cognitive capacities involving neurophysiologically expensive forms of meta-cognition (propositional thinking, one-trial learning, the capacity to compare outcomes from alternative options, inhibition and mentalising) that allow relationships to be managed more effectively with individuals who are beyond the immediate circle of grooming partners. These capacities seem to come onstream sequentially at quite specific group sizes, suggesting that they are associated with glass ceilings beyond which group size cannot be increased without introducing novel competences. These phase shifts do not follow taxonomic divisions (although there is a modest phyletic trend) but rather have a more mosaic form that reflects the ecological adaptations that individual species have needed to make when invading new habitats (see also Dunbar & Shultz Reference Dunbar and Shultz2021b).
Although primates are, as a group, the most social of all the mammals, they are by no means unique: other mammalian orders (notably equids, tylopods, elephants, delphinids, some herpestids and sciurids) have also evolved forms of bonded sociality (Shultz & Dunbar Reference Shultz and Dunbar2010a). It is, however, notable that although most of these species do not (and, in some cases, cannot) groom as effectively as anthropoid primates, many engage in forms of physical contact (nuzzling, snuggling) that may be equally effective in triggering the endorphin system. Some of the more social birds (parrots and their allies, corvids; many pairbonded cooperative breeders) do a great deal of mutual preening (Kenny et al. Reference Kenny, Birkhead and Green2017; Morales Piccard et al. Reference Morales Picard, Mundry, Auersperg, Boeving, Boucherie, Bugnyar and Slocombe2020). In woodhoopoes, for example, the frequency of allo-preening increases with group size (Radford & Du Plessis Reference Radford and Du Plessis2006), just as it does in primates.
In addition, many birds that live in stable groups outside the breeding season engage in conspicuous forms of vocal chorusing or “flock-talk” (examples include babblers, Guinea fowl, and starlings). This form of “undirected” vocalisation has recently been shown to upregulate the endorphin system in birds (Riters et al. Reference Riters, Kelm-Nelson and Spool2019), just as communal singing does in humans (Pearce et al. Reference Pearce, Launay and Dunbar2015, Reference Pearce, Launay, van Duijn, Rotkirch, David-Barrett and Dunbar2016, Reference Pearce, Launay, MacCarron and Dunbar2017b). Many pair-living bird species engage in tightly synchronised antiphonal calling, especially when they are foraging apart in dense bush (e.g., African boubou shrikes). As in primates, vocal complexity increases with flock size in species like the Carolina chickadee (Freeberg Reference Freeberg2006). This might offer an alternative interpretation of the daily group chorusing (usually interpreted as having a territorial function) that is so characteristic of howler monkeys and gibbons. It may also be that whale song (usually interpreted as a contact call) in fact serves a similar bonding function, allowing a widely dispersed pod to “groom” while travelling. In humans, low sounds have been shown to trigger an endorphin response through a class of afferent C-tactile spiral ganglion neuron receptors attached to the cochlea (Dunbar et al. Reference Dunbar, Pearce, Tarr, Makdani, Bamford, Smith and McGlone2021b).
How far the abilities of any non-primate taxa compare to those of primates is, however, far from clear. More detailed studies are required. If nothing else, however, the present results should at least remind us that not even all primates solve their social problems in the same way: all anthropoid primates live in bonded social groups and engage in social grooming, but differences in group size impose very different demands that require cognitively different solutions. Similarly, we know from the MacLean et al., Reference MacLean, Hare, Nunn, Addessi, Amici, Anderson, Aureli, Baker, Bania, Barnard, Boogert, Brannon, Bray, Bray and Brent2014) studies that only anthropoid primates have the capacity for self-control (see Dunbar & Shultz Reference Dunbar and Shultz2025). It is also important to remember that few non-primates live in bonded social groups as large as those of anthropoid primates (Dunbar & Shultz Reference Dunbar and Shultz2021a); as a result, they will be much less prone to the coordination problem.
There is a need for more discerning studies of other mammals’ social dynamics as well as their cognition to allow us to place them on a continuum with primates so as to evaluate the wider picture of cognitive evolution. So far, most such studies have tended to focus on rather low-key, food-finding abilities or cognitive capacities like short-term memory that are so basic to life that all species have to have them (ManyPrimates et al. Reference Aguenounoun, Allritz, Altschul and Ballesta2020), and hence are rather uninformative. Such evidence as there is suggests that, while other mammal orders might well exhibit their own novel cognitive adaptations (e.g., echolocation in delphinids, smell in canids), specialised forms of social cognition like self-control (Passingham & Wise, Reference Passingham and Wise2012; MacLean et al., Reference MacLean, Hare, Nunn, Addessi, Amici, Anderson, Aureli, Baker, Bania, Barnard, Boogert, Brannon, Bray, Bray and Brent2014; Dunbar & Shultz Reference Dunbar and Shultz2025) and mentalising (Devaine et al. Reference Devaine, San-Galli, Trapanese, Bardino, Hano, Saint Jalme, Bouret, Masi and Daunizeau2017; Dunbar & Shultz Reference Dunbar and Shultz2023) appear to be unique to the anthropoid primates.
7. Implications for human evolution
One final question is how these findings feed into human social and cognitive evolution. In most respects, human sociality, and the cognitive and neurobiological processes that underpin it, can be seen as being on the same trajectory as anthropoid primate sociality (section 4). Most of the specialised cognitive capacities that underpin anthropoid primate sociality are also crucial for the effective functioning of human relationships and social groups (Dunbar Reference Dunbar2018a, Reference Dunbar2021a,b). In some cases, human competencies seem to be no better than those of great apes. The capacity to inhibit prepotent actions (self-control), for example, already seems to be close to ceiling in great apes, with full adult competence being achieved as early as six years of age in humans (Espy et al. Reference Espy, Kaufmann, McDiarmid and Glisky1999). The same appears to be true of theory of mind (second-order mentalising): though we share this with great apes, children achieve great ape level skills by about age five years (O’Connell & Dunbar Reference O’Connell and Dunbar2002). Other competencies, however, are significantly greater in humans than in any pongid. Adult human mentalising capacities, for example, extend for at least three more levels of intentionality beyond that achieved by great apes and young children (Kinderman et al. Reference Kinderman, Dunbar and Bentall1998; Stiller & Dunbar Reference Stiller and Dunbar2007; Henzi et al. Reference Henzi, de Sousa Pereira, Hawker-Bond, Stiller, Dunbar and Barrett2007; Powell et al. Reference Powell, Lewis, Roberts, García-Fiñana and Dunbar2012, Reference Powell, Kemp, Dunbar, Roberts, Sluming and García-Fiñana2014; Devaine et al. Reference Devaine, Hollard and Daunizeau2014; Dunbar Reference Dunbar2014).
The same is true of social grooming and the role this plays in upregulating the brain’s endorphin system. Although humans still make significant use of “soft touch” as a social bonding mechanism (Suvilehto et al. Reference Suvilehto, Glerean, Dunbar, Hari and Nummenmaa2015, Reference Suvilehto, Nummenmaa, Harada, Dunbar, Hari, Turner, Sadato and Kitada2019; Dunbar Reference Dunbar2021a), there seems to be an upper limit on the size of groups that can be bonded by social grooming at ∼50, mainly due to time constraints and the physical intimacy of touch (Dunbar Reference Dunbar2022b). To circumvent this constraint, humans have found novel ways of triggering the endorphin system virtually (i.e., without involving direct physical contact), all of which scale up well to the size of contemporary human groups. These include laughter (Nummenmaa et al. Reference Nummenmaa, Tuominen, Dunbar, Hirvonen, Manninen, Arponen, Machin, Hari, Jääskeläinen and Sams2016; Dunbar Reference Dunbar2022b), singing (Pearce et al. Reference Pearce, Launay and Dunbar2015, Reference Pearce, Launay, van Duijn, Rotkirch, David-Barrett and Dunbar2016, Reference Pearce, Launay, MacCarron and Dunbar2017b), dancing (Tarr et al. Reference Tarr, Launay, Cohen and Dunbar2015, Reference Tarr, Launay and Dunbar2016, Reference Tarr, Launay and Dunbar2017), feasting (Dunbar, Reference Dunbar2017; Tuulari et al. Reference Tuulari, Tuominen, de Boer, Hirvonen, Helin, Nuutila and Nummenmaa2017), storytelling (Dunbar et al. Reference Dunbar, Teasdale, Thompson, Budelmann, Duncan, van Emde Boas and Maguire2016), and the rituals of religion (Charles et al. Reference Charles, Farias, van Mulukom, Saraswati, Dein, Watts and Dunbar2020) (see also Dunbar Reference Dunbar2014). All these have been shown both to upregulate central endorphins and to elevate the sense of bonding (even with complete strangers) (Dunbar Reference Dunbar2018a, Reference Dunbar2021a).
It seems likely that these did not all appear together, but rather evolved in a stepwise fashion, first with archaic humans (Homo ergaster/erectus) around 2.4 Ma and later, around 600 ka, with the appearance of archaic humans (H. heidelbergensis and H. neanderthalensis and allies), leading into anatomically modern humans (Gowlett et al. Reference Gowlett, Gamble and Dunbar2012). The first step was relatively modest and seems to have been solved mainly by finding a more efficient way of triggering the endorphin system (laughter as a form of chorusing, or “grooming at a distance”), with only a very modest investment in novel cognition (Dunbar Reference Dunbar2022b). The second required a combination of very substantial investment in cognition as well as the discovery of a suite other non-contact ways of triggering the endorphin system (Dunbar Reference Dunbar2014).
Since conversational interactions (e.g., during feasting), storytelling and religion all depend on language, they are likely to have evolved late: although archaic humans (the Heidelberg and Neanderthal folk) certainly had the capacity to speak (and/or sing) (Dunbar Reference Dunbar, Botha and Knight2009, Reference Dunbar2023; Bannan et al. Reference Bannan, Bamford and Dunbar2024), their mentalising capabilities appear to have been insufficient for them to have had language of the flexibility and complexity that we find in modern humans (Pearce et al. Reference Pearce, Shuttleworth, Grove, Layton, Dunbar, Gamble and Gowlett2014; Dunbar Reference Dunbar2014, Reference Dunbar2023). Once fully modern language had evolved, however, it opened the way for much more sophisticated forms of bonding through shared cultural symbols in the form of the “Seven Pillars of Friendship” (Curry & Dunbar Reference Curry and Dunbar2013; Dunbar Reference Dunbar2018a, Reference Dunbar2021b). Once again, we seem to see a series of discrete steps that reflect responses to phase shifts in group size, the first of which involved breaking through a glass ceiling imposed by limits on the reach of touch-based grooming as a bonding mechanism (Dunbar Reference Dunbar2014, Reference Dunbar2023).
Supplementary material
To view supplementary material for this article, please visit https://doi.org/10.1017/S0140525X2400030X
Funding statement
The research on which this paper is based was mainly funded by the British Academy Centenary Award and a European Research Council Advanced grant (number 295663).
Competing interests
The author declares no conflicts of interest.

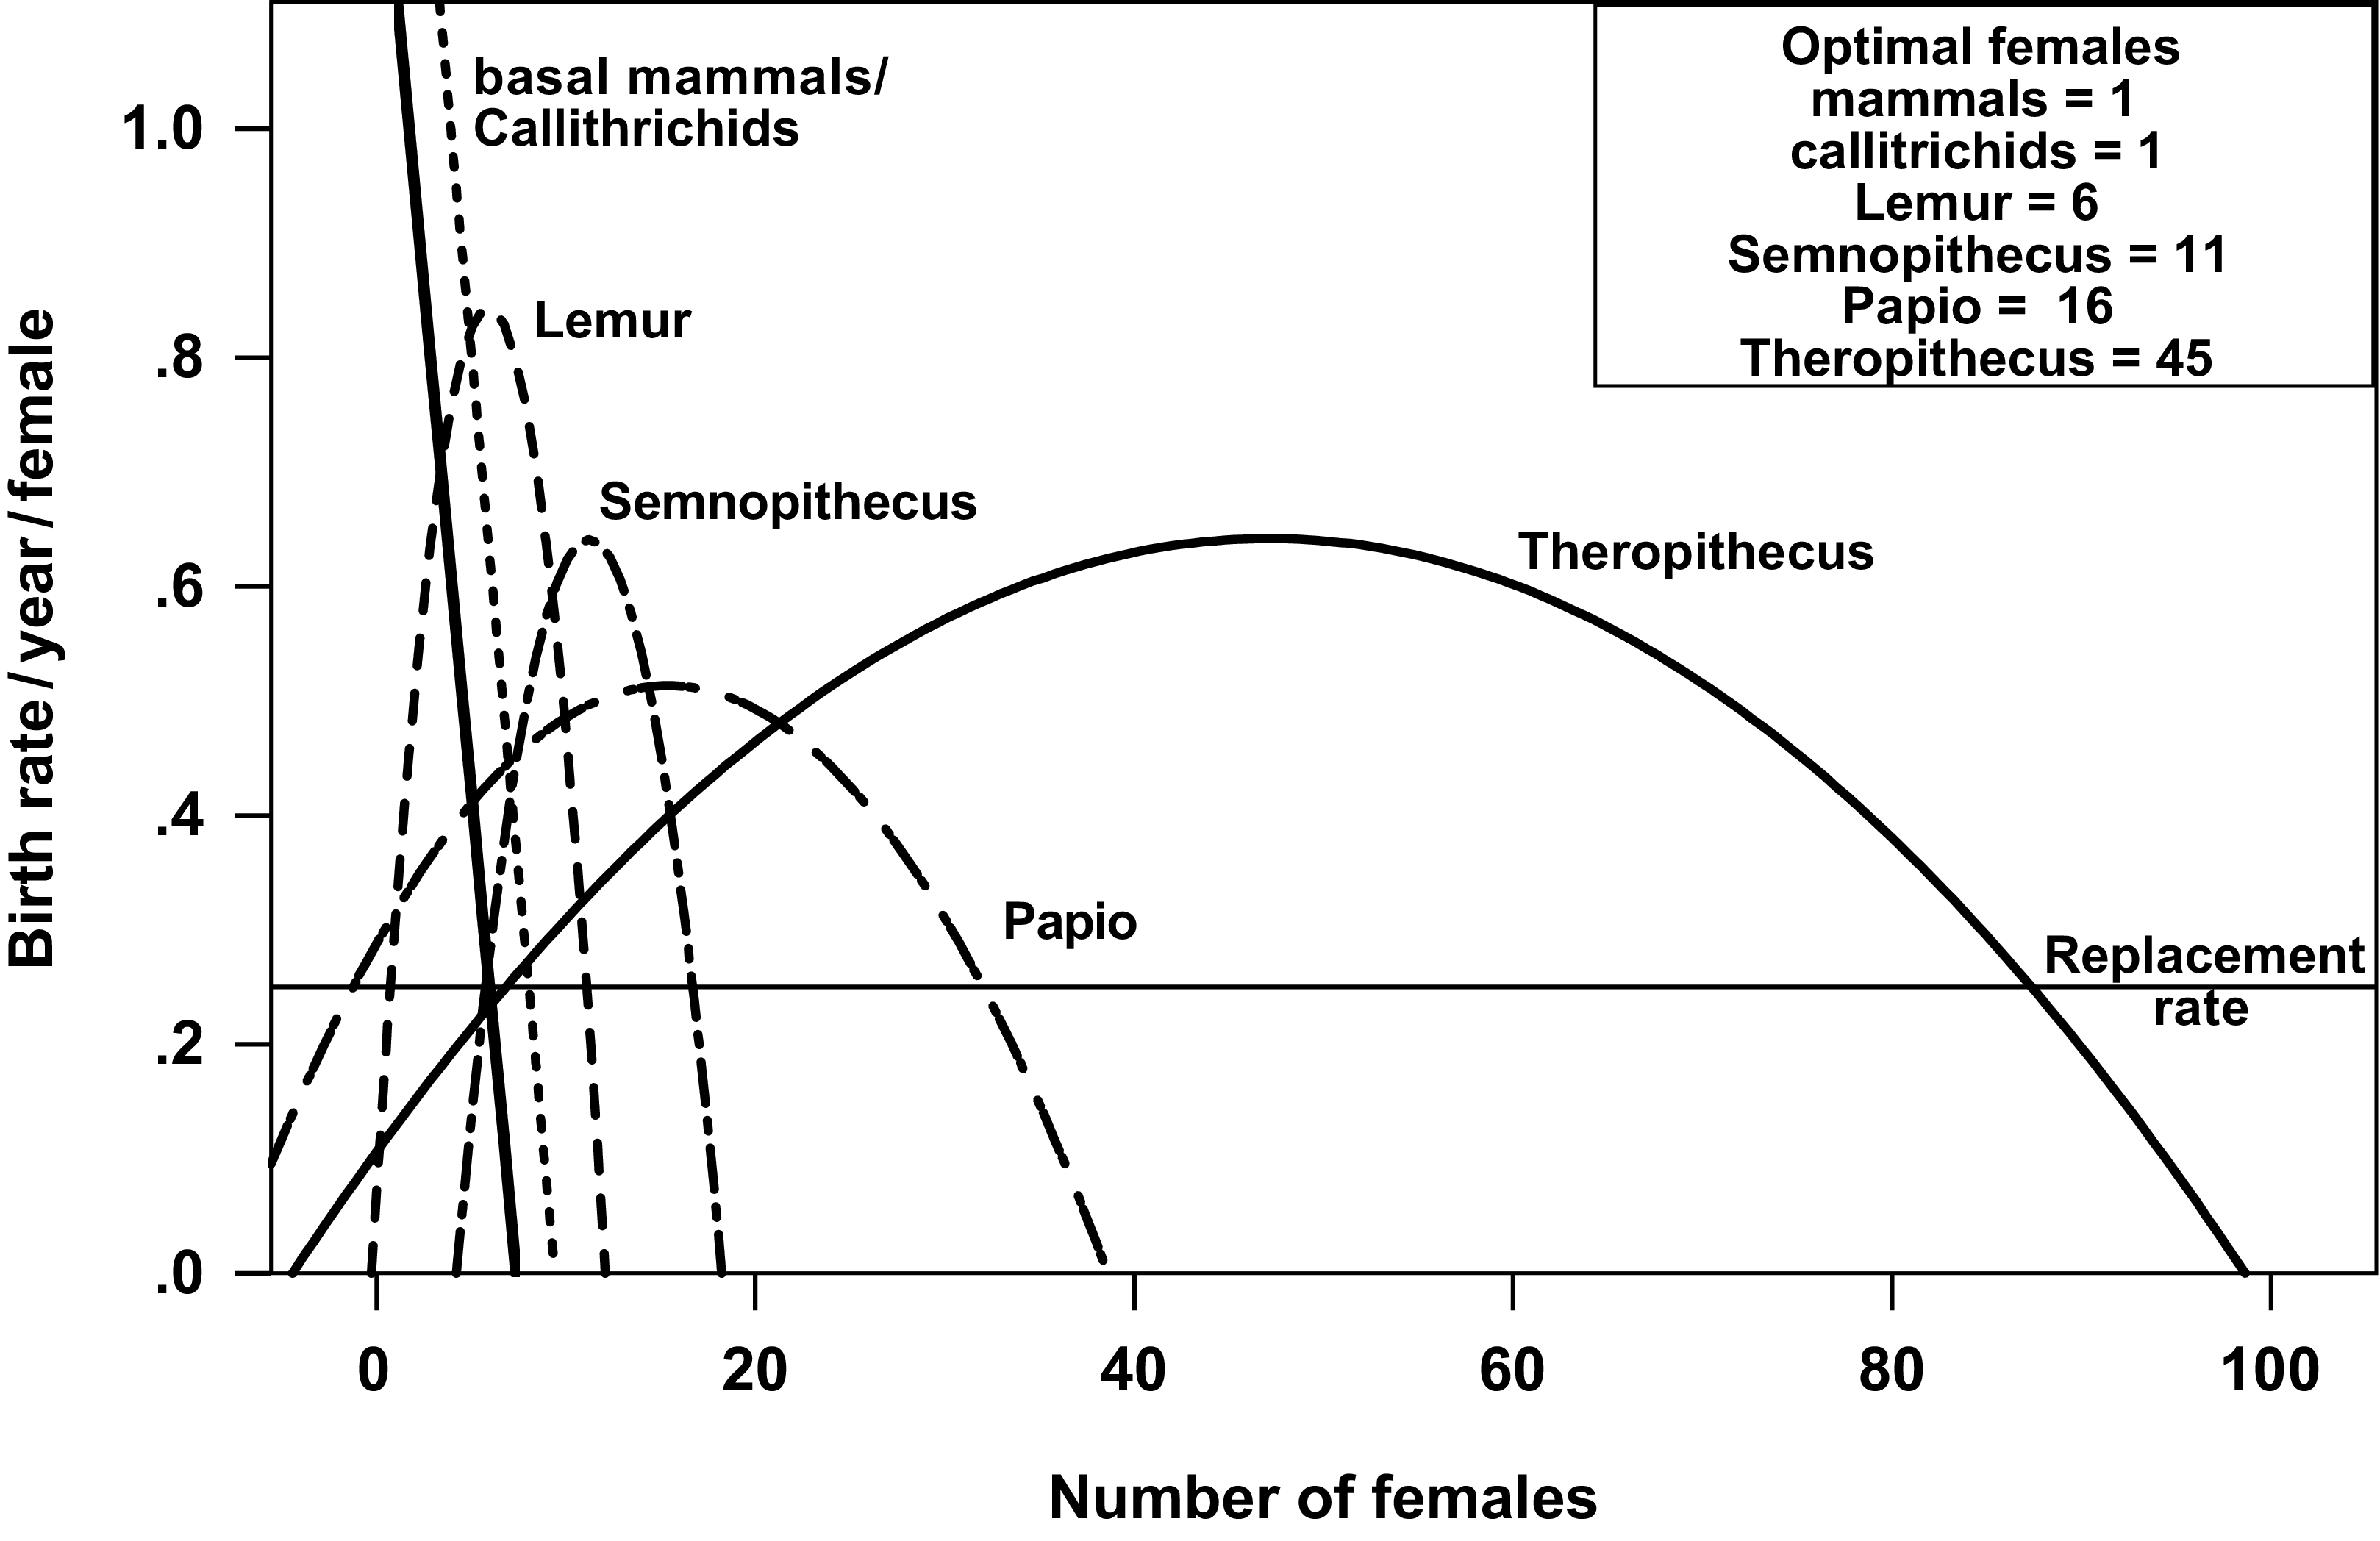
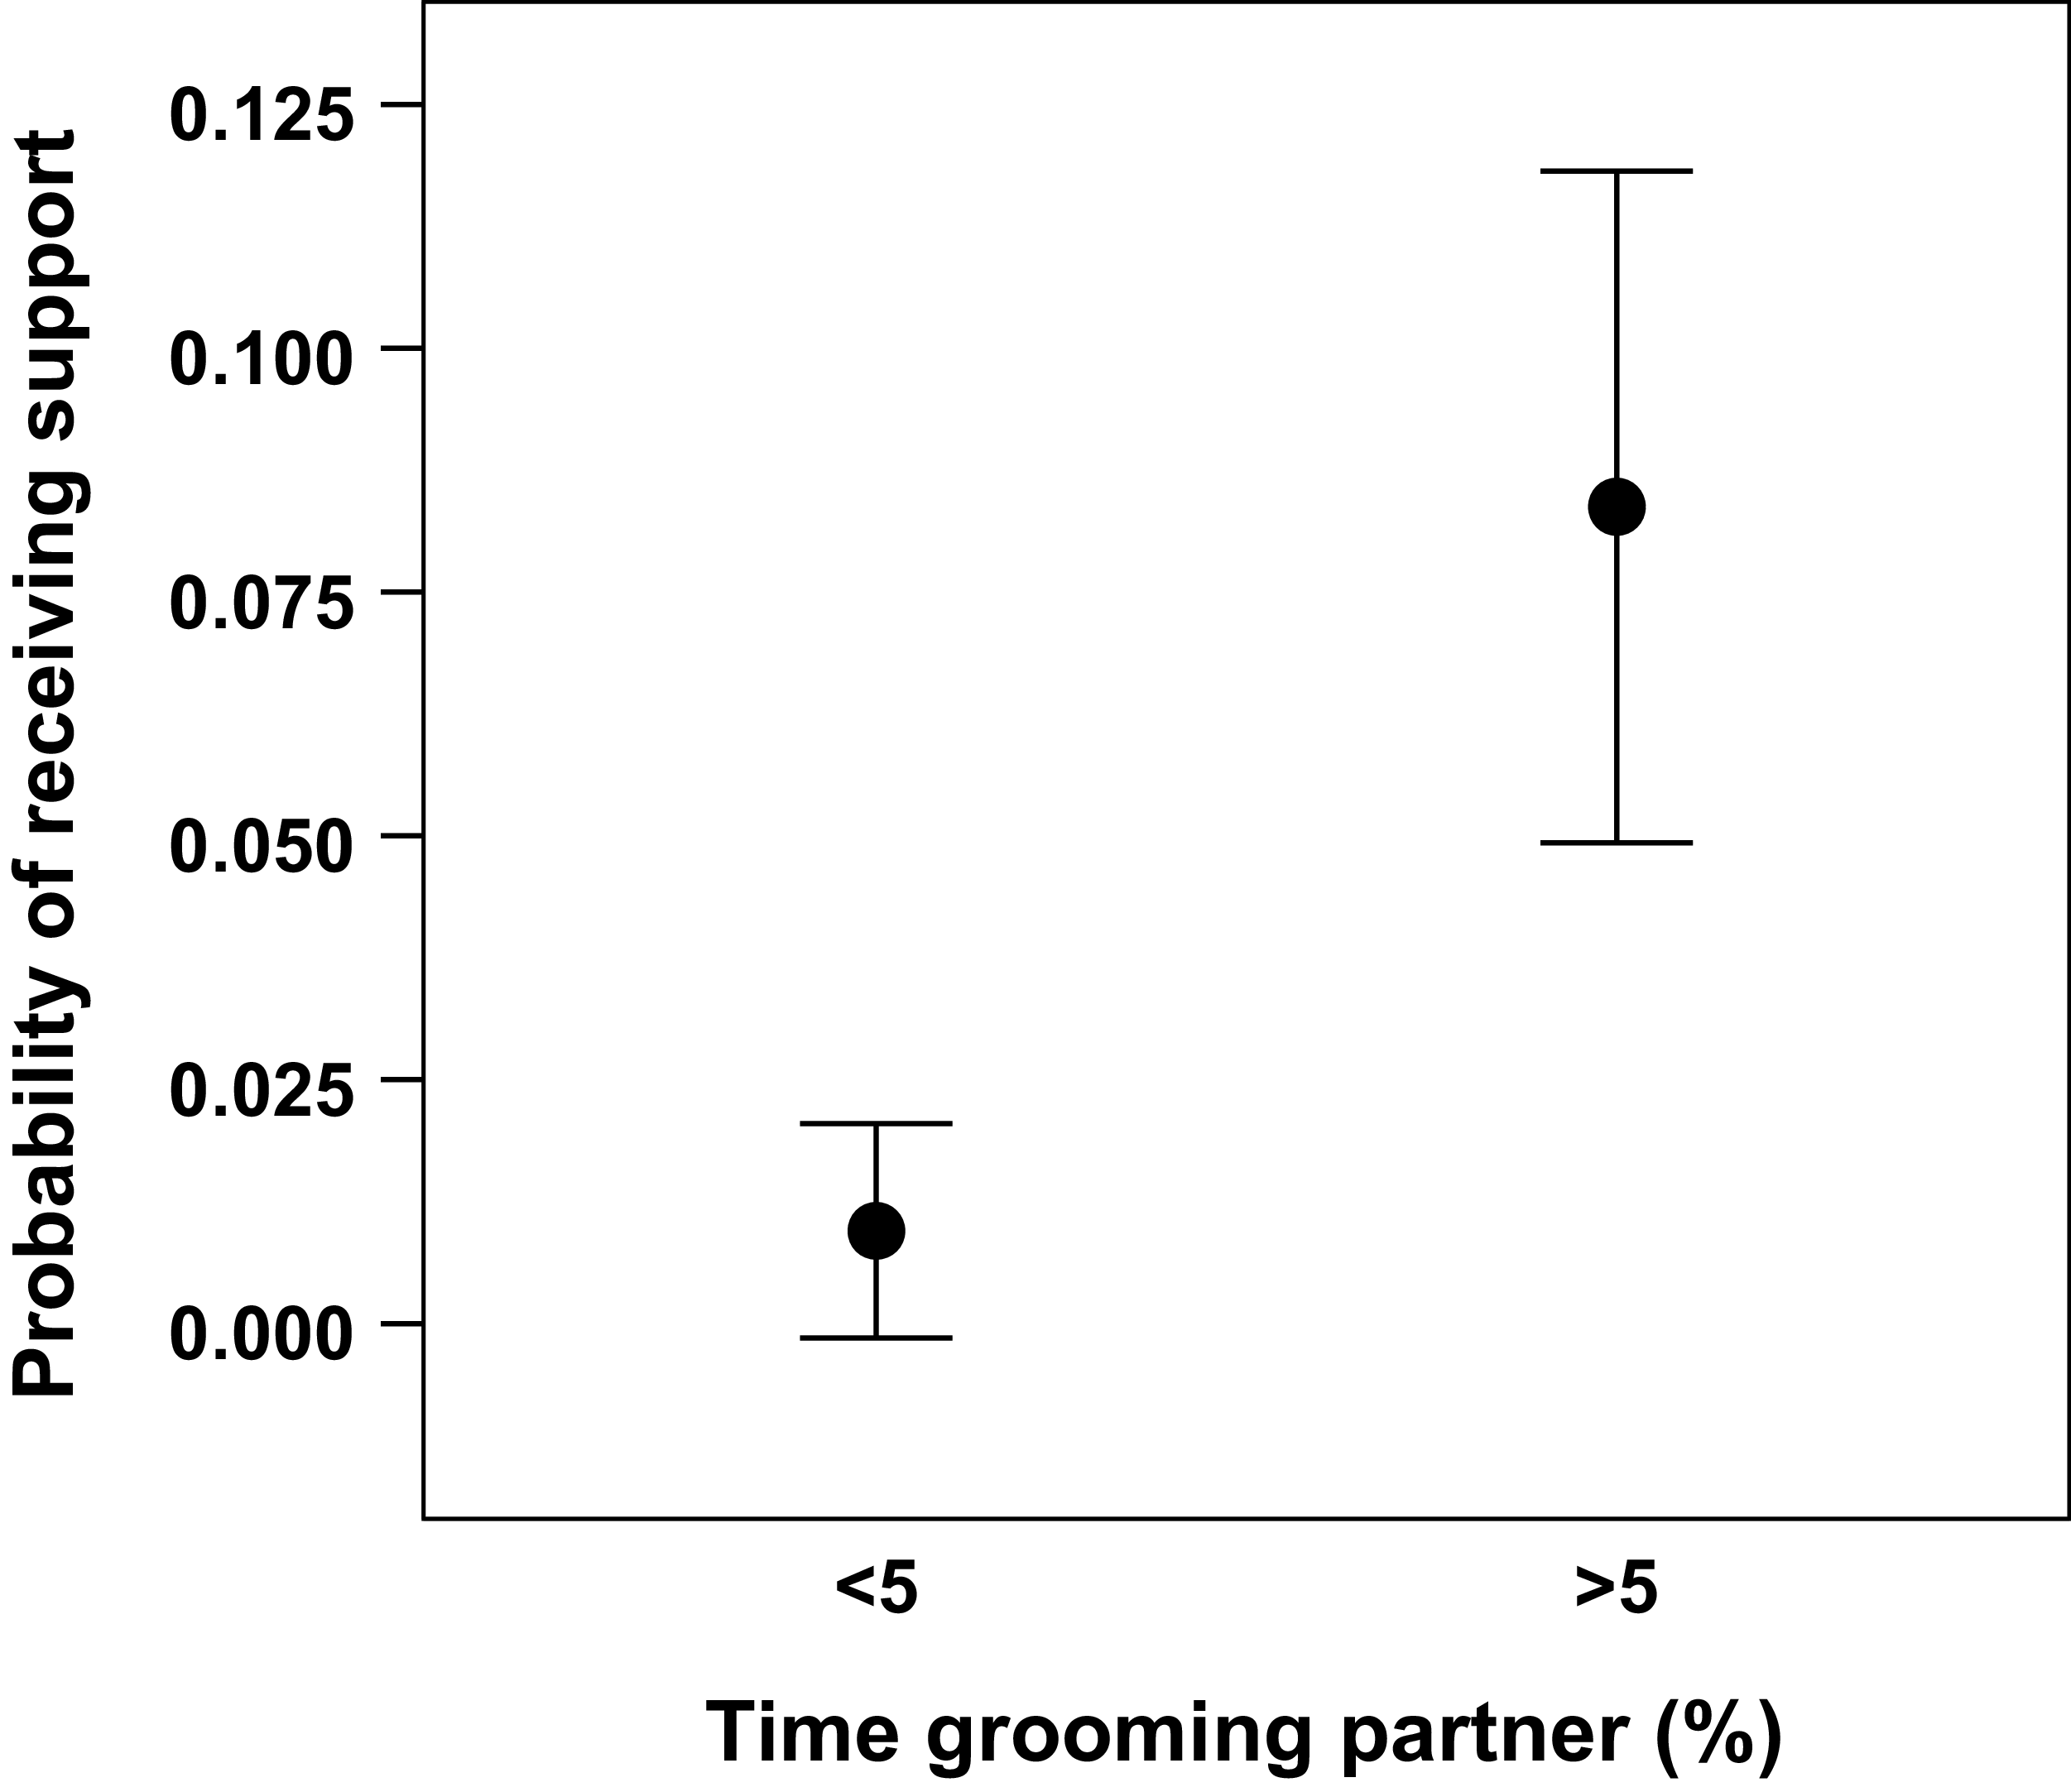




Target article
Structural and Cognitive Mechanisms of Group Cohesion in Primates
Related commentaries (27)
A fishy perspective on the social brain hypothesis
Behavioral ecology shapes structural, behavioral, and cognitive solutions
Beyond individual selection: adaptive networks and collective social niche construction
Beyond the cortex–integrating hippocampal function into the Social Brain Hypothesis to explain advanced cognition
Cognitive perception of social stress as a critical mechanistic control of mood and mood-related brain signals
Core affective mechanisms maintaining group cohesion
Dynamic unpredictability in grouping
Facial expression is a group cohesion solution
Fairness expectations scaffolded the evolution of larger groups
Flexible branches in the primate family tree?
Group-mindedness as evolved solution to deal with group-living
Intentional communication reduces social stress by increasing the predictability of conspecifics’ behaviour
It’s not just about allies – The role of identity in stable ingroup memberships
Mental abstraction aids group cohesion in large social networks
Meta-cognition for music as a solution to the fragmentation problem
Metacognition serves allostasis and co-evolves with the social brain
On the forces that bind us
Play and laughter: overlooked pillars of social cohesion. Commentary proposal for structural and cognitive mechanisms of group cohesion in primates
Primates’ social cognitive bonding mechanisms are more complex than we thought, yet not quite human–lessons from great ape triadic social bonding
Removing the glass ceilings: diverse mechanisms for social cohesion
Spelling out the mechanism: functional support and modified stressor appraisal buffer a cost of increased group size
Tolerance as a key mechanism for large-scale social cohesion
What holds groups together? How interdependence shapes group-living
What human trust networks reveal about cognitive mechanisms of group cohesion in primates
What makes social abilities sophisticated? Not recursive mentalising
What problem does a fractal social network solve?
Why not reduce reactive aggression too?
Author response
Unpacking social complexity