A new strain of influenza infection started in April 2009 in a small village in Vera Cruz, Mexico. This was known as the first influenza pandemic of the 21st century.Reference Girard, Tam, Assossou and Kieny 1 It spread so rapidly that by June 11, 2009 – only 2 months after the first case—the World Health Organization (WHO) raised the pandemic alert to level 6, which indicates a global phenomenon with sustained human-to-human infection capability.
The actual number of people infected by H1N1 2009 worldwide is still unknown. One reason is that most cases were diagnosed clinically and were not confirmed, as the “capacity for laboratory diagnosis was severely stressed” in most countries. 2 An early estimate of the extent of the disease in the United States has been approximately 50 million cases.Reference Presanis and De Angelis 3 A more recent estimate calculates 200 million H1N1 cases worldwide, with about 10 million in France alone.Reference Hannoun 4 The pandemic’s toll remains controversial, with estimates ranging from 14 000 to 18 000 deaths. 5
This pandemic challenged the existing coordination mechanisms in many countries and forced many others to revisit their disaster plans. Coordination was global, from the WHO to national health authorities to local health practitioners. This coordination was neither in accordance with organizational blueprints nor confined to simple e-mails bouncing among intensive care specialists, health bureaucrats, epidemiologists, and pathology experts. It constituted a web of interrelationships that linked all who had a role in the pandemic management and containment.
As the first wave of influenza pandemics of the 21st century, with 2 more waves expected before the 22nd century, the coordination process of H1N1 2009 deserves to be studied and well researched. We argue that different organizations from multijurisdictional settings need to communicate and collaborate for preparedness and response to outbreaks, and that effective coordination can be achieved by creating a mesh of interconnected nodes comprising a large network of relationships. In this research, we have investigated how a network of formal coordination evolved before and during the outbreak and if the existing social network before the outbreak differed in its network empirical values and structure from that which evolved during the outbreak.
Background
In Australia, the Australian Health Protection Committee (AHPC) is chaired at Deputy Secretary level by the Australian Government Department of Health and Ageing, and its core includes the chief medical officer; each state and territory chief health officer (CHO), and, if required, public health or emergency personnel nominated by the CHO for relevant agenda items; health disaster officials (up to 3) nominated by states and territories or the commonwealth; the chairs of 3subcommittees (Communicable Disease Network Australia, Public Health Laboratory Network, and the Environmental Health Committee; the director general of Emergency Management Australia; the head of Defence Health Services; a representative of the New Zealand Ministry of Health; a representative of Emergency Management Australia; representatives of the National Mental Health Disaster Response Committee; and others, as necessary (AHPC). 2
In the state of New South Wales (NSW), the Public Health Act designated the NSW Ministry of Health (NSWH) as the lead combat agency during the H1N1 2009 outbreak. NSWH had prepared plans to deal with different types of pandemics, including the human influenza pandemic; some of these plans are the State Disaster Plan, Human Influenza Pandemic Plan (HIPP), and NSW HEALTHPLAN. The HIPP was based on more severe types of influenza such as H5N1, whereas H1N1 was relatively mild.Reference Baber, Cross, Smith and Robinson 6
The Australian Health Management Plan for Pandemic Influenza categorizes 5 management phases: delay, contain, protect, sustain, and control, which were later collapsed to 3 phases: delay, contain, and protect. At the conclusion of any event for which the plan was activated, these plans should be updated with the introduction of major structural, organizational, or legislative changes in NSW, or at least every 5 years.Reference Baber, Cross, Smith and Robinson 6 NSWH is responsible for the management effort, which starts with surveillance and follows through different components, which include some of the followingReference Baber, Cross, Smith and Robinson 6 ):
-
∙ Various laboratories notify confirmed cases of influenza;
-
∙ The Public Health Real-time Emergency Department Surveillance System, which monitors near real time for influenza-like illness from most emergency departments (EDs) in NSW;
-
∙ Public health units (PHUs) receive reports from clinicians or institutions of unusual cases;
-
∙ Sample of general practitioners (GPs) contribute data on influenza-like illness to sentinel surveillance systems; and
-
∙ The Australian government supplies absenteeism data.
During the H1N1 outbreak, NSWH implemented additional monitoring and surveillance measures, including
-
∙ Active public health follow-up of possible and confirmed cases of pandemic influenza;
-
∙ Border screening for influenza-like illness in travelers from affected regions; and
-
∙ Data provided through collaborative efforts of multiple hospitals (eg, national data on intensive care or pediatric admissions).
During the pandemic, NSW was divided into 8 local health districts, each with a PHU that managed communication locally with health facilities such as hospitals, laboratories, and community health centers. Those laboratories and hospitals in turn communicated with NSWH directly, especially with specialized units within them, such as intensive care units (ICUs). Different bodies regulated the GPs, while the GPs communicated with the local and, occasionally, federal health authorities.
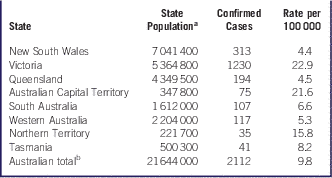
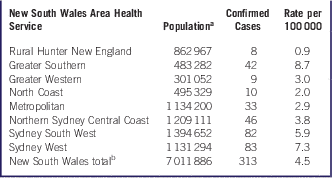
Table 1 shows the reported cases of infection in Australia for the H1N1 2009 outbreak. As seen in Table 2, the Hunter New England area had the lowest transmission rate (0.9 per 100 000 population) and the lowest number of confirmed cases in the state of NSW (only 8), whereas the adjacent North Coast health area had a transmission rate more than twice as high (2 per 100 000). Table 2 also indicates that within the same state the variation in infection rates was about eightfold. Considering that the demographics and pathogen were the same, we believe that the management and coordinated response led by corresponding agencies in each individual state and area health service within the states were factors affecting the infection rates and needed further investigation.
Confirmed Cases of H1N109 Infection in Australia

a Figures are based on estimated residential populations on December 31, 2008.
b Total includes all territories.
Confirmed Cases of H1N1 2009 Infection Within New South Wales

a Figures are based on estimated residential populations on December 31, 2008.
b Discrepancy with the New South Wales total in Table 1 is due to differences in population projections.
Coordination Complexity in Disease Outbreaks
Managing disease outbreaks relies substantially on information collection, validation, sharing, and visualization.Reference Tschoegl, Below and Guha-Sapir 7 , Reference Hitchcock, Chamberlain, Van Wagoner, Inglesby and O'Toole 8 Consequently, a multiagency coordinating complex system consisting of cross-disciplinary public and private health professionals supported by advanced information systems needs to be established. This system can be described as infectious disease informatics, which Hitchcock and coworkers define as “an interdisciplinary research area that focuses on the design, implementation, and evaluation of advanced systems, techniques, and methods for managing infectious disease and epidemic outbreaks, ranging from prevention to surveillance and detection.”Reference Freeman 9
In a similar way, the organizations that interact during disease outbreaks represent a unique form of interorganizational coordination. They create a matrix of interdisciplinary agencies coordinating within certain time constraints (disease infectivity characteristics). To understand the complexity of such a system, it is necessary to view the overarching structure and process holistically.
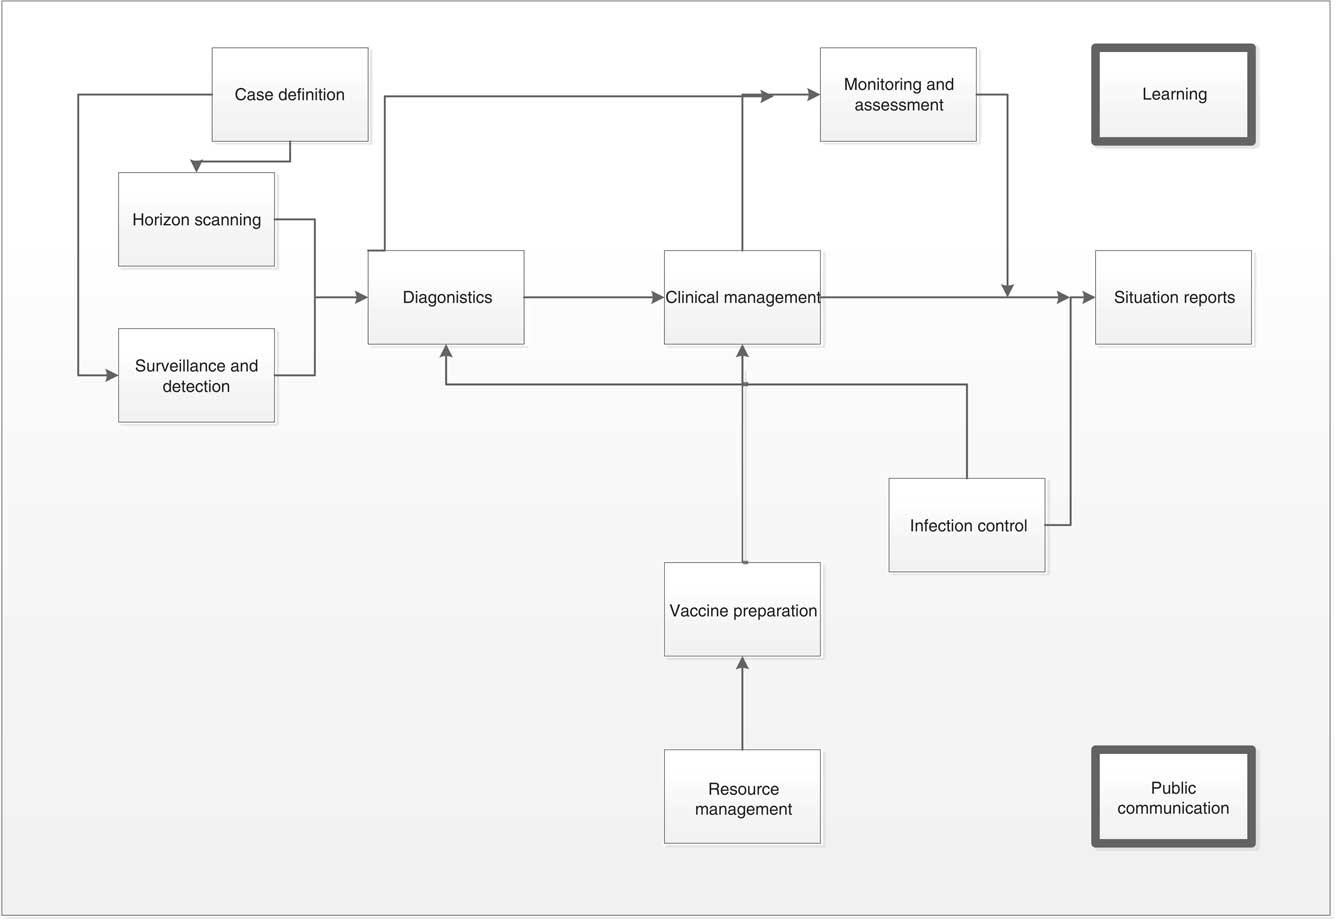
Figure 1 illustrates the general scheme and provides a brief overview of these tasks. It shows the communication and workflow paths between different conceptual tasks during the pandemic. For example, one cluster (case definition, horizon scanning, and surveillance and detection) leads to diagnosis, which then results in clinical management of confirmed cases to monitor the situation, and which then provides input to situation reports. Also resource management oversees vaccine preparation, which is used to manage reported cases.
Schematic Diagrams for the Tasks During the Outbreak.

Coordination structures are dynamic and change with the current crisis; hence, it is necessary to study the pandemic coordination before and during the outbreak. Usually pandemic management agencies participate in constant exchange of information such as details of new cases, confirmed laboratory results as part of surveillance, or horizon scanning activities. These activities are normally constant bureaucratic operations in which most public health-related agencies routinely engage as part of their standard practices. This information gathering and exchange process is an integral and important part of prepandemic administration that will also lead to a proactive management model. In theory, this communication should lead at least to increased management and coordination efforts during the outbreak itself, as the agencies are familiar with each other’s roles and communication protocols.
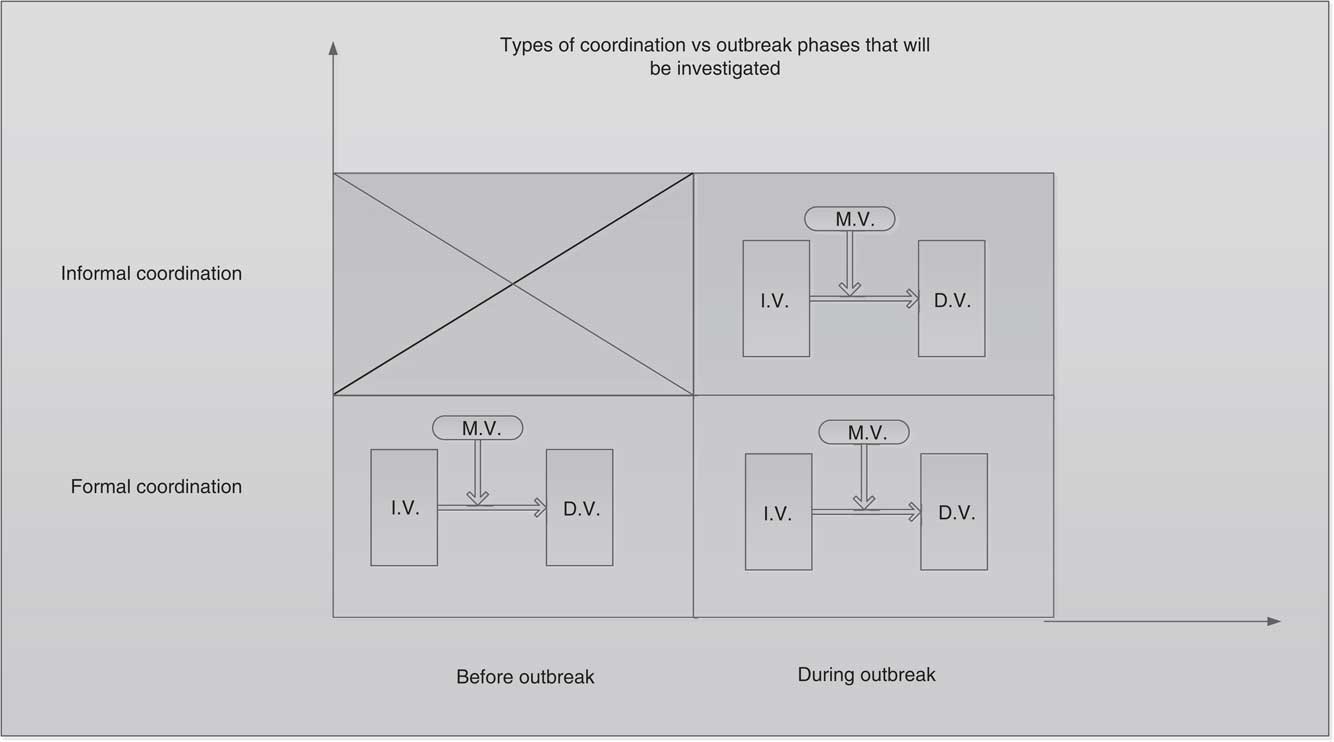
The present study was designed to capture the communication lines before and during the pandemic. This approach could facilitate understanding of the coordination lines and how they change with phase change. Moreover, coordination could be investigated more comprehensively during the outbreak. This opportunity allowed the process to be examined from both facets, which, to our knowledge, has not been undertaken previously. Figure 2 highlights the phases of coordination considered in this study that led to the proposed hypotheses. This report only provides a detailed analysis of formal/hierarchical coordination for preparedness and response to the H1N1 outbreak in Australia.
The 3 Phases of Coordination Considered in the Research.

Hypothesis
A significant relationship exists between the positions of the agency (node) in the formal structure of the disease outbreak coordination network that exists before the outbreak coordination officially starts and the perceived level of performance regarding how long it took for the coordination to be optimal. To assess this hypothesis (H1), the following 3 subhypotheses were used to evaluate the principal theory:
H1a: Degree centrality in formal structure is positively correlated with the perceived coordination robustness before and during the outbreak.
H1b: Tie strength in formal coordination is positively correlated with coordination robustness before and during the outbreak.
H1c: Tier connectedness in formal coordination is positively correlated with coordination robustness before and during the outbreak.
Coordination robustness is a major determinant of how quickly the coordination process is initiated after the outbreak is announced.
Social Network measures for coordination
We use the following measures of social networks to assess the networks of preparedness and response to the Australian H1N1 outbreak.
Degree Centrality Measure
The number of links to and from a node is the most frequently used, intuitive, and easy to understand centrality measure. Degree centrality is a local centrality measure because it can be calculated without reference to the overall structure of the network. In an asymmetric (directed) network, in-degree is defined as the number of ties received and out-degree is the number of ties sent or initiated by the node outwardly. The following formulas define these types of vectored centrality:
 $$C_{{D_{i} }} (out{\minus}degree)=\mathop{\sum}{_{j} } d_{i} _{j} $$
 $$C_{{D_{i} }} (in{\minus}degree)=\mathop{\sum}{_{j} } d_{{ji}} $$
Where d ji indicates the existence or non-existence of a link between nodes i and j. If a link exists between node i and node j, d ji =1 If there is no link, d ji =0.
In-degree counts the number of times a node (organization) is needed or nominated by the others in the network. To make the degree centrality comparable between networks of different sizes, the count is divided by N-1, which is the maximum possible number of connections a particular node can have, hence a representation of the network size. This results in a normalized centrality measurement that varies from 0 to 1Reference Lin 10 :
 $$C_{{D_{i} }} (out{\minus}degree)={{\sum_j d_{{ij}} } \over {N{\minus}1}}$$
 $$C_{{D_{i} }} (in{\minus}degree)={{\sum_j d_{{ji}} } \over {N{\minus}1}}$$
where N represents the number of nodes.
The significance of centrality arises when it is realized that organizations rely on strong ties to provide needed resources.Reference Burt 11 Previous research has claimed that the ego-network measure—centrality—is associated with performance.Reference Rosenthal 12 , Reference Bavelas 13 Centrality depicts the degree to which an individual obtains information and controls benefits from non-redundant ties, and it is theorized to positively influence performance. Such assertions also are supported by the controlled experiment conducted by Bavelas in which individuals were given certain information to assemble to reach a decision, with the purpose of issuing orders to solve a puzzle.Reference Leavitt 14 Bavelas found that centralized structures (eg, star) performed better than decentralized ones (eg, circle). It was suggested that the reason was that decentralized information floats better than centralized information.
Numerous follow-up studies to the Bavelas experiment were conducted to assess the impact of different structures on communication and problem-solving performance. Unfortunately, these empirical studies did not produce consistent and cumulative results. In fact, some results were contradictory with each other and with the original Bavelas findings. For example, several researchers confirmed that the star structure performed better than the all-channel structure.Reference Mulder 15 – Reference Guetzkow and Dill 18 On the other hand, other empirical research determined that the all-channel structure performed better than the star for simple task design,Reference Shaw 19 while still others found no significant difference between the performance of the star and all-channel structures.Reference Mulder 20 , Reference Freeman 21 Therefore, empirical and experimental results suggested that centrality can have positive, negative, or no effect at all on performance.
Closeness and Betweenness Centrality Measures
Closeness measures the average distance of a node from all other nodes in the network. Totaling these distances and then inverting the resulting value changes the measure from a distance measure to a closeness measure. Point closeness is then the inverted sum of all the distances, and normalized closeness is N-1 divided by the sum of distances, making it an average closeness measure. Normalized closeness is calculated as followsReference Freeman 21 , Reference Valente 22 ):
 $$C_{{C=}} {{N{\minus}1} \over {\sum^ \,D_{{ij}} }}$$
In-closeness refers to the links directed to a person and out-closeness refers to the links initiated from a person. The practical implication is that the person with the highest out-closeness value is the person who can reach others in the fewest number of steps, whereas the person with the highest in-closeness value is the person others can reach in the fewest number of steps.Reference Valente 22
Betweenness centrality proposed by Freeman measures the frequency with which a person lies on the shortest path connecting everyone else in the network.Reference Freeman 21 The concept of betweenness is very appealing, as it measures the degree to which a node occupies a strategic position in a network, somewhat akin to a combination of bridging and centrality. Normalized betweenness centrality is calculated as follows:
 $$C_{b} = {{{{g_{{ij }} P_{k} } \over {g_{{ij}} }}} \over {n^{2} {\minus}3n{\plus}2}}$$
where g
ij
P
k counts the number of times point k lies on the geodesic (shortest path) connecting all other nodes (i and j), and g
ij
is the number of geodesics in the network. The maximum possible value that the numerator
 $$g_{{ij{\rm }}} {{P_{k} } \over {g_{{ij}} }}{\rm }$$
can reach is n
2−3n+2, so this is the normalization factor.Reference Freeman
21
) Because a geodesic path is directional, betweenness centrality is directional and hence separate calculations for in and out directions are needed. Freeman explained that betweenness centrality captures a gate-keeping function: if members high in betweenness oppose an idea, its diffusion to other segments of the group might be blocked.Reference Freeman
21
Closeness centrality captures a communication role such that people high in closeness can rapidly communicate an idea to many others.Reference Valente
22
Network Density
Density is the first measurement to be discussed. It is the number of connections in a network reported as a fraction of the total links, and is calculated as follows:
 $$D={l \over {N(N{\minus}1)}}$$
where l is the number of links in the network and n is the network size. Equation 1.7 is applicable to asymmetric networks, but the numerator must be multiplied by 2 for undirected (symmetric) networks. The relationship between size and density are inverse: as size increases, density decreases. One reason for this is that the number of other people a person knows or can establish relationships with has practical limits.
Tie Strength
Tie strength expresses the excellence of connection between 2 nodes in a network. According to Granovetter, the strength of the relationship between 2 nodes can be expressed as a mixture of the amount of time and the mutual services that distinguish the link between them.Reference Granovetter 23
Data Collection and Analysis
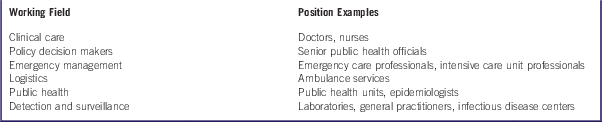
Interviews with professionals were used to construct the network of the participating organizations in pandemic intervention and coordination. Interviews snowballed from 1 participant to that participant’s interesting alternatives who were considered to have knowledge that could further extend the scope of information. Table 3 shows some of the people in those positions who participated in the survey.
Some of the Positions That Participated in Pandemic Coordination

After a detailed examination of the research that has been conducted in disease outbreak coordination, a gap in the research identified some interesting questions yet to be answered:
-
∙ How does one identify the initiation point for this multiagent coordination process and when it will be over?
-
∙ What are the characteristics of the organizations that will play a central role during the evolution of coordination?
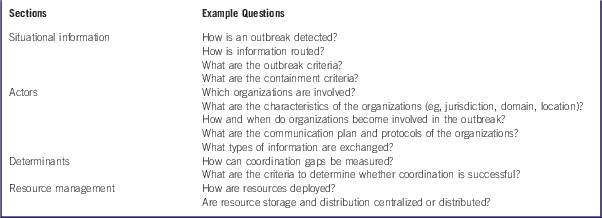
The next step was to dissect the research questions into tangible ones, which were allotted focal points (Table 4).
Summary of the Main Focal Points and Their Relevant Questions

Administering the Questionnaire
Table 5 shows the proposed matrix for each section of the questions, along with the proposed interviewees—the titles have been generalized to reflect different health authorities’ structures and names that might vary among states or countries.
Matrix of Proposed Interviewees for the Qualitative Questionnaire

Survey Design
To design a quantitative survey based on the relational quality of network methods requires a shift in thinking about research methodology. The network approach focuses on relations between nodes (organizations in this case) rather than between subjects’ attributes. Hence study design, data collection, and data analysis incorporated this relational perspective, requiring unique approaches to each.Reference Luke and Harris 24 )
Administering the Survey
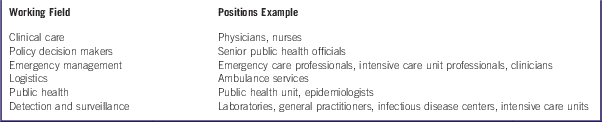
The egocentric network approach was more practical and less expensive, and hence was adopted for the study. It also allowed the participant to freely recall alternatives and could include alternatives not conceived of by the researcher. This response would not have been possible with the sociocentric approach. Table 6 shows the matrix of expertise targeted.
Overview of the Positions Surveyed

The sociocentric method was used, based on a snowballing technique, to select the candidates for interview. It was decided to produce the data collection instrument in 2 phases to ensure that it was reliable and valid. An exploratory questionnaire was first designed and was used to further the design of the main instrument. The main instrument collected both qualitative and quantitative data. Quantitative data was used to provide empirical validation or rejection of the proposed hypotheses, and the qualitative data provided in-depth views of causes, reasons, and context for the empirical results. Surveys were conducted with approximately 70 respondents who represented a wide range of professional and bureaucratic backgrounds and positions within the network that managed pandemic intervention. This combination of the sociocentric relational network, the qualitative and quantitative instruments, and the respondents interviewed created a wealth of domain-related information about coordination related to the pandemic, as well as statistical data for validation.
Results
Networks of Preparedness and Response During Australian H1N1 Outbreak
This section reports the results relating to the hypotheses about formal coordination before and during the outbreak. The Pearson correlation is a measure of how variables are related, and it shows the linear relationship and the direction of the relationship between the 2 variables.
To test H1a, a partial correlation test was applied to explore the relationship between the independent (degree centrality) and the dependent (coordination robustness) variables. Also, a t test was applied to test for the significance between these variables. The results for coordination before and during the outbreak were presented separately. The Pearson test was used in the correlation analysis. The calculated Ridit values for both degree centrality and coordination start-off were used for the analysis.
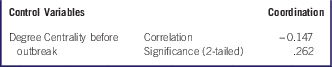
Table 7 shows the correlation results for before the outbreak. The results demonstrate a negative but non-significant correlation (ρ=−0.0147, significance 2-tailed.05). Hence, initially it can be said that no direct relationship was found between the centrality of an actor and its coordination robustness before the outbreak, as per H1a.
Correlation Between Degree Centrality and Coordination for Formal Coordination Before the Outbreak

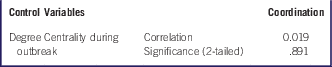
The second correlation to be tested against H1a was for the period during the outbreak. The same tests were applied for the set of data derived from question 26. The results are provided in Table 8. Again, no correlation was found (Pearson coefficient ρ=0.019, significance =.0891 for 2-tailed). Therefore, the centrality measure of the respondents either before or during the outbreak did not result directly in their initiating the response when the outbreak was announced. Hence H0 is still valid for both scenarios.
Correlation Between Degree Centrality and Coordination for Formal Coordination During the Outbreak

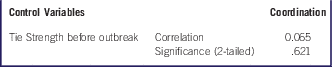
Tie strength was calculated based on the frequency of communication between different nodes. As before, the same Pearson correlation and t test were applied to test for a correlation between the independent and dependent variables. Ridit-derived values were again used. Table 9 shows the results of those tests for the phase before the outbreak. Here too, no correlation between coordination and tie strength (ρ=0.065 and significance =.621) was observed before the outbreak. This finding meant that the null hypothesis is still valid, and tie strength with others before the outbreak does not indicate that coordination would be more effective during the outbreak.
Correlation and t test Between Tie Strength and Coordination Before the Outbreak

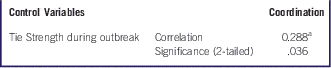
H1b also predicted a relationship between tie strength and coordination during the outbreak. Pearson correlation and t test results are shown in Table 10. The tie strength correlation value (ρ=2.88 and significance <.05) indicated that the significance and association between tie strength and robustness of coordination during the outbreak, and hypothesis H0 was invalid. In other words, the more frequent communication was with other organizations, the faster coordination was achieved.
Correlation and t test Between Tie Strength and Coordination During the Outbreak

a Significant correlation.
Tier connectedness measures the variance of a node’s links between different jurisdictional and tier levels. The results given herein are for the hypothesis before and during the outbreak.
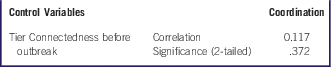
Correlation and t test analysis were performed for tier connectedness before the outbreak (results are shown in Table 11). The results (ρ=0.117 and significance >.05) did not indicate any correlation between connectedness and coordination performance for formal coordination before the outbreak.
Correlation and t Test Between Tier Connectedness and Coordination Before the Outbreak

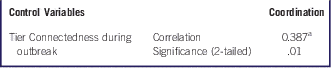
The same tests were performed for tier connectedness during the outbreak (results are shown in Table 12). The correlation result (ρ=0.387 and significance =.01) showed a significant and positive correlation between tier connectedness and coordination performance. This finding invalidates the null hypothesis and consequently validates H1c; that is, during the disease outbreak tiers of connectedness positively affected coordination performance.
Correlation and t Test Between Tier Connectedness and Coordination During the Outbreak

a Significant correlation.
Discussion
The lack of correlation can be attributed to the fact that communication guidelines and procedures were adhered to before the outbreak actually started. Organizations tend to communicate mostly with people and organizations with which they usually have a previous relationship, as suggested by 1 respondent, we are calling Jon:
“Well, we’re coordinating all of the time with ambulance and we’re coordinating all of the time with GPs. We’re coordinating all of the time certainly internally with specialists departments such as Respiratory and obviously Public Health.” He also said, “So before disease outbreak happens, we’re certainly communicating constantly with all of those departments which is ongoing—an ongoing sort of management. We would be with all of our own facilities.”
It also appears that before the outbreak, health workers tended to focus on increasing their communication frequency rather than widening the spectrum of their communication. In network efficiency, it is not the number of direct links from 1 node that increases efficiency but the number of total links, as compared to the number of alternatives. Thus, if the links were well established and operated according to the standard operating procedures, it would be sufficient. Creating more links does not tend to increase the coordination performance in the disease outbreak context.
For example, 1 respondent we are calling Mitchel reported, “We were communicating with—probably more through—the HASFAC that communication was coordinated and then the HASFAC would be responsible for disseminating that information to the other agencies and the same for the other agencies with getting that information.”
Another respondent, we are calling Sylvie reported, “Talk to your own administration first, and I hope the Department of Health. Usually you coordinate with your institution and administration and by that time you hope that someone from the Department of Health would contact you and ask what you need.”
During the disease outbreak, nodes definitely tend to increase their centrality by extending and initiating new links to new alternatives. Reasons for this may be different, such as providing or seeking information, resources, and decisions. Whether this will actually increase the efficiency of the coordination as a whole is still questionable.
According to the correlation result, increasing centrality does not correlate with better performance during this stage either. The reason might be that many of these links are actually redundant, as reported by a respondent we are calling Mark:
"Duplication of information happened because PHUs were also getting information from hospitals and sending it to the State. It was a mess. Infection control people used to give us information and we sent it to the bunker. They collated info from ICU... And sent to us, we aggregated them and sent them to the bunker. We sent a copy to (PHUs)…. It wasn’t a disaster so the communication was bad; the chain of command was not followed. It wasn’t a disaster as such.”
Another respondent we are calling Sam also noted: “We get information from multiple channels; I will get the same email six times per day. From PUH, NSW Health, etc…There were lots of emails flowing around.”
Unlike the laboratory setup of those experiments, this study explored complex dynamic networks that evolved within a disease outbreak response. In such extreme and dynamic events, standard operating procedures cannot always be followed. These events required a dynamic coordinated system that could adapt to unanticipated and evolving conditions. In such situations, 1 individual alone cannot effectively handle tasks that are complex in nature. The same holds true when the central actors of any network structure are overwhelmed with many communications from the other actors in that structure.
This finding suggests that decentralized structures (in terms of degree centrality) might perform better than centralized ones. A decentralized network structure can minimize the problems associated with a centralized structure with a single point of vulnerability by taking a centralized network and separating it into modules of smaller stars that are connected through additional links. A decentralized structure provides a better opportunity for organizations to maintain self-reliance, because emergency management personnel are adapted to working independently.
In a decentralized network, decisions can be made quickly, allowing the structure to react to emergencies. An emergency manager can usually make a decision without having to wait for it to travel through a chain of command, a feature that allows emergency agencies to react quickly to situations in which fast action can mean saving lives. Also, networks in which a few actors have a high degree of centrality may induce increasingly centralized decision making, which in turn may have a negative influence on coordination performance. A decentralized network relieves some of the load of emergency managers when others are allowed to perform some tasks. Emergency managers can then spend more time on big-picture items and concentrate on the most important decisions.
For example, a respondent we are calling Melanie reported, “AHS: daily by email and weekly by teleconference, there w[ere] about 80–90 people in the teleconference which was awkward but we would manage. It was important because they had direct access and needed someone authoritative like [Senior Health Director name omitted] which was valuable and gave recognition of what they were doing.”
These findings suggested that before and during an outbreak plans should not focus on increasing the centralization of the personnel, as this does not necessarily lead to better pandemic management. Interestingly, some health workers were practicing the same concept. As respondent Melanie reported, “The communication lines existed but we escalated them when the pandemic was declared. In terms to forge new communication with groups, there was normal business communication and can’t see new communication being brought in.”
In addition, another respondent we are calling Catherine stated, “The organizations that we coordinated with are basically that I have said at the beginning, I didn’t feel any additional that we needed to speak to… but I didn’t find that there was new or unusual I didn’t talk to. There were pretty extensive networks across the whole of government so there wasn’t anyone new that I can recall.”
Conclusions
This study looked theoretically at how pandemics propagate, with the main focus on influenza in the H1N1 2009 outbreak in Australia. From this research, theories were proposed about how to measure the performance of formal coordination. The domain of the research highlighted that pandemic coordination is an ongoing task that must be addressed before and during a pandemic. Hence, the formal coordination was investigated before and during the pandemic. The findings showed that network measures (centrality, connectedness, and tie strength) were not associated with performance before the outbreak, but during the outbreak, network measures correlated with pandemic performance. Another network measure, the tier level of the organization, was found to moderate the relationship between the independent variables (tie strength, connectedness, and centrality) and the dependent variable (the initiation speed of outbreak coordination).
The implications of the research included building on the foundations of the new definitions of network theory. Additional contributions included enhancement of the research methodology and demonstration of the modeling of coordination in the context of pandemic coordination. Hence, we believe that this research has contributed to coordination theory by offering a generalized social network-based modeling framework with domain-based performance measures. Coordination theory has developed to the stage where it is acknowledged as being interdisciplinary and thus relevant to various fields and disciplines.
Another theoretical contribution is the approach, which followed model coordination. The traditional understanding of coordination has been one of “command and control” and “top to bottom,” even in the discipline of disaster management, which came from a military context. By conducting this research in a disease outbreak that was taking place in a complex environment in a large geographical area, this investigation has provided a new perspective for understanding how the structure of a collaborative network affects the performance of the overall network. We believe that this new approach for modeling coordination enriches and provides additional depth to the present literature of coordination theory.
Moreover, this research underlines the importance of networks for emergency staff working in complex environments, especially in health environments. From the data collected and correlated, the importance of social networks cannot be discounted when it comes to coordination. It is clear from the respondents that the health system had a general awareness and consensus regarding social networks. The findings emphasized the importance of quick communication (tie strength) within the public health system. However, it was found that degree centrality was not correlated with performance. Based on our findings, it can be recommended to practitioners that organizations should not increase their links to numerous other organizations but they should increase the frequency of communication with key organizations. Also, in the event of an emergency such as a pandemic, communication frequency should be increased from monthly to daily or weekly, if possible.