

A well-known transition occurred across the Great Plains, Southwest, and Rocky Mountain regions of North America beginning 12,700–12,600 cal BP (Meltzer Reference Meltzer2009; Surovell, Boyd et al. 2016), when the Clovis culture and its iconic fluted point was replaced by the Folsom culture and its likewise iconic point. Until 12,900–12,700 cal BP (Waters and Stafford Reference Waters and Stafford2007, Reference Waters, Stafford, Graf, Ketron and Waters2014), western Clovis groups hunted a variety of prey, including, on occasion, now-extinct megafauna such as mammoth and large bison (DeAngelis and Lyman Reference DeAngelis and Lyman2016; Emery-Wetherell et al. Reference Emery-Wetherell, McHorse and Davis2017; Grayson and Meltzer Reference Grayson and Meltzer2015; Meltzer Reference Meltzer2015; Surovell, Pelton et al. Reference Surovell, Boyd, Haynes and Hodgins2016). This period encompassed a climate that changed from global warming at the end of the Pleistocene to global cooling during the first century of the Younger Dryas (Sellet Reference Sellet, Robinson and Sellet2018; Straus and Goebel Reference Straus and Goebel2011).
Folsom technology began to replace Clovis technology in a process of technological or demic diffusion that appears to have originated on the northern Plains (Collard et al. Reference Collard, Buchanan, Hamilton and O'Brien2010; Surovell, Boyd et al. Reference Surovell, Boyd, Haynes and Hodgins2016). There, Folsom hunters focused on bison, which necessitated high residential mobility and large home ranges (Amick Reference Amick1996; Andrews et al. Reference Andrews, LaBelle and Seebach2008; Hofman Reference Hofman, Burgal, David, Enloe and Jaubert1999, Reference Hofman, Clark and Collins2002; Jennings Reference Jennings2012, Reference Jennings2016; Jennings et al. Reference Jennings, Pevny and Dickens2010; Kelly and Todd Reference Kelly and Todd1988). In more topographically varied settings, such as river valleys and the foothills of the Rocky Mountains, Folsom subsistence was more diverse (Cannon and Meltzer Reference Cannon and Meltzer2008; Kornfeld and Larson Reference Kornfeld and Larson2008). The Folsom culture, set in the Younger Dryas (Meltzer and Holliday Reference Meltzer and Holliday2010), lasted until approximately 12,200 cal BP, only four or five centuries after it first appeared (Surovell, Boyd et al. Reference Surovell, Boyd, Haynes and Hodgins2016).
Differences in the key diagnostic features of the Clovis and Folsom complexes—both flaked stone projectile points—are well documented. Clovis points are bifacially flaked and lanceolate in shape, with parallel to slightly convex sides, concave bases, and short basal flutes that extend one-quarter to one-third of a point's length (Wormington Reference Wormington1957). An empirically supported function of Clovis flutes is that they were shock absorbers, which redistributed stress and relocated damage in order to prevent catastrophic failure (Thomas et al. Reference Thomas, Story, Eren, Buchanan, Andrews, O'Brien and Meltzer2017). Folsom points are lanceolate or lozenge-shaped and usually smaller and lighter than Clovis points, with flute scars that travel two-thirds or more of the point's length. There are currently no empirically well-supported hypotheses for the precise function(s) of Folsom fluting (Ahler and Geib Reference Ahler and Geib2000; Sellet Reference Sellet, Robinson and Sellet2018), although it likely was a kind of improvement on Clovis fluting.
Explanations for the apparent size difference between Clovis and Folsom points have focused on differences in delivery system and the availability and size of prey. Recent evidence suggests that the delivery system was not a factor, as both Clovis and Folsom points appear to have been used with the atlatl and dart (Hutchings Reference Hutchings2015). Buchanan and colleagues (Reference Buchanan, Collard, Hamilton and O'Brien2011) found some support for the prey hypothesis, showing that Clovis and Folsom points used to hunt bison were smaller than Clovis points used to hunt mammoth, but they also noted a size difference between Clovis points used to hunt bison and Folsom points, with the latter being smaller.
It has long been proposed that, as a group, Folsom points are more uniform in shape and size than Clovis points (Ahler and Geib Reference Ahler and Geib2000; Boldurian Reference Boldurian1990; Frison and Bradley Reference Frison and Bradley1980; Tunnell and Johnson Reference Tunnell and Johnson2000; Wilmsen and Roberts Reference Wilmsen and Roberts1978). An influential study by Judge (Reference Judge1973) compared coefficients of variation for a suite of measurements taken on a sample of Clovis and Folsom points from the middle Rio Grande Valley of New Mexico. He primarily measured point bases, arguing that the base was the critical area where points were affixed to darts and hence less subject to changes resulting from resharpening (but see Buchanan et al. Reference Buchanan, Eren, Boulanger and O'Brien2015). The study showed that Folsom points were less variable than Clovis points, although Judge cautioned that further studies using materials from beyond the middle Rio Grande Valley were needed.
Several other researchers observed the relative uniformity of Folsom points noted by Judge. Boldurian and colleagues (Reference Boldurian, Fitzgibbons and Shelley1985), for example, suggested that Folsom base widths were standardized to fit an anvil and backstop device used to remove channel flakes from Folsom preforms, although Folsom knapping and fluting can be done much more easily with direct percussion (Patten Reference Patten, Clark and Collins2002, Reference Patten2005). Ahler and Geib (Reference Ahler and Geib2000) also linked the perceived uniformity of Folsom to the process of fluting and hafting. They argued that Folsom points served as replaceable components in the weapon system and that the point was designed to be fitted precisely into a haft. If dulled or damaged, the point could be resharpened and reset in the haft for continued use (see also Bement Reference Bement2016). Thus, the uniformity of Folsom point bases has been argued to be purposely standardized to fit interchangeably into hafts and to reduce risk of failure when hunting bison (Ahler and Geib Reference Ahler and Geib2000; Amick Reference Amick1994; Boldurian et al. Reference Boldurian, Fitzgibbons and Shelley1985; Hofman Reference Hofman, Montet-White and Holen1991, Reference Hofman, Stanford and Day1992, Reference Hofman, Soressi and Dibble2003; Hunzicker Reference Hunzicker2008; Kelly and Todd Reference Kelly and Todd1988; Surovell Reference Surovell2009).
Our study extends Judge's analysis beyond the middle Rio Grande Valley and examines a large sample of points from across the Folsom range of the Great Plains, Rocky Mountains, and Southwest. Although our primary focus is on point shape, given our belief that shape is a critical aspect of form in terms of performance characteristics (e.g., Cheshier and Kelly Reference Cheshier and Kelly2006), we also tested for differences in the variability of Folsom and Clovis point size. We conducted four sets of analyses. First, we tested for differences in the amount of variation in maximum length and maximum width of Clovis and Folsom points. Second, we tested the hypothesis that Folsom bases are more standardized in shape than Clovis bases. To conduct this research, we captured base shape by using geometric morphometrics (GM), which is a suite of methods that remove the effects of size prior to shape analysis (Dryden and Mardia Reference Dryden and Mardia1998; O'Higgins Reference O'Higgins, O'Higgins and Cohn2000; Slice Reference Slice2005, Reference Slice2007), and then applied statistical tests of variation. Third, we compared Folsom and Clovis blade-shape variation. A previous study by Buchanan and colleagues (Reference Buchanan, O'Brien, Kilby, Huckell and Collard2012) demonstrated that, at least with Clovis, blades and bases exhibit similar levels of variation, suggesting that if blades were resharpened, they were under similar constraints as bases. With this idea in mind, we carried out analyses that compared variation in Folsom blade shape to Clovis blade shape. Fourth, we compared Folsom base-to-blade variation to Clovis base-to-blade variation to determine if the results of the study by Buchanan and colleagues could be replicated.
Materials and Methods
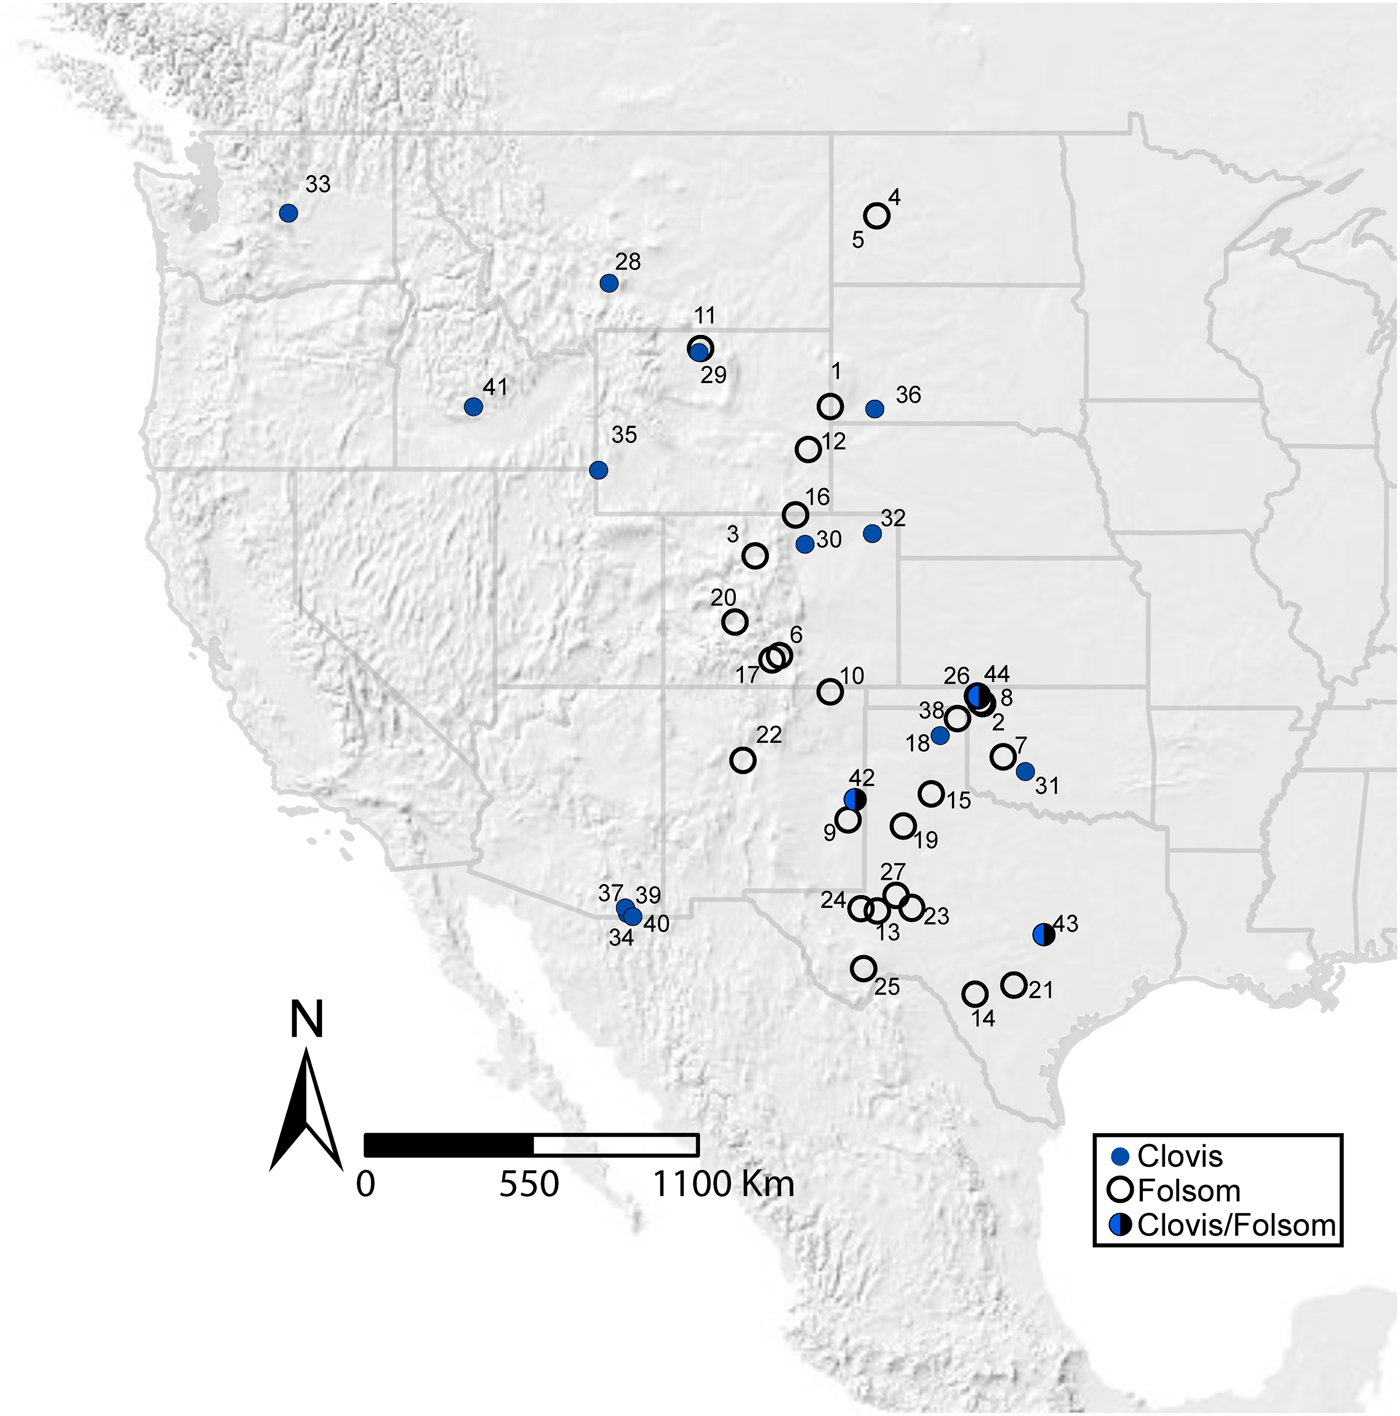
We examined Clovis and Folsom points in assemblages from across the western United States. The Clovis point sample (n = 125) is described in previous studies (Buchanan et al. Reference Buchanan, Collard, Hamilton and O'Brien2011, Reference Buchanan, Collard and O'Brien2014) and includes specimens from well-known assemblages from the Great Plains, Rocky Mountains, Southwest, and Northwest (Figure 1; see Supplemental Table 1). The Folsom point sample (n = 156) is more spatially restricted and includes points from sites located in the Great Plains, Rocky Mountains, and Southwest (Figure 1).
Map of the western United States showing the location of sites included in the analysis. Key: Folsom Sites – 1 Agate Basin, 2 Badger Hole, 3 Barger Gulch, 4 Big Black, 5 Bobtail Wolf, 6 Cattle Guard, 7 Cedar Creek, 8 Cooper, 9 Elida, 10 Folsom, 11 Hanson, 12 Hell Gap, 13 Hot Tubb, 14 Kincaid, 15 Lake Theo, 16 Lindenmeier, 17 Linger, 18 Lipscomb, 19 Lubbock Lake, 20 Mountaineer, 21 Pavo Real, 22 Rio Rancho, 23 Scharbauer, 24 Shifting Sands, 25 Shirey Flats, 26 Waugh, 27 Wyche Ranch. Clovis Sites – 28 Anzick, 29 Colby, 30 Dent, 31 Domebo, 32 Drake, 33 East Wenatchee, 34 Escapule, 35 Fenn, 36 Lange Ferguson, 37 Lehner, 38 Miami, 39 Murray Springs, 40 Naco, 41 Simon. Multicomponent Clovis/Folsom Sites – 42 Blackwater Draw/Mitchell, 43 Gault, 44 Jake Bluff. (Color online)

For the size analysis, we used published measurements of maximum length and width, or in some cases took measurements on the artifacts ourselves. Because neither variable conformed to normality according to Shapiro-Wilk tests (length: W = 0.794, p < 0.000; width: W = 0.832, p < 0.000), we used distribution-free Fligner-Killeen (FK) tests to compare coefficients of variation (CV) among the samples (Fligner and Killeen Reference Fligner and Killeen1976). The CV normalizes the amount of variation in a set of measurements and is calculated by dividing the sample standard deviation by the sample mean and multiplying the quotient by 100. The FK test statistically assesses differences in these measures.
For our shape analyses, we used digital images of Clovis and Folsom points to record landmark positions that were subsequently analyzed with GM methods. Clovis and Folsom point images were taken by the first author, or in cases where collections were not available or were not visited, suitable published images were used. The point images were used for two-dimensional landmark digitization and subsequent GM analysis. Three primary landmarks were positioned on the digital image of each point, one at the tip and two at the basal ears. Twenty semilandmarks were placed between the primary landmarks using a procedure that makes their positions geometrically correspondent (Lycett and von Cramon-Taubadel Reference Lycett and von Cramon-Taubadel2013). Superimposed, equally spaced line segments drawn between the primary landmarks provided the framework for the placement of semilandmarks. The number of landmarks was the same as in our previous studies (e.g., Buchanan et al. Reference Buchanan, Collard, Hamilton and O'Brien2011, Reference Buchanan, Collard and O'Brien2014), making the new analyses comparable. This number of landmarks provides a level of detail that has been shown to effectively capture the relevant aspects of Paleoindian point shape differences. Increasing the number of landmarks undoubtedly would provide a finer-grain view of shape but would also have the detrimental effect of eventually rendering each specimen as being unique.
Following the digitization of the landmark configurations, we carried out a superimposition procedure using the tpsSuper program (Rohlf Reference Rohlf2015a), which centers and scales the landmark configurations to unit centroid size to reduce size effects. After that, an average, or consensus, configuration was computed. From that consensus configuration, individual landmark configurations were translated and rotated using least-squares criteria to minimize residual differences between sets of landmarks. The resulting variation among the landmark positions—Procrustes residuals—are interpreted as shape differences in Kendall shape space. Projection to the tangent Euclidean space and extraction of partial warps (eigenvectors of the bending-energy matrix that describe local deformation along a coordinate axis) and the uniform component (global information on deformation) were performed using the tpsSmall (Rohlf Reference Rohlf2015b) and tpsRelw programs (Rohlf Reference Rohlf2016), respectively. Partial warps and uniform components represent all information about the shape of specimens (Rohlf et al. Reference Rohlf, Loy and Corti1996; Slice Reference Slice2005). Lastly, relative warps were computed from the partial warps using the tpsRelw program. Relative warps are the principal components of the shape variables—the partial warps—and reflect the major patterns of shape variation within a group of specimens (Rohlf Reference Rohlf, Marcus, Bello and García-Valdecasas1993).
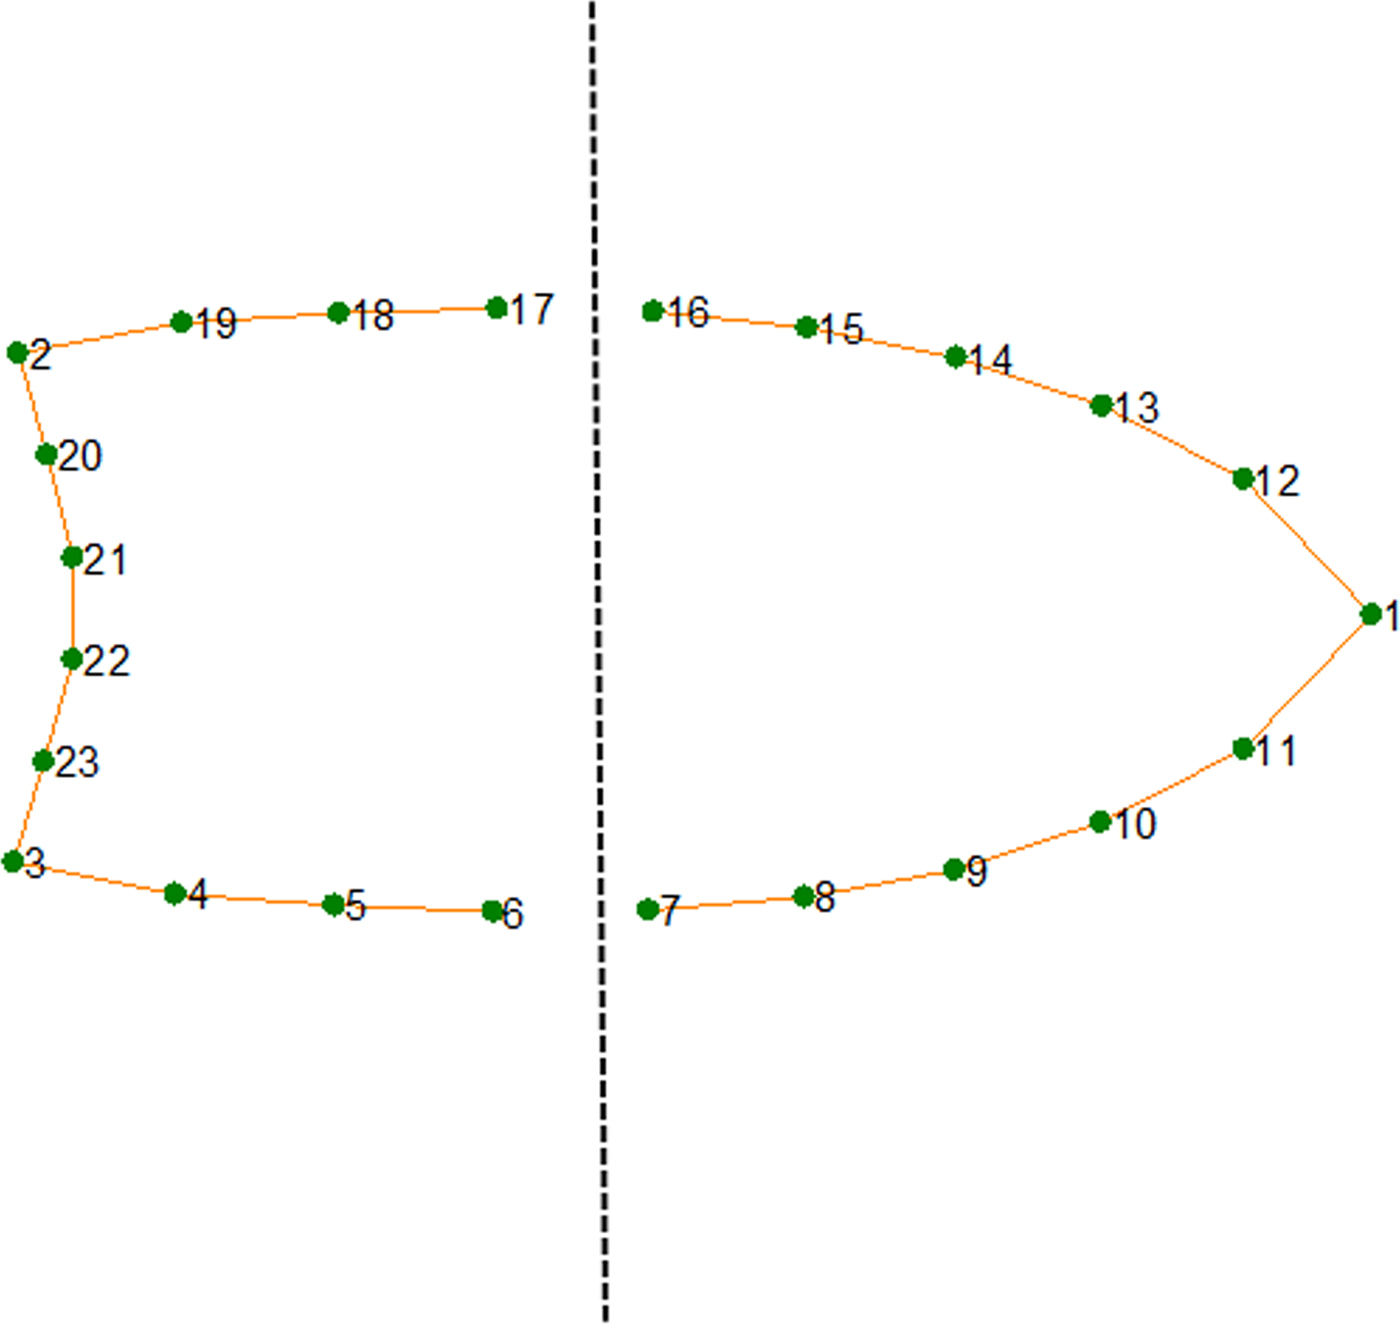
We conducted the GM procedures outlined above separately on the base and blade configurations of the Clovis and Folsom points (Figure 2). Base configurations were calculated using two primary landmarks (the basal ear tips; see Figure 2, numbers 2 and 3) and 10 semilandmarks (see Figure 2, numbers 4–6, 17–19, and 20–23). Blade configurations were calculated using the first primary landmark—located at the tip—and 10 semilandmarks (see Figure 2, numbers 7–11 and 12–16).
Image of the consensus configuration for Clovis and Folsom points (n = 281) with landmarks shown in gray (green online). Primary landmarks are labeled 1–3; the dashed line demarcates the split between base and blade configurations. The base configuration consists of landmarks 2–6 and 17–23, and the blade configuration consists of landmarks 1 and 7–16. (Color online)

After obtaining the relative warps for both the base and blade landmark configurations, we visually and statistically compared the variance of the Clovis sample to that of the Folsom sample. Relative warps, like principal components, reduce variation in a dataset to a smaller number of variables that capture different aspects of the overall variation. In conducting our comparison, we first visually assessed bivariate plots of the first two relative warps for the base and blade datasets, then used the F test to evaluate differences in variance. This technique tests the hypothesis that the variances in the groups are equal—that is, the difference between the variances is zero. If the test is significant at the p < 0.05 level, then we conclude that the null hypothesis is incorrect and that the variances differ significantly. Prior to conducting the F tests, we used Shapiro-Wilk tests (Razali and Wah Reference Razali and Wah2011) to determine that the variables exhibited normal distributions. The results indicated that one variable (relative warp 1 for Folsom bases) was significantly different from normal (Supplemental Table 2), and thus we report nonparametric Monte Carlo–derived p-values. The Monte Carlo procedure does not rely on the normal distribution to derive a p-value; instead, it calculates the difference in variance in 9,999 permutations of the data and compares these to the original difference to calculate the p-value. We carried out statistical tests using the free software PAST 3.01 (Hammer et al. Reference Hammer, Harper and Ryan2001).
Results
Comparing Clovis and Folsom Size Variation
Clovis points are on average longer and wider than Folsom points (Supplemental Table 3), and the FK tests show that the associated coefficients of variation for length (T = 188.22; p < 0.000) and width (T = 188.4; p < 0.000) are statistically different between Clovis and Folsom points. Clovis points are more variable than Folsom in both size measures.
Comparing Clovis and Folsom Base-Shape Variation
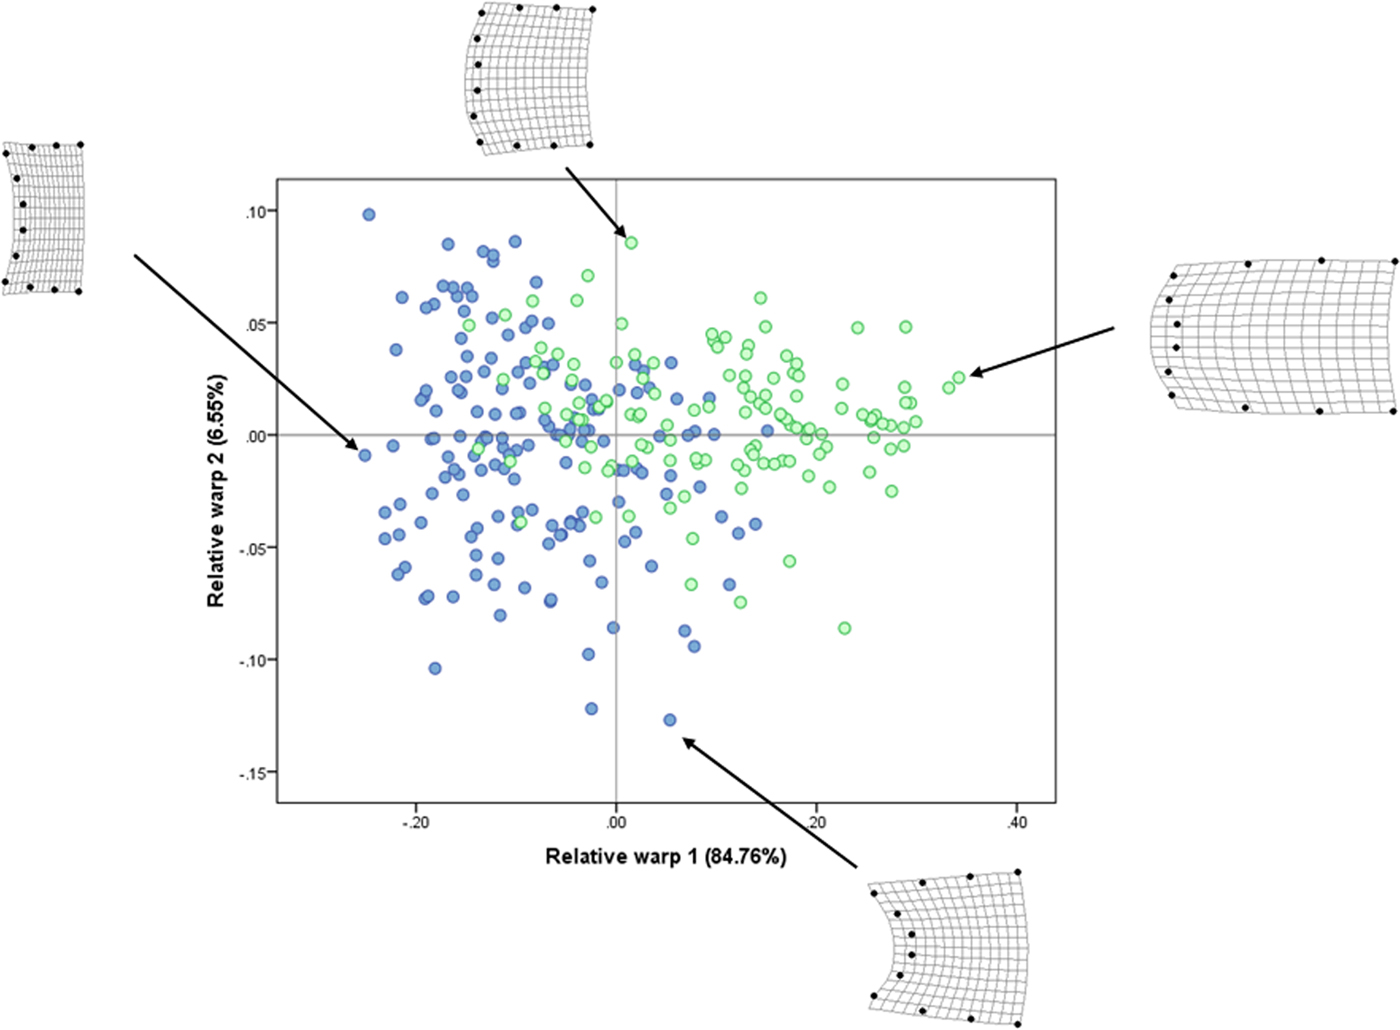
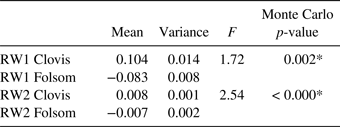
The first two relative warps of the Clovis and Folsom base landmark configurations account for 91.32% of the overall variation in the dataset. The first relative warp (RW1) captures most of the variation (84.76%). Base shape along the RW1 axis changes from narrow, long bases with bell-shaped basal indentations on the positive, or right, side of the axis to wide, short bases with shallow concave basal indentations on the negative, or left, side (Figure 3). Clovis bases are distributed primarily along the positive end of the RW1 axis (mean = 0.104), and Folsom bases are centered on the negative end (mean = –0.083). The second relative warp (RW2) accounts for only 6.55% of the overall variation. Shape variation along the RW2 axis is represented primarily by depth of basal concavity, ranging from shallow on the positive, or upper, end of the axis to deeply concave and more constricted on the negative, or lower, end. On the RW2 axis, both Clovis and Folsom bases are centered very close to the zero midline, with Clovis bases centered on the positive side (mean = 0.008) and Folsom bases positioned on the negative side (mean = –0.007).
Bivariate plot of Clovis (green circles, light gray in print) and Folsom (blue circles, dark gray in print) base-shape variation. The X-axis shows relative warp 1 scores, representing 84.76% of the overall variation in the dataset, and the Y-axis shows relative warp 2 scores, representing 6.55% of the overall variation. The four point-base images are deformations from the consensus configuration that are used to display the shape space defined by the first two relative warps. (Color online)

Clovis bases have nearly double the amount of variation along the RW1 axis. Results of F tests confirm this observation: Clovis base shapes are significantly more variable than Folsom bases for RW1 (Table 1). For RW2 scores, representing about 6% of the overall variation, Folsom bases are more variable than Clovis bases.
Mean and Variance of Relative Warp (RW) Scores Associated with Clovis (n = 125) and Folsom (n = 156) Bases. Results of Tests for Equal Variances between Clovis and Folsom Relative Warp Scores Are Reported in the Last Two Columns.

*Indicates significance using the Bonferroni adjusted significance level of α = 0.025.
Comparing Clovis and Folsom Blade-Shape Variation
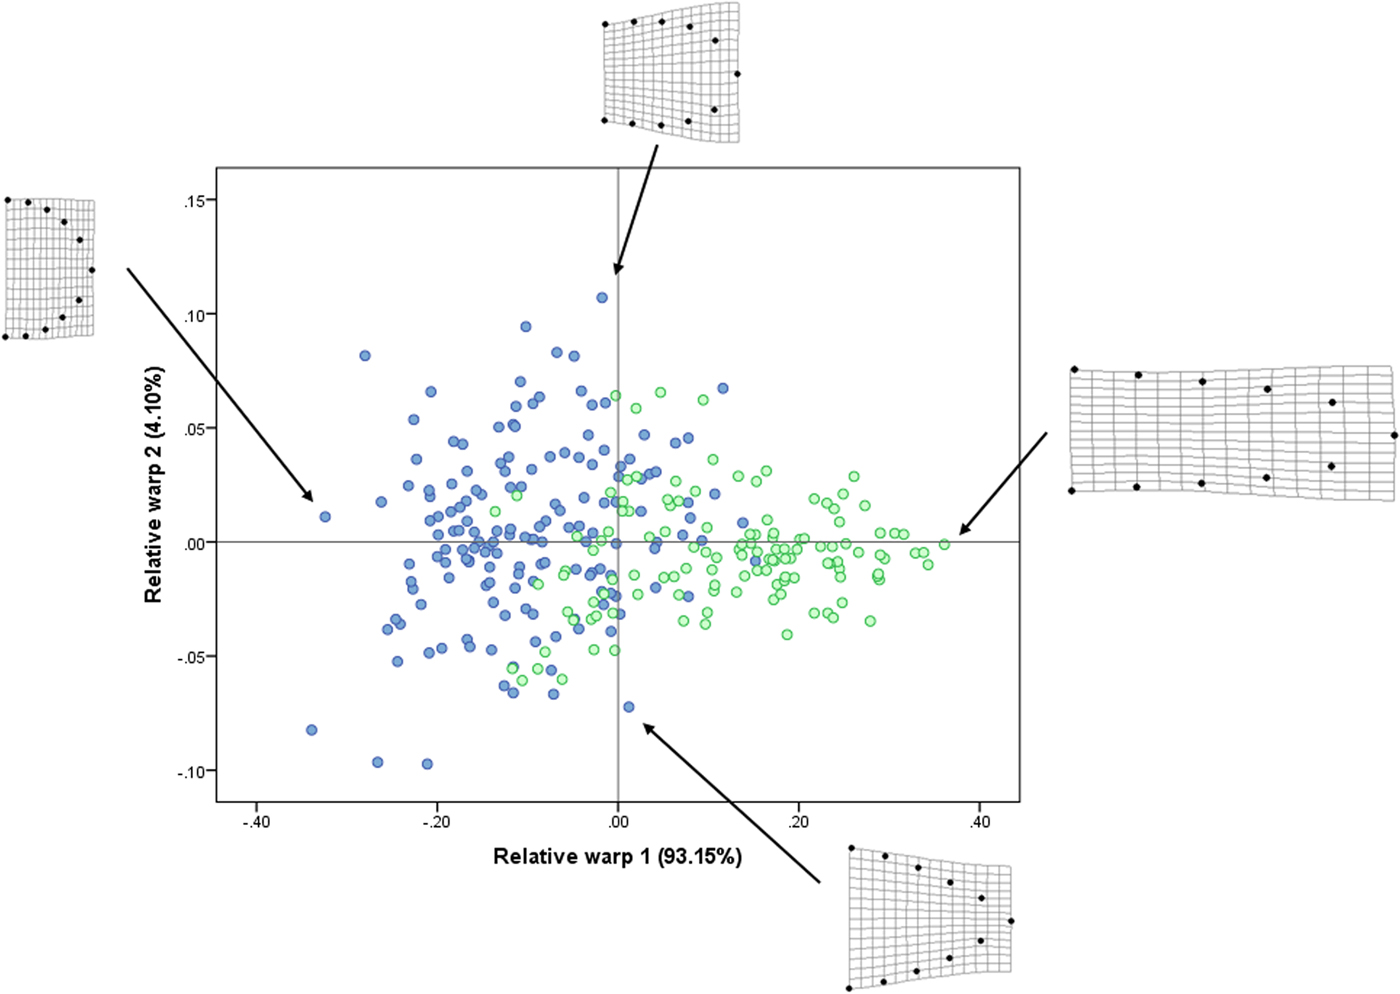
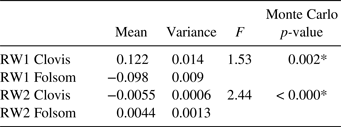
For Clovis and Folsom blade shapes, the first two relative warps encompass 97.25% of the overall variation, with RW1 representing 93.15%. Blade shape along that axis changes from long and narrow on the positive, or right, side to short and wide on the negative, or left, side (Figure 4). Clovis blades are located primarily at the positive end of the RW1 axis (mean = 0.122) and Folsom blades primarily at the negative end (mean = –0.098). RW2 accounts for only 4.10% of the variation. Shape variation along that axis is represented by specimens with converging proximal blades at the positive, or upper, end and by specimens with expanding proximal blades at the negative, or lower, end. On the RW2 axis, average Clovis and Folsom blades are close to the zero midline, with Clovis bases located on the negative side (mean = –0.0055) and Folsom bases on the positive side (mean = 0.0044).
Bivariate plot of Clovis (green circles online, light gray in print) and Folsom (blue circles online, dark gray in print) blade-shape variation. The X-axis shows relative warp 1 scores, representing 93.15% of the overall variation in the dataset, and the Y-axis shows relative warp 2 scores, representing 4.10% of the overall variation. The four point-blade images are deformations from the consensus configuration that are used to display the shape space defined by the first two relative warps. (Color online)

An F test showed that Clovis blades are significantly more variable than Folsom blades along the primary RW1 axis (Table 2). Along the RW2 axis, which, again, represents only 4.10% of the overall variation, an F test indicated that Folsom blades are more variable than Clovis blades.
Mean and Variance of Relative Warp (RW) Scores Associated with Clovis (n = 125) and Folsom (n = 156) Blades. Results of Tests for Equal Variances between Clovis and Folsom Relative Warp Scores Are Reported in the Last Two Columns.

*Indicates significance using the Bonferroni adjusted significance level of α = 0.025.
Comparing Base-to-Blade Variation within Types
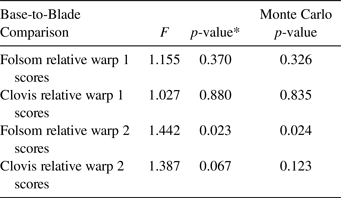
A follow-up analysis to the base and blade comparisons between Clovis and Folsom examined the variability between the base and the blade within the type samples. Buchanan and colleagues (Reference Buchanan, O'Brien, Kilby, Huckell and Collard2012) found that for Clovis points, basal measurements were not more variable than blade measurements. The results of our analysis agree with their finding and extend it to Folsom (Table 3). For both relative warps 1 and 2, Folsom bases have similar levels of variation to Folsom blades. This is also true for Clovis bases and blades.
Tests of Homogeneity of Variance between Base and Blade Portions of Clovis (n = 125) and Folsom (n = 156) Points.

*Indicates significance using the Bonferroni adjusted significance level of α = 0.0125.
Discussion
Judge's (Reference Judge1973) well-known finding that Folsom bases are more standardized than Clovis bases was based on a small sample of Early Paleoindian points from the middle Rio Grande Valley of New Mexico. We extended Judge's sample both in size and spatial coverage to provide a comprehensive test of the hypothesis. The findings from our first three sets of analyses are consistent with Judge's original results: Folsom points are shorter, narrower, and less variable than Clovis points; Folsom bases are less variable than Clovis bases; and Folsom blades are less variable than Clovis blades. Our results show that this pattern holds across western North America and is not limited to the region of New Mexico where Judge conducted his study.
Our fourth set of analyses compared base and blade variation within types. Judge (Reference Judge1973) hypothesized that the basal portion of Early Paleoindian points would be less variable than blade portions, as he assumed the latter would have been subject to resharpening. A study by Buchanan and colleagues (Reference Buchanan, O'Brien, Kilby, Huckell and Collard2012) indicated that this was not the case for Clovis points. Our results provide further support for Buchanan and colleagues’ (2012) comparison of Clovis base and blade measurements: Clovis blades are not more variable than Clovis bases. We also compared variation in Folsom bases to that in Folsom blades and found the same result: Folsom blades are not more variable than Folsom bases. These results call into question the generally untested assertion that resharpening results in more shape variation in Paleoindian point blades relative to bases (Thulman Reference Thulman2012). Rather, if resharpening was consistently applied to point blades, the consequence was size reduction of the blade, with little effect on blade shape. These results are consistent with findings by Buchanan and Collard (Reference Buchanan, Collard, Lycett and Chauhan2010) and Buchanan and colleagues (Reference Buchanan, O'Brien, Kilby, Huckell and Collard2012, Reference Buchanan, Eren, Boulanger and O'Brien2015).
Several researchers have offered explanations for the original observation made by Judge (Reference Judge1973)—and supported in our study—that Folsom is more uniform than Clovis. The most common explanation, and one for which Judge was himself a proponent, is that Folsom bases were standardized so that they could fit precisely designed haft systems (Ahler and Geib Reference Ahler and Geib2000; Bement Reference Bement2016; Boldurian Reference Boldurian1990). Further, it usually is argued that because Folsom hunters relied heavily on mobile and difficult-to-locate prey—primarily bison—they invested considerable time and energy in the design of their points and delivery systems. The standardization of Folsom points is suggested to have allowed hunters to easily resharpen (Ahler and Geib Reference Ahler and Geib2000) or replace (Bement Reference Bement2016) damaged points. Another closely related explanation for the uniformity of Folsom bases suggests more specifically that the process of fluting, which is believed to be integral to hafting, imposed strict constraints on the form of Folsom bases (Ahler and Geib Reference Ahler and Geib2000). Our findings are consistent with these explanations and may also provide evidence to further develop the details of the arguments. We believe a key to explaining why Folsom points are relatively more standardized than Clovis points has to do with activities attributed to the latter but perhaps not the former: cutting, slicing, and butchery.
Note that our results suggest that both point base and blade variability decreased over time from the Clovis to Folsom periods. This finding is consistent with the hypothesis that Folsom point standardization was the result of within-tool-kit specialization. Use-wear studies of Clovis points indicate they served as knives as well as weapon tips (Kay Reference Kay and Odell1996; Miller Reference Miller2013; Smallwood Reference Smallwood2006), but to our knowledge, no such multifunctionality has been noted for Folsom points. Indeed, use-wear analyses of Folsom points indicate mainly hafting damage, with no evidence of cutting wear (Ahler and Geib Reference Ahler and Geib2000). Further, ultrathin bifaces, which are common occurrences in Folsom assemblages, are often viewed as specialized knives (Jodry Reference Jodry1999; Root et al. Reference Root, William, Kay, Shifrin and Amick1999). When our results are considered in light of the above, the emerging picture indicates that variability in Clovis points relative to that in Folsom points reflects the evolution of one multifunctional tool into two specialized tools. This specialization of use among points is likely part of a suite of changes in Folsom stone acquisition and stone tool manufacture and usage that occurred as populations settled into increasingly familiar landscapes (see Buchanan et al. Reference Buchanan, Andrews, Kilby and Eren2018).
To further examine the possibility that Folsom points were more specialized functionally than Clovis points, we examined the modularity, or morphological integration (Klingenberg Reference Klingenberg2009), of Clovis and Folsom points. Modularity in this context is expressed as different subsets of a point operating independently (González-José and Charlin Reference González-José and Charlin2012). We defined two potential modules, the base and the blade (as outlined above). If modularity is weak, covariation between the base and blade will be high, whereas if modularity is strong, covariation will be low. Based on the hypothesis posited by several researchers (e.g., Ahler and Geib Reference Ahler and Geib2000; Bement Reference Bement1999, Reference Bement2016; Judge Reference Judge1973), Folsom points are expected to be modular, meaning that the blade is a component that was designed to be reworked and reduced with use, whereas the base was standardized to fit particular hafting elements.
To investigate the modularity hypothesis, we used the software MorphoJ (Klingenberg Reference Klingenberg2011) to determine the covariation between the base and blade sections of Clovis and Folsom points. Our results showed that the base and blade components of Folsom points do indeed have stronger modularity, or lower covariation (RV coefficient = 0.76), than do Clovis points (RV coefficient = 0.89). Thus, the base and blade portions of Folsom points are less integrated than they are in Clovis points and lend support to the hypothesis that the separate portions of Folsom points were independent modules: one module for precise hafting and the other for penetrating prey.
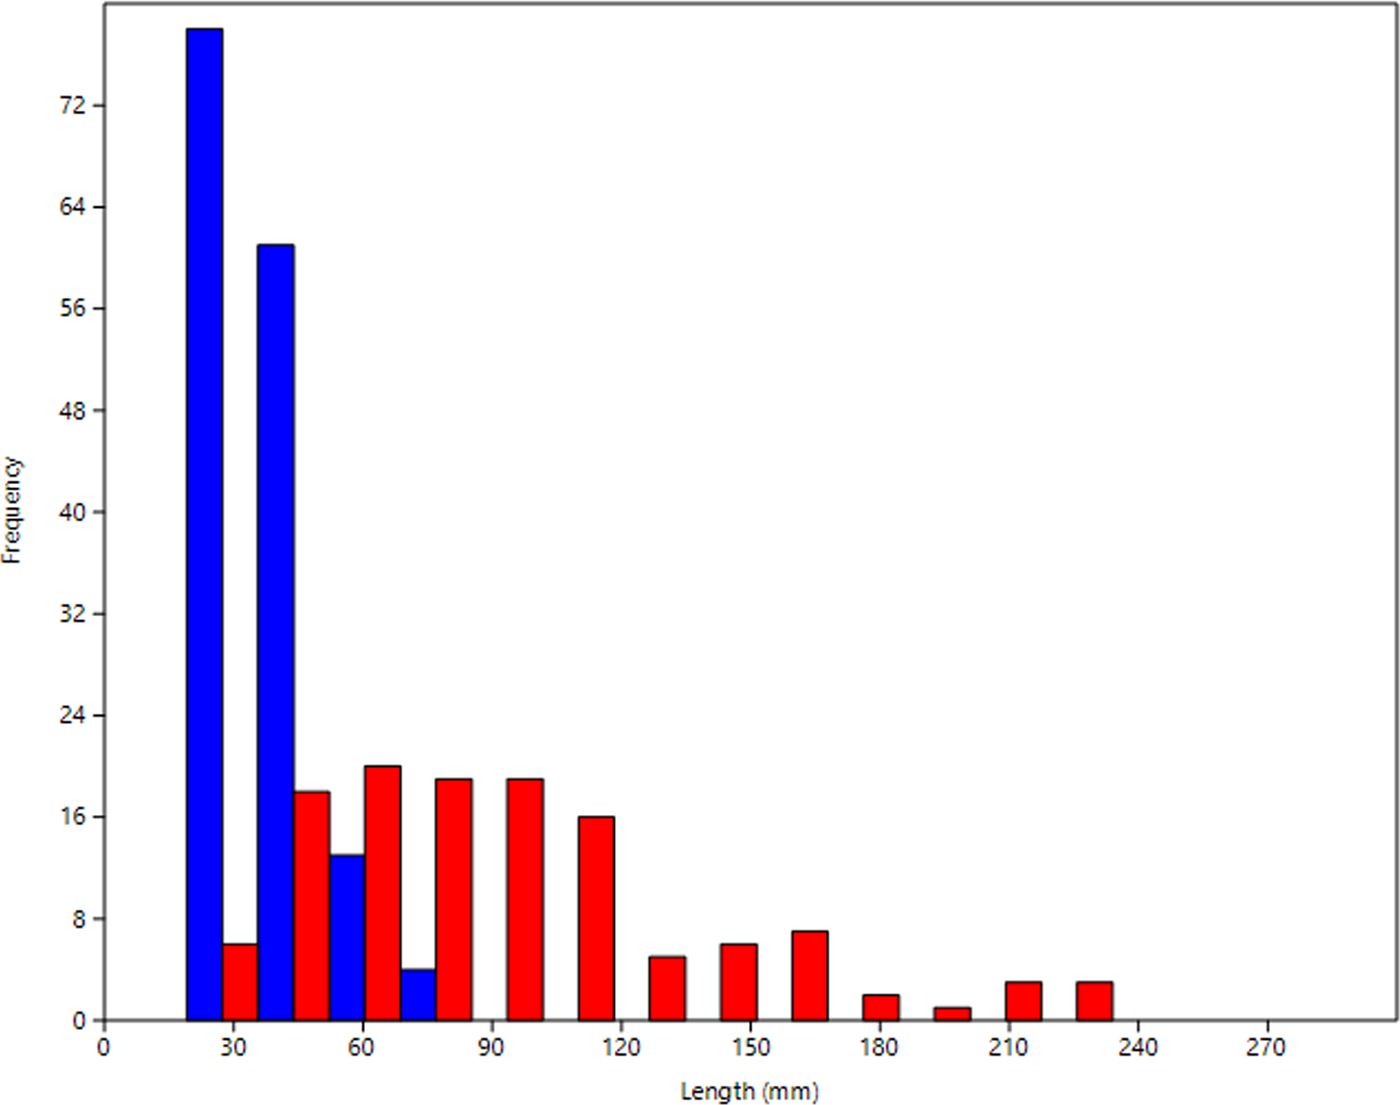
This finding leads us to ask, if Clovis points served as multifunctional tools and are more variable than Folsom, why are the base and blade segments more integrated for Clovis than Folsom? We suggest that the high covariation between base and blade modules in Clovis points is potentially indicative of the existence of different forms of Clovis points with different intended functions. A comparison of Clovis and Folsom point lengths shows the variability in Clovis relative to Folsom (Figure 5). In particular, there is a much wider range for Clovis, which suggests that points of different lengths served different functions. Short Clovis points might have been used primarily for hunting, whereas medium-sized and larger points might have been used for both hunting and butchering tasks.
Histogram of Clovis point lengths (red bars online, light gray in print) and Folsom point lengths (blue bars online, dark gray in print) for specimens in the study. (Color online)

Another question raised by our study concerns the relation between the emergence of Folsom point standardization and specialization versus the iconic full-face fluting of Folsom. Building off the hypotheses that have been developed previously (Ahler and Geib Reference Ahler and Geib2000; Bement Reference Bement1999, Reference Bement2016; Boldurian Reference Boldurian1990; Boldurian et al. Reference Boldurian, Fitzgibbons and Shelley1985), we propose that there likely was positive feedback between increasing flute length and point standardization, on the one hand, and functional specialization, on the other. Clovis fluting appears to be a functional attribute that allows a point to absorb significantly more energy, last longer, and remain intact relative to unfluted points (Thomas et al. Reference Thomas, Story, Eren, Buchanan, Andrews, O'Brien and Meltzer2017). The longer channel flakes removed from Folsom points appear to be exaggerations and extensions of a process that began with Clovis (Patten Reference Patten, Clark and Collins2002). This elongation of the channel flake could have been a consequence of Early Paleoindian knappers identifying the benefits of a flute and attempting to augment those benefits by increasing its length.
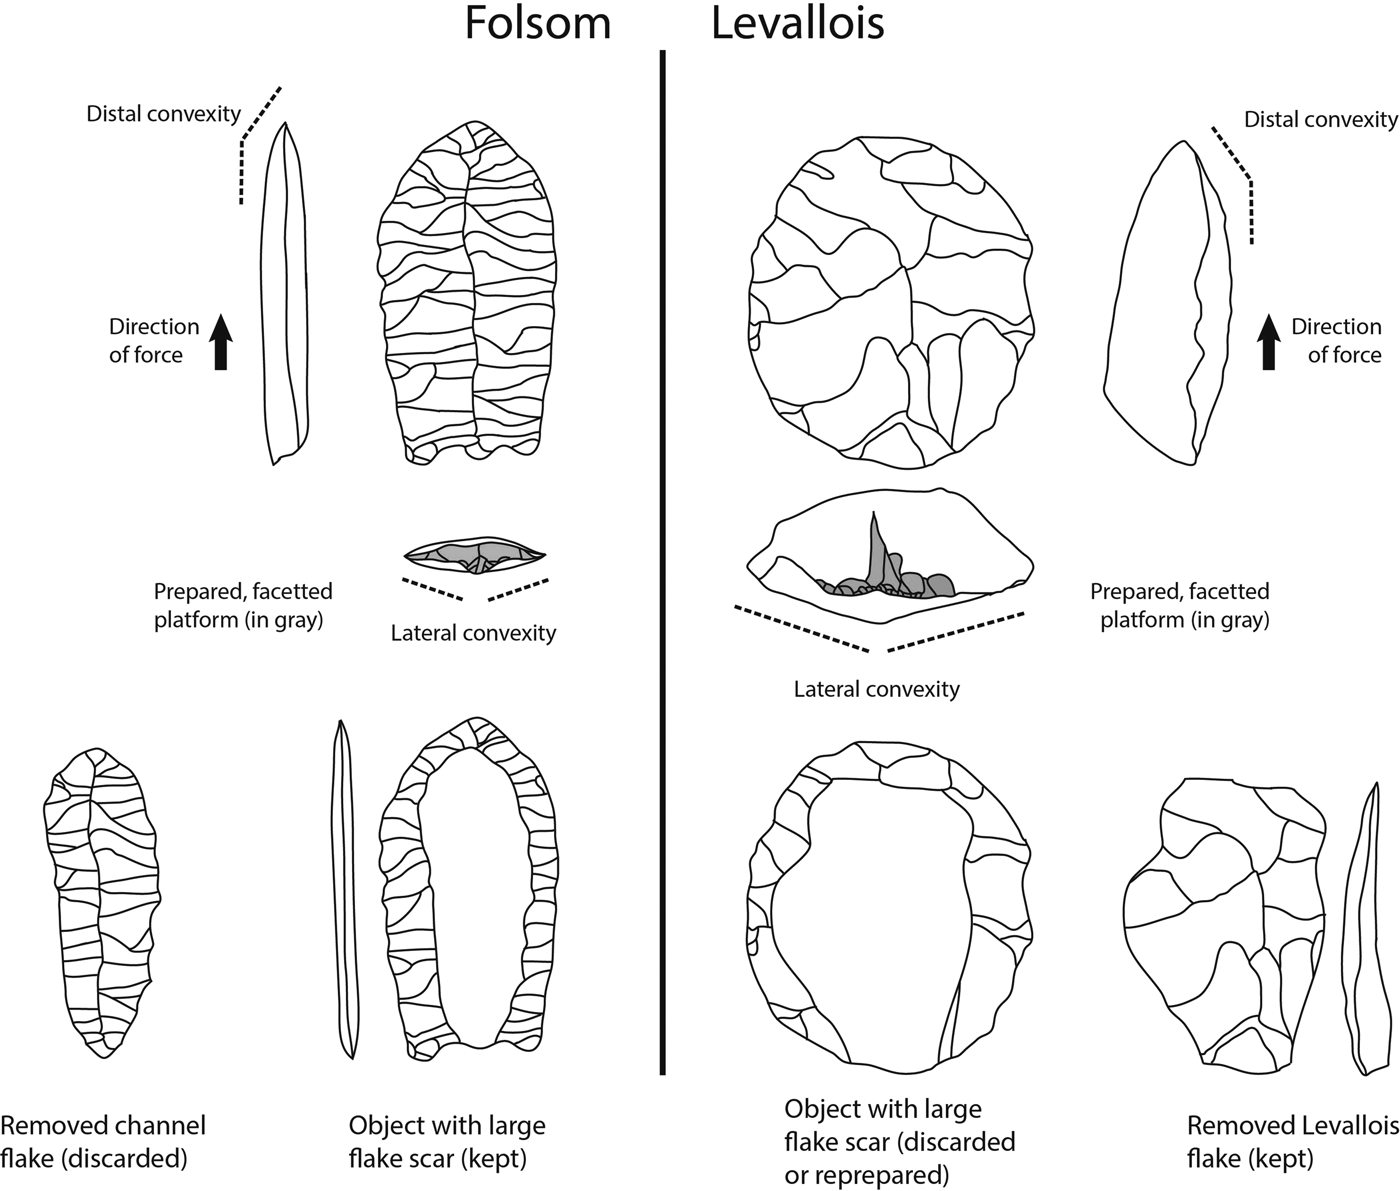
As flutes became longer, and more difficult to remove successfully, a specific sequence of knapping and a set of “process controls” evolved (Patten Reference Patten2005). This sequence is convergent with Levallois technology (Figure 6) in that a convexity is intentionally prepared, as is a specialized platform that must be directly struck. As this practice continued, proto-Folsom knappers could have recognized two benefits to their longer-fluted points. First, the nascent Folsom knapping sequence automatically resulted in increased point plan-view standardization. The geometry of Folsom points prior to flute removal—as Lycett and von Cramon-Taubadel (Reference Lycett and von Cramon-Taubadel2013) found with Levallois cores that, like Folsom points, appear to be isometrically scaled (Lycett et al. Reference Lycett, von Cramon-Taubadel and Gowlett2010; Meltzer and Eren Reference Meltzer and Eren2018)—must be “consistently imposed by the knapper and cannot be cheated; if it is incorrect, the physics does not work” (Lycett and von Cramon-Taubadel Reference Lycett and von Cramon-Taubadel2013:1514), and the successful production of a flute becomes impossible (Meltzer and Eren Reference Meltzer and Eren2018). Second, the removal of increasingly full-faced Folsom flute flakes would have also standardized point thickness across the surface area. As Turq (Reference Turq, Dibble and Mellars1992) showed, stone specimens with a more evenly distributed thickness of cross section have a greater potential for retouch and reuse. Eren and Lycett (Reference Eren and Lycett2012) showed that preferential Levallois flakes possess these morphometric, and hence functional properties, and finished Folsom points may be similar (Ahler and Geib Reference Ahler and Geib2000), except in the case of Levallois, the removed flake is the item of use whereas in Folsom, the point “core” is the item of use. As the benefits of plan-view and thickness standardization became apparent, Folsom flutes would have become longer and the fluting process more standardized (Crabtree Reference Crabtree1966; Frison and Bradley Reference Frison and Bradley1980; Judge Reference Judge1973; Tunnell Reference Tunnell and Johnson1977).
Convergence of Levallois and Folsom production techniques showing distal concavities, platform locations, direction of force, and distal and lateral views of products and by-products.

Conclusions
Folsom bases and blades are less variable than Clovis bases and blades, which indicates increased point standardization during the Early Paleoindian period in the western United States. In addition, Clovis and Folsom point bases are no more variable than blades, which negates the claim that resharpening increases the shape variation of blades relative to bases. Finally, Clovis points, which are more variable in length, width, and shape than Folsom points, have more integrated base and blade segments than Folsom points. We propose that several classes of points intended for different functions may have been in use during the Clovis period and that, during the subsequent Folsom period, points may have served exclusively as weapon tips for hunting. We conclude that the uniformity of Folsom points was the result of constraints imposed by preparations for successful fluting.
Acknowledgments
Briggs Buchanan and Metin I. Eren are supported by the National Science Foundation (Award IDs: 1649406 and 1649395), and Metin I. Eren is supported by the Kent State University College of Arts and Science.
Data Availability Statement
The data used in this paper are available in the Supplemental Materials.
Supplemental Materials
For supplementary material accompanying this paper, visit https://doi.org/10.1017/aaq.2018.53
Supplemental Table 1. Folsom and Clovis points included in the analysis by site.
Supplemental Table 2. Shapiro-Wilk Tests of Normality for Each Relative Warp (RW) Variable for Clovis (n = 125) and Folsom Points (n = 156).
Supplemental Table 3. Mean and Coefficient of Variation of Clovis (n = 125) and Folsom (n = 156) Point Length and Width.