Introduction
Increases in longevity have led to widespread concern about the negative impact this may have on health and social care, and more widely on society. Some predictions of disproportionate burdens are so extreme as to have been termed “apocalyptic demography” (Martin et al., Reference Martin, Williams and O'Neill2009), and are associated with a generally negative view of aging. Apocalyptic demography ignores the contributions that older people make to society and focuses on negative factors and stereotypes emphasizing decrepitude, decay, and the demand on resources. However, rates of disability are declining in comparison to previous cohorts of older people (Kinsella and Wan, Reference Kinsella and Wan2009), and older people report high levels of life satisfaction and emotional well-being (Charles and Carstensen, Reference Charles and Carstensen2009).
Models for understanding the experience of aging
Aging is a process rather than a state, and there is a great deal of heterogeneity in how people experience aging. Many studies of attitudes to aging do not seek the views of older people themselves; instead, they investigate perceptions of aging in the media or attitudes of younger people to aging (Abrams et al., Reference Abrams, Eilola and Swift2009; Levy, Reference Levy2009). Asking older people themselves about aging is important for understanding the experience of aging in a more accurate and nuanced way.
The mechanisms by which individuals develop perceptions of themselves as older people are complex. Diehl and Werner-Wahl (Reference Diehl and Werner-Wahl2010) propose that the subjective nature of an individual's experience of aging can be understood by reference to the concept of awareness of age related change (AARC; Diehl and Werner-Wahl, Reference Diehl and Werner-Wahl2010). That is that a person only becomes subjectively aware of their personal experience of aging by perceiving that life has changed due to some consequence of aging. These changes attributed to age are perceived as either positive or negative (expressly not neutral). The subjective awareness of age-related changes may not necessarily align with objective change or chronological age.
Levy (Reference Levy2003) suggests that agist societal attitudes internalized from a very young age and reinforced throughout adulthood can become negative age-stereotypes reinforced by an attentional bias towards negative information about aging. Stereotypes internalized during childhood and then reinforced during adulthood become self-stereotypes and this acts as a predisposing vulnerability for development of negative attitudes to aging. Consistent with AARC, Levy (Reference Levy2009) suggests that becoming aware of being “old” at the individual level is less to do with chronological age and is more likely a transitional process signaling a change from this being an external state to an attribute of the individual. Hence, the subjective view of the individual determines whether and when they see themselves as “old”. Stereotypes become embodied when the individual takes on the attributes associated with the stereotype as embedded within their self-view.
Thus, aging, and the awareness of it, is a more complex, personal, and psychological process than was at first conceived.
Attitudes to aging
The assessment of attitudes to aging has been under-developed for many years, with the most frequently used measure being the “attitudes towards own aging” subscale of the Philadelphia Geriatric Morale Scale (Lawton, Reference Lawton1975). This measure contains five items in total, which are unlikely to be able to give a comprehensive and up-to-date account of a complex issue such as attitudes to aging. As gerontological models of aging suggest understanding this experience is more complex and multidimensional than previously thought there is a need for a more sensitive measure. The “Attitudes to Aging Questionnaire” (AAQ; Laidlaw et al., Reference Laidlaw, Power and Schmidt2007) was developed as part of a large international project on the development of Quality of Life (QoL) tools for use with older adults in collaboration with the World Health Organization (WHO) to provide a standardized cross-cultural measure of an individual's experience and attitudes to aging.
Personality in later life
Understanding aging as a personal experience, the character of an individual may have an important bearing on the way that people adapt to the negative and positive experiences associated with aging. Therefore, assessment of personality dimensions is an important consideration when understanding one's attitude to aging.
Within personality research, there is a consensus that much personality variation can be captured by five domains: Neuroticism, Extraversion, Openness to Experience, Agreeableness, and Conscientiousness (Costa and McCrae, Reference Costa and McCrae1992). Longitudinal follow-up evidence suggests mean levels of personality dimensions remain relatively stable over the life course (e.g. Roberts and DelVecchio, Reference Roberts and DelVecchio2000), nevertheless there are still the opportunities for growth, change, and development across the lifespan (e.g. Mottus et al., Reference Mottus, Johnson and Deary2012). However, there may be specific occasions when personality traits act as less stable descriptors, such as when a person's mood is disturbed, as mood congruent biases may impair self-judgments. Thus, when assessing an individual's attitudes to their own aging, one ought to take account of personality disposition (e.g. neuroticism and extraversion) and mood/affective state.
Study aims and hypotheses
We investigated life course associations with attitudes to aging in a large, well-characterized cohort of older people in the UK: the Lothian Birth Cohort of 1936 (LBC1936; Deary et al., Reference Deary2007). These individuals have detailed information on cognition and health measured twice in later life (aged around 70 years and around 73 years). In addition, these individuals had general cognitive ability measured at age 11 years, providing the rarely available phenotype of life-time cognitive change. The availability of mental ability scores many decades prior to the collection of the AAQ allows questions regarding life course predictors of outcomes in older age to be answered.
The general aim of this study is to explore life course predictors of attitudes to aging. The objectives are: (a) to describe attitudes to aging in a community-dwelling sample of UK residents aged around 75 years; (b) to determine the relationship between attitudes to aging and their cognitive ability (measured aged around 70 and 11 years); (c) to determine the relationship between attitudes to aging and physical functional ability (measured aged around 70 years); and (d) to determine the relationship between attitudes to aging and other influences such as personality and mood.
Method
Participants and general method
The study sample was collected to follow up surviving members of the Scottish Mental Survey of 1947 (SMS1947; Deary et al., Reference Deary, Whalley and Starr2009) who reside in the Edinburgh area (Lothian) of Scotland. The SMS1947 applied a test of general intelligence to almost all children born in 1936 and attending Scottish schools on June 4th, 1947. The LBC1936 comprises 1,091 participants who were part of the original SMS1947 cohort, with participants generally in good health and living independently in the community (Deary, 2007). They are participating in a longitudinal study of cognitive aging, particularly exploring the importance of early life intelligence on later health (cognitive epidemiology). The present study used this cohort to investigate the influence of cognitive, physical, personality, and other factors across the life course on attitudes to aging in old age. Ethical approval for the LBC1936 was obtained from the Multi-Centre Ethics Committee for Scotland (MREC/01/0/56) and Lothian Research Ethics Committee (LREC/2003/2/29). The research was conducted in compliance with the Helsinki declaration. All participants gave written, informed consent.
Measures
“Attitudes to ageing questionnaire” (AAQ)
Development of the AAQ followed a coherent, logical, and empirical process taking full account of contemporary gerontological theory and both modern and classical psychometric analytical methods. Factor analysis and structural equation modeling were used in determining three distinct subscales for the AAQ: (1) Psychosocial Loss; (2) Physical Change; and (3) Psychological Growth. Each domain includes eight items. The Psychosocial Loss subscale measures the perceived negative experiences of aging and functions as a proxy for negative attitudes to aging where old age is seen primarily as a negative experience involving psychological and social loss. Physical Change focuses on items primarily related to health and the experience of aging itself, therefore a subjective individualized psychological perspective on health is assessed. Psychological Growth is explicitly positive and could be summarized as “Personal Wisdom” as it recognizes a lifespan development perspective on aging as viewed by the individual. Thus, the three-domain structure of the AAQ reflects both positive and negative aspects of aging, and asks questions relating to two aspects of aging: (i) that of a more general attitude component (i.e. attitudes to aging or being old in general); and (ii) a more personal experiential component (i.e. attitudes to the individual's own experience of aging) from the perspective of the older people themselves (Lucas-Carrasco et al., Reference Lucas-Carrasco, Laidlaw, Gómez-Benito and Power2013). This questionnaire, and the factor-analytic derived subscale structure, have been validated in Canadian and Norwegian samples of older people (Kalfoss et al., Reference Kalfoss, Low and Molzahn2010).
The 24 items of the AAQ scale are scored on a five-point Likert scale (1 = strongly disagree, 5 = strongly agree). All questions within each domain were asked in the same “direction”; i.e. all questions for Psychosocial Loss were in a “negative” direction (e.g. “Old age is a time of loneliness”), all questions for Physical Change in a “positive” direction (e.g. “I don't feel old”), and all questions for Psychological Growth in a “positive” direction (e.g. “Wisdom comes with age”). Each factor has eight questions and is unit weighted. Therefore, the minimum score is eight (strongly disagree with all questions) and maximum score is 40 (strongly agree with all questions), with a total score of 24 indicating, on average, a neutral response over all questions, though this score could be achieved in other ways.
General fluid-type cognitive ability (g) at age 70. A full description of the battery of cognitive tests and administration procedures is given in Deary et al. (Reference Deary2007). In this study, we used a composite cognitive score derived from principal components analysis (PCA) to represent general (fluid) cognitive ability. This was derived from a PCA of scores on six Wechsler Adult Intelligence Scale-IIIUK subtests (Wechsler, Reference Wechsler1998): letter-number sequencing and digit span backwards (working memory), matrix reasoning (non-verbal reasoning), block design (constructional ability), digit symbol coding and symbol search (speed of information processing). The scree plot and eigenvalues suggested a single component could be extracted. The first unrotated component explained 53% of the variance. All subtests had high loadings. Regression scores were calculated for the first unrotated principal component of the tests. We have used this method rather than individual test scores due to very small bivariate associations with individual tests scores and outcome variables, the large proportion of shared variance between cognitive tests, and that associations with cognition in an aging context are most often with this general component. Associations between individual test scores or cognitive domains and AAQ domains are available from the authors.
Mini-Mental State Examination (MMSE; Folstein et al., Reference Folstein, Folstein and McHugh1975) is test of global cognitive function in wide clinical use that is simple to administer and takes about 10 minutes to complete. Scores above 27 (out of a possible 30) are considered “normal”. A score of <24 is often used to indicate possible dementia. This was used here to exclude participants with MMSE <= 27.
Moray House Test No. 12 (MHT). This was administered when participants were age 11 as part of the Scottish Mental Survey, and again at around age 70. It is a group-administered general intelligence test with a predominance of verbal reasoning items, and also has some numerical and spatial items. It was concurrently validated against the Terman-Merrill Revision of the Binet Scales (Deary et al., Reference Deary, Whalley and Starr2009). MHT scores were corrected for age in days at time of testing and converted to an IQ scale with mean of 100, SD 15. In this sample the correlation between age 11 and age 70 IQ is 0.70 (p < 0.001).
Peak prior cognitive ability. This was estimated using the National Adult Reading Test (NART; Nelson and Willison Reference Nelson and Willison1991) by asking LBC participants in older age to attempt pronunciation of 50 irregular words. In this sample we have previously shown a strong positive correlation between NART and MHT age 11 (0.67; Dykiert and Deary, Reference Dykiert and Deary2013). We have used NART in the analyses as this is more widely available in other studies of cognitive aging.
Anxiety and depression was self-rated on the Hospital Anxiety and Depression Scale (HADS; Zigmond and Snaith, Reference Zigmond and Snaith1983). A score of 8 or above is optimal for sensitivity and specificity in the detection of anxiety or depression (Bjelland et al., Reference Bjelland, Dahl, Haug and Neckelmann2002).
Personality (NEO-FFI). Participants were given a questionnaire pack following their cognitive and physical testing that they returned by mail. This included brief NEO Five Factor Inventory (NEO-FFI; Costa and McCrae, Reference Costa and McCrae1992): a 60-item inventory consisting of 12 items each for the five major dimensions of personality: Neuroticism (N), Extraversion (E), Openness (O), Agreeableness (A), and Conscientiousness (C). Participants were asked to mark each item on a five-point scale (strongly disagree to strongly agree) according to how well it described them generally.
Physical and functional measures. This included: the time to walk 6 m; Townsend's nine-item scale to assess activities of daily living (Townsend, Reference Townsend1979); the forced expiratory volume in one second (FEV1) based on testing with a spirometer; and grip strength in the right and left hand using a North Coast Hydraulic Hand Dynamometer (JAMAR) (Deary et al., Reference Deary2007).
Demographic and control variables. Education (years of full-time education), employment, current living arrangements (i.e. alone or not), and childhood social circumstances were ascertained at interview through a semi-structured demographic measure. Adult social class was derived from highest reported occupation (six classes ranging from I (professional) to V (unskilled)) (Office of Population Censuses and Surveys, 1970). Women were assigned a social class on the basis of the highest occupation of the household. Class IV and V were combined due to small numbers in class V. Childhood deprivation was a composite measure of number of people per room, toilet facilities (indoor or outdoor), and number of people sharing toilet facilities (Johnson et al., Reference Johnson, Gow, Corley, Starr and Deary2010). Adult deprivation was derived from the Scottish Index of Multiple Deprivation (SIMD), which ranks geographic data zones on the basis of current income, employment, health, education, skills and training, access to services, housing, and crime. This scale from 1 (most deprived) to 6,505 (least deprived) was scaled into eight groupings that reflected stepwise decreases in deprivation (Johnson et al., Reference Johnson, Gow, Corley, Starr and Deary2010).
Procedure
Between 2004 and 2007, at the Wellcome Trust Clinical Research Facility at the Western General Hospital in Edinburgh, local survivors of the original SMS1947 survey, known as LBC1936, and now aged around 70 years (mean 69.6, SD 0.80 years), participated in a re-assessment of the same mental ability test they had originally completed in 1947 at age 11. At this time, participants completed comprehensive physical and cognitive assessment procedures. In addition, participants took home and returned a large battery of questionnaires assessing personality, anxiety, and depression symptoms and other psychosocial variables (Deary et al., Reference Deary2007; Reference Deary, Gow, Pattie and Starr2012).
A second wave of assessment was conducted with surviving members of the LBC around three years later (mean 3, SD 0.3 years), i.e. the members were aged around 73 years. Following this second wave (in May, 2010) the AAQ (Laidlaw et al., Reference Laidlaw, Power and Schmidt2007) was sent as a postal questionnaire to all available participants. Physical and cognitive data in the second wave were collected for some participants immediately before AAQ completion, and for others up to three years previously. We have previously demonstrated that there was no significant change in cognitive and physical ability over these three years after accounting for multiple testing (Johnson et al., Reference Johnson, Gow, Corley, Redmond, Henderson, Murray, Starr and Deary2012). Therefore, we have included physical and cognitive data, personality and mood scores from wave 1 (three to six years prior to AAQ completion in 2004–2007), at around age 70 years.
Statistical analysis
Analyses were performed using SPSS version 19.0 (SPSS Inc., Chicago, IL) and R (R Foundation for Statistical Computing, 2012). Descriptive statistics were performed using mean and SD for normally distributed variables, median and interquartile (I-Q) range for variables with a skewed distribution, and percentages for categorical variables.
The main analyses examined the associations between AAQ and cognitive and physical function. Univariate correlations were performed amongst all variables using conservative p values (p < 0.001). Multiple regression analyses were performed with each of the three AAQ domains as the dependent variables. To assess the proportion of variance explained by demographic, cognitive, physical, and then personality and mood variables, we entered the independent variables in these blocks each including adjustment for potential confounding factors. The model was fitted by ordinary least squares and an R 2 value was calculated after each block of predictors was added to the previous blocks. Model 1 included demographic variables: age, sex, age at SMS, education, social class, adult deprivation (SIMD), currently living alone or not, and childhood deprivation. Model 2 added the cognitive variables: fluid intelligence, g factor at age 70, and an estimate of prior (crystallized) intelligence: NART. Model 3 added the physical variables: 6-m walk time, grip strength, self-reported health, and Townsend disability score. For the model, due to the very low rates of disability in this cohort, Townsend score was coded as zero or non-zero (i.e. a score of zero, indicating no help needed on any activity was coded as “zero,” and a score of one or more was coded as “non-zero”). Model 4 added HADS score and personality. HADS was coded as positive (>= 8) or negative due to small numbers of high scores. Personality traits were standardized scores. From the univariate associations we were aware that personality factors would have a strong influence on attitudes to aging; therefore, we introduced the general, cognitive, and physical life course factors to assess their contributions to the model before introducing personality factors. All independent variables were then entered into a multiple regression model to assess the independent effect of each variable.
Results
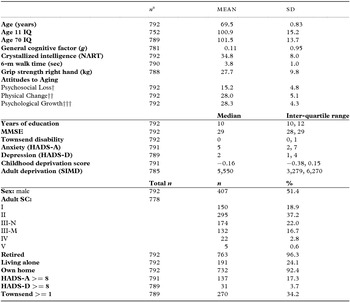
1,091 individuals took part in wave 1 of the LBC1936 and 866 participated in wave 2. Of these, 825 responded to the request to complete the AAQ (95.3% response rate): 802 returned a completed AAQ (44 of these required some corrections). An additional ten were incomplete, one was returned blank, three withdrew from the study, two patients had died, and seven refused to complete the questionnaire. Ten patients had possible dementia (MMSE < 24 at either wave 1 or wave 2) and were excluded from analyses. The present study sample comprises the 792 with MMSE >= 24 who completed the AAQ. Descriptive statistics for demographic, cognitive, physical, and AAQ data are shown in Table 1.
Descriptive statistics of demographics, cognitive, and physical tests at wave 1 testing of those who later completed the AAQ

SMS = Scottish Mental Survey; Adult SC = adult social class (I = Professional, II = intermediate, III-N = skilled non-manual, III-M = skilled manual, IV = semi-skilled manual, V = unskilled); NART (National Adult Reading Test) score = number correct; MMSE = Mini-Mental State Examination; HADS-A = Hospital Anxiety and Depression Score–Anxiety; HADS-D = Hospital Anxiety and Depression Score–Depression; g = general cognitive factors (see text); SIMD = Scottish Index of Multiple Deprivation (adult deprivation score: see text); SD = standard deviation.
aResults: n = 792 except for some cognitive and physical tests (see table; non-completion of tests), and social class (n = 778) (missing data for people who had more than one substantive job in different social class categories).
†Median = 14; ††Median = 28; †††Median = 29.
Characteristics of non-responders
There were no statistically significant differences in sex, age, social class, education, cognitive, or physical variables between participants who participated in wave 2, but did not fully complete the AAQ (n = 23), and those who did (data not shown). Those who did not participate in wave 2 were more likely to be female and have a lower age 11 and 70 IQ, and lower grip strength (Deary et al., Reference Deary, Gow, Pattie and Starr2012).
Attitudes to aging
Cronbach's α scores showed acceptable internal consistency within the subscales (Psychosocial Loss α = 0.80; Physical Change α = 0.77; Psychological Growth α = 0.75). Scores on all subscales are intercorrelated: Psychosocial Loss and Physical Change r = –0.45; Psychosocial Loss and Psychological Growth r = –0.36; Physical Change and Psychological Growth r = 0.46; ps: all < 0.001.
There was a range of attitudes to aging reported, but in general attitudes in this cohort were in a positive direction. Note that items were scored on a Likert scale, with 1 = strongly disagree, 5 = strongly agree. A median score of 24 (neutral = 3, on each of eight items) would indicate a neutral attitude, consistent with Bryant et al. (Reference Bryant, Bei, Gilson, Komiti, Jackson and Judd2012). The Psychosocial Loss scale was positively skewed, with a median of 14 (I-Q range 12–18), indicating that most people disagree with statements such as “I see old age mainly as a time of loss”. Physical Change and Psychological Growth were more normally distributed, around medians of 28 and 29 respectively. This indicates that most people have a positive attitude to aging (agreeing with statements such as “My health is better than I expected for my age” and “I want to give a good example to younger people”). It should be noted that these summary group-level statistics do not reflect the full details of individual processes.
There were statistically significant differences between men and women in scores on AAQ for Physical Change, Mann–Whitney U (df 792) = 85,092, z = 2.1, p = 0.036, with women having a more positive attitude to Physical Change (e.g. agreeing with “Growing older has been easier than I thought”). There were no sex differences in Psychosocial Loss, U (df 792) = 73,128.5, z = –1.6, p = 0.10, or Psychological Growth, U (df 792) = 78,143.5, z = –0.06, p = 0.95.
Relationship between AAQ and cognitive ability: univariate analyses (Table 2)
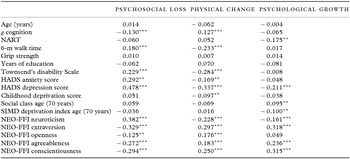
The univariate correlations (Table 2) show that there is a small to moderate, statistically significant correlation between higher scores on Psychosocial Loss (e.g. “Old age is a depressing time of life”) and lower g at age 70, but not NART. Physical Change (e.g. “I keep as fit and active as possible by exercising”) is significantly negatively associated with similar variables; i.e. in the opposite direction as this domain is worded in a positive direction, compared with Psychosocial Loss which is in a negative direction (Table 2). Participants scoring higher on the AAQ Physical Change domain have higher age 70 g.
Univariate associations (Pearson's r) between attitudes to aging and physical, cognitive, and social parameters

**p < 0.01; ***p < 0.001.
For n see Table 1.
NART (National Adult Reading Test) score = number correct; HADS-A = Hospital Anxiety and Depression Score–Anxiety.
HADS-D = Hospital Anxiety and Depression Score–Depression; g = general cognitive factors (see text); SIMD = Scottish Index of Multiple Deprivation adult deprivation score (higher score equates to less deprivation: see text); NEO-FFI (Neuroticism-Extraversion-Openness-Five Factor Inventory).
Direction of association: significant positive correlations with Psychosocial Loss indicate variables which are associated with agreement to statements regarding older age as a time of loss (i.e. in a negative direction); conversely, significant positive correlations with Physical Change and Psychological Growth indicate variables which are associated with agreement to statements regarding older age as a time of health or growth (i.e. in a positive direction).
Correlations with Psychological Growth (e.g. “It is a privilege to grow old”) are slightly different compared with the other two AAQ dimensions. It is associated with lower NART, and not statistically significantly associated with age 70 g.
Relationship between AAQ and physical ability: univariate analyses (Table 2)
Psychosocial Loss is associated with slower 6-m walk time, functional limitation (i.e. more disability: score of one or more, rather than zero on the Townsend scale).
Higher scores on Physical Change are associated with quicker 6-m walk time and the absence of functional limitation (score of zero, rather than one or more on the Townsend scale).
Scores on Psychological Growth are not associated with physical disability.
Relationship between AAQ and other factors – (i) personality and mood; (ii) socioeconomic environment: univariate analyses (Table 2)
Psychosocial Loss is significantly (p < 0.001) associated with higher anxiety and depression scores as measured by the HADS scale, and NEO-FFI personality traits (higher neuroticism, and lower extraversion, openness, agreeableness and conscientiousness), but not with current or prior socioeconomic environment.
Higher Physical Change scores were correlated with lower anxiety and depression scores (HADS), and personality (lower neuroticism, higher extraversion, openness, agreeableness and conscientiousness). Physical Change was associated with less childhood deprivation, but not with current socioeconomic environment.
Higher scores on Psychological Growth are associated with lower depression scores and personality (lower neuroticism, and higher extraversion, openness, agreeableness and conscientiousness. Psychological Growth is not associated with childhood deprivation, or anxiety scores. Unlike other domains, Psychological Growth is associated with lower social class and SIMD score (more deprivation at age 70).
Predicting attitudes to aging: multivariable analyses (Table 3)
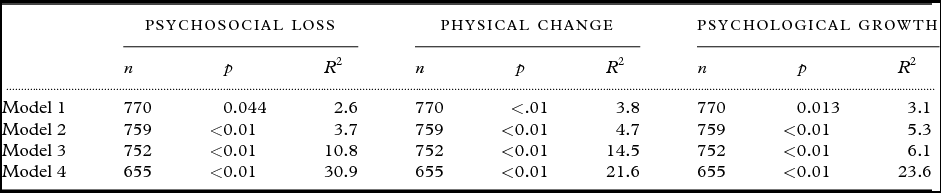
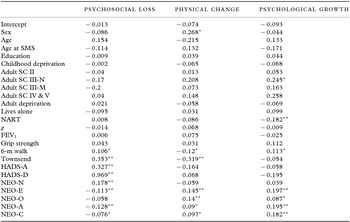
Multiple regression models in which independent variables were entered in successive blocks were used to determine the independent influence of demographic, cognitive, physical, and affective/personality on each of the attitudes to aging domains (Table 3). The majority of the variance is explained in the final model including the personality scales. The adjusted effects of the independent variables on the final model were determined by multiple regression (Table 4).
Results of hierarchical multiple regression analyses predicting attitudes to aging

Model 1: demographic variables (age, sex, age at SMS, education, social class, adult deprivation (SIMD), currently living alone or not, and childhood deprivation).
Model 2: add cognitive variables (g factor at age 70, and NART).
Model 3: add physical variables (6-m walk time, grip strength, self-reported health, and Townsend disability score).
Model 4: add anxiety, depression, and personality variables (HADS-A, HADS-D, Neuroticism (N), Extraversion (E), Openness (O), Agreeableness (A), and Conscientiousness (C)).
Model was fitted by ordinary least squares; R 2 value (proportion of variance explained) calculated after each block of predictors was added to the previous blocks.
Results of multiple regression analyses (standardized beta) showing the adjusted effects of the independent variables on the final model

*p < 0.05; **p < 0.01.
SMS = Scottish Mental Survey; Adult SC = adult social class (I = Professional, II = intermediate, III-N = skilled non-manual, III-M = skilled manual, IV = semi-skilled manual, V = unskilled); Social class coded as dummy to represent a mean difference relative to the reference group (Social Class I); NART (National Adult Reading Test) score = number correct; FEV1 = forced expiratory volume in one second; HADS-D = Hospital Anxiety and Depression Score-Depression; g = general cognitive factors (see text); SIMD = Scottish Index of Multiple Deprivation (adult deprivation score: see text).
Significant independent predictors of Psychosocial Loss (Table 3 and 4) are slower 6-m walk time, Townsend score of one or over (more disability), high anxiety and depression, and personality traits (high neuroticism, low extraversion, conscientiousness, and agreeableness). Together these variables explain 30.9% of the variance. Model 3, which includes demographic, cognitive, and physical variables, but does not include HADS or personality, explains 10.8% of the variance, and model 2, which does not include physical factors, explains 3.7% of the variance.
Significant independent predictors of Physical Change (Table 3 and 4) are female sex, quicker 6-m walk time, lower Townsend disability score (zero), and personality traits (higher extraversion, openness, agreeableness, and conscientiousness). Together these variables explain 21.6% of the variance (Table 3). Childhood deprivation and lower neuroticism, which were significant univariate predictors, do not contribute independent variance to the model. Model 3, which includes cognitive and physical variables, but does not include HADS or personality, explains 14.5% of the variance, and model 2, which does not include physical factors, explains 4.7% of the variance.
Significant independent predictors for Psychological Growth (Table 4) are social class III non-manual (compared to I), less affluent adult environment, living alone, lower NART, slower 6-m walk time, personality traits (high extraversion, openness, agreeableness, and conscientiousness), together explaining 23.6% of the variance (Table 3). Years of education and lower depression scores, which were significant univariate predictors, do not contribute independent variance to the model. Model 3, which includes cognitive and physical variables, but did not include HADS or personality, explains 6.1% of the variance, and model 2, which did not include physical factors, explains 5.3% of the variance.
We carried out item analysis to look in more detail at the interesting and unexpected negative correlation between Psychological Growth and lower estimated early life cognitive ability (NART). A polyserial correlation between each of the eight items used to measure Psychological Growth and cognition as measured by the NART showed that all the items were negatively correlated with estimated prior cognition except for two which were not statistically significantly correlated. The strongest negative correlation (r = –0.26) was for the item: “It is very important to pass on the benefits of my experiences to younger people,” i.e. this statement was more strongly agreed with by people with lower prior cognitive ability. The two items for which the correlation with NART were not statistically significant were “There are many pleasant things about growing older” (r = 0.02, p = 0.61), and “It's a privilege to grow old” (r = −0.01, p = 0.94). We fitted a two-parameter logistic item response model to these items and found that the items with no significant correlation were poor discriminators of latent Psychological Growth, with a very similar probability for three of the five Likert levels. Three statements: “It is very important to pass on the benefits of my experiences to younger people;” “I believe my life has made a difference;” and “I want to give a good example to younger people” best discriminate Psychological Growth, i.e. agreement or disagreement with these statements are most likely to discriminate between people who have overall a positive or negative attitude to Psychological Growth. Therefore, the unexpected results were true reflections of the data, and not due to miscoding or artefact, indicating that people with lower estimated prior ability have the most positive attitude to this domain particularly the questions relating to legacy.
Discussion
This study of healthy, community-dwelling volunteers aged around 75 years provides evidence that (a) older people have a more positive experience of aging than is the cultural stereotype (Levy, Reference Levy2009; Scheibe and Carstensen, Reference Scheibe and Carstensen2010); (b) for cognition: there is a univariate relationship between childhood cognition and Physical Change and Psychological Growth, but in multivariable analyses only lower estimated childhood ability predicted higher scores on Psychological Growth. Adult cognition was univariately associated with all three domains of attitudes to aging, but did not contribute independently to the multivariable model; (c) for physical disability: increased physical disability predicted higher scores on Psychosocial Loss and lower scores on Physical Change, slower 6-m walk predicting higher scores on Psychological Growth; (d) personality dimensions and affect (depression or anxiety scores) were the most substantial predictors of attitudes to aging.
The AAQ performed as expected and in line with the original data published by Laidlaw et al. (Reference Laidlaw, Power and Schmidt2007).
This community-dwelling volunteer sample is relatively healthy, affluent, and well-educated. They may be relatively well-endowed with a range of resources and will therefore have a more comfortable experience of aging which may not be generalizable to the normative aging population. Nonetheless, it validates previous reports of a positive AAQ domain profile in a community-dwelling older adult population (Bryant et al., Reference Bryant, Bei, Gilson, Komiti, Jackson and Judd2012) and positive data from other studies (Frazier et al., Reference Frazier, Newman and Jaccard2007). Data reported here are also consistent with positive data about the experience of aging reported elsewhere by Cartensen et al. (2011) in their longitudinal follow-up of a cohort of adults, ranging in age from 18 to 94 years, over ten years demonstrating that emotional stability and well-being improves with age. Therefore, it may be that generally positive attributions about aging should be accepted as the norm for non-depressed, relatively healthy older people, challenging the common perception of older age as a period of negativity, sadness, and loss (Scheibe and Carstensen, Reference Scheibe and Carstensen2010). Data reported here are consistent with the concept of the aging paradox where older people report high levels of subjective well-being at a time most associated with cognitive and physical decline and multiple losses (Kunzmann et al., Reference Kunzmann, Little and Smith2000). The apparent paradox of high levels of subjective well-being in later life may be resolved somewhat by the idea that well-being is relative and depends upon one's frame of reference. Thus, George (Reference George2010) suggests that older people make more “downward social comparisons” in that they compare themselves with others they perceive to be less fortunate than themselves and hence well-being remains stable even in times of loss and change.
As not everyone experiences a smooth transition into later life, the AAQ may be useful for mental health practitioners who work with older people experiencing depression. Based on the results reported here and consistent with Chachamovich et al. (Reference Chachamovich, Fleck, Laidlaw and Power2008) negative attitudes to aging may be mood-state-dependent.
In this study, when examining the Psychosocial Loss domain of the AAQ, the regression model in Table 4 presents an interesting profile with depression, anxiety, and neuroticism (in addition to low extraversion, openness, conscientiousness, and agreeableness) associated with this domain, as well as functional health limitations, as assessed by a slower 6-m walk time and disability on the Townsend scale. There is a strong element of face validity evident in the prediction of the Psychosocial Loss domain and personality variables. This domain reflects a more negative appraisal of aging focusing on loss and deficit. Thus, as neuroticism increases and extraversion decreases this is associated with Psychosocial Loss. Likewise elevated scores on the HADS measures of anxiety and depression are linked with increased negative appraisal of attitudes to aging as scored on the AAQ Psychosocial Loss domain. The association with lower current but not prior ability was no longer significant in the multivariable model. This may be due to confounding by mood or personality.
For the Physical Change domain, significant independent predictors of quicker walk time and lower disability have strong face validity for the concept that aging was not as difficult as thought, i.e. those with less disability have a more positive attitude to this aspect of aging. However, it is interesting that women have a more positive attitude in this domain, despite slower 6-m walk times and higher Townsend disability scores. Therefore, attitudes to the physical impact of aging may be more dependent on the impact on the individual and their perception relative to expectations, than the absolute level of disability. Adult cognitive ability was univariately associated with the attitude to Physical Change, but was no longer significant in the multivariate model, suggesting confounding by personality variables. Mood also became non-significant, suggesting that attitudes to this domain may be influenced most strongly by personality which is stable over longer periods of time, than state-dependent mood.
For the Psychological Growth domain the predictors of living alone, lower estimated prior IQ, and deprivation are interesting and discussed below. The concept of legacy is equally important to men and women, and is less influenced by mood (especially anxiety) than the other domains. It is also not affected by physical ability, suggesting that this domain may be less influenced by physical and mood changes with age, and it would be interesting to track these attitudes with age to see if this domain is particularly stable.
The apparent mood-congruent relationship in appraisals of attitudes to aging suggests that mood disturbance may act as a prime for negative age stereotypes (see Levy, Reference Levy2003) and hence people may develop mood-state-dependent negative attitudes to aging that may be perceived as global and stable but are changeable.
The AAQ may therefore have utility with older clinical populations and be seen as a measure of more transient mood-influenced attitudes rather than reporting stable traits in a population with elevated mood scores. Thus, for clinicians the usefulness of the AAQ is that it allows them to sample how a person's attitudes to aging compare to non-depressed norms. When depressed, it may be that the aging stereotype is hyper-aroused and thus depressed older people may be more influenced by a negative stereotype that sees aging as about loss and decrepitude (Levy, Reference Levy2009). In this way enacting depressive self-fulfilling prophesies may leave the clinician and patient hopeless about possibilities for change. Seeing attitudes to aging in depressed people as mood-state-dependent and non-normative may enable the clinician to challenge any narrative of loss, failure, and weakness from the patient.
When predicting the more “positive” attitudes to aging domains, a common element emerges. Personality variables in the final model, which most strongly predict the AAQ domains Physical Change and Psychological Growth, (see model 4 in Tables 3 and 4) are relatively consistent (high extraversion, openness, and conscientiousness), compared to low extraversion and agreeableness for Psychosocial Loss. This may arise because these domains reflect broadly positive aspects of aging, thus the same types of profiles will predict the domains. There is face validity in the prediction of positive attitudes to aging in people with high extraversion, i.e. energy, positive emotions, sociability etc; openness, i.e. intellectual curiosity, creativity, novelty-seeking etc; and conscientiousness, i.e. self-discipline, duty, and high achievement.
Despite this consistency, there were some interesting differences between the subscales. Physical Change was predicted by quicker 6-m walk time and less disability on the Townsend score (score of zero rather than one or more). As the questions mostly relate to activity and exercise, this is not surprising. However, unexpectedly, Psychological Growth was predicted by a less affluent adult environment (derived from the SIMD) and living alone, as well as lower NART and a slower 6-m walk time. We performed additional analyses using an item response theory (IRT) model to explore this further and to clarify that this was not due to undetected errors. This established that almost all items in the Psychological Growth domain were negatively correlated with peak prior ability and three items relating to “legacy” best discriminated Psychological Growth. It may be that people with lower NART scores are less aware of detrimental effects of aging, but the IRT analyses would suggest that people who score lower on the NART may place higher value on the transmission of wisdom to the next generation. The correlation with walking speed may suggest that Psychological Growth compensates for physical disability, and is an attitude developed to cope with loneliness or a less affluent environment. Psychological Growth is also associated with the trait of agreeableness. Perhaps, with respect to the items that have the strongest (negative) correlations with intelligence scores, the term “growth” is not capturing the psychological construct. The key feature of these items would appear to be the desire to pass on a legacy. Neither late-life or prior IQ contributed independently to attitudes to aging, apart from lower NART predicting Psychological Growth. Age (within the one year of the sample) was not a significant predictor.
This study adds to a small but growing literature on the relationship of attitudes to aging and cognitive or physical function, or personality. A large study of community-dwelling older adults in Australia using postal questionnaires including the AAQ (Bryant et al., Reference Bryant, Bei, Gilson, Komiti, Jackson and Judd2012) found that more positive attitudes in the domains of Psychosocial Loss and Physical Change were associated with better physical health. Positive attitudes across all domains were also associated with better mental health. This may be due to partial confounding by socio-demographic factors (Bryant et al., Reference Bryant, Bei, Gilson, Komiti, Jackson and Judd2012) or health-related behaviors (Quinn et al., Reference Quinn, Laidlaw and Murray2009). People with dementia more strongly endorse the negative attitude that aging is a time of psychosocial loss than people without dementia, impacting on QoL (Trigg et al., Reference Trigg, Watts, Jones, Tod and Elliman2012). There is therefore a need for future studies to include people in older age with a range of physical and cognitive abilities to explore the relationship with attitudes to aging longitudinally.
Study limitations
A number of limitations of the current study need to be acknowledged. First, the volunteer sample is a self-selected cohort from one region of Scotland, who are participating in research relating to aging. Participants are generally of higher social class and educational attainment than the general population, and are very engaged in the study (Deary et al., Reference Deary2007). All are Caucasian and English-speaking. They may hold more positive values than the general population, but this is unlikely to affect the relationships within the sample. They may also report positive attitudes to conform to social norms, rather than reporting truly held negative beliefs. The large influence of personality as derived from the NEO-FFI may be partly explained by construct overlap: both the NEO-FFI and the AAQ were administered as questionnaires completed by the participants, and they are likely to have answered questions relating to similar themes in similar ways, making distinguishing attitudes and personality difficult.
Participants in this study are drawn mainly from social classes one and two (professional/managerial) and thus the participants may be relatively well-endowed in terms of broader resources. Nonetheless, money does not inoculate individuals from the challenges of aging.
While the three domains of the AAQ scale are potentially useful with clinical and non-clinical populations of older people at the moment there exists no data on cut-off scores for the AAQ and this weakens the use of the scale more widely. Data exist from the original database that is sufficient to provide cut-off scores using the receiver operating characteristic (ROC) methodology, and this is currently under investigation as a possible addition to scoring information of the AAQ. In addition, alternative analyses such as Mokken scaling may identify a hierarchy within the scale to allow the relative importance of each item to be ranked.
The internal consistency of the three domains (Cronbach's α) ranges from 0.75–0.80. The acceptable value of Cronbach's α varies depending on the context (Kline, Reference Kline2013), although >0.70 is generally thought to be acceptable. Each scale consists of only eight items, which constrains the value of α, and it was the intention when developing the AAQ that each domain would capture a range of attitudes e.g. from general to personal. The AAQ has been validated in a range of populations, but further work could describe its use in a wider range of socioeconomic and clinical populations. Statistical techniques such as IRT could explore whether there is a hierarchy within the scales, and perhaps allow further refinement
The models explain less than 50% of the variance in attitudes to aging, and the remainder could be explained by measurement error; heterogeneity may mean that one predictor only applies to a proportion of the sample, and other factors, such as self-concept may contribute to attitudes to aging in older people. The variables included in the hierarchical steps of the model were selected a priori as clinical domains likely to be related to attitudes to aging. All variables were included to allow for inclusion of variables that influenced anyone of the AAQ domains, and to allow for suppressor effects (e.g. 6-m walk time was not a univariate predictor of Psychological Growth, but did contribute to the final model).
The AAQ was answered directly after wave 2, and we have used cognitive, physical, and psychosocial predictors from wave 1, collected several years prior. This was because we aimed to determine which aspects predicted attitudes to aging, not those associated at the time. As data collection at wave 2 could have occurred immediately before AAQ completion or up to three years earlier, we used the previous wave of data which would all have been collected more than four years prior. Future studies can examine whether longitudinal change in physical, cognitive, or psychosocial factors are associated with attitudes to aging, and future administration of the AAQ can determine its stability over time.
The AAQ scale has two main foci, either a general or a more personal attitude to aging, and this is both a strength and a weakness. The strength is that an individual's scores can be compared in terms of their personal experience and attitude to aging and compared to more general (stereotypical) attitudes. It is also a weakness as the coherence of the scale may be threatened by having two different scoring domains, which may be seen as confusing.
Conclusion
This is the first large study of attitudes to aging as reported by older people themselves in the UK, showing that attitudes are generally positive, and there are important personality, affective, physical, and socio-economic predictors of each of the three domains of attitudes to aging. Some predicators of Psychological Growth (less affluent environment, living alone, lower estimated childhood ability, and slower walking speed) were in the opposite direction to that expected. Further work is needed to replicate this in other samples and to explore potential mechanisms. Future work to describe the attitudes to aging in different populations, both world-wide, but also in different clinical populations (e.g. patients in hospital, or those with dementia), would allow description of life course predictors of attitudes to aging in these people. Further studies are required to investigate whether interventions can influence attitudes and the associated physical changes.
Conflict of interest
None.
Description of authors’ roles
S. Shenkin, K. Laidlaw and G. Mead formulated the research questions and designed this study, and I. Deary and J. Starr designed and coordinated the data collection for the LBC1936 study. S. Shenkin and I. Deary supervised the data collection. S. Shenkin and M. Allerhand analyzed the data. M. Allerhand assisted with writing the statistical methods and results. S. Shenkin and K. Laidlaw wrote the initial draft of the paper, and G. Mead, I. Deary and J. Starr contributed significantly to revisions of the paper. K. Laidlaw is the primary author of the AAQ, which is freely available.
Acknowledgments
This research was funded by a start up grant from the British Geriatrics Society Scottish Branch. The University of Edinburgh Centre for Cognitive Aging and Cognitive Epidemiology is part of the cross council Lifelong Health and Wellbeing Initiative (G0700704/84698). Funding from the Biotechnology and Biological Sciences Research Council (BBSRC), Engineering and Physical Sciences Research Council (EPSRC), The Economic and Social Research Council (ESRC) and Medical Research Council (MRC) is gratefully acknowledged. We thank Alan J. Gow for coordinating the distribution and data entry of the questionnaires.