

Introduction
The international climate regime is increasingly relying on technological change to mitigate global warming.Footnote 1 Early attempts to reduce greenhouse gas (GHG) emissions tended to focus on carbon pricing, but these efforts were often met with considerable resistance.Footnote 2 Despite promising policy experiments in the European Union and elsewhere,Footnote 3 and despite the possible uptake of such policies under the Paris Agreement, many observers worry about the political feasibility of widespread carbon pricing.Footnote 4 As a result, policymakers in many countries shifted gears. Instead of making GHG emissions more expensive, they are now hoping that clean technology—including renewable energy technologies—can more successfully displace GHG. From a political standpoint, promoting clean technology might be less challenging than punishing GHG emitters.Footnote 5 In the case of renewable energy, governments have found it easier to promote its deployment rather than to scale back their support for fossil fuels.Footnote 6 As a result, renewables have expanded dramatically over the last decade. In Europe, for instance, non-hydro renewable energy contributes more than 20 percent of all electricity generated per year.
This is not to say that the clean energy transition is self-evident nor that it cannot be slowed down.Footnote 7 Historically, fossil fuels have long benefited from considerable advantages. Energy infrastructures were designed specifically for them, essentially locking societies in carbon-based economies.Footnote 8 Furthermore, the political might of fossil fuels was and still considerable in many countries. Renewables, for their part, are not universally popular.Footnote 9
How robust is the renewable energy industry to adverse political shocks? I approach this issue from the specific angle of investors’ reactions to expected policy changes. In this paper, I take advantage of the 2016 U.S. presidential election to study this question. Widely considered a surprise, Donald Trump's election provides a test of the resilience of the renewable energy industry. As a candidate, Trump had been vocal about his support for oil, gas, and coal. He was skeptical about the potential of renewable energy, and was adamant about rescinding several climate-related laws. Thus, were President Trump to implement his program, this would represent a potential setback for the renewable energy sector. The question is: Did markets interpret it this way? If the renewable energy sector is locked-in, then one would expect this shock to have little consequence in the long term for renewable energy firms. If, however, the election did have lasting effects on their prospects, then this would suggest that the renewable energy industry is still dependent on the goodwill of politicians—at least in the United States.
Drawing on event studies, I estimate the short- and long-term effect of the election on these firms’ (abnormal) returns (where long-term is defined by a period of about three weeks after the election). Unexpected events can generate valuable insights into the economic consequences of political shocks.Footnote 10 I find that renewable energy stocks experienced abnormal losses of 3.2 percent the day after the election. The shock was quickly absorbed, but it generated a cumulative decline of about 6 percent on average for the entire industry over the three weeks that followed the election. The effect was mostly felt by the solar power industry, with cumulative abnormal returns of about −10 percent.
In additional analysis, I show that the losses were almost entirely concentrated in firms headquartered abroad. U.S.-based renewable energy companies actually did not suffer from long-term consequences. The hit on non-U.S. companies was significant and substantial, with a cumulative abnormal loss of 14 percent. This suggests that the market did not consider weaker federal support to be particularly concerning for the wellbeing of renewable energy firms. Instead, they appeared more worried by the possibility that President Trump would increase trade barriers, either through tariffs or some form of national preference.
In sum, Donald Trump did represent a shock for renewables and suggests that this industry is still vulnerable to adverse political conditions. Yet the story is more complicated: The shock was not equally felt by all firms. Investors seem to believe that some renewable energy companies (those based in the United States) will fare like before. In other words, the election had a distributive effect and was not a systemic and uniform setback. These results contribute to some of the broader challenges facing renewables. Within a few years, renewables considerably transformed the energy sector of many countries across the world. Yet from a sustainability perspective, a complete clean energy transition still faces major obstacles. Some are of a technical and economic nature.Footnote 11 Others are political. As long as the renewable energy industry remains sensitive to the political climate, setbacks will continue to threaten their timely deployment.Footnote 12
Background and hypotheses
Over the last two hundred years, fossil fuels—and to a lesser degree nuclear power—have transformed modern economies.Footnote 13 Unlike biomass, fossil fuels generate vast amounts of energy in an efficient manner, and have thus unlocked unprecedented economic growth across the world. Countries that fail to develop sound energy infrastructures suffer in terms of welfare and quality of life.Footnote 14
Despite their significant advantages, fossil fuels generate many negative externalities. Extracting resources such as gas can be environmentally damaging.Footnote 15 Furthermore, the combustion of coal and kerosene contributes significantly to local air pollution and therefore represents a health hazard.Footnote 16 Fossil fuels are also among the biggest contributors to climate change.Footnote 17 As a result, political leaders around the world have called for a clean energy transition. Renewable energy, such as energy generated from wind and solar power, could possibly offer the same benefits—affordable and abundant energy—without fossil fuels’ undesirable side-effects.
The negative consequences of fossil fuels do not spontaneously guarantee a seamless transition to clean energy. From a theoretical standpoint, states and energy markets operate in a symbiotic relationship.Footnote 18 States provide the institutional background needed for businesses to flourish.Footnote 19 The need for good institutions, such as a good legal system and well-protected property rights, is particularly acute in markets characterized by high risks of market failures. Governments may need to regulate greenhouse-gas emitting businesses in order to curb negative externalities. Likewise, they may need to help industries that generate positive externalities.Footnote 20 In doing so, states can create new industries, which in turn become their own agents.Footnote 21 Firms demand and sometimes receive policies that help them survive and capture larger rents.
The political economy of industries captures the critical stages of the emergence of the renewable energy industry. In fact, energy markets in general are characterized by significant involvement by states. The development of modern economies required the creation of infrastructures to capitalize on the benefits fossil fuels.Footnote 22 Oil and gas need to be shipped across the world through a network of pipelines and tankers. They then need to be refined for final consumption. Similarly, the electric system requires the construction of many power stations and an extensive grid to match demand at any given time. Many of these investments were subsidized by governments, creating a form of path dependency for the entire economy. As a result, both the private and public sectors are tailored to take advantage of fossil fuels. Furthermore, the fossil fuel industry seldom had to face the financial consequences of the environmental degradation it generates. Together, negative externalities and path dependency ensured that the fossil fuel sector would be “locked-in,” deterring the entry of potential competitors.Footnote 23
Despite these obstacles, several countries now rely heavily on renewable energy. Electricity from renewable sources produces considerably less pollution than fossil fuels.Footnote 24 In Denmark, renewables contribute almost two-thirds of all electricity generated.Footnote 25 In Germany, more than a quarter comes from renewables. These developments have been the result of two decades of intense political struggles over the domestic production of electricity.Footnote 26 Declining prices due to technological innovation and supportive policies (such as feed-in tariffs) have helped renewables break the monopoly of fossil fuels and nuclear power.Footnote 27 In line with the predictions of the literature on the politics of business and special interests,Footnote 28 the renewable energy sector has been a successful advocate for its interests and represents, in several states, a powerful lobby.Footnote 29 Lobbying by renewable energy firms helped foster a benign business environment. The success of pro-renewable coalitions in large economies, such as Germany, shows that renewables have come a long way. Undoubtedly, they have been able to weaken the carbon lock-in.Footnote 30
This does not mean that renewables have been equally successful everywhere, nor that they are always popular. Looking at the deployment of wind power in Canada, Stokes shows that localized opposition can inflict significant electoral damage to pro-renewable policymakers.Footnote 31 Aklin finds that pro-renewable energy policies have increased the average household electricity bill. As a result, the share of citizens who are hostile to ambitious renewable energy policies has increased.Footnote 32 The question, then, remains open: Is renewable energy locked-in? In other words, is the renewable energy industry able to thrive without supportive policymakers? This is the question that this paper seeks to address.
The question is particularly salient in the United States, where fossil fuels retain significant economic and political power. During his tenure, President Barack Obama was a fairly reliable supporter of renewable energy. His Climate Action Plan put renewable energy at the heart of his climate change strategy, calling for the allocation of space for renewables on public land, more financial support for rural renewable energy producers, and increased consumption of renewable energy by the government.Footnote 33 Energy was an important point of contention during the 2016 presidential election. As a candidate, Hillary Clinton ran on an ambitious platform for renewables. She announced her desire to “[g]enerate enough renewable energy to power every home in America, with half a billion solar panels installed by the end of [her] first term.”Footnote 34 In her manifesto, she professed a plan to invest $60 billion for the development of clean energy more generally. Her support for renewables was mirrored by attempts to cut back on fossil fuels subsidies.
In sharp contrast, Trump was skeptical of renewables and supportive of fossil fuels—especially coal. At a rally in Pennsylvania, he lamented that clean energy was “so expensive.”Footnote 35 The cost was particularly prohibitive for solar power.Footnote 36 Wind power also was a problem because of its perceived danger for birds.Footnote 37 During the campaign, he promised to leave the Paris Agreement on climate change, cancel President Obama's Climate Action Plan, and support the construction of the Keystone XL pipeline. He repeatedly assured his listeners that “[w]e're going to bring back the coal industry, save the coal industry.”Footnote 38 In sum, Clinton and Trump clearly diverged in their views on energy policy. They disagreed on (a) renewables, (b) fossil fuels, and (c) the domestic and international implementation of environmental regulation.
The first hypothesis therefore is:
Hypothesis 1:
Adverse electoral shocks affect the stock performance of renewable energy companies negatively.
The two candidates also diverged on another relevant topic: globalization. Notably, their preferences over trade regulations clashed. Despite a long history as a free-trade supporter, Clinton was ambiguous about her trade policies during the presidential campaign. For instance, she took position against the Trans-Pacific Partnership deal. However, media reports noted that she had previously regularly supported it.Footnote 39 In fact, several Democratic leaders such as Governor Terry McAuliffe (Virginia) expected her to be supportive of trade deals once elected.Footnote 40 Trump, on the other hand, was a forceful critic of free trade during the campaign. He announced his desire to impose tariffs on imports, renegotiate NAFTA, and even threatened to leave the World Trade Organization altogether.Footnote 41
Trade policies are a second channel through which elections could affect the renewable energy industry. As a trend, governments have generally removed trade barriers in energy markets over the last few decades.Footnote 42 The clean energy sector is no exception. It is highly globalized, as Meckling and Hughes show in the case of the solar photovoltaic industry. They note that “vertically specialized firms with global ties populate all stages of production, including upstream, manufacturing, and downstream, and research suggests that this is representative of a general type of global supply chain present across industries.”Footnote 43
Besides trade, the two candidates appeared to have diverging views on global economic relations in general. Trump's candidacy was characterized by skepticism over migration and criticism toward currency policies of trading partners, and opposition toward outside investments.Footnote 44 More broadly, such an agenda could intensify the “liability of foreignness,” suggesting that the effect of the election may be different for U.S. and non-U.S. firms.Footnote 45
In sum, the election may have had two distinct consequences: (a) it could have affected the entire industry through its consequences on energy and environmental regulations in general; (b) it could have affected non-U.S. producers through its effect on international business. A hostile regulator can discourage investments in several ways. Whether the effect solely operates through trade or through other means is difficult to assess, given the paucity of data available. For simplicity, I generally refer to this mechanism as the trade channel, although as noted other regulatory obstacles may explain discrimination against non-U.S. firms.
Hypothesis 2:
The effect of adverse electoral shocks on renewable energy companies is stronger for non-U.S. than for U.S. firms.
Overall, the 2016 election thus offers us a good test case for the role played by politics in the renewable energy sector. The election of Clinton would have meant the continuation of the status quo in terms of environmental regulations and international commerce policies. From an ex ante perspective, the election of Trump would have signaled a possibly abrupt change of direction. It could have implied lower levels of public support for renewables and fewer environmental regulations. Furthermore, it could have meant an increase in tariff duties for production abroad or other impediments to global business.
In the rest of this paper, I examine the consequences of Trump's election on the prospects of the renewable energy sector. If renewables are locked-in, then the election would have had few, if any, consequences on the value of firms operating in that sector. A lack of reaction by investors would have implied that the bottom line was not dependent on one particular leader. If, however, renewable energy firms still depend on the federal government's support, then one may infer that they still represent an infant industry that may need to be nurtured.
Methods and data
To estimate the effect of the 2016 U.S. presidential election, I rely on an analysis of stock market data. Prices convey valuable information.Footnote 46 Share price movements contain costly signals by investors that reveal their expectations about the future. Declining share prices are indicative of weaker expectations about the performance of a firm. Increasing prices convey the opposite information. On the other hand, an event may contain little information. If this firm was expected to perform equally well under Trump or Clinton, then we would expect no change in the valuation of the firm. To the extent that the election was a shock that affected people's beliefs over the future welfare of an industry (and I argue below that it was), we would expect it to be reflected in the value of a firm's shares. The study of stock market data can therefore shed light on the economic consequences of political events. Studies that rely on event analysis include the effect of political connections, international defense meetings, or pollution spikes.Footnote 47
Before turning to the description and implementation of this research design, it is important to clarify what event analysis can and cannot do. The outcome of interest—a share's returns—reflects investors’ beliefs over future state of the world. The 2016 presidential election is helpful because it isolates one particular source of these beliefs, namely the political climate. However, while investors have an incentive to get their predictions right, this does not mean that they always do. Their reaction to a political event does not necessarily translate into actual policies. Using event analysis to measure the impact of a policy change, such as a repeal of the Clean Power Plan or the Paris Agreement is challenging because it is much more difficult to point at the exact time at which information is released. As a result, the study of policy reforms is ill-suited for the kind of analysis conducted here. On the other hand, studying investors is informative: It does reflect the subjective beliefs of a large group of generally well-informed individuals and institutions about the expected consequences of a set of policies, and therefore warrants a close study. Next, I explain how I implemented this research design.
Renewable energy firms
The first step in this analysis was to establish the roster of renewable energy companies listed on major stock markets. Renewable energy firms were selected by their presence on the Bloomberg Industry Classification Standards (BICS) list of Renewable Energy companies. BICS is one of the most comprehensive databases of publicly traded firms. It assigns firms to the category based on the portion of their revenues attributable to a given sector. For this analysis, I extracted all firms that were classified as operating in the renewable energy business across the world. This includes but is not limited to firms listed on the New York Stock Exchange (NYSE). In fact, several important firms are listed in Europe and elsewhere. I included the location of each firm's headquarters as well.
Next, I matched each firm with its historical pricing data. The data were retrieved from two sources: Capital IQ and Yahoo Finance. In cases where the two sources disagreed, I looked for a third database to identify the accurate data; in practice, the two sources were essentially identical. I collected all available daily stock market prices between 2015 and 2017. If a stock ticker from the BICS was not identifiable via Capital IQ or Yahoo Finance, it was sought out individually from Google Finance. If it was not identifiable on either platform (normally because it was delisted from public indices), it was not included in the dataset. Finally, historical market capitalization and trading volume data were gathered from a Bloomberg terminal.
The next step was to remove from this database firms that were not relevant for this analysis. Many firms are nominally listed on a given stock market but in fact are essentially empty shells. This includes many “penny stocks,” or firms that trade at a very small value. To ensure that the results were not driven by these firms, I removed firms whose share at any time between 2015 and 2017 traded for less than $1. I also removed firms that were not listed anymore by election day on 8 November 2016.
Finally, I selected and kept only firms whose primary activity was within the realm of renewable energy. To identify such firms, I examined Bloomberg's sectoral description of each firm. Firms were kept in the sample if one of the following was listed in the subsector description: wind, solar, hydro, biofuel, and other clean energy operations. Firms that did not have any of these tags were not part of the main analysis.Footnote 48 This removes firms that have ambiguous ties with renewables (e.g., banks), but whose core business is unrelated. This scaled down the number of firms in the main analysis from 121 to 48. Furthermore, a few firms stopped trading or had missing data, reducing the sample further to forty-two companies. These firms are headquartered in thirteen countries and listed on eleven different stock markets and are listed in table A36. Lastly, I compared the sample with Thomson Reuters’ list of twenty-five largest renewable energy companies.Footnote 49 None of the firms that were discarded were part of the top-twenty-five (except one that had gone bankrupt in the meanwhile). This further suggests that the final sample contains the main publicly-traded renewable energy companies.Footnote 50
Event analysis
Throughout this analysis, I study three quantities of interest: observed returns, abnormal returns, and cumulative abnormal returns. Observed returns provide a general sense of the market's reaction to the election. However, this does not identify the renewable energy-specific effect of the shock. Event analysis, which studies abnormal returns and cumulative abnormal returns, is a useful method to get precisely at this. It rests on a simple intuition: If we knew what a stock's return ought to be under regular conditions (i.e., in the absence of the shock), then we could compare observed values of this stock to the unobserved counterfactual.Footnote 51 The difference between the two represents an abnormal deviation.
Let (observed) Return i,t be the actual return of a stock (computed as the daily percentage change of a share), and let E[Returni,t | Xi,t] be its expected return. Then, we define the abnormal return (AR) as:
 $$\matrix{ \hfill {\hbox{Abnormal Return}_{i,t} = {\rm Return}_{i,t} - E[{\rm Return}_{i,t} \vert {\bf X}_{i,t}],} \cr} $$
[eq:ar] where  ${\bf X}$ is a vector of covariates to be defined later. The cumulative abnormal return (CAR) is simply the abnormal return summed up over a given period of time:
 $$\matrix{ \hfill {\hbox{Cumulative Abnormal Return}_i = \mathop \sum \limits_{t = \tau} ^T \hbox{Abnormal Return}_{i,t}.} \cr} $$
The challenge is to reconstruct the counterfactual E[Returni,t | Xi,t]. The most widely used approach in is the market model, which partitions the data in two, as shown in figure 1.Footnote 52 One part, the estimation window, is used to model returns in order to be able to predict them later on. The estimation window is used to recover the link between market returns and specific renewable energy shares. To benchmark renewable energy stocks, I use three market-wide indicators: the NYSE Composite Indicator, the DAX performance index (Deutsche Börse), and the FTSE (London Stock Exchange). Since the renewable energy firms in my dataset are located across the world (mostly in the United States and Europe), this allows different stocks to be modeled by different markets.Footnote 53 These three market indices are representative of some of the largest stock markets in the world. The NYSE is ranked number one by market capitalization, while the London Stock Exchange is third and Frankfurt is tenth.
Timeline of event studies. The estimation window is the pre-event timespan used to estimate the parameters of the model. The event window is the timespan during which the abnormal returns are analyzed. For this paper: t 0 is October 1, 2015; t 1 is April 1, 2016; t 2 is October 11, 2016; and t 3 is December 4, 2016.

Using daily percentage changes for all values, I estimate the following model with least squares:
 $$\matrix{ \hfill {{\rm Return}_{i,t} = \alpha _i + \beta _i\hbox{NYSE}_t + \gamma _i\hbox{DAX}_t + \kappa _i\hbox{FTSE}_t + \varepsilon _{i,t} \vert t_0 \lt t \lt t_1,} \cr} $$
The estimation window uses data from t 0 to t 1. To generate valid estimates, the estimation window should contain a period that contains no major structural shocks. This ensures that the correlation between the market indices and a given stock are unbiased estimates of the later correlation between the two. Here, it is important to go enough back in time to avoid contamination by the swings of the presidential election. I use the window from 1 October 2015 to 1 April 2016.
The reason is the following: On the one hand, a good estimation window will not be affected by the event itself; as a result, I preferred a window that preceded the presidential campaign. On the other hand, the window should cover a period that is otherwise similar to the event window. Given how quickly the renewable energy industry is changing, this meant that the window should not be too old. Thus, a window that started about a year before the election seemed appropriate. In the appendix, I show that the results are robust to alternative estimation windows.Footnote 54
I report the point estimates for all regressions of the estimation window in figure A1 and their corresponding R-squared in figure A2. For most part, firms were generally more reactive to the NYSE indicator than the two others, but including the latter increased the precision of the estimates overall. Next, I use the estimates of  $\widehat \alpha $,
 $\widehat \beta $,
 $\widehat \gamma $, and
 $\widehat \kappa $ for each individual firm to estimate the following equation with the data from the event window:
 $$\widehat{{{\rm Return}}}_{i,t} = \widehat{\alpha} _i + \widehat{\beta} _i\hbox{NYSE}_t + \widehat{\gamma} _i\hbox{DAX}_t + \widehat{\kappa} _i\hbox{FTSE}_t \vert t_2 \lt t \lt t_3.$$
There is no clear consensus regarding the length of the event window. Some scholars have used windows in the vicinity of twenty days prior and after the event.Footnote 55 Others use much shorter windows of a few days.Footnote 56 Expanding the window allows for more precise estimates of the effect of the shock, but it also increases the chances of accidentally obtaining effects where none exist. A window that is too large is likely to yield false positives and the estimates of AR and CAR become less reliable. To avoid making a trade-off, I report the results using a window of twenty business days before and after the election; I then replicate the analysis with both sorter and longer windows. Tables A14 and A15 report the estimates for two and four business days around 8 November 2016. Tables A16 to A19 show the results for forty and ninety days. The results remain similar regardless of the event window.
For this approach to generate a valid assessment of the effect of the election, the latter must have generated information for investors. In other words, the election results must have been (to some degree at least) a surprise. Otherwise, its implications for renewable energy firms would already have been priced in the stock markets. Was this the case? According to the Trump campaign itself, it was.Footnote 57 And this view seems to have been widely shared.Footnote 58 This can be seen by looking at the last pre-election measures of the likelihood of candidate Trump winning. I collected data from ten of the leading betting firms and poll aggregators. Betting odds are useful because they are a costly signal sent by gamblers. Existing research suggests that betting markets on presidential elections are generally efficient.Footnote 59 Survey data is also valuable. Even though polling companies could be engaging in cheap talk, they perform well when averaged across the industry. Table 1 presents the results. As we can see, the highest estimate of candidate Trump winning was about 20 percent (FiveThirtyEight). On average, candidate Trump's ex ante subjective likelihood of winning was about 15 percent. The election can therefore plausibly be described as a surprise event.
Probability (implied or simulated) of a win by Hillary Clinton in the 2016 presidential election. All probabilities were reported on the most recently available estimate, up to election day itself. PredictIt (betting) value at 8:41PM on November 8. All values rounded up.

Before discussing modeling strategies, let me review the problem raised by exchange rates. Some of the returns used in the analysis below are denominated in non-USD currencies. As a result, there exists a residual risk that part of the change in returns could be driven by a change in exchange rates. For instance, if the euro lost 5 percent after the election, then this could overstate the effect of the election. This is unlikely to be a problem here. First, exchange rates changed much less than stocks before and after the elections (figure A4 and A5). Second, the quantity of interest are abnormal returns. These abnormal returns are computed based on the performances of the DAX and FTSE, both of which would presumably already incorporate international exchange rate shocks. Such a strategy has been found to offer reliable estimates of abnormal returns.Footnote 60 Still, to ensure that the results are robust, I replicate the event analysis by first subtracting daily exchange rate changes from the returns. The results, reported in the appendix, are very similar to the ones presented below. See, in particular, figure A3, table A12, and table A13.
Regression equations
I estimate several models. To begin with, I examine whether the election had a negative effect on stock returns for renewable energy companies. Because the effect of the election may materialize both in the short and the long run, I model stock returns in an error correction process.Footnote 61 By “long run” I mean a time period of about twenty days. Error correction models (ECMs) distinguish between the short- and the long-term effects of a shock. Given the relatively short time window used in the analysis, I only include a single lag period in the results below. Robustness tests show that little insights are gained by using more complex models.
To begin with, I model observed and abnormal returns. These illustrate how the election affected stock values immediately after the election and over the course of several days. The models I estimate are variants on:
 $$\eqalign{\; & \Delta {\rm Return}_{i,t} = \alpha _i + \lambda {\rm Return}_{i,t - 1} + \beta _i{\rm Nov}. 9_t \cr &\quad\quad\quad\quad\quad+ \tau \hbox{Post-Election Period}_t + \varepsilon _{i,t} \vert t_2 \lt t \lt t_3. \cr & \Delta \hbox{Abnormal Return}_{i,t} = \alpha _i + \lambda {\rm Return}_{i,t - 1} + \beta _i{\rm Nov}. 9_t \cr &\quad\quad\quad\quad\quad\quad\quad\quad\quad\quad + \tau \hbox{Post-Election Period}_t + \varepsilon _{i,t} \vert t_2 \lt t \lt t_3.} $$
In this model, Δ is the first difference operator; α i are firms, headquarter, or sectors fixed effects.Footnote 62 Firms’ fixed effects are particularly useful because they hold constant features such as the size of the firm and any firm-specific (and time-invariant) characteristics. 9 November is a dichotomous variable that takes value 1 on 9 November 2016, and represents the immediate effect of the election. Post-election Period is an indicator for the entire period after 9 November, and thus represents the long-term effect of the election. The data is constrained to the twenty days before and after the election. The standard errors are clustered by firm.
Next, I examine the aggregate effects of the shock. β tells us the immediate reaction of markets and τ tells us their long-term equilibrium effects; neither gives us the overall consequences of the election. This is where cumulative abnormal returns generate useful insights. Thus, I next estimate:
 $$\eqalign{& {\rm Return}_{i,t} = \alpha _i + \phi _1 \hbox{Post-Election Period}_t + \varepsilon _{i,t} \vert t_2 \lt t \lt t_3, \cr & \hbox{Abnormal Return}_{i,t} = \alpha _i + \phi _2 \hbox{Post-Election Period}_t + \varepsilon _{i,t} \vert t_2 \lt t \lt t_3, \cr & \hbox{Cumulative Abnormal Return}_{i,t} = \alpha _i + \phi _3{\rm Post} \hyphen\hbox{Election Period}_t \cr&\quad\quad\quad\quad\quad\quad\quad\quad\quad\quad\quad\quad\quad\quad\quad\quad \!\! + \varepsilon _{i,t} \vert t_2 \lt t \lt t_3.} $$
The parameter φ 3 measures the aggregate effect of the election on a given set of stocks. It captures the average damage inflicted by the shock over a twenty days window in the aftermath of 8 November 2016. This is the main quantity of interest in this paper. For completeness, I also estimate φ 1 and φ 2, which tells us on average whether returns differed before and after the election.
Finally, I replicate some of these results but split the sample by geographic location. The rationale behind this is to explore Hypothesis 2, which states that non-U.S. firms should have been hit more adversely than U.S.-based ones. I noted that one reason for this is the risk of trade disputes. U.S.-based firms would presumably not be affected as much by this policy channel, whereas firms whose production is located abroad would have been more exposed. Unfortunately, I do not possess access to data on the production location for each firm. Instead, I use their headquarters as a proxy. A large literature in finance and accounting shows the importance of the headquarters’ location for firms themselves and for local economies.Footnote 63 Anecdotal evidence suggests that renewable energy firms try to keep their headquarters close to some of the production facilities. One example is Suzlon, which moved parts of its headquarters to Denmark and opened factories there.Footnote 64 More systematically, I reviewed annual reports and SEC fillings to verify that headquarters are a meaningful indicator of production. Despite patchy data (e.g., few reports provide a full list of production facilities), it appears that headquarters are a reasonable proxy for firms’ production. Besides larger players like Vestas, many firms operate mostly in their home country, before selling their products at home or abroad.
Despite these precautions, there exists a risk of measurement error. We can distinguish two cases. First, to the extent that the mechanism underlying Hypothesis 2 is the fear of trade disputes, then the best measure would have been based on the location of production. Note, however, that such measurement error would bias the estimates toward zero. If U.S. firms are also affected (e.g., because they import intermediate goods)Footnote 65 then the difference in stock market reaction should be closer to zero when using headquarters. Second, if Hypothesis 2 is underpinned by a general concern over non-U.S. firms, then headquarters may be an acceptable proxy.
To further verify that the difference in results between U.S. and non-U.S.-based firms is reliable, I collected additional data from Bloomberg. I combined the post-election indicator with the percentage of sales completed in the United States. Presumably, the non-U.S. companies that are most at risk are those who sell a non-trivial share of their goods on the American market. While this does not account for the location of the production, it does account for potential effects of trade barriers on imports of inputs and finished goods. The result is reported in table A29 and confirms this conjecture: The shock of the election was the worst for non-U.S. firms that are highly exposed to the U.S. market. I come back to this in the results.
All variables are summarized in table 2.
Descriptive statistics. The sample only includes data from the event window.

Results
Normal, abnormal, and cumulative returns
The 2016 presidential election generated considerable turbulence for the renewable energy sector. Between 8 November and 9 November 2016, renewable energy stocks lost about 2 percent value on average. This was not part of a general downward trend for this industry. In fact, the average return over twenty days before the election was about zero. Renewable energy stocks also exhibited more volatility. The standard deviation of returns increased from 2.6 percent in the twenty days preceding the elections to 4 percent after the election—and jump of about 50 percent.
The decline in renewable energy companies’ value was by no means representative of the broader market. In fact, after a few hours of decline during the night of 8 November, stock markets rallied and strengthened over the following days. The NYSE Composite index and the NASDAQ increased by 1.1 percent, the DAX by 1.6 percent (in contrast, the FTSE declined by 1.6 percent). For most part, markets—especially in the United States—recorded solid results in the days and weeks that followed.Footnote 66
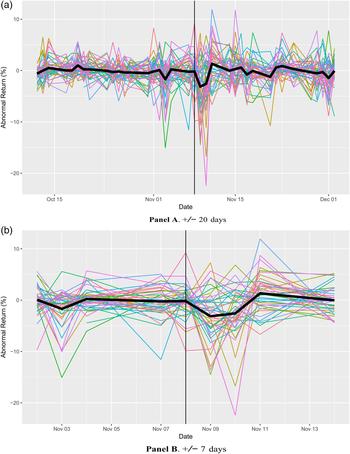
As a result, renewable energy stocks seriously underperformed the wider market. Figure 2 displays the daily abnormal returns for these firms before and after the election. Panel A shows a +/−20 days window; Panel B zooms in to show the markets’ reaction the week before and after the election.
Abnormal returns for renewable energy companies before and after the election. The vertical black line indicates 8 November 2016. The horizontal black line represents the daily raw average of abnormal returns. One firm (OPTT) that experienced large positive and negative swings was removed to make the figure more readable.

Table 3 reports the estimated short and midterm effect of the election on renewable energy stock returns. Models 1 to 3 report the observed returns; models 4 to 6 include the abnormal returns. Clearly, the short-term effect was devastating for renewable energy firms. Raw returns declined by almost 2 percent. The effect does not depend on firm-specific characteristics nor on the origin of the firm. Once we account for broader market fluctuations (models 4–6), the decline is even more dramatic. Renewable energy stocks declined by about 3 percent compared to the broader market. The election, therefore, represented a serious adverse shock to the industry. In table A1, I replicate these results using all firms in my sample, except those for where no ties to the renewable energy sector could be clearly established. The results remain very similar, suggesting that the effects were broadly felt across the entire industry.
Effect of the election on observed returns and abnormal returns. Error correction model specification. Standard errors clustered by firm. * : p < 0.1, ** : p < 0.05, *** : p < 0.01.

Did the shock generate long-term consequences? Here, the picture is more complicated. Based on the estimates of table 3, we see that the effect of the election materialized almost immediately; in the long run, share returns went back to the equilibrium trend. But this does not mean that these firms bounced back to their earlier levels. The question is whether their cumulative (abnormal) returns exhibited substantial decline or not. Table 4 answers this question. I regress observed returns, abnormal returns, and cumulative abnormal returns on a dichotomous indicator that take value 1 after the election. In other words, I examine whether any of these outcomes differ in the twenty days preceding and following the election. As we can see for both nominal (models 1–3) and abnormal returns (models 4–6), on average returns did not depart from their pre-election level. This means that the initial shock was quickly reflected by prices.
Dependent variable: observed returns (models 1-3) abnormal returns (models 4-6), and cumulative abnormal returns (models 7-9). Standard errors clustered by firm. * : p < 0.1, ** : p < 0.05, *** : p < 0.01.

The cumulative effect of the election, however, was negative, with a cumulative loss of almost 6 percent on average (models 7–9). Thus, a significant portion of these firm's equity was wiped out by the election. The estimates are robust to firm-, stock market-, and sector-indicators. If we disaggregate the effect by sector, we find that the effect was particularly large for those firms operating in the solar industry, with cumulative abnormal returns of about -11 percent (table A5).Footnote 67 Wind also declined on average by about 2 percent (table A4). While nontrivial, the effect is not statistically significant; partly, this is because of low power given that only few firms in my sample operate in this area.
These headline results have significant implications: To the extent that they reliably capture investors’ expectations about future policies, this suggests that the renewable energy sector can still be battered by adverse political shocks. At the same time, it is important to qualify this conclusion. All elections generate winners and losers. Any presidential contest is therefore bound to have differential consequences across industries. Nonetheless, the steepness of the decline of renewable energy companies highlights this sector's fragility.
Split sample
The election of Donald Trump therefore appears to have weakened investors’ expectations about the renewable energy sector. Was the effect universal? To answer this question, I examine cumulative abnormal returns by the country of origin of each firm. I divide the sample between firms based in the United States and those based elsewhere. Table 5 reports the effect of the election by geographic group. I find that the election had no distinguishable effect on U.S.-based firms. The estimate on CAR (model 3) is negative, but not very large in substantive terms. Non-U.S. firms, on the other hand, were massively hit by the election, with cumulated losses of 14.5 percent on average over the twenty days that followed 8 November. The difference, in effect, is particularly visible in figure 3. I plot the mean and median CAR for the two subsets in Panel A and B. The negative effect of the election was most adversely felt by firms operating in the rest of the world. The distribution of CAR for the post-election period reinforces the systematic difference experienced by U.S. and non-U.S. firms. In sum, the election of Donald Trump has a very heterogeneous effect. Renewable energy companies based in the United States suffered from little short- and medium-run consequences. Those based abroad, on the other hand, experienced substantial declines.
Cumulative abnormal return in the United States (Panel A) and in the rest of the world (Panel B). Panel C depicts the distribution of cumulative abnormal returns in the United States and elsewhere in the twenty days following the election.

Dependent variable: observed returns (OR), abnormal returns (AR), and cumulative abnormal returns in the U.S. (models 1-3) and abroad (models 4-6). Standard errors clustered by firm. * : p < 0.1, ** : p < 0.05, * * * : p < 0.01.

Additional results appear to confirm that exposure to the United States was critical. In table A29, I interact the post-election indicator with the share of sales each firm completed in the United States in 2015 (i.e., the year before the election). CAR are statistically indistinguishable from zero for non-U.S. firms that also do not sell their product in the United States. Those that do were hammered by investors. A firm that increases its exposure to the United States by one standard deviation (i.e., about 21 percent) experienced a CAR decline by about -12 percent (p < 0.01). The most at-risk firms were therefore those located abroad but that did business in the United States.
Fossil fuels
Was the fossil fuel industry similarly affected by the election? Coal, oil, and gas producers could plausibly have been seen as likely benefactors from a Trump presidency. As a candidate, Donald Trump repeatedly promised that he would help a struggling coal industry and boost resource extraction.Footnote 68 Examining markets’ reaction with regard to fossil fuel offers several benefits. First, it verifies that indeed market participants perceived Candidate Trump to be more sympathetic to fossil fuel interests. One would expect fossil fuel abnormal returns to be either positive or close to zero. Abnormal returns should be positive if markets believed Trump to be more supportive than Clinton, and nil if both shared similar views. Second, comparing U.S. and non-U.S. fossil fuel companies helps us assess whether the reactions against non-American renewable energy companies represent a trade shock or whether they were compartmentalized. Scholars noted that foreign companies often suffer from a “liability of foreignness.”Footnote 69 The election of a president that is less willing to maintain an open world order could represent a broader shock that does not solely affect renewable energy companies. It is therefore important to distinguish whether the electoral shock was general or targeted.
To answer these questions, I replicated the paper's main results, this time using a sample of fossil fuel companies. I used the list of the 200 largest publicly-traded fossil fuel companies and matched them with data from Bloomberg. The list of firms is provided by Fossil Free Indexes LLC, a financial intelligence provider. I then estimated the main models, using these companies returns instead.
Figure A6 and table A21 show that fossil fuel companies benefited from an abnormal return of about 0.2 percent. The effect is statistically significant. However, over the event window considered here, most of these gains were eventually wiped out. Furthermore, there is mild evidence that U.S.-based firms fared somewhat better (table A22). Abnormal returns were slightly larger for firms based in the United States (about 0.7 percent, compared to almost zero for the rest of the world). Again, the cumulative effect dissipated over time.
In sum, these results suggest that fossil fuel companies benefited in the immediate aftermath of the election (especially U.S.-based ones), but this effect was not persistent. There are two main implications from this observation. First, it appears that concerns over international firms were compartmentalized by sector. Fears of trade barriers or other impediments to commerce were not uniformly distributed over all sectors. Instead, renewables were a particularly visible target. Second, the fossil fuel industry is somewhat less vulnerable to electoral shocks. In other words, markets did seem to place little weight on the identity of the office holder when assessing the prospects of this industry. Of course, we did not observe the counterfactual in which Hillary Clinton won. Yet ex ante, markets remained stable to this electoral shock. This could be interpreted in two ways. The first interpretation suggests that Candidate Trump and Clinton did not credibly differ much on fossil fuel regulation. The second interpretation is that the fossil fuel industry remains insulated from regulatory threats.
Discussion and conclusion
The clean energy transition has come a long way. Renewable energy, from being an insignificant source of power ten years ago, has grown into a large contributor to energy supply. From a climatic standpoint, this is welcome news. The global climate regime is now dependent on the successful continuation of this process. In this context, findings suggesting voters started to push back against renewables are possibly worrisome. While the long-term perspectives remain positive, the short- and medium-term perspectives are less clear. At this stage, the question remains open: Is the renewable energy industry robust to political shocks?
In this paper, I looked for an answer in the case of the United States. Taking advantage of the 2016 presidential elections, I examined whether the renewable energy sector had become resilient to an adverse shock. Given his hostility toward renewables and his open support for fossil fuels, Donald Trump's election represents a good test case to evaluate the robustness of the renewable energy sector. The immediate response of stock markets was undoubtedly negative. Renewable stocks were hammered. Even ignoring the immediate reaction and taking a long-run perspective (of about three weeks), I found that the value of renewable energy companies suffered from substantial losses. The implication is that policies still play an important role in the welfare of the renewable energy sector. However, I also found that the losses are concentrated in firms located abroad. How can we interpret these findings? One possible interpretation is that renewable energy companies abroad are at the mercy of potential trade disputes or other shocks that affect non-U.S. companies disproportionately. As a candidate, Donald Trump has mentioned several times the possibility of raising trade barriers across different sectors. Possibly, his election increased the likelihood of obstacles put in front of non-U.S. companies. Firms based in the United States, on the other hand, would be mostly shielded from such a policy. More generally, investors might worry that the federal government may put in place regulations that discriminate against non-U.S. firms. In sharp contrast with earlier administrations, the new administration has regularly expressed skepticism over the importance of maintaining a liberal world order.
This could be a significant problem for climate governance. As several observers noted, international energy markets tend to be highly globalized.Footnote 70 Given that the Paris Agreement relies heavily on technological improvements, integrated markets are excellent news, because they facilitate the flow of knowledge across the world. Obstacles to these flows could jeopardize the global deployment of renewable energy. Thus, if President Trump were to implement the kind of barriers that markets appear to expect, the assumptions underlying the Paris Agreement may not be met.
This paper contributes and generates new research questions in two areas. First, renewable energy interests might exhibit conflicting preferences. This is a consequence of state-induced growth: As long as renewable energy companies depend on some measures of public support, their preferences might clash along country lines. Symptomatic for this is the increase in trade disputes on renewable energy.Footnote 71 A firm in the United States may find it to be in its interest to support trade barriers. Thus, just like scholars of trade argue that there can be conflicting interests within an industry, scholars of energy transitions might observe lobbying battles between renewable energy companies. Indeed, Meckling and Hughes's (Reference Meckling and Hughes2017) study on solar photovoltaic suggests that the renewable energy industry is far from a homogeneous bloc. Future research that builds on models of renewable energy policymaking may wish to study the existence of other sources of tension within the renewable energy industry.Footnote 72 As global competition intensifies, lobbying might not operate along sectoral lines.
Second, the reason for the lack of effect in the United States needs to be investigated further. One possibility is that U.S. firms are more competitive than foreign ones. This seems unlikely, given that some of the largest players such as Vestas and Yingli, are located abroad. Another possibility is that investors do not believe that President Trump will cut back on federal support for renewables. This is possible though remains an open question. Yet another reason is related to the multilevel governance of energy in the United States.Footnote 73 Many important policies are under the control of state authorities and therefore beyond the reach of the White House. Even though the federal government plays an important role (for instance, through its environmental regulations), state authorities respond to different logics. Local renewable companies may benefit from valuable local connections to weather national shocks. Further research in the political economy of U.S. renewable energy could shed useful light on this question.
Supplementary material and methods
To view supplementary material for this article, please visit https://doi.org/10.1017/bap.2018.15. The appendix and a replication package are also available on Harvard Dataverse, https://doi.org/10.7910/DVN/9I106T.