

Stroke is the most common cause of adult disability and the second most common cause of death worldwide (Mukherjee & Patil, Reference Mukherjee and Patil2011). Stroke accounts for more hospital days than other conditions (Scott & Scott, Reference Scott and Scott1994). The estimated direct and indirect cost of stroke in the US for 2010 was $73.7 billion (Lloyd-Jones, Adams, & Brown, Reference Lloyd-Jones, Adams and Brown2010), while that of Europe was approximately €64.1 billion (Gustavsson, Svensson, & Jacobi, Reference Gustavsson, Svensson and Jacobi2011). In Australia, the lifetime cost of stroke in general is $1.3 billion, with 72% of this attributed to ischaemic stroke (IS) ($936.8 million AUS) (Dewey et al., Reference Dewey, Thrift, Mihalopoulos, Carter, Macdonell, McNeil and Donnan2003).
It has been noted that prevalence of cognitive impairment after stroke remains persistently high (>20%) up to 5 years post stroke (Douiri, Rudd, & Wolfe, Reference Douiri, Rudd and Wolfe2013). The areas of deficit vary between studies due to methodological differences. However, in a study of 60 consecutive people examined 109 days post stroke compared to 40 matched controls, neuropsychological deficits were found across all areas assessed including attention, executive functions and memory (Planton et al., Reference Planton, Peiffer, Albucher, Barbeau, Tardy, Pastor and Pariente2012). Unfortunately, this study was limited due to small sample size.
In a population-based study, Auckland study (Auckland Regional Community Outcomes Stroke Study; ARCOS-III), all strokes occurring in the Auckland region were identified from March 1, 2002 to February 28th, 2003. A follow-up of participants 5 years post stroke used an in-depth neuropsychological test battery (Barker-Collo, Feigin, Parag, Lawes, & Senior, Reference Barker-Collo, Feigin, Parag, Lawes and Senior2010; Barker-Collo et al., Reference Barker-Collo, Feigin, Lawes, Parag, Senior and Rodgers2012) to examine neuropsychological profiles of 315 IS survivors. The findings suggest relatively normal abstract visual reasoning and verbal and visual memory. However, impaired performances were observed for executive function and processing speed. Cognitive functioning contributed independently to prediction of functional outcomes over and above stroke severity, age and depression. However, this study only looked at neuropsychological functioning 5 years post stroke, and as neuropsychological assessments were not included in previous assessments, we could not provide insight into the trajectory of recovery.
The prevalence rates of neuropsychological deficits range from 50 to 90% in the 3 months following stroke (Gottesman & Hillis, Reference Gottesman and Hillis2010; Sun, Tan, & Yu, Reference Sun, Tan and Yu2014). However, existing data are restricted to short-term (<3 months) outcomes, suffer selection bias and small samples (Barker-Collo et al., Reference Barker-Collo, Feigin, Parag, Lawes and Senior2010; Desmond, Moroney, Sano, & Stern, Reference Desmond, Moroney, Sano and Stern2002; Desmond et al., Reference Desmond, Moroney, Paik, Sano, Mohr and Aboumatar2000; Hochstenbach, Anderson, van Limbeek, & Mulder, Reference Hochstenbach, den Otter and Mulder2001; Hochstenbach, den Otter, & Mulder, Reference Hochstenbach, Anderson, van Limbeek and Mulder2003; Nys, Reference Nys2005). There are few studies on neuropsychological outcomes of stroke drawn from population-based samples that tend to use brief cognitive screening measures only (Douiri et al., Reference Douiri, Rudd and Wolfe2013), whereas the present study will use a more in-depth computerised test battery.
This study examines the natural course of recovery of neuropsychological function assessed at 1, 6 and 12 months post-IS. Neuropsychological assessment is expanded beyond the typical screening test to include a lengthy computerised battery, which assesses memory, executive functioning, psychomotor and processing speed, attention and cognitive flexibility. Through inclusion of repeated measures across various areas of cognitive functioning, we intend to provide not only a detailed profile of cognitive recovery post stroke from which it will be possible to highlight suggestions for clinical practice. The study also includes an exploration of the factors predictive of neuropsychological outcomes 6 and 12 months post stroke.
Methods
This study was undertaken in accordance with the Helsinki Declaration. Ethical approval was obtained from the New Zealand Northern Y Regional Ethics Committee.
Cases were drawn from the fourth Auckland Region Community Stroke (ARCOS-IV) study, a prospective population-based study, which examined stroke incidence, prevalence and outcomes in the Auckland region of New Zealand from 2011 to 2012 (Krishnamurthi et al., Reference Krishnamurthi, Jones, Barber, Barker-Collo, McPherson and Bennett2014). The methods are described in detail elsewhere (Krishnamurthi et al., Reference Krishnamurthi, Jones, Barber, Barker-Collo, McPherson and Bennett2014). Briefly, this study included all incident strokes in residents of the Auckland Region aged ≥16 years. Complete case ascertainment was assured by multiple overlapping sources of information on all new hospitalised or non-hospitalised cases (‘hot-pursuit’ method). Daily searches were made from admission data of all the four Auckland regions, public hospitals with added weekly checks of hospital discharge and outpatient clinics. Regular checks of private hospitals, rest homes and community health services were conducted to capture non-hospitalised cases. Autopsy reports, death certificates and coroner's reports for Auckland residents were cross-checked to identify people who had died with any mention of stroke in the record. New Zealand Health Information Systems data from the New Zealand Ministry of Health of all fatal and non-fatal stroke cases in the study population (‘cold-pursuit’ methods) were also examined. Residents meeting the inclusion criteria but strokes that occurred outside the Auckland Region were also included.
Stroke was defined according to the WHO classification (Aho, Reference Aho, Harmsen, Hatano, Marquardsen, Smirnov and Strasser1980) with the diagnosis of IS based in CT/MRI scanning (>90% of cases), and classified into pathological subtype as cerebral infarction, intracerebral haemorrhage, subarachnoid haemorrhage and stroke of undetermined type. A diagnostic review committee comprising four stroke neurologists met fortnightly to confirm the diagnosis of Transient Ischaemic Attack (TIA) and stroke and classification of all ischaemic cases. The committee used medical history, hospital discharge summaries, clinical and laboratory findings (including vascular and cardiac imaging) or necropsy results, when available. Stroke was divided into pathological types (IS, primary intracerebral haemorrhage and subarachnoid haemorrhage). Cases without imaging or pathological necropsy confirmation of subtype were classified as stroke of undetermined type.
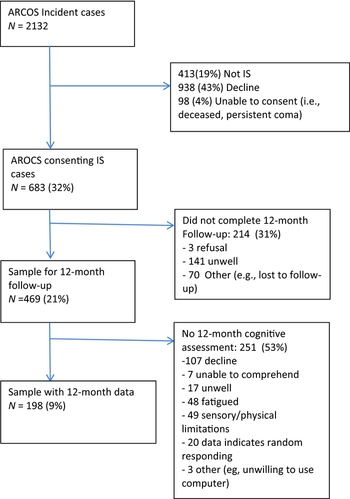
These analyses included all ARCOS-IV cases who (1) provided written informed consent, (2) had experienced an IS and (3) had outcome data from at least one follow-up assessment. Figure 1 shows selection of cases for these analyses.
Study recruitment summary.

Each assessment took two hours to complete, and was conducted face-to-face by a trained research assistant within participants’ primary place of residence. Assessments occurred at baseline (within 2 weeks of stroke), 1, 6 and 12 months post stroke. Unfortunately, baseline data were only available for 37 participants, with the greatest proportion of individuals (42.5%) being too unwell to participate. Therefore, data from 1, 6 and 12 months only will be included in the analysis. Full methods for the ARCOS study are described elsewhere (Krishnamurthi et al., Reference Krishnamurthi, Jones, Barber, Barker-Collo, McPherson and Bennett2014).
Assessments
Barthel Index (BI) (Granger, Dewis, Peters, Sherwood, & Barrett, Reference Granger, Dewis, Peters, Sherwood and Barrett1979) assesses ability to perform 10 activities of daily living (ADL) associated with personal care (e.g., feeding and bathing) and mobility (e.g., chair/bed transfer). The BI takes up to 10 minutes to complete, and maximum score (20) indicates full independence. The BI is sensitive to minimal yet clinically significant changes in physical functioning (Hsueh, Lin, Jeng, & Hsieh, Reference Hsueh, Lin, Jeng and Hsieh2002). Its test–retest and inter-rater reliability are high (weighted κ = .98 and ≥.88, respectively) (Wolfe, Taub, Woodrow, & Burney, Reference Wolfe, Taub, Woodrow and Burney1991). Compared to other measures of disability, the BI demonstrates high construct validity (r ≥ .92) (Hsueh et al., Reference Hsueh, Lin, Jeng and Hsieh2002). Acute BI scores are related to post stroke recovery (Huybrechts & Caro, Reference Huybrechts and Caro2007).
National Institutes of Health Stroke Scale (NIHSS) was administered at baseline by study staff at bedside, where possible. It is used to rate severity of IS. Each of the 11 items scores a specific ability from 0 to 4, where 0 indicates normal function and higher scores indicate some impairment. The NIHSS was designed to be a standardised and repeatable assessment post stroke for large multi-centre clinical trials (Brott et al., Reference Brott, Adams, Olinger, Marler, Barsan, Biller and Hertzberg1989). The NIHSS has been repeatedly validated for assessing stroke severity and predicting stroke outcomes (Frankel et al., Reference Frankel, Morgenstern, Kwiatkowski, Lu, Tilley, Broderick and Brott2000; Muir, Weir, Murray, Povey, & Lees, Reference Muir, Weir, Murray, Povey and Lees1996).
CNS-Vital Signs test (CNS-VS) (Gualtieri & Johnson, Reference Gualtieri and Johnson2006) is a computerised neuropsychological test that is brief (30 minutes), well validated and self-administered to those aged 8–89 (Gualtieri & Johnson, Reference Gualtieri and Johnson2006; Gualtieri, Johnson, & Benedict, Reference Gualtieri, Johnson and Benedict2004). It assesses memory (verbal memory, visual memory and working memory), psychomotor speed, reaction time, processing speed, executive functioning, attention and sustained attention, cognitive flexibility and social acuity. Subtests include verbal memory, visual memory, finger tapping, symbol digit coding, stroop test, shifting attention test and continuous performance test. Scoring is automated, eliminating rater bias. Raw scores are converted to domain scores using age-adjusted norms, and an overall Neurocognitive Index calculated as an average of five domain scores: composite memory, psychomotor speed, reaction time, complex attention and cognitive flexibility. It is designed for serial administration, automatically producing alternate stimuli whenever someone is re-assessed (Gualtieri & Johnson, Reference Gualtieri and Johnson2006). It should be noted here that the CNS-VS is not a substitute for formal neuropsychological testing, it is not diagnostic and it will have only a limited role in the medical setting, if not used in conjunction with the active participation of consulting neuropsychologist (Gualtieri & Johnson, Reference Gualtieri and Johnson2006). Domain scores are normally distributed with a mean of 100 and standard deviation of 10. Domain scores less than 70 are considered ‘very low’, and occur in only 0.13% of the normative population. Domain scores of 70–79 are ‘low’, occurring in 2.14% of the normative population, while scores of 80–89 are ‘low average’ (13.59% of normative population), scores of 90–109 are considered ‘average’ (68.26% of normative population) and scores over 109 are ‘above average’ (15.86% of normative population). Due to the large number of domain scores being considered over multiple times of assessment, categorical ranges in which greater than 20% of participants produce a score will be highlighted. This 20% figure exceeds than expected in all but the ‘average’ range of functioning.
The CNS-VS normative database includes 1069 individuals aged 7–90 years. In an examination of the psychometric properties of the CNS-VS, test–retest reliability (approximately 60 day interval) days interval are compared with other conventional and computerised neuropsychological tests with spearman's rho ranging from 0.554 to 0.874 across the various subtests. Concurrent validity of the various subtests has also been demonstrated, which has sensitivity to a number of clinical conditions – with those with dementia scoring lower than those diagnosed with mild cognitive impairment, and with those with concussion scoring worse than normal controls but better than those with more severe traumatic brain injuries, and finally those with ADHD performing better whilst-on treatment than whilst-off treatment. The test authors also showed that the depressed patients perform better after they have been treated (Gualtieri & Johnson, Reference Gualtieri and Johnson2006; Gualtieri et al., Reference Gualtieri, Johnson and Benedict2004).
Depression was assessed using the Hospital Anxiety and Depression Scale (HADS) (Zigmond & Snaith, Reference Zigmond and Snaith1983). The HADS contains 14 statements (e.g., ‘I have lost interest in things’), seven related to anxiety and seven to depression. For each statement, the participant chooses one of four responses (e.g., ‘yes, definitely’, ‘yes, sometimes’, ‘no, not much’ or ‘no, not at all’) considering the last week. In this study, a cut-off score of 8 was used for identifying caseness, as a systematic review identified this as having specificity and sensitivity for depression (.79 and .83), and for anxiety (.78 and .90) (Bjelland, Dahl, Haug, & Neckelmann, Reference Bjelland, Dahl, Haug and Neckelmann2002).
Analyses
Descriptive demographic information is presented for the ARCOS-IV sample that did and did not consent for further assessment. Parametric and non-parametric tests used were appropriate to compare these groups to ensure that our sample could be considered representative.
Performance across measures at each time point is presented as means and standard deviations to allow examination of absolute levels of performance. Within subject-repeated measures, ANOVA examined significance of change in performance on each measure from 1 to 6 month and from 6 to 12 month follow-ups. The proportion of individuals falling within accepted clinical ranges (e.g., average and low-average) on each CNS-VS domain is also presented for each assessment alongside expected proportions from the normative sample.
Bivariate correlations (Pearson's or Spearman's, as appropriate) between neuropsychological test scores at 12 months (i.e., CNS-VS) and baseline characteristics linked to cognition in the literature (e.g., age, education and stroke severity) are presented. Regression analyses were performed to determine if the baseline demographic and stroke-related factors and concurrent mood were predictive of overall neuropsychological Neurocognitive Index at 6 and 12 months post stroke. For all analyses, cases with missing data were excluded list wise from the relevant analyses.
Results
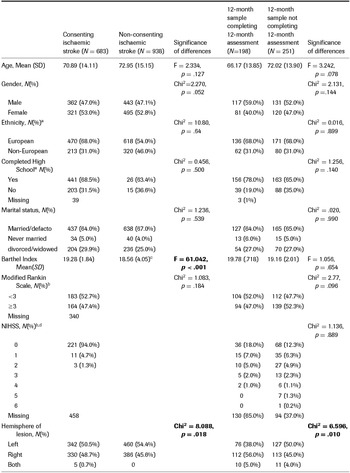
Table 1 presents descriptive information for all IS participants who consented to (n = 683) and declined (n = 938) follow-up assessments. The characteristics of those consenting individuals who completed 12 month assessment (n = 198) and those who did not (n = 251) are also presented. Those who consented did not differ from those who declined on age, gender, ethnicity or completion of high school (Table 1). Those who consented were less impaired (pre stroke BI), and less likely to have experienced left hemisphere stroke. It should be noted that differences in BI did not reach a level, where the difference could be perceived by patients as important and beyond measurement error (Hsieh et al., Reference Hsieh, Wang, Wu, Chen, Sheu and Hsieh2007). In contrast, consenting individuals who completed a 12 month assessment to those who did not complete the assessment, the only significant difference was for hemisphere of lesion, with a greater proportion of those not completing the assessment having a left hemisphere lesion.
Demographic and Stroke Characteristics of Consenting Versus Non-Consenting Ischaemic Stroke Patients and of Consenting Participants, Those Completing 12 Month Assessment Versus those not Completing

a Variables missing significant data for those not consenting (i.e., data not recorded in medical notes). bMeasures administered at baseline with consenting participants only. cFor non-consenting individuals only pre-morbid BI was available. dNIHSS was administered at bedside. A large amount of missing data is present due to participants being unwell to participate in the assessment within the first two weeks post stroke. NIHSS = National Institute of Health Stroke Scale.
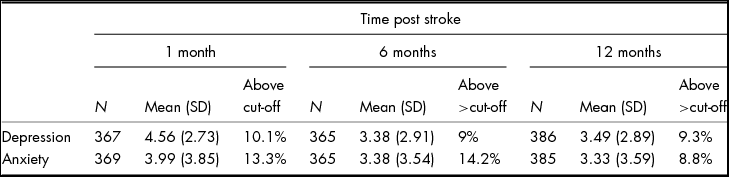
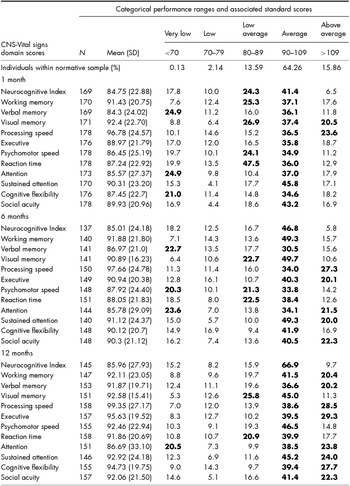
Table 2 presents means and standard deviations for anxiety and depression at each assessment and the proportion of individuals meeting cut-offs for clinical concern. Scores were highest at 1 month post stroke, and then remained relatively stable from 6 months onwards. There was a slight increase in the proportion of individuals with likely clinical anxiety at 6 months. Table 3 presents means and standard deviations across CNS-VS domains at each assessment. All mean scores fell within the low-average or average ranges at each assessment. The proportion of individuals whose performance fell within each qualitative categorical range is also presented.
Performance on the Hospital Anxiety Depression Scale Across Assessments
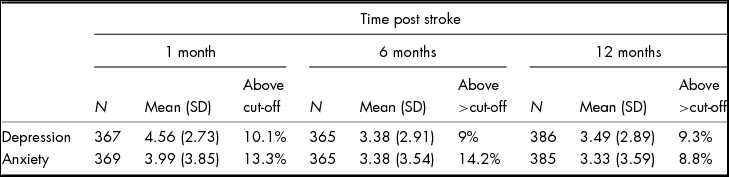
Note: Clinical significance was determined with a cut-off score of >8 for each scale.
Neuropsychological Performance (CNS-Vital signs) of Ischaemic Stroke Survivors as Mean and Standard Deviations and Percentage of Individuals within Categories at 1 Month, 6 Months and 12 Months Follow-Up

Bold typeface highlights cells with >20%. Note: Normative mean on each domain is 100 and standard deviation is 10. Higher scores indicate better performance.
Across all areas of each assessment, the greatest proportion of individuals scored was in average range. A large proportion of individuals produced low-average scores for visual memory, psychomotor speed and physical reaction time at 1 and 6 months post stroke, and for visual memory and reaction time at 12 months. Over 1/5 individuals performed very poorly for verbal memory and psychomotor speed at 6 months and near to this (19.7%) at 1 month and for attention at all three assessments. Within the normative population, these scores are obtained by only 0.13% and 2.14% of the population. Although the means and the greatest proportion of scores suggest relatively good cognitive outcomes, one in five individuals experienced difficulties with memory, speed and attention for at least 6 month post-IS.
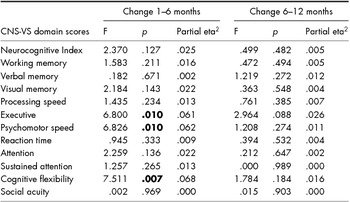
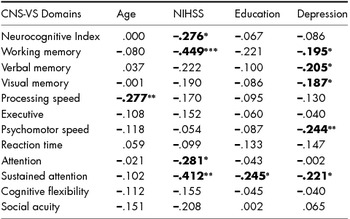
Table 4 presents within-subject change over time. Significant improvements were only seen from 1 to 6 months for executive functioning, psychomotor speed and cognitive flexibility. Bivariate correlations examining which baseline demographic and stroke characteristics were related to neuropsychological functioning at 12 month post stroke are presented in Table 5. Depression at 12 months was used as depression that impacts concurrent neuropsychological functioning (Elliot, Reference Elliot1998; Veiela, Reference Veiela1997).
Significance of Change in Neuropsychological Performance from 1 to 6 Months and 6 to 12 Months

Note: Partial eta-squared indicates percentage variance in the measure attributable to time.
Correlations Between Baseline Characteristics, Mood at 12 Months and Cognitive Performance 12 Months Post-Ischemic Stroke

NIHSS = National Institute of Health Stroke Scale.
*p < .05.
**p <.01.
***p < .001.
Gender and stroke severity (BI) had no significant relationship with any cognitive domains and are not included in the table. Severity of stroke (NIHSS) was significantly related to reduced attention, working memory, sustained attention and overall neurocognitive functioning. Increased age was related to slower speed of processing. Increased depression was significantly related to poorer sustained attention, working memory, verbal memory, visual memory and psychomotor speed. Few years of education were associated with poorer sustained attention.
Regression analyses were performed to determine if the baseline demographic and stroke-related factors as well as concurrent mood were predictive of neuropsychological outcomes at 6 and 12 months post stroke, indicated by CNS-VS Neurocognitive Index. Overall neuropsychological performance was significantly predicted at 6 and 12 months post stroke. At 6 months (adjusted R2 = .397, F[6, 24] = 2.634, p = .042) baseline NIHSS (Beta = –.426; p = .021) and BI (Beta = .372, p = .047) contributed significantly, while at 12 months post-IS (adjusted R2 = .441, F[6,26] = 3.028, p = .022), baseline NIHSS (Beta = .109; p = .009) and 12 months depression (Beta = –.440; p = .019) significantly contributed to prediction.
Discussion
This study presents the neuropsychological performance of a relatively large sample of IS survivors over the first year post stroke. A bi-modal distribution of neuropsychological scores was identified when the proportion of individuals performing within the qualitative categorical ranges was examined. The greatest proportion produced scores in the average range, whilst a large (>20%) proportion produced very low performances, particularly on verbal memory, psychomotor speed and attention. A significant proportion of individuals experienced cognitive difficulties 12 months post stroke, and would be overlooked if only mean scores were examined. This is particularly true of attention deficits that did not improve significantly over the 12 months follow-up. Persistence of attention deficits is not uncommon, with such deficits being reported up to 11 years post-IS even in young stroke samples (Schaapsmeerders et al., Reference Schaapsmeerders, Maaijwee, van Dijk, Rutten-Jacobs, Arntz, Schoonderwaldt and de Leeuw2013). It must also be acknowledged that a number of participants who consented did not complete the assessment at 12 months. As noted in Figure 1, this may have biased the sample towards those with lesser cognitive and sensory/physical disabilities. Thus, the present data are likely to reflect an underestimate of the issues.
Significant improvements were seen in executive functioning, psychomotor speed and cognitive flexibility within 6 months post-stroke. Notably, attention did not improve, with >20% of individuals remaining impaired 12 months post stroke. Impaired attention can reduce cognitive productivity (Lezak, Reference Lezak1995). Sustained attention 2 months post stroke predicts 2 year functional recovery (Robertson, Reference Robertson, Ridgeway, Greenfield and Parr1997), whilst distractibility/attention is associated with post stroke functional impairment (Stapleton, Ashburn, & Stack, Reference Stapleton, Ashburn and Stack2001), physical and social outcomes (McDowd, Reference McDowd, Filion, Pohl, Richards and Stiers2003) and functional impairment and falls in community-dwelling stroke survivors (Hyndman & Ashburn, Reference Hyndman and Ashburn2003). Effective remediation of attention deficits is supported by the literature (Barker-Collo et al., Reference Barker-Collo, Starkey, Lawes, Feigin, Senior and Parag2009).
The negative impact of cognitive deficits on functional outcome following stroke is well known (de Haan, Nys, & Van Zandvoort, Reference de Haan, Nys and Van Zandvoort2006). These impact wider outcomes as reintegration into premorbid vocational/social roles depends more on cognitive functioning than degree of motor or sensory deficit (Duncan, Lai, & Keighley, Reference Duncan, Lai and Keighley2000). It is important to identify those individuals who are most likely to suffer from ongoing cognitive deficits after stroke. In this study, gender had no significant relationship to cognitive domains assessed. Increased age was related to poorer processing speed, and concurrent depression was related to poorer sustained attention, memory and psychomotor speed. Poorer education was associated with reduced sustained attention. Stroke severity (NIHSS) was related to attention, working memory and overall cognition. Significant predictors of 6 months cognitive functioning were the BI and NIHSS, whereas NIHSS and concurrent depression were predictive at 12 months.
Older age is a predictor of worse cognitive and functional outcomes soon after stroke (Nys et al., Reference Nys, van Zandvoort, de Kort, Jansen, de Haan and Kappelle2007). In this study, age was linked to processing speed. As this score does not contribute to the Neurocognitive Index, it is unsurprising that it did not contribute to predicting cognitive outcomes. That concurrent depression is correlated to various cognitive domains and is predictive of cognition at 12 months, it is consistent with the literature linking depression to widespread deficits (Elliot, Reference Elliot1998). This relationship is of particular interest, given depression was primarily associated with domains, such as attention, that did not improve over time. Given that depression is common in survivors of stroke is potentially modifiable and has a multi-factorial aetiology, this relationship should be explored further.
Early prediction of future functioning is important for stroke management. The findings suggest that the NIHSS is a good predictor. The NIHSS has been linked to 6 month functional outcomes (e.g., ADLs) (Kwakkel et al., Reference Kwakkel, Veerbeek, van Wegen, Nijland, Harmeling-van der Wel and Dippel2010). NIHSS is a good predictor of late cognitive functioning, it is not surprising as it includes items reflective of cognition. In one study of 149 individuals (Cumming, Blomstrand, Bernhardt, & Linden, Reference Cumming, Blomstrand, Bernhardt and Linden2010), a score based on the four NIHSS cognitive items was almost as good as a cognitive screening tool Mini Mental State Examination (MMSE) in detecting severe cognitive impairment 18 months post stroke.
Strengths of this study include its large sample with repetition of measures over time and its ability to reflect upon a number of cognitive domains. The presentation of data as means and standard deviations alongside clinically applied ranges of performance is an additional strength that provides a fuller picture of post stroke cognition.
The greatest weaknesses of the study are a low response rate and lack of a control sample. Low response rate likely reflects the burden required of participants, and level of disability of the group from which participants were recruited. Ideally, a matched control sample would have undergone repeated assessments to define the size of any practice effects more precisely. Unfortunately, this was not feasible given the full ARCOS-IV study that included over 1800 individuals, and consenting participants were assessed four times each. Comparison of age-stratified normative data is used here to provide an indication of areas likely reflecting deficits. The sample did differ from those who did not consent, being less impaired at baseline (BI) and less likely to have experienced a left hemisphere stroke. This makes sense as those with greater disability are likely to view participation in research as a lesser priority and as more burdensome. Those with left hemisphere stroke are more likely to experience communication difficulties, making their ability to provide written informed consent less likely. Further, even if able to provide consent, individuals with communication impairments following left hemisphere lesion are also less likely to be able to complete neuropsychological assessment due to the nature of the tasks.
This suggests that the findings are not generalisable to individuals at greater risk of poor outcomes post stroke (i.e., more severe initial disability and likely to suffer from aphasia) and can therefore be considered an underestimation.
Conclusion
Many stroke survivors experience ongoing cognitive problems with 1/5 experiencing significant difficulties. Rehabilitation could accelerate and potentiate cognitive recovery during the timeframe of greatest spontaneous recovery (up to 6 months), particularly given the link to functional performance. For example, while attention was a common area of deficit that did not improve over time, the evidence suggests that this is amenable to rehabilitation. The NIHSS was identified as a potential predictor of long-term cognitive outcomes of stroke; however, clinicians must also be mindful of the impact of concurrent depression on cognitive assessment. Future studies of effective clinical and pharmacological interventions for post stroke depression could reduce its neurocognitive impact, and thereby improve quality of life.
Sources of Funding
This study was supported by the New Zealand Health Research Council.
Conflicts of Interest
There are no reported conflicts of interest.
Ethical Standards
The authors assert that all procedures contributing to this work comply with the ethical standards of the relevant national and institutional committees on human experimentation and with the Helsinki Declaration of 1975, as revised in 2008.