Implications
The milking process contributes substantially to the labour requirement in dairy farms. Therefore, improving cow milking efficiency can improve labour efficiency and subsequently herd profitability. However, improvements in milking efficiency must not compromise performance (e.g. milk yield or udder health). Breeding programmes are part of a herd strategy to improve performance, including milking efficiency. In this study, we define a novel trait to improve milking efficiency without compromising gains in milk yield or udder health.
Introduction
As herd size increases (Jago and Berry, Reference Jago and Berry2011), there is renewed interest in culling or selecting for faster throughput during milking, thereby reducing labour requirements; greater parlour throughput also improves energy efficiency and milking equipment depreciation. Therfore, milking speed has an economic value in breeding objectives (Boettcher et al., Reference Boettcher, Dekkers and Kolstad1998; Prints et al., Reference Prints, Groen and Saatkamp2002) and milking speed has been subjectively scored as part of breed society linear type classification programmes for many years (Boettcher et al., Reference Boettcher, Dekkers and Kolstad1998; Rupp and Boichard, Reference Rupp and Boichard1999; Sørensen et al., Reference Sørensen, Jensen and Christensen2000; Berry et al., Reference Berry, Buckley, Dillon, Evans and Veerkamp2004).
Genetic evaluations of milking speed differ by country and breed (http://www-interbull.slu.se); genomic evaluations are also under investigation (Gray et al., Reference Gray, Cassady, Huang and Maltecca2012). The Italian Brown Swiss population use a combination of milk meters and subjectively recorded milking speed by herd classifiers. Milking speed in German and Austrian Simmental and Brown Swiss cows is based on actual milking speed measured with a stop-watch. Milking speed phenotypes included in genetic evaluations in the Netherlands, Finland, France, Norway, Canada and the United States are all based on subjective assessment by the farmer although the scale used vary between populations.
Clear genetic variation in subjectively scored milking speed exists (Meyer and Burnside, Reference Meyer and Burnside1987; Boettcher et al., Reference Boettcher, Dekkers and Kolstad1998; Sørensen et al., Reference Sørensen, Jensen and Christensen2000; Berry et al., Reference Berry, Buckley, Dillon, Evans and Veerkamp2004; Sewalem et al., Reference Sewalem, Miglior and Kistemaker2011). However, (1) subjectively scored traits, by their nature, are likely to contain random noise which may contribute to a low heritability, thereby requiring larger progeny group sizes to achieve high accuracy of selection, (2) there is generally a cost associated with the collection of data on milking speed and (3) on average higher yielding cows milk for longer (Berry et al., Reference Berry, Coughlan, Enright and Burke2013), but have lower somatic cell count (Berry et al., Reference Berry, Coughlan, Enright and Burke2013), and therefore knowledge on the genetic variation in milking speed independent of both milk yield and somatic cell count is useful to quantify the expected responses to selection within a breeding objective that also includes both milk yield and udder health.
In this study, we quantify the genetic parameters of two novel milking characteristic traits representing milking duration independent of milk yield or independent of milk yield plus somatic cell count (Berry et al., Reference Berry, Coughlan, Enright and Burke2013); both traits were defined at a phenotypic and genetic level. Genetic and phenotypic associations with other milking characteristic and performance traits were also quantified. Results from this study will be useful in quantifying the expected responses to selection for reduced milking duration within a balanced breeding objective in dairy cattle.
Material and methods
Data
Milk flow data were available from the Irish Cattle Breeding Federation database on 235 036 part-day milking events from 74 607 cows in 1075 Irish dairy herds between September 2011 and July 2012. All records were between 5 and 305 days post-calving. All animals had two milk recording events per test-day (i.e. AM and PM), milk duration varied from 1 to 15 min, and total milk yield per milking (i.e. AM or PM milking) varied from 1 to 30 kg. Herd size varied from 40 to 250 cows. All herds used electronic do-it-yourself Tru-Test (Auckland, New Zealand) meters in herringbone milking parlours. The number of milking units per herd varied from 6 to 22.
Start of each individual cow milking and end of each individual cow milking was determined, for each milking session separately, by the decision rules implemented in the Tru-Test meter. Milk flow rates were recorded every 5 s. End of milking was determined when the average flow rate was <0.2 kg/min over a 10-s period. Average milk flow (AMF) was calculated per milking as the milk yield divided by milking duration. Maximum milk flow (MMF) was determined based on the flow rates recorded every 5 s, and the number of seconds to reach MMF rate (TIMEmax) was also retained. The time taken, within each milking, to reach 50% of the total milk yield for that milking was also determined (TIME50). Bimodality within a milking was assumed to exist if a clear drop in the milk flow pattern existed for at least 10 s (followed by resumption of milk flow) within the first 120 s of milking which is similar to the definition used by Dzidic et al. (Reference Dzidic, Macuhova and Bruckmaier2004).
Milk yield was recorded in both morning and evening milking but only one milk sample was taken for the quantification of milk composition, usually the evening sample; prediction equations to predict 24-h milk composition (Berry et al., Reference Berry, Burke, O'Keeffe and O'Connor2006) were not applied in the present study. The logarithm to the base 10 of somatic cell count was used to calculate somatic cell score (SCS) which was normally distributed. Data were also available from the Irish Cattle Breeding Federation database on the parity and breed proportion of each animal. Only Holstein-Friesian cows with a known sire were retained. Parities ≥5 were categorized as one group. Days post-calving at milk recording were divided into 10 classes: 5 to 30, 31 to 60, 61 to 90, 91 to 120, 121 to 150, 151 to 180, 181 to 210, 211 to 240, 241 to 270, 271 to 305 days in milk (DIM).
Linear type trait information was available on 151 077 first parity Holstein-Friesian cows scored between the years 1993 and 2012; all traits were scored on a scale of 1 to 9. Only the first record in time per cow scored between 5 and 330 days post-calving was retained and only cows with a known sire, and calving for the first time between 20 and 38 months of age were retained. All trait values, with the exception of temperament and ease of milking, were standardized to a common variance within field officer-by-year to account for differences in variance between field officers. For the type traits temperament and ease of milking only classification herd-dates with variation in these traits were retained for analysis. Contemporary group was formed as a two-way interaction between herd and date of classification and only contemporary groups with at least five records were retained. Days in milk was defined as a class variable with 11 levels, each 30 days in length, between 5 and 330 days post-calving. Age at inspection was defined as the age of the animal on the date of inspection, in months. Only the eight udder and teat type traits as well as milking speed and temperament were retained for inclusion in the analysis. Following edits, type trait information was available on 105 980 first parity records from 2323 herds.
A national campaign was undertaken in Ireland in 2011 for producers to record mastitis and cow temperament in Irish dairy herds. All Irish dairy herds were financially incentivized to record whether or not a cow had either one or two or more cases of mastitis during that lactation; the default was no case of mastitis. Date of the mastitis event was not recorded. Herd-owners were also asked to score each cow for temperament, on a scale of 1 (‘very good’) to 5 (‘very poor’). Herds retained had to have reported at least one incidence of mastitis and some variation in cow temperament. A total of 326 081 records from 5137 herds were available.
Pedigree information on all animals was available from the Irish Cattle Breeding Federation database. Pedigree was traced back to the founder generation and founders were assigned to pedigree groups based on country of origin and year of birth. The coefficient of heterosis and the coefficient of recombination loss were calculated for each animal as  $$${\rm{1}}\,{\rm{ - }}\,\mathop{\sum}\nolimits_{i\, = \,{\rm{1}}}^n {{{\rm{sire}}}_i \cdot{{\rm{dam}}}_i } $$$
and
 $$${\rm{1}}\,{\rm{ - }}\,\mathop{\sum}\nolimits_{i\, = \,{\rm{1}}}^n {\frac{{{{\rm{sire}}}_i^{\rm{2}} \, + \,{{\rm{dam}}}_i^{\rm{2}} }}{{\rm{2}}}} $$$
, respectively, where sirei and dami are the proportion of breed i in the sire and dam, respectively. Heterosis was divided into 12 classes (0%, 10 classes of 10% from 0% to 100%, exclusive and 100%). Recombination loss was segregated into seven classes (0%, five classes of 10% from 0% to 50%, exclusive and 50%).
Following merging of the different data sources, data from a random sample of herds were retained for use in variance component estimation. All herds that had information on milking characteristics, mastitis or temperament and linear type traits were retained; 30% of the remaining herds were randomly sampled to facilitate computation. A total of 192 824 records from 123 404 cows in 1423 herds remained for inclusion in the analysis.
Estimation of (co)variance components
Milking duration (seconds) was normally distributed and was regressed on milk yield using a simple least squares linear regression (PROC GLM; SAS Institute, 2011) described by Berry et al. (Reference Berry, Coughlan, Enright and Burke2013). The residuals from this linear regression was termed phenotypic residual milking duration (pRMD). Milking duration (seconds) was also linearly regressed on both milk yield and SCS using least squares multiple regression; the residuals from this model was termed phenotypic residual milking duration including SCS (pRMDS).
Variance components for each of the milking characteristic traits (i.e. milk yield, milking duration, flow rates, bimodality, pRMD and pRMDS) were estimated using repeatability animal linear mixed models in ASREML (Gilmour et al., Reference Gilmour, Gogel, Cullis and Thompson2009). The fixed effects included in the model for the milking characteristic traits were as outlined by Berry et al. (Reference Berry, Coughlan, Enright and Burke2013), with the exception of animal breed and milking order which is known to be heritable (Berry and McCarthy, Reference Berry and McCarthy2012); also month of test was not included in the model as it was confounded by herd herd test-date which was included in the model in the present study.
The model fitted to the milkability traits therefore was:
 $${{\rm{Y}}\, = \,{\rm{HTD}}\, + \,{\rm{Parity}}\, + \,{\rm{Stage}}\, + \,{\rm{Het}}\, + \,{\rm{Rec}}\, + \,{\rm{Session}}\cr\quad + \,{\rm{interaction}}\, + \,{\rm{a}}\, + \,{\rm{pe\_within}}\, + \,{\rm{pe\_across}}\, + \,{\rm{e}}$$
where Y is the milkability trait under investigation (i.e., milk yield, milking duration, flow rates, bimodality, pRMD and pRMDS), the fixed effects of HTD is a two-way interaction between herd and test date, Parity is parity of animal (1, 2, 3, 4, 5+), Stage is stage of lactation (5 to 30, 31 to 60, 61 to 90, 91 to 120, 121 to 150, 151 to 180, 181 to 210, 211 to 240, 241 to 270, 271 to 305 DIM), Het is heterosis coefficient, Rec is recombination loss coefficient, Session is milking session (AM or PM) and interaction includes the two- and three-way interactions between parity, stage of lactation and milking session. The random effects included in the model were a direct additive genetic effect for animal (a;  $$${\rm{N(0,A\sigma }}_{{\rm{a}}}^{{\rm{2}}} {\rm{)}}$$$
), a permanent environmental effect within lactation (pe_within;
 $$${\rm{N(0,}}{\bf {{I}}}{\rm{\sigma }}_{{{\rm{p\_within}}}}^{{\rm{2}}} {\rm{)}}$$$
) and a permanent environmental effect across lactations (pe_across;
 $$${\rm{N(0,}}{\bf {{I}}}{\rm{\sigma }}_{{{\rm{p\_across}}}}^{{\rm{2}}} {\rm{)}}$$$
) as well as a random residual term (e;
 $$${\rm{N(0,}}{\bf {{I}}}{\rm{\sigma }}_{{\rm{e}}}^{{\rm{2}}} {\rm{)}}$$$
).
Fixed effects included in the animal linear mixed model for the linear type traits were contemporary group of herd-visit, a class effect of month of scoring, a quadratic effect for both age at first calving (in months) and stage of lactation at scoring (categorized in increments of 30 days from 5 to 330) as well as linear effects for both heterosis and recombination loss. Fixed effects included in the model for the analysis of mastitis and farmer scored temperament was herd-year-season of calving, parity and both heterosis and recombination loss coefficients.
Genetic and residual covariances between traits were estimated in ASREML (Gilmour et al., Reference Gilmour, Gogel, Cullis and Thompson2009) using a series of bivariate sire linear mixed models. Because no repeated records existed for the linear type traits, mastitis or the farmer scored temperament, no permanent environmental variance or covariance with the milking characteristic traits were fitted for these traits.
Residual traits defined at the genetic level
Following the estimation of the variance components for milk yield, SCS and milking duration, residual milking duration was also defined at the genetic level (gRMD) as milking duration genetically independent of milk yield; genetic residual milking duration including SCS (gRMDS) was also defined at the genetic level as milking duration genetically independent of both milk yield and SCS. The necessary genetic regression coefficients (b) on milk yield and SCC were calculated as
 $${\bf {{b}}}\, = \,{\bf {{G}}}'{{{\bf {{P}}}}^{ - {\rm{1}}}} $$
where G is the vector of the genetic covariance between the regressor(s) and milking duration and P is the genetic covariance matrix between the regressor trait(s).
The genetic variance of gRMDS was calculated as:
 $${\sigma _{g}^{{\rm{2}}} \, = \,{{\left[ {<!\begin{array}{*{20}c}>\matrix{ {\rm{1}} \\ { - Cov(MD,MILK)\,/\,\sigma _{{{\rm{MILK}}}}^{{\rm{2}}} } \\ { - Cov(MD,SCS)\,/\,\sigma _{{{\rm{SCS}}}}^{2} } \\\end{array}}} \right]}^^{\prime}} \cr\quad\ \ \left[ {<!\begin{array}{*{20}c}>\matrix{ {\sigma _{{{\rm{MD}}}}^{{\rm{2}}} } &#x0026; \ldots &#x0026; \ldots \\ {Cov(MD,MILK)} &#x0026; {\sigma _{{{\rm{MILK}}}}^{{\rm{2}}} } &#x0026; \ldots \\ {Cov(MD,SCS)} &#x0026; {Cov(MILK,SCS)} &#x0026; {\sigma _{{{\rm{SCS}}}}^{{\rm{2}}} } \\\end{array}}} \right] \cr\ \ \quad\left[ {<!\begin{array}{*{20}c}>\matrix{ {\rm{1}} \\ { - Cov(MD,MILK)\,/\,\sigma _{{{\rm{MILK}}}}^{{\rm{2}}} } \\ { - Cov(MD,SCS)\,/\,\sigma _{{{\rm{SCS}}}}^{{\rm{2}}} } \\\end{array}}} \right]$$
where (co)variance components refer to the additive genetic (co)variance components estimated in this study and MD refers to milking duration. The phenotypic variance for gRMDS was calculated using the same approach but substituting phenotypic (co)variance components for the genetic (co)variance components. Heritability of gRMD and gRMDS was calculated based on the derived genetic and phenotypic variances.
The genetic covariance between gRMDs and other performance traits (other) was estimated as:
 $${{\rm{cov}}\,{\rm{(gRMDS,}}\,{\rm{other)}}\, = \,{\rm{cov}}\,{\rm{(MD,}}\,{\rm{other)}} - \,{{{\rm{b}}}_{\rm{1}}}\,{\rm{cov}}\,{\rm{(MILK,}}\,{\rm{other)}}\cr\qquad - \,{{{\rm{b}}}_{\rm{2}}}\,{\rm{cov}}\,{\rm{(SCS,}}\,{\rm{other)}}$$
where b1 and b2 are the genetic regression coefficients defined previously and MD is milking duration. The genetic covariance between gRMD and other performance traits was defined using a similar approach without the last term and using the linear regression coefficient of milking duration on milk yield when only milk yield was included in the genetic regression.
Results
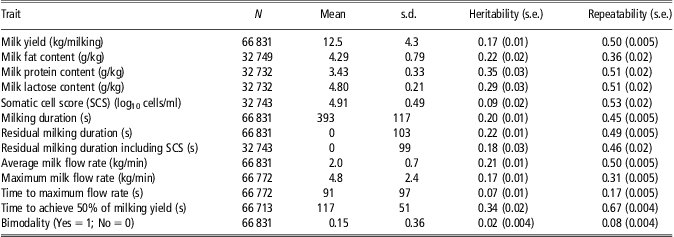
Mean Holstein and Friesian proportion of the cows in the study was 70% and 28%, respectively. Mean heterosis and recombination loss coefficients in the sample population was 0.10 and 0.04, respectively. Summary statistics, including heritability and repeatability estimates, for the milking characteristic traits are detailed in Table 1. Each milking was, on average, 393 s (i.e. 6.55 min) although considerable variation (standard deviation of 116.8 s) existed. Mean pRMD and pRMDS was, as expected zero, while the standard deviation of pRMD and pRMDS was 102.8 to 98.9 s.
Number of records (N), mean, raw phenotypic standard deviation, heritability and repeatability of the milking characteristic traits

The heritability of milk yield and milk composition varied from 0.17 to 0.35 (Table 1); the repeatability varied from 0.36 to 0.51. The heritability of milking duration, pRMD and pRMDS varied from 0.18 and 0.22, whereas the repeatability varied from 0.45 to 0.49 (Table 1). The heritability of gRMD and gRMDS was 0.21 and 0.18, respectively. The genetic standard deviation of pRMD and pRMDS was 41.8 and 36.8 s, respectively; corresponding genetic standard deviations for gRMD and gRMDS were 40.6 and 37.6 s, respectively. The heritability of mastitis, estimated from the 8004 positive mastitis records (i.e. prevalence of 11.2%), was 0.03 (0.01). The heritability of farmer scored temperament was 0.13 (0.01). The heritability of the udder type traits evaluated varied from 0.12 (udder support) to 0.37 (teat length). The heritability of milking speed and temperament scored as part of the Holstein–Friesian national type classification programme were both 0.04 (0.01).
Correlations among milking characteristic traits
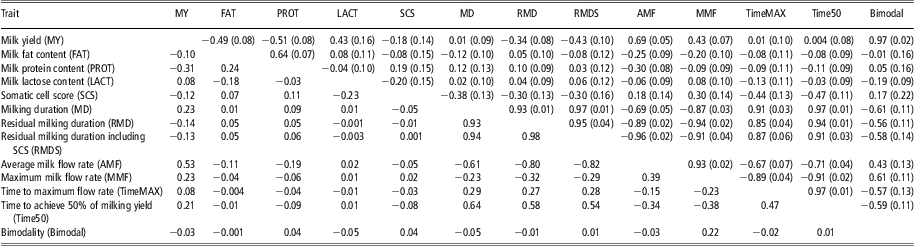
The phenotypic (after adjustment for fixed and random effects in the model) and genetic correlations among the milking characteristic traits are in Table 2. Milking duration was not genetically correlated with milk yield (r = 0.01) but was genetically correlated (r = −0.38) with SCS. However, both pRMD and pRMDS were both negatively genetically correlated with both milk yield and SCS. The phenotypic correlations between both pRMD and pRMDS with milk yield were also different from zero because of the adjustment of both traits for fixed and random effects in the statistical model. When milk yield was included as a covariate in the statistical model of milking duration, the genetic correlation between milking duration and both milk yield and SCS was 0.01 (0.09) and −0.32 (0.13), respectively. Both gRMD and gRMDS were (by definition) both uncorrelated with milk yield and gRMDS was also uncorrelated with SCS indicating the difference between phenotypic and genetic regression to generate genetically independent traits. Milk yield was positively genetically correlated with greater AMF and MMF as were the genetic correlations between SCS and both AMF and MMF.
Genetic (above diagonal; standard errors in parenthesis) and phenotypic (below diagonal) correlationsFootnote 1 between the milking characteristic traits. Standard errors of the correlations are in parenthesis
1 Standard errors of phenotypic correlations were all ≤0.01.
Correlations with udder-related linear type traits
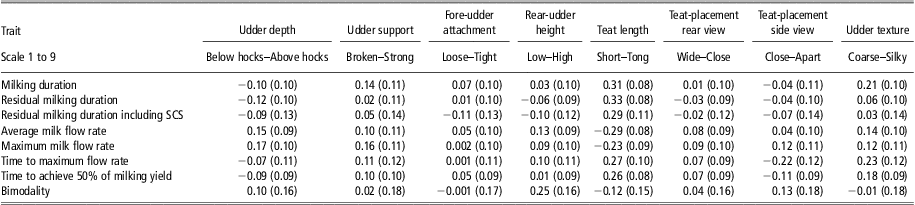
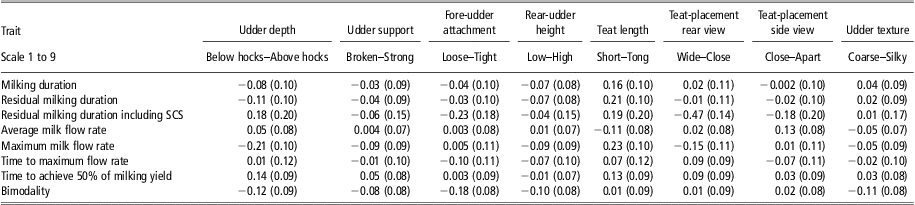
The genetic and phenotypic correlations between the milking characteristic traits and udder-related type traits are summarized in Tables 3 and 4, respectively. The absolute genetic correlations between all type traits, with the exception of teat length, and all milking characteristic traits were all ≤0.23 and not different from zero. The genetic correlations between teat length and the milking characteristic traits varied from −0.29 (AMF) to 0.33 (RMD). Long teats were associated with longer milking duration, pRMD and pRMDS as well as reduced AMF and MMF. Phenotypic correlations between teat length and the milking characteristic traits were, in general, also the strongest and were generally similar in sign to the respective genetic correlations.
Genetic correlations (standard errors in parenthesis) between the milking characteristic traits and linear type traits
SCS = somatic cell score.
Phenotypic correlations (standard errors in parenthesis) between the milking characteristic traits and linear type traits
SCS = somatic cell score.
Correlations with mastitis, milking speed and temperament
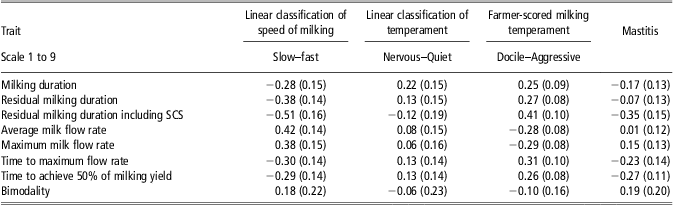
Genetic correlations between the milking characteristic traits and subjectively scored milking speed and temperament as part of the Holstein–Friesian linear type classification programme and also farmer scored incidence of mastitis and farmer scored temperament are outlined in Table 5. Genetic correlations with subjectively scored milking speed for milking duration, RMD and RMDS varied from −0.51 to −0.28; a higher phenotypic score for subjectively scored milking speed implies faster milking animals. Cows subjectively scored as being faster milkers had genetically greater milk flow rates. Genetic correlations between the milking characteristic traits and the linear scored temperament were not more than two standard errors from zero but milking duration, pRMD and pRMDS were positively (0.25 to 0.41) genetically correlated with farmer scored temperament implying that slower milking animals had poorer temperament. The genetic correlation between mastitis and milking duration, pRMD and pRMDS varied from −0.35 to −0.17. However, the genetic correlation between gRMD and gRMDS with mastitis was −0.17 and 0.14, respectively. Therefore, including genetic merit for SCS in the genetic regression for deriving gRMDS negated the unfavourable consequences of selection in genetic merit for mastitis from selection on pRMDS. Nonetheless, in a supplementary analysis, genetic merit for mastitis was also included in the development of a new trait by genetically regressing milking duration on milk yield, SCS and mastitis. The genetic correlation between SCS and mastitis was 0.80 (0.10) and the genetic correlation between milk yield and mastitis was −0.21 (0.12). The heritability of gRMDS also independent of mastitis was 0.19 and the genetic standard deviation was 39.2 s.
Genetic correlations (standard errors in parenthesis) between milking characteristic traits and linear classification for speed of milking and temperament as well as farmer scored mastitis and temperament
SCS = somatic cell score.
Discussion
Berry et al. (Reference Berry, Coughlan, Enright and Burke2013) previously defined two novel milking characteristic traits, RMD and RMDS, which were phenotypically independent of milk yield and milk yield plus SCS, respectively. The objective of this study was to estimate genetic parameters for these traits as well as defining these traits using genetic, rather than phenotypic regression thereby ensuring genetic independence with the regressor traits. Results clearly show the existence of heritable genetic variation in milking duration independent (either phenotypically or genetically) of milk yield (and SCS).
Variance components
Milking speed can be measured using subjective assessment (generally undertaken by the producer) or objective measurements using electronic recorders. Heritability estimates for subjectively scored milking speed vary from 0.12 to 0.35 (Meyer and Burnside, Reference Meyer and Burnside1987; Boettcher et al., Reference Boettcher, Dekkers and Kolstad1998; Sørensen et al., Reference Sørensen, Jensen and Christensen2000; Berry et al., Reference Berry, Buckley, Dillon, Evans and Veerkamp2004; Wiggans et al., Reference Wiggans, Thornton, Neitzel and Gengler2007; Sewalem et al., Reference Sewalem, Miglior and Kistemaker2011). Previous heritability estimates for electronically recorded milking duration vary from 0.11 to 0.30 (Zwald et al., Reference Zwald, Weigel, Chang, Welper and Clay2005; Gray et al., Reference Gray, Vacirca, Bagnato, Samoré, Rossoni and Maltecca2011; Samoré et al., Reference Samoré, Román-Ponce, Vacirca, Frigo, Canavesi, Bagnato and Maltecca2011). Repeatability of milking speed across a range of different dairy cattle breeds has been reported to vary between 0.37 and 0.51 (Meyer and Burnside, Reference Meyer and Burnside1987; Wiggans et al., Reference Wiggans, Thornton, Neitzel and Gengler2007; Gray et al., Reference Gray, Vacirca, Bagnato, Samoré, Rossoni and Maltecca2011) consistent with the estimate of 0.45 in the present study. Interestingly, there appears to be little difference internationally in the heritability of milking speed irrespective of whether recorded subjectively or objectively although the estimates are confounded with population. This is, nonetheless, in contrast to expectations where a greater accuracy of recording with electronic meters through (a) a more objective and reproducible measurement, and (b) a greater number of incremental values achievable, would be expected to result in less residual variation and therefore greater heritability. The heritability of subjectively scored milking speed in the present study (0.04) was nonetheless considerably lower than other international estimates and reflects a large contribution of residual variation to the phenotypic variation of milking speed, and therefore possibly reflects inaccuracies in assessment. This hypothesis was substantiated by the lack of a strong genetic correlation between subjectively scored milking speed and electronically recorded milking duration in the present study.
Although heritability estimates of milk flow traits are lacking in the literature, the heritability estimates of AMF and MMF in the present study of 0.17 to 0.21 are slightly lower than the heritability estimates of 0.27 to 0.41 reported in other international dairy cow populations (Gray et al., Reference Gray, Vacirca, Bagnato, Samoré, Rossoni and Maltecca2011; Samoré et al., Reference Samoré, Román-Ponce, Vacirca, Frigo, Canavesi, Bagnato and Maltecca2011).
No previous study has reported heritability estimates for RMD or RMDS. However using the phenotypic and genetic (co)variance matrix between milking duration, milk yield and SCS supplied by Gray et al. (Reference Gray, Vacirca, Bagnato, Samoré, Rossoni and Maltecca2011) and Samoré et al. (Reference Samoré, Román-Ponce, Vacirca, Frigo, Canavesi, Bagnato and Maltecca2011) in Italian Brown Swiss and Holstein–Friesian populations, respectively, we calculated the heritability of RMD in both populations to be 0.11 and 0.30, respectively. The respective heritability estimates for RMDS was also 0.11 and 0.30; a phenotypic standard deviation for SCS of 2 was assumed for the Gray et al. (Reference Gray, Vacirca, Bagnato, Samoré, Rossoni and Maltecca2011) study population in line with that reported by Samoré et al. (Reference Samoré, Román-Ponce, Vacirca, Frigo, Canavesi, Bagnato and Maltecca2011). The heritability estimates of 0.22 and 0.18 reported in the present study for RMD and RMDS lie between these estimates. More importantly, however, is the large genetic variation in both RMD and RMDS in the present study (36.8 to 41.8 s); the calculated genetic standard deviation for RMD in both Italian populations (Gray et al., Reference Gray, Vacirca, Bagnato, Samoré, Rossoni and Maltecca2011; Samoré et al., Reference Samoré, Román-Ponce, Vacirca, Frigo, Canavesi, Bagnato and Maltecca2011) varied from 54 to 73 s while the calculated genetic standard deviation for RMDS varied from 54 to 72 s. Because electronically recorded milking duration is available routinely on a large population of animals in Ireland and many other countries, the accuracy of prediction of estimated breeding values for RMD or RMDS (or similarly defined traits) will be high and therefore the large genetic variation present will be exploitable in a breeding programme. Using a simple example, assuming a farm with a herringbone milking parlour with 10 rows of cows milked per milking, a change in mean cow milking time of one genetic standard deviation of 36.8 s (i.e. genetic standard deviation of RMDS in the present study) could reduce the time spent milking by 62 h over 305 days when cows are milked twice daily. This can be achievable without any deterioration in milk yield or SCC.
Covariance components
The lack of a genetic correlation between milking duration and milk yield (0.01) in the present study is surprising, especially since a positive phenotypic correlation (0.23) existed. The lack of a genetic correlation is not because of selection bias in the present study since no genetic correlation between milk duration and milk yield existed in first parity animals only (r = 0.06; s.e. = 0.15). The phenotypic correlation estimated in this study however between both traits is weaker than the phenotypic correlation of 0.48 reported by Berry et al. (Reference Berry, Coughlan, Enright and Burke2013) in a similar population but the latter estimate is a raw phenotypic correlation while the correlation in the present study has been adjusted for fixed and random effects. Nonetheless, the zero genetic correlation corroborates the lack of a correlation between estimated breeding values for milk yield and subjectively scored milking duration in Canadian (Sewalem et al., Reference Sewalem, Miglior and Kistemaker2011) and US (Zwald et al., Reference Zwald, Weigel, Chang, Welper and Clay2005) Holsteins. In direct contrast, however, positive genetic correlations (0.35 to 0.37) existed between test-day milk yield and milking duration in Italian Holstein–Friesian and Brown Swiss (Gray et al., Reference Gray, Vacirca, Bagnato, Samoré, Rossoni and Maltecca2011; Samoré et al., Reference Samoré, Román-Ponce, Vacirca, Frigo, Canavesi, Bagnato and Maltecca2011). The lack of a genetic correlation in the present study suggests that selection alone for shorter milking duration will not impact milk yield, thereby negating the usefulness of adjustment of milking duration for milk yield. In fact, phenotypic adjustment of milking duration for differences in milk yield (i.e. RMD) actually resulted in a negative genetic correlation with milk yield. Nonetheless, the genetic correlation between milking duration and SCS of −0.38 suggests that selection for animals with shorter milking duration will result in, on average, animals with higher SCS. Moreover, simply phenotypically adjusting milking duration for milk yield and SCS did not result in a zero genetic correlation, clearly indicating the requirement for adjustment of milking duration for SCS using genetic regression.
Genetic correlations suggesting increased SCS in animals selected to be faster milking or selected to have shorter milking duration has been reported in many studies (Boettcher et al., Reference Boettcher, Dekkers and Kolstad1998; Rupp and Boichard, Reference Rupp and Boichard1999; Zwald et al., Reference Zwald, Weigel, Chang, Welper and Clay2005; Sewalem et al., Reference Sewalem, Miglior and Kistemaker2011). Fewer studies have quantified the genetic correlation between milking speed or milking duration and mastitis. Zwald et al. (Reference Zwald, Weigel, Chang, Welper and Clay2005) estimated a correlation between sire estimated breeding values for subjectively scored milking speed and mastitis of −0.09 but that estimate was not different from zero. Boettcher et al. (Reference Boettcher, Dekkers and Kolstad1998) documented genetic correlations of 0.25 to 0.43 between subjectively scored milking speed and clinical mastitis, whereas Rupp and Boichard (Reference Rupp and Boichard1999) reported a near zero genetic correlation between subjectively scored milking speed and clinical mastitis (0.06; s.e. = 0.09). Therefore, to minimize or alleviate any impact on udder health of selection for faster milking animals or culling of slower milking animals, gRMDS should be used rather than milking duration otherwise udder health should be appropriately included in the breeding objective or culling decisions to counteract any unfavourable responses to selection or culling on milking duration.
Several studies have estimated genetic correlations between milking characteristic traits and udder and teat morphological traits using either covariance component estimation procedures on phenotypic data (Boettcher et al., Reference Boettcher, Dekkers and Kolstad1998; Sørensen et al., Reference Sørensen, Jensen and Christensen2000; Samoré et al., Reference Samoré, Román-Ponce, Vacirca, Frigo, Canavesi, Bagnato and Maltecca2011) or correlation of bull estimated breeding values (Zwald et al., Reference Zwald, Weigel, Chang, Welper and Clay2005; Wiggans et al., Reference Wiggans, Thornton, Neitzel and Gengler2007). Many of the estimated correlations across studies between milking duration and the udder-related type traits were not different from zero with the exception of longer milking duration being associated with longer teats (present study; Zwald et al., Reference Zwald, Weigel, Chang, Welper and Clay2005; Wiggans et al., Reference Wiggans, Thornton, Neitzel and Gengler2007; Sewalem et al., Reference Sewalem, Miglior and Kistemaker2011) although subjectively scored faster milking speed has also been documented to be associated with longer teats (Boettcher et al., Reference Boettcher, Dekkers and Kolstad1998; Sørensen et al., Reference Sørensen, Jensen and Christensen2000).
Estimates of the genetic correlations between milking speed and milking temperament are lacking in the literature. Sewalem et al. (Reference Sewalem, Miglior and Kistemaker2011) suggested that their estimated genetic correlation between milking temperament and milking speed of 0.25 was the first international estimate; in their study both milking speed and milking temperament were subjectively assessed. The correlation of Sewalem et al. (Reference Sewalem, Miglior and Kistemaker2011) is similar to the estimate of 0.27 documented previously by Berry et al. (Reference Berry, Buckley, Dillon, Evans and Veerkamp2004) between subjectively scored milking speed and general temperament in Irish Holstein–Friesian primiparous dairy cows. Both previous international estimates are very similar to the genetic correlation of 0.22 to 0.25 estimated in the present study between electronically recorded milking duration and temperament (both general and milking temperament). The consistency of the genetic correlation with farmer scored temperament irrespective of whether or not milking duration was phenotypically adjusted for milk yield or milk yield plus SCS suggest that slower milking animals are less docile.
Conclusions
Exploitable genetic variation clearly exists in milking duration following correction for genetic merit for milk yield and SCS. Because milking speed is available on Irish milk recorded cows using do-it-yourself milk recording (Berry et al., Reference Berry, Burke, O'Keeffe and O'Connor2006), phenotypic information on which to undertake routine genetic evaluations for milking speed is feasible. The advantage of using such a residual trait rather than a flow rate trait is that the latter is a ratio trait and expected responses to selection can be difficult to ascertain (Gunsett, Reference Gunsett1984) because of the poor statistical properties of ratio traits. Milking speed has an economic value (Boettcher et al., Reference Boettcher, Dekkers and Kolstad1998; Prints et al., Reference Prints, Groen and Saatkamp2002), and therefore breeding for milking speed within a balanced breeding programme is feasible and advisable to reduce the cost of production. The advantage of using RMD is that genetic selection or independent culling levels can be applied on this trait with, on average, no impact on genetic gain for milk yield.