INTRODUCTION
In the middle of the 20th century, the estuary of the River Thames was heavily polluted with severe ecotoxicological effects on the fauna and flora (Wheeler, Reference Wheeler1979; Andrews, Reference Andrews, Sheehan, Miller, Butler and Bourdeau1984). The forms of pollution were manifold, and included high concentrations of suspended solids originating from sewage, leading to high biological oxygen demand (BOD), reduced dissolved oxygen levels and high total ammonia concentrations (Andrews, Reference Andrews, Sheehan, Miller, Butler and Bourdeau1984; Power et al., Reference Power, Attrill and Thomas1999). Additionally industrial and domestic effluents contributed very high concentrations of toxic metals, of organic contaminants such as organochlorines and PCBs, and of synthetic detergents into the estuary (Andrews, Reference Andrews, Sheehan, Miller, Butler and Bourdeau1984). Fortunately, between 1960 and the late 1970s, the water quality of the Thames estuary was greatly improved as a result of the completion or extension of major sewage treatment plants discharging into the estuary (e.g. at Beckton and Crossness), and greater control of industrial effluents (Andrews, Reference Andrews, Sheehan, Miller, Butler and Bourdeau1984; Power et al., Reference Power, Attrill and Thomas1999). By 1980, the Thames estuary had changed from an ‘open sewer’ to a waterway allowing the free passage of salmon (Wheeler, Reference Wheeler1979; Andrews, Reference Andrews, Sheehan, Miller, Butler and Bourdeau1984).
The clean-up of the Thames estuary did not stop in the early 1980s. For example, dissolved concentrations of cadmium, copper, mercury, nickel and zinc showed further exponential declines between 1980 and 1997 (Power et al., Reference Power, Attrill and Thomas1999). Dissolved lead concentrations also showed a decline over the initial years of this period, but this decline was reversed in the early 1990s by the onset of drought and by the then continuing effect of the use of leaded petrol by Londoners before its eventual phase out (Power et al., Reference Power, Attrill and Thomas1999).
This study is concerned with the status of trace metals in the Thames estuary in the second decade of the 21st century, particularly examining whether or not toxic metal bioavailabilities have continued to fall over time since the late 1990s, and whether or not these metal bioavailabilities can still be considered to be high and of potential ecotoxicological significance.
The study by Power et al. (Reference Power, Attrill and Thomas1999) reported on changes in dissolved metal concentrations in the Thames estuary over time. An alternative method of assessing metal contamination, or more specifically the bioavailabilities of trace metals to local biota, is to use biomonitors. Biomonitors must be net accumulators of contaminants (in this case trace metals) in proportion to the total ambient bioavailability of the contaminant, and the resulting bioaccumulated concentrations represent relative measures of the local bioavailabilities of the trace metals at a site to that particular biomonitor, integrated over a preceding time period (Bryan et al., Reference Bryan, Langston and Hummerstone1980, Reference Bryan, Langston, Hummerstone and Burt1985; Luoma & Rainbow, Reference Luoma and Rainbow2008). The use of biomonitors has advantages over the measurement of trace metal concentrations in local water or sediment, because the measured bioaccumulated concentrations concern only the bioavailable fraction of the local metal, the specific fraction that has the potential to be of ecotoxicological significance (Bryan et al., Reference Bryan, Langston and Hummerstone1980, Reference Bryan, Langston, Hummerstone and Burt1985; Luoma & Rainbow, Reference Luoma and Rainbow2008). The use of trace metal biomonitors is now routine in the comparative assessment of potential toxic metal bioavailabilities, whether between locations at any one time or between sampling occasions at the same site. Given that the accumulated metal concentrations in a biomonitor strictly represent the integrated total bioavailability of a metal to that biomonitor at a site, it is preferable to use a suite of biomonitors to reflect different possible sources of bioavailable metals to the local biota (Bryan et al., Reference Bryan, Langston and Hummerstone1980, Reference Bryan, Langston, Hummerstone and Burt1985; Bryan & Gibbs, Reference Bryan and Gibbs1983; Rainbow et al., Reference Rainbow, Smith and Lau2002, Reference Rainbow, Kriefman, Smith and Luoma2011; Luoma & Rainbow, Reference Luoma and Rainbow2008).
In the context of this study, biomonitoring data are available for trace metals in the estuary of the Thames. McEvoy et al. (Reference McEvoy, Langston, Burt and Pope2000) and Langston et al. (Reference Langston, Pope, Chesman and Burt2004) measured the bioaccumulated trace metal concentrations in suites of biomonitors along the Thames estuary in 1997 and 2001 respectively. McEvoy et al. (Reference McEvoy, Langston, Burt and Pope2000) confirmed that bioaccumulated concentrations of most trace metals analysed had fallen between 1980 and 1997, in agreement with the dissolved metal data of Power et al. (Reference Power, Attrill and Thomas1999). Comparisons of bioaccumulated concentrations between 1999 and 2001 data were more equivocal, to be expected given the short time period concerned (Langston et al., Reference Langston, Pope, Chesman and Burt2004).
Of particular relevance here is the biomonitoring study of the Thames estuary carried out in 2001 by Rainbow et al. (Reference Rainbow, Smith and Lau2002). These authors used a suite of three littoral biomonitors – the brown seaweed Fucus vesiculosus (bladder wrack), the talitrid amphipod Orchestia gammarellus and the estuarine barnacle Amphibalanus improvisus. Accumulated metal concentrations in the seaweed reflect dissolved trace metal bioavailabilities (Bryan et al., Reference Bryan, Langston and Hummerstone1980). Orchestia gammarellus feeds on cast up seaweed in the strandline, a trophic source of trace metals that, to a degree, indirectly reflects local dissolved metal bioavailabilities (Weeks & Rainbow, Reference Weeks and Rainbow1993). The barnacle takes up metals from solution and from suspended material in the water column, including re-suspended sediment, their bioaccumulated metal concentrations reflecting metal bioavailabilities from these sources (Luoma & Rainbow, Reference Luoma and Rainbow2008). Some invertebrates (for example decapod crustaceans) are able to regulate body concentrations of essential trace metals such as zinc to approximately constant levels under different bioavailable zinc exposures, and are, therefore, unsuitable as biomonitors of these metals (Luoma & Rainbow, Reference Luoma and Rainbow2008). Neither amphipods nor barnacles are regulators of body concentrations of essential metals, and are, therefore, suitable for use as biomonitors (Luoma & Rainbow, Reference Luoma and Rainbow2008).
The present study repeated the 2001 biomonitoring survey of Rainbow et al. (Reference Rainbow, Smith and Lau2002) in order to address directly the question whether toxic metal bioavailabilities in the Thames estuary have continued to fall over time since the turn of the century. The study employed the same biomonitors from essentially the same locations, and was carried out at the same time of the year to avoid any seasonal effects. As in the 2001 study, the data collected (a more extensive data set involving additional metals) will also serve as a new baseline for future studies of the ongoing remediation of this significant estuary.
MATERIALS AND METHODS
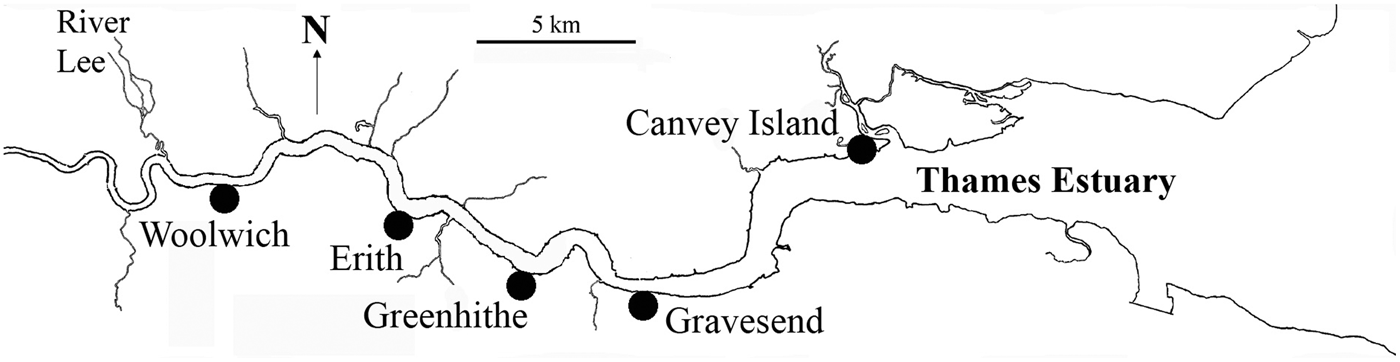
Three littoral species Fucus vesiculosus, Orchestia gammarellus and Amphibalanus improvisus were collected at low tide from up to five sites along the Thames estuary on 16 and 17 July 2014: Woolwich (51°29.684′ N 0°2.186′ E), Erith (O. gammarellus and F. vesiculosus at 51°28.767′ N 0°11.600′ E and A. improvisus at 51°28.927′ N 0°10.855′ E), Greenhithe (51°27.222′ N 0°17.063′ E), Gravesend (51°26.659′ N 0°22.260′ E) and Canvey Island (51°30.810′ N 0°35.232′ E) (Figure 1). Fucus vesiculosus was not found at Woolwich, and A. improvisus was not found at Woolwich and Canvey Island.
Locations of the five sampling sites (Woolwich, Erith, Greenhithe, Gravesend and Canvey Island).

Samples of 10 F. vesiculosus fronds were collected from pier piles or their equivalent at each site, in order to ensure that the individual fronds selected were not in contact with any sediment. At least 10 ‘large’ (>0.5 mm) O. gammarellus were collected from the strandline in the littoral fringe at each site. Barnacles were scraped from the rock face or pier on which they were found straight into sample collection bags, ensuring that more than 100 individuals were collected from each site. All samples were transported to the laboratory in a chilled cool box on the day of collection, and then transferred to a −20°C freezer for storage for between 1 and 4 weeks before analysis.
In the laboratory, epiphyte-free regions, about 2 cm long and located 10 cm from the distal tip, of each F. vesiculosus frond were cut with stainless steel scissors, rinsed in double distilled water, and dried to constant weight at 60°C in individual acid-washed test tubes. This region of the frond was chosen because it is reproducible for each sample and represents tissue in which the accumulated metal concentrations have been integrated over several months (Bryan et al., Reference Bryan, Langston, Hummerstone and Burt1985; Rainbow et al., Reference Rainbow, Smith and Lau2002). Ten O. gammarellus from each site were rinsed individually in double distilled water, and also dried to constant weight at 60°C in individual acid-washed test tubes. The bodies of the barnacles were removed with clean stainless steel forceps from the surrounding calcareous plates with associated mantle tissue. Ten bodies were pooled in each of 10 acid-washed test tubes to provide 10 replicate pooled samples per site (in total 100 individual bodies from each site), before drying to constant weight at 60°C. The body (strictly the thorax with six pairs of filtering thoracic limbs (cirri), the reduced abdomen and part of the head, the oral cone) of a barnacle is easily recognized and the most reproducible tissue to use for analysis (Rainbow et al., Reference Rainbow, Smith and Lau2002, Reference Rainbow, Fialkowski, Wolowicz, Smith and Sokolowski2004). Remaining tissues, including the rest of the head forming the mantle tissue, base, shell plates and opercular plates, and any egg masses in the mantle cavity were ignored. Neither amphipods nor barnacles were maintained in the laboratory in any effort to depurate the gut contents, in order to avoid laboratory contamination. All the amphipods and barnacle bodies, therefore, contain gut contents, but these are considered to represent only a small (and location-dependent) proportion of total body metal content (Rainbow & Moore, Reference Rainbow and Moore1986; Moore & Rainbow, Reference Moore and Rainbow1987; Rainbow et al., Reference Rainbow, Moore and Watson1989; Moore et al., Reference Moore, Rainbow and Hayes1991), particularly in the case of barnacles which are well known to be particularly strong trace metal accumulators (Rainbow, Reference Rainbow and Southward1987, Reference Rainbow2007; Rainbow & Blackmore, Reference Rainbow and Blackmore2001; Luoma & Rainbow, Reference Luoma and Rainbow2008). Laboratory depuration of biomonitors, on the other hand, is to be recommended in the case of deposit feeders with gut contents consisting of metal-rich sediment (Bryan et al., Reference Bryan, Langston, Hummerstone and Burt1985; Casado-Martinez et al., Reference Casado-Martinez, Smith, Del Valls, Luoma and Rainbow2009; Rainbow et al., Reference Rainbow, Smith and Luoma2009; Kalman et al., Reference Kalman, Smith, Bury and Rainbow2014).
The seaweed sections, amphipods and barnacle bodies were digested on a heating block in concentrated nitric acid (HNO3, Aristar grade, BDH Ltd, Poole, UK) at 100°C, and diluted to 10 mL with double distilled water. Samples were analysed for the trace metals Ag, Cd, Co, Cr, Cu, Fe, Mn, Ni, Pb, Zn and V by Inductively Coupled Plasma Spectroscopy (ICPS) (Thermo iCap 6500 Duo ICP-AES), together with blanks and samples of two Standard Reference Materials (Mussel Tissue ERM-CE278 from the Institute for Reference Materials and Measurements, 2440 Geel, Belgium, and Oyster Tissue 1566b from the US Department of Commerce, Technology Administration, National Institute of Standards and Technology, Gaithersburg, MD). Agreement with the certified concentrations of the reference material, where available, is considered acceptable (Supplementary Table 1). All metal concentrations are quoted in terms of μg g−1 dry weight.
All accumulated metal concentration data were transformed logarithmically (to the base 10) to reduce deviations of data sets from normal distributions before the application of parametric statistical tests. Concentrations of metals in the seaweed F. vesiculosus were compared by analysis of variance (ANOVA) using logged data. For the amphipods and barnacle bodies, it is important to take into account any effect of size (in this case body dry weight) on accumulated trace metal concentrations before making comparisons between sites, or indeed between times at the same site. The power function y = axb, where y is the metal concentration (μg g−1), x is body dry weight (g), and a and b are constants, is an appropriate model for the relationship between accumulated trace metal concentrations and individual body weights in both amphipods and barnacles (Rainbow et al., Reference Rainbow, Moore and Watson1989, Reference Rainbow, Smith and Lau2002, Reference Rainbow, Fialkowski, Wolowicz, Smith and Sokolowski2004; Moore et al., Reference Moore, Rainbow and Hayes1991). Here x is the dry body weight of an individual amphipod, or the mean body dry weight of the 10 pooled barnacle bodies in each replicate sample. Amphipod and barnacle body data were, therefore, first analysed for significant regression coefficients (slopes) in the best-fit linear regressions of log individual body weight (log x) against log metal concentration (log y) in the data set for each crustacean for each metal at each site, and in the whole species data set for each metal.
For many, but not all, metals in each species, there was, in fact, a significant effect of body weight on accumulated body metal concentration in the whole data set and/or in at least one of the data sets for an individual site. In these cases, it is, therefore, not meaningful to quote means or use ANOVA to make comparisons between the amphipod or barnacle body accumulated metal concentrations at the different sites. In contrast, in the absence of any such size effect for a metal in a particular species, ANOVA can be, and was, used to make statistical comparisons between sites, still using logged data.
If a size effect was detected, Analysis of Covariance (ANCOVA) was used to make allowance for this size effect when comparing between sites. In the ANCOVA comparisons, the data for each metal in each crustacean were first analysed to check if the data set for any site showed a regression coefficient significantly different from those of the other sites for that species. When this occurred, that data set was removed from any further statistical comparison against the remaining sites. Analysis of the data for those sites for which the slopes of best-fit regressions did not differ significantly, was continued to identify any differences in elevation of metal concentration/body dry weight double log regressions between sites. If a priori analysis showed significant differences in accumulated metal concentrations between sites, Tukey's Honest Significant Difference (HSD) test was then applied a posteriori, to identify which sites differed significantly from each other in accumulated metal concentrations. Linear regression analyses, ANOVA and ANCOVA were carried out using STATISTICA (Statsoft).
Because mean accumulated metal concentrations in the bodies of amphipods or barnacles from different sites have no comparative meaning in the presence of size effects, comparative accumulated metal concentrations are then quoted as the estimated accumulated concentrations (with 95% confidence limits) in amphipod or barnacle bodies of a standardized dry weight, as calculated from each best-fit double log regression. The standardized dry weight chosen for O. gammarellus was 0.01 g. Mean dry weights of the amphipods at the five sites ranged from 0.0045 g (Woolwich) to 0.0181 g (Greenhithe), with a grand mean across sites of 0.0143 g, so a standardized dry weight of 0.01 g is appropriate for this data set. Furthermore, comparisons were to be made (see below) against the equivalent 2001 Thames estuary data set for O. gammarellus of Rainbow et al. (Reference Rainbow, Smith and Lau2002), in which study the grand mean dry weight of amphipods from the five sites was 0.0099 g (range 0.0063–0.0155 g). Rainbow et al. (Reference Rainbow, Smith and Lau2002) also quoted accumulated metal concentrations of O. gammarellus for a 0.01 g dry weight amphipod, as indeed did Rainbow et al. (Reference Rainbow, Moore and Watson1989) and Moore et al. (Reference Moore, Rainbow and Hayes1991) for the same amphipod from wider ranges of sites across the UK. For the bodies of A. improvisus, the mean individual body dry weight ranged from 0.00106 to 0.00195 g (grand mean 0.00163 g) across the three sites in 2014, while ranging from 0.00165 to 0.00227 g (grand mean 0.00209 g) in 2001 (from data of Rainbow et al., Reference Rainbow, Smith and Lau2002). For ease of comparisons, the standardized individual barnacle body dry weight chosen was 0.002 g.
Finally, comparisons were made between the 2014 data set and that of 2001 (Rainbow et al., Reference Rainbow, Smith and Lau2002), to investigate whether trace metal bioavailabilities to each of the three chosen biomonitors had changed over the intervening years. Samples were taken at the same time of year (mid July in 2014, early August in 2001) to eliminate any seasonal effects. In 2001, Rainbow et al. (Reference Rainbow, Smith and Lau2002) employed atomic absorption spectrophotometry for metal analysis, while in 2014 we used the more sensitive analytical technique of ICPS, giving a wider range of accumulated metal concentration data for the later year. Data are, therefore, here presented for the metals cobalt, chromium, nickel and vanadium, which cannot be compared against any equivalent 2001 data, but are now available for any future comparisons. Furthermore, the summary 2001 metal concentration data presented here may appear to differ slightly from those in Rainbow et al. (Reference Rainbow, Smith and Lau2002) who, for example, presented mean metal concentrations in ANOVA comparisons in the form of anti-logged means of logged concentrations. While logged data were still used for statistical comparisons here, mean data are presented for unlogged concentrations, showing very slightly different values from those of Rainbow et al. (Reference Rainbow, Smith and Lau2002). In the case of the barnacle body data used for ANCOVA, Rainbow et al. (Reference Rainbow, Smith and Lau2002) quoted estimated metal concentrations for a barnacle of the mean dry weight for each site, while we have used the standardized 0.002 g dry weight for all sites.
RESULTS
2014 Fucus vesiculosus
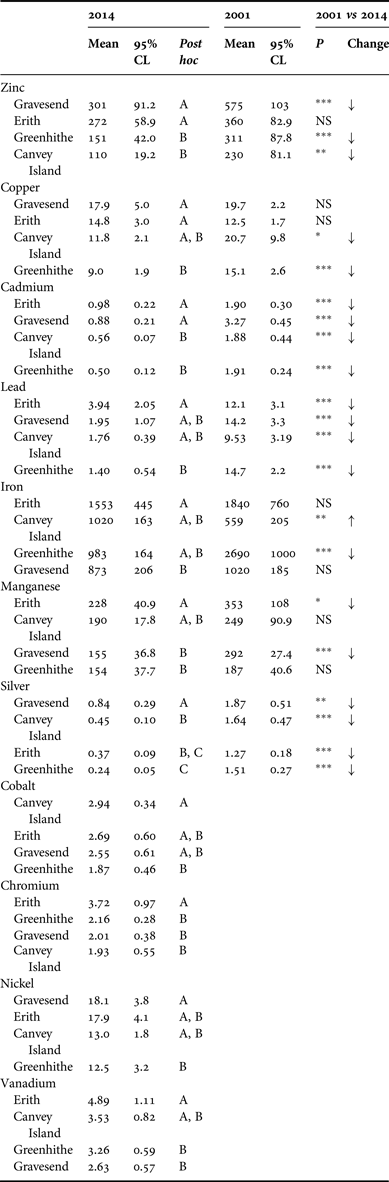
Table 1 presents the mean accumulated concentrations of 11 trace metals in F. vesiculosus from four sites in the Thames estuary (Figure 1) in July 2014. Seaweed samples from sites sharing the same letter do not differ significantly (ANOVA, Tukey's post hoc, P > 0.05) in concentration of the trace metal concerned. For all 11 metals there was a significant difference (P < 0.05) in the bioaccumulated concentrations in the seaweed across the four sites.
Fucus vesiculosus: mean concentrations (μg g−1 with 95% confidence limits interval, unlogged data) of trace metals in seaweed samples from four sites in the Thames estuary in 2014, and results of Tukey post hoc ANOVA comparisons of logged metal concentration data between sites. 2014 sites sharing a common letter do not differ significantly in seaweed concentrations of that metal (P > 0.05). Also shown are equivalent concentrations (mean, 95% CL, unlogged data) of samples collected from approximately the same sites in 2001 (after Rainbow et al., Reference Rainbow, Smith and Lau2002), and results of ANOVA comparisons of logged data for each site between 2001 and 2014 (*P < 0.05, **P < 0.01, ***P < 0.001, NS P > 0.05).
2014 Orchestia gammarellus
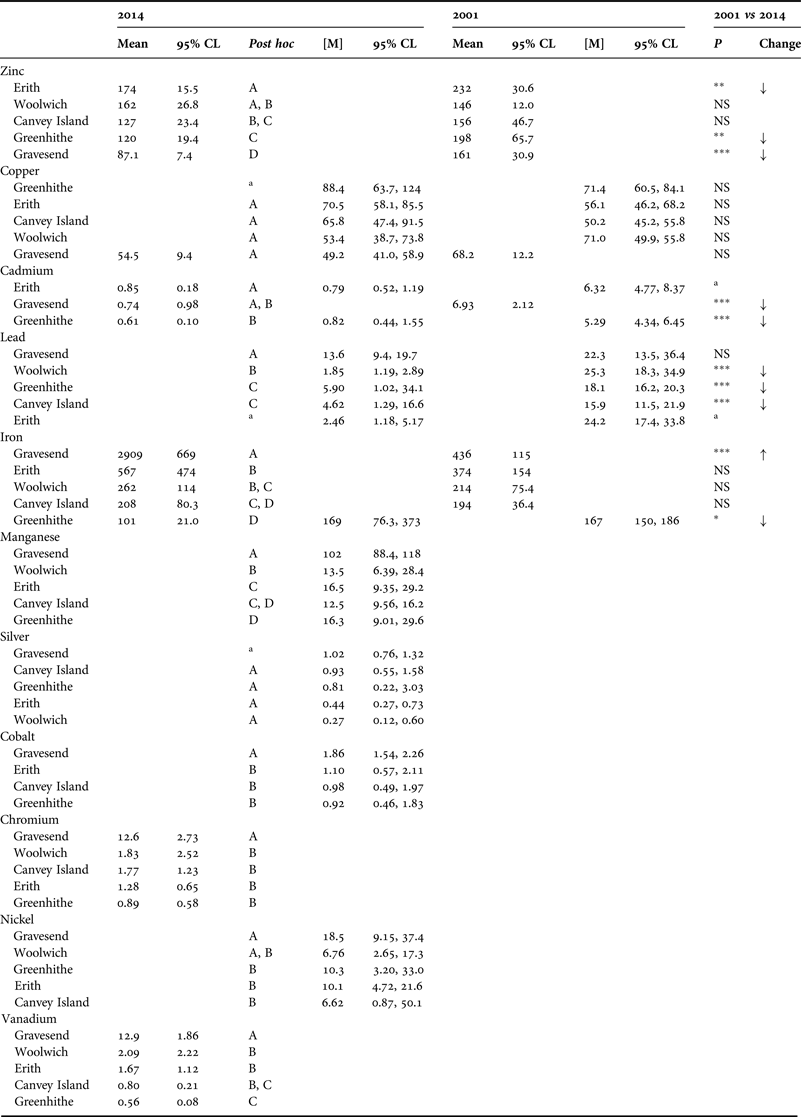
Table 2 gives accumulated trace metal concentrations in the amphipod O. gammarellus from all five sites in the Thames estuary sampled in July 2014. If there was no size effect on the concentration of a particular metal in the amphipods at any one site or in the whole data set for that metal across all five sites, then accumulated concentrations are quoted as means with 95% confidence limits. For each such metal, sites are presented in descending order of mean bioaccumulated concentrations (Table 2). As in Table 1, sites sharing the same letter do not differ significantly (ANOVA, Tukey's post hoc, P > 0.05) in bioaccumulated concentrations of the trace metal concerned.
Orchestia gammarellus: Concentrations (μg g−1) of trace metals in amphipods from up to five sites in the Thames estuary in 2014, expressed as either the mean with 95% confidence limits interval (unlogged data), or as the concentration ([M] with 95% CL) in a standardized amphipod of 0.01 g dry weight as estimated from best fit double log regressions of body dry weight (g) against metal concentration (μg g−1) when the accumulated concentration has been shown to be significantly related to weight. Also shown are 2014 results of statistical comparisons between sites using Tukey post hoc ANOVA (logged metal concentration data) or ANCOVA (double log regressions). 2014 sites sharing a common letter do not differ significantly in amphipod concentrations of that metal (P > 0.05). Also shown are equivalent concentrations (means with 95% CL or concentrations in 0.01 g amphipods [M] as estimated from double log regressions) of samples collected from approximately the same sites in 2001 (after Rainbow et al., Reference Rainbow, Smith and Lau2002), and the results of ANOVA or ANCOVA comparisons of logged data for each site between 2001 and 2014 (*P < 0.05, **P < 0.01, ***P < 0.001, NS P > 0.05).
a Size effect prevents comparison by ANOVA, and significant difference in regression coefficients prevents comparison by ANCOVA.
In the presence of a size effect for a particular metal, data were compared by ANCOVA, and the concentrations presented ([M] in Table 2) are those in a standardized 0.01 g dry weight amphipod, as estimated from best fit double log regressions of body dry weight (g) against metal concentration (μg g−1). 95% confidence limits are asymmetrical about the estimated concentrations [M] after anti-logging of estimates made using logged data. Again amphipods from any sites sharing a common letter in the post hoc column for a particular metal do not differ significantly in body concentrations of that metal. In Table 2, sites listed under each metal showing a size effect have been ordered firstly in terms of the post hoc ANCOVA groups to which they belong (as denoted by a single letter), and secondly within those groups in terms of the estimated body metal concentration of a body of 0.01 g dry weight amphipod. In ANCOVA, it is best-fit regression lines that are being compared. These lines will inevitably cross, even when there are no significant differences between slopes, and estimated metal concentrations for different standardized body weights chosen are likely to give different site orders. Furthermore, according to how the chosen standardized weight falls inside or outside the range of body weights in the data set analysed for a given site, the 95% confidence limits of the estimated concentrations might be narrow or broad. Finally, when the number of measurable replicates is small, confidence limits about estimated concentrations in a standard sized amphipod will be large, again affecting placement in a descending order of sites for a particular metal. Therefore, post hoc ANCOVA site groupings will not always follow the strict rank order of the weight standardized metal concentrations quoted (e.g. for Mn in Table 2). Occasionally, and perhaps inevitably by chance at the 5% level given the number of statistical comparisons made, significant differences in regression coefficients (slopes of best fit lines) ruled out follow-up comparisons of the elevations of those lines (in practice the logged accumulated metal concentrations). Three such examples are apparent in the 2014 data set for O. gammarellus (Table 2).
In the 2014 data set, nine of the 11 trace metals investigated showed significant differences (P < 0.05) in the bioaccumulated concentrations in the amphipods across the five sites (Table 2). The two remaining trace metals, copper and silver, showed no significant differences in accumulated metal concentration in O. gammarellus across the four sites that could be compared in each case, the fifth site being eliminated from the ANCOVA comparison because of a significantly differing regression coefficient (Table 2).
2014 Amphibalanus improvisus
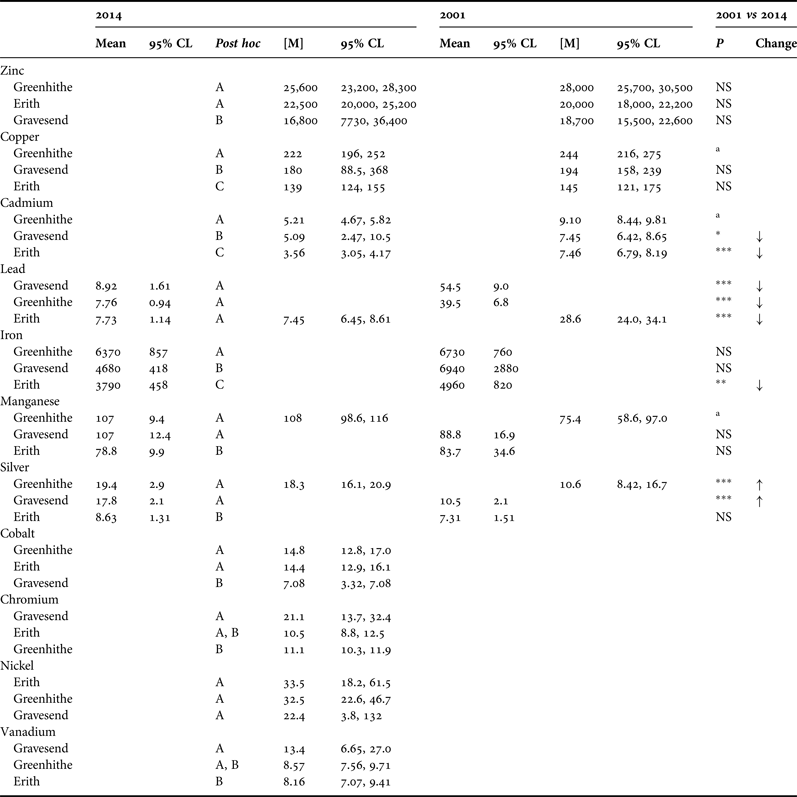
Table 3 presents accumulated concentrations of the 11 trace metals in bodies of the barnacle A. improvisus from the three sites at which it occurred. Arrangement of the 2014 barnacle data in Table 3 follows the same pattern as that for the amphipod data in Table 2, with use of ANOVA or ANCOVA in the absence or presence respectively of any size effect. The concentrations presented ([M] in Table 3) are those in a standardized 0.002 g dry weight barnacle body.
Amphibalanus improvisus: Concentrations (μg g−1) of trace metals in barnacle bodies from three sites in the Thames estuary in 2014, expressed as either the mean with 95% confidence limits interval (unlogged data), or as the concentration ([M] with 95% CL) in a standardized body of 0.002 g dry weight as estimated from best fit double log regressions of body dry weight (g) against metal concentration (μg g−1) when the accumulated concentration has been shown to be significantly related to the body weight. Also shown are 2014 results of statistical comparisons between sites using Tukey post hoc ANOVA (logged metal concentration data) or ANCOVA (double log regressions). 2014 sites sharing a common letter do not differ significantly in barnacle body concentrations of that metal (P > 0.05). Also shown are equivalent concentrations (means with 95% CL or concentrations in 0.002 g bodies [M] as estimated from double log regressions) of samples collected from approximately the same sites in 2001 (after Rainbow et al., Reference Rainbow, Smith and Lau2002), and the results of ANOVA or ANCOVA comparisons of logged data for each site between 2001 and 2014 (*P < 0.05, **P < 0.01, ***P < 0.001, NS P > 0.05).
a Size effect prevents comparison by ANOVA, and significant difference in regression coefficients prevents comparison by ANCOVA.
In the 2014 data set for A. improvisus, nine of the 11 trace metals investigated showed significant differences (P < 0.05) in the bioaccumulated concentrations in the barnacle bodies across the three sites (Table 3). The two remaining trace metals, lead and nickel, showed no significant differences in accumulated metal concentration in the barnacles across the three sites (Table 3).
2014 Bioavailabilities
The bioaccumulated trace metal concentrations in each of the three biomonitors represent relative measures of the local bioavailabilities of the trace metals at a site to that particular biomonitor integrated over a preceding time period.
The dissolved bioavailability of zinc, as reflected by the seaweed F. vesiculosus, showed a fall between Erith and both Greenhithe and Canvey Island downstream, but Gravesend, between Greenhithe and Canvey Island (Figure 1), showed matching high zinc bioavailability to that at Erith (Table 1). Erith, joined now by Woolwich, showed the highest bioavailability of zinc to O. gammarellus, while Gravesend was at the bottom of this rank order of sites (Table 2). The barnacle A. improvisus showed a downstream pattern of decreasing zinc bioavailability between sites, zinc bioavailability at each of Greenhithe and Erith being greater than that at Gravesend (Table 3).
Copper bioavailability to F. vesiculosus did not differ between Erith, Gravesend and Canvey Island, but was lower at Greenhithe (Table 1). There was no geographic variation in copper bioavailability to O. gammarellus along the Thames estuary in 2014 (Table 2). Copper bioavailability to the barnacle A. improvisus did show geographic variation, but Greenhithe now topped the list of sites (Table 3). Cadmium bioavailabilities to all three biomonitors varied geographically (Tables 1–3). There was consistency of site pattern between F. vesiculosus and O. gammarellus with bioavailabilities at Erith and Gravesend being higher than at Greenhithe and Canvey Island (Tables 2 & 3). As for copper, cadmium bioavailability to the barnacle was highest at Greenhithe and lowest at Erith (Table 3).
Lead bioavailabilities to the seaweed and amphipod did vary geographically but not consistently between the two biomonitors (Tables 1 & 2), but lead bioavailability to the barnacle showed no regional variation (Table 3).
Iron bioavailabilities to F. vesiculosus showed limited variation between sites (Table 1), while that to O. gammarellus was strikingly raised at Gravesend (Table 2). Iron bioavailability to A. improvisus, on the other hand, was not particularly raised at Gravesend, and was highest at Greenhithe (Table 3). The site patterns of manganese bioavailabilities to each of the biomonitors reflected that of iron (Tables 1–3).
Bioavailability of silver to F. vesiculosus was highest at Gravesend (Table 1), whilst silver bioavailabilities to O. gammarellus did not vary between sites (Table 2). In contrast to the rank order of sites for the seaweed (Table 1), silver bioavailability to A. improvisus was highest at Greenhithe (Table 3). In the case of cobalt, bioavailability at Gravesend was relatively high to the seaweed and the amphipod (Tables 1 & 2), but not to the barnacle (Table 3). Chromium bioavailability was particularly high to the amphipod (Table 2) and the barnacle (Table 3) at Gravesend, but not to the seaweed (Table 1). Nickel bioavailability to O. gammarellus was also relatively high at Gravesend (Table 2), but showed little or no geographic variation for F. vesiculosus (Table 1) and A. improvisus (Table 3). Vanadium bioavailability to O. gammarellus was significantly raised at Gravesend (Table 2), where it was also relatively high for A. improvisus (Table 3), but not for F. vesiculosus (Table 1).
2001 vs 2014 Bioavailabilities
Tables 1–3 also show comparisons (whether by ANOVA or ANCOVA) of accumulated metal concentrations in the three biomonitors between 2001 (from the raw data of Rainbow et al., Reference Rainbow, Smith and Lau2002) and 2014. On occasion, the between-year comparisons needed the use of ANOVA or ANCOVA, differently from the intersite comparison used for the 2014 data. Thus metal concentration data for some sites in Tables 2 & 3 show both mean concentrations and concentrations estimated for standard-sized amphipods or barnacle bodies. Also included in Tables 1–3, are indications of the direction of any significant change in accumulated metal concentration between 2001 and 2014. As above, intraspecific changes in bioaccumulated trace metal concentrations are interpreted as changes in total metal bioavailabilities to the particular biomonitor at the particular site, in this case between 2001 and 2014.
The bioavailabilities of several trace metals in the Thames estuary have fallen significantly, and to different extents, between 2001 and 2014 (Tables 1–3).
More specifically, the bioavailability of zinc to F. vesiculosus fell significantly at three out of four sites (Table 1), and zinc bioavailability to O. gammarellus fell at three from five sites (Table 2). Zinc bioavailabilities to the barnacle A. improvisus, however, did not change significantly at any of three sites. Copper bioavailabilities to the barnacle were similarly unchanged over time (Table 3), as was the case also for the amphipod (Table 2). Bioavailabilities of copper to the seaweed did, however, fall at Greenhithe and Canvey Island (Table 1). Both cadmium and lead bioavailabilities to all three biomonitors fell significantly at all sites (with one exception of no change) where comparisons could be made (Tables 1–3). The bioavailabilities of silver to F. vesiculosus fell at all four sites examined (Table 1), but rose in the case of A. improvisus at two out of three sites (Table 3). Comparative silver data are not available for O. gammarellus.
Iron bioavailabilities are in effect unchanged to the three biomonitors. In the case of the seaweed, bioavailabilities have increased at one site, decreased at another, and remained unchanged at the other two (Table 1). A similar situation exists for iron bioavailability to the amphipod, with a decrease at one site, an increase at a second, and no change at three sites (Table 2). The increase in iron bioavailability to O. gammarellus at Gravesend is, however, considerable (Table 2), suggesting some relatively local source. For the barnacle, iron bioavailability is unchanged at two sites, and has fallen at one (Table 3). Comparative data for manganese are only available for the seaweed and the barnacle (Tables 1 & 3). Manganese bioavailability to F. vesiculosus fell at two sites, and remained unchanged at two others (Table 1). Manganese bioavailability to the barnacle was unchanged (Table 3).
DISCUSSION
The bioaccumulated trace metal concentrations in a biomonitor represent relative measures of the total bioavailabilities of the metals to that particular biomonitor at a particular site integrated over a preceding time period. This time period may be of the order of a few months in the case of F. vesiculosus, and, so long as the frond is not in contact with sediment, the seaweed will take up and accumulate metals only from solution (Bryan et al., Reference Bryan, Langston, Hummerstone and Burt1985). Amphipods store accumulated trace metals in detoxified form in the ventral caeca of the alimentary tract, the cells of which turn over in a cell cycle over a period of between 15 and 30 days (Galay Burgos & Rainbow, Reference Galay Burgos and Rainbow1998; Luoma & Rainbow, Reference Luoma and Rainbow2008). Thus the preceding time period of trace metal bioavailabilities represented by the accumulated trace metal concentrations in O. gammarellus would be of this order (15–30 days). Talitrid amphipods, such as O. gammarellus, take up and accumulate trace metals from both solution and from their food, typically decaying seaweed in the strandline (Weeks & Rainbow, Reference Weeks and Rainbow1991, Reference Weeks and Rainbow1993). The metal concentrations in this food source essentially depend on metal dissolved in the local water, and so this talitrid might be considered as an indirect biomonitor of local dissolved metal bioavailabilities. Being a detritivore, however, O. gammarellus may also consume other material from the strandline, for example sediment particles on decaying seaweed fronds, making any reflection of dissolved bioavailabilities less straightforward.
Barnacles take up trace metals from solution through the large permeable surface area of their bodies with their extensive cirri, and from the suspended food filtered by these cirri. In the case of balanid barnacles, including A. improvisus, the filtered food consists of fine detritus particles (including re-suspended fine sediments), phytoplankton and zooplankton (Anderson, Reference Anderson1994). Although barnacles have high uptake rates of trace metals from solution in comparison to other crustaceans (Luoma & Rainbow, Reference Luoma and Rainbow2008), the high trophic input of metals from filtered particles, coupled with high assimilation efficiencies, mean that barnacles take up most of their accumulated metals from the diet (Wang et al., Reference Wang, Qiu and Qian1999a, Reference Wang, Qiu and Qianb; Rainbow et al., Reference Rainbow, Blackmore and Wang2003; Rainbow, Reference Rainbow2007). Barnacles also have extremely low excretion rates of accumulated trace metals, which they store in the body in detoxified forms (Rainbow, Reference Rainbow2007; Rainbow & Luoma, Reference Rainbow and Luoma2011), leading to accumulated concentrations that are extremely high amongst invertebrates (Rainbow, Reference Rainbow2007; Luoma & Rainbow, Reference Luoma and Rainbow2008). The low excretion rates also mean that the period of metal exposure represented by an accumulated concentration in the body of a barnacle is very long, of the order of months or even more than a year (Rainbow et al., Reference Rainbow, Blackmore and Wang2003; Rainbow & Luoma, Reference Rainbow and Luoma2011). For these reasons A. improvisus can, therefore, be regarded as a biomonitor of the bioavailable trace metals mostly in the suspended matter on which it has been feeding for an extended period, approximating to the lifetime of the barnacles which were probably mostly 1 year old at the time of collection (Southward, Reference Southward2008).
When considering geographic changes in trace metal bioavailabilities along the Thames estuary, it is to be expected that the total dissolved concentrations of any metals of domestic or industrial origin upstream would be sequentially diluted with seawater down the estuary to Canvey Island. Furthermore the dissolved bioavailability of the many trace metals that exist in solution as the cation (M+ or M2+) can be modelled by the availability of the free uncomplexed metal ion (Campbell, Reference Campbell, Tessier and Turner1995; Luoma & Rainbow, Reference Luoma and Rainbow2008). This is the case for nine of the 11 trace metals investigated here, the remaining two, chromium and vanadium, being present as oxy-anions, based on chromate and vanadate respectively (Luoma & Rainbow, Reference Luoma and Rainbow2008). The dissolved cations of Ag, Cd, Co, Cu, Fe, Mn, Ni, Pb and Zn in seawater are complexed by inorganic anions, particularly chloride ions in the cases of Ag, Cd and, to a lesser but significant extent, Zn (Luoma & Rainbow, Reference Luoma and Rainbow2008). This inorganic complexation is progressively reduced with decreasing salinity upstream, and the correlated dissolved bioavailabilities of these trace metals can be expected to decrease downstream with increased salinity, simply as a physicochemical effect of salinity change (Luoma & Rainbow, Reference Luoma and Rainbow2008). In the Thames estuary, salinity varies from 1 to 12 at Woolwich, 13 to 27 at Gravesend, to above 30 at Canvey Island (Anon, Reference Attrill1998). These intersite differences in salinity are certainly strong enough to be correlated with changes in dissolved trace metal bioavailabilities (Luoma & Rainbow, Reference Luoma and Rainbow2008), as shown for zinc and cadmium in the specific case of O. gammarellus (Rainbow et al., 1993). This physicochemical effect affecting the dissolved bioavailabilities of many of the trace metals would enhance any expected effect of sequential dilution of upstream metal contamination, leading to decreased dissolved trace metal bioavailabilities downstream. There are, however, significant potential sources of bioavailable trace metals into the estuary downstream of the top site Woolwich, particularly effluents from the two major sewage works at Beckton and Crossness, between Woolwich and Erith (Figure 1). It is also likely that there are other potentially significant sources of trace metals along the stretch of estuary examined. It is not surprising, then, that the descending rank orders of trace metal bioavailabilities at each site in 2014 do not systematically follow from upstream to downstream (Tables 1–3).
The apparent anomalies in the downstream changes in the bioavailabilities of many of the trace metals (for example copper, cadmium, iron, manganese and silver) between the barnacles and the other two biomonitors may be, at least partially, caused by regional differences in the bioavailabilities of the metals in the sediments. The barnacles are able to filter re-suspended sediments, and, therefore, access a source of metals not bioavailable to the other two biomonitors. Trace metals associated with sediments are held there for very long periods of years or decades without being eluted, even into uncontaminated overflowing water, and yet may still be trophically bioavailable to organisms ingesting these sediments, whether by deposit feeding or by filtration after sediment re-suspension (Bryan et al., Reference Bryan, Langston and Hummerstone1980, Reference Bryan, Langston, Hummerstone and Burt1985; Rainbow et al., Reference Rainbow, Kriefman, Smith and Luoma2011). If the concentrations, and potentially the trophic bioavailabilities, of trace metals in the sediments in the Thames estuary have reduced over time (as in the case of dissolved metals – Power et al., Reference Power, Attrill and Thomas1999), and if Thames estuary sediments do have an expected net movement downstream by mass transport, then it is indeed possible that barnacles at sites downstream of historic sources of metal contamination are filtering locally re-suspended older sediments with relatively high metal loadings. Thus the seaweed and amphipods are sampling the present day dissolved bioavailabilities of trace metals at particular sites in the Thames, while the barnacles at these sites may be accessing a bioavailable metal source of older origin.
In the 2014 data set, the geographic patterns of manganese bioavailabilities to each of the biomonitors reflected that of iron. This should not be surprising because both trace metals often co-occur in sediments (Luoma & Rainbow, Reference Luoma and Rainbow2008).
Raised bioavailabilities of both nickel and vanadium can indicate the presence of spilled oil or refined fuel in a coastal system, for both trace metals are commonly associated with oil (Pearson & Green, Reference Pearson and Green1993). There was some similarity between rank orders of sites for nickel and vanadium bioavailabilities for O. gammarellus (Table 2), but not a significant correlation (Spearman's Rank). Nor was there any similarity of rank orders of sites for nickel and vanadium bioavailabilities for the other two biomonitors.
To turn to the comparison between bioavailabilities in 2001 and 2014, it is clear that the bioavailabilities of several trace metals in the Thames estuary have fallen significantly, to different extents, over this time period.
There is generally good agreement between the three biomonitors on this point, with the slight exception of the bioavailabilities of zinc and silver to the barnacles. Zinc bioavailabilities to A. improvisus did not change significantly at any of three sites (Table 3), perhaps partly because the barnacles are accessing zinc in re-suspended sediments, a source that does not decrease in strength over time without mass export (Rainbow et al., Reference Rainbow, Kriefman, Smith and Luoma2011). Similarly, the bioavailabilities of silver to F. vesiculosus fell at all four sites examined (Table 1), but rose in the case of A. improvisus at two out of three sites (Table 3). Comparative silver data are not available for O. gammarellus. Perhaps again the barnacles at Greenhithe and Gravesend are accessing older silver-rich sediments, transported downstream since an expected reduction in upstream silver-rich effluents originating in the photographic industry prior to the huge rise in popularity of digital photography.
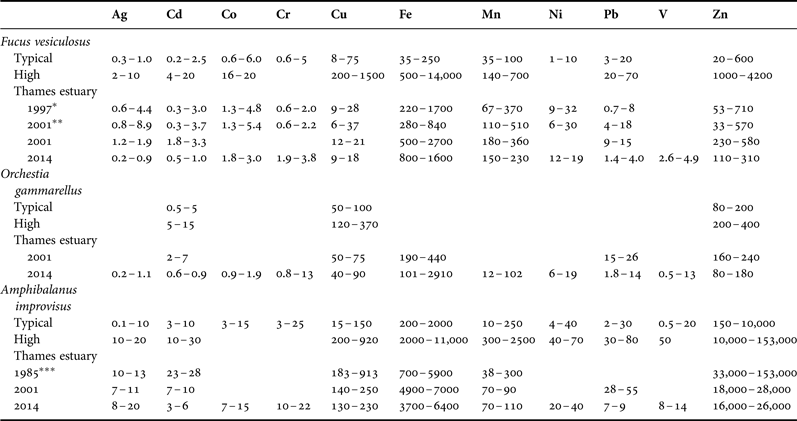
As relative measures of bioavailabilities, the bioaccumulated concentrations of the trace metals, and any changes observed over time, need to be put into an international context of what is typical of estuaries today and what might be considered as atypically high. Table 4 makes such an attempt. Furthermore, Table 4 calls on historical literature data for the Thames estuary to extend the temporal comparison back in time.
Ranges of accumulated concentrations of trace metals (μg g−1 dry weight), arbitrarily categorized from the literature as ‘typical’ or ‘high’ when possible, in the seaweed Fucus vesiculosus, the amphipod Orchestia gammarellus, and bodies of the barnacle Amphibalanus improvisus. The low end of the typical range is indicative of uncontaminated conditions; the upper end is indicative of concentrations representative of moderate contamination on a regional scale. The ‘high’ concentrations are indicative of atypically raised bioavailability of that metal in the local habitat. (After Bryan et al., Reference Bryan, Langston and Hummerstone1980, Reference Bryan, Langston, Hummerstone and Burt1985; Bryan & Gibbs, Reference Bryan and Gibbs1983; Rainbow, Reference Rainbow and Southward1987; Rainbow et al., Reference Rainbow, Moore and Watson1989, Reference Rainbow, Smith and Lau2002, Reference Rainbow, Fialkowski, Wolowicz, Smith and Sokolowski2004; Moore et al., Reference Moore, Rainbow and Hayes1991; Luoma & Rainbow, Reference Luoma and Rainbow2008; Nasrullah et al., Reference Nasrullah, Smith, Ehsanpour, Afkhami and Rainbowsubmitted.) Also shown for comparison are the ranges of bioaccumulated concentrations across the Thames estuary sites, summarized from Tables 1–3. 1997* and 2001** data for F. vesiculosus in the Thames estuary (Woolwich to Foulness) are from McEvoy et al. (Reference McEvoy, Langston, Burt and Pope2000) and Langston et al. (Reference Langston, Pope, Chesman and Burt2004) respectively. 1985*** data for A. improvisus in the Thames estuary (Woolwich) are from Rainbow (Reference Rainbow and Southward1987).
The comparisons made here between 2001 and 2014 trace metal bioavailabilities in the Thames estuary follow on from existing literature data showing considerable reductions in dissolved metal concentrations (Power et al., Reference Power, Attrill and Thomas1999), sediment metal concentrations (Attrill & Thomas, Reference Attrill and Thomas1995; McEvoy et al., Reference McEvoy, Langston, Burt and Pope2000; Langston et al., Reference Langston, Pope, Chesman and Burt2004) and trace metal bioavailabilities to a number of biomonitors (McEvoy et al., Reference McEvoy, Langston, Burt and Pope2000; Langston et al., Reference Langston, Pope, Chesman and Burt2004) from 1980 to the turn of the century. For example, there were significant decreases in accumulated concentrations of As, Cd, Hg, Ni and Zn in Fucus vesiculosus in the Thames estuary between 1980 and 1997 (McEvoy et al., Reference McEvoy, Langston, Burt and Pope2000). Comparisons between 1999 and 2001 accumulated concentrations in this seaweed showed further decreases for Co and Hg, while accumulated concentrations of Cd and Pb rose somewhat (Langston et al., Reference Langston, Pope, Chesman and Burt2004). The comparison made here over the longer period of 2001 to 2014 has shown that the decrease in cadmium and lead concentrations in F. vesiculosus has been re-established.
Table 4 confirms that the bioavailabilities of many trace metals, for example Cd, Cu and Zn to A. improvisus in the Thames estuary in the early 1980s were extraordinarily high. By 2014, trace metal bioavailabilities have become more typical of estuaries that are either uncontaminated or with some moderate, perhaps expected, contamination (Table 4). To generalize across the suite of biomonitors, bioavailabilities of Cd, Co, Cr, Ni (probably) and Pb are now typical (Table 4), in the case of Pb presumably in correlation to the removal of lead from petrol at the end of the 20th century. Bioavailabilities of Ag, Cu and Zn are typical in the cases of F. vesiculosus and O. gammarellus, but are still high for A. improvisus (Table 4), perhaps in reflection of re-suspended older sediments still being accessed trophically by the barnacles. Bioavailabilities of Fe and (to some extent) Mn in 2014 are high (Table 4), perhaps reflecting high sediment loadings in the estuary. More comparative data, however, for the trace metals less often analysed, for example Co, Cr, Ni and V, are needed to strengthen these conclusions.
The general conclusion to be drawn from this study is that the bioavailabilities of several trace metals in the Thames estuary have continued to fall significantly, to different degrees, between 2001 and 2014, in reflection of the continuing remediation of the Thames from its severely polluted state in the middle of the 20th century. Encouragingly, the biodiversity of the Thames has continued to recover from its previous desperate condition, but there is still room for further improvement (Henderson & Rainbow, Reference Henderson and Rainbow2012). Further falls in the bioavailabilities of trace metals in the Thames estuary can be expected as local environmental management proceeds, and in the longer term historically contaminated sediments (Attrill & Thomas, Reference Attrill and Thomas1995) are transported downstream and out of the estuary.
The continuing reductions in the bioavailabilities of toxic metals in the Thames estuary do also have some significance for human health. The outer Thames estuary is a source of shellfish such as mussels, oysters, cockles, winkles and prawns for the human seafood market. Samples of such shellfish in 2001 contained accumulated concentrations of toxic metals within public health safety guidelines, although the margins of safety were not always very large (Langston et al., Reference Langston, Pope, Chesman and Burt2004). It is reassuring that falling toxic metal bioavailabilities will continue to increase such safety margins over time.
SUPPLEMENTARY MATERIAL
To view supplementary material for this article, please visit http://dx.doi.org/10.1017/S0025315415001952
ACKNOWLEDGEMENTS
We are grateful to Danielle Holmes for help in collecting the samples.
CONFLICT OF INTEREST
None.