Implications
The relative importance of genomic imprinting for the genetic variation of traits, economically relevant, for pork production was investigated for the first time by applying a model simultaneously allowing for paternal and maternal imprinting. As a component of the additive genetic variance, an imprinting variance was estimated for each trait. For 19 out of the 33 traits investigated, genomic imprinting significantly contributed to additive genetic variation.
Introduction
Genomic imprinting is an epigenetic process and depends on the sex of the parent. Imprinted genes are expressed at a lower level than the copy from the other parent. Silencing of one parental allele may be complete or, in the case of partial imprinting, there may be some remaining activity and also an effect on the phenotype. In each generation, the imprint is newly established during gametogenesis. The first results on how much imprinted genes contribute to genetic variation in livestock were presented by De Vries et al. (Reference De Vries, Kerr, Tier, Long and Meuwissen1994) with estimates of genetic variance components of carcass and growth traits in pigs. They found that about 5% of the phenotypic variance in back fat thickness and up to 4% of growth rate variance were affected by imprinting. For the analysis De Vries et al. (Reference De Vries, Kerr, Tier, Long and Meuwissen1994) used an animal model augmented by either an additional paternal or maternal gametic effect, an approach, which was adopted by nearly all researchers in this field. The same method was used by Stella et al. (Reference Stella, Stalder, Saxton and Boettcher2003), who reported very small imprinting effects for reproduction traits in pigs. Engellandt and Tier (Reference Engellandt and Tier2002) found a significant paternal gametic variance for two fatness traits and, economically most important, for carcass meat content of German Gelbvieh finishing bulls. Another approach was used by Essl and Voith (Reference Essl and Voith2002). They analysed the data twice, the first with a sire model and the second with a dam model. By comparing variance components from both the analyses they inferred imprinting effects for protein content and days open. Beyond that, several studies exist in which significant imprinted quantitative trait loci effects for body compositions, meat quality, growth and reproduction traits were mapped in pig F2 families (e.g. De Koning et al., Reference De Koning, Rattink, Harlizius, van Arendonk, Brascamp and Groenen2000, Reference De Koning, Rattink, Harlizius, Groenen, Brascamp and van Arendonk2001a and Reference De Koning, Harlizius, Rattink, Groenen, Brascamp and van Arendonk2001b).
In order to assess the relative importance of genomic imprinting for the genetic variation of traits economically relevant for pork production, we applied a model including two random genetic effects for each animal, as outlined in Reinsch and Guiard (in preparation) and applied in Neugebauer et al. (Reference Neugebauer, Räder, Schild, Zimmer and Reinsch2009) for slaughter traits in cattle. Hill and Keightley (Reference Hill and Keightley1988) proposed an approach to estimate three uncorrelated variance components simultaneously (Mendelian, paternally imprinted and maternally imprinted), which corresponds to a scenario with loci either fully imprinted (maternal or paternal) or not imprinted at all and results in zero covariances between the corresponding random genetic effects. With partial imprinting their genetic covariance matrix is, however, no longer diagonal and it would become necessary to estimate covariances, which is not possible. Our parameterisation circumvents this problem by defining the variance components in a different way. The model allows for paternal and maternal imprinting as well as of any combination of full and partial imprinting simultaneously. This model was applied for the analysis of a comprehensive data set originating from the Swiss herdbook breeding program.
Material and methods
Principle of analysis
Inheritance was modelled by two random genetic effects per animal: one for the genetic effect as sire, that is half of the breeding value as sire, and one for the genetic effect as dam, that is half of the breeding value as dam. The model in matrix notation is

where assumptions on the covariance of random effects are
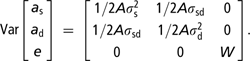
Resulting in the following general mixed model equations

where Y is the vector of observations, X is the design matrix for fixed effects with the corresponding solution vector β; Z s and Z d are the design matrices for random genetic effects with solution vectors a s and a d; e is the vector of random residuals. The matrix A is the numerator relationship matrix. Variance ratios are
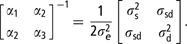
Genetic variance components are expressed in terms of gametic variance as sire  , gametic variance as dam
 and their gametic covariance σ sd. The diagonal matrix W has elements

and adjusts the error variance of each observation to the variation in the Mendelian sampling term according to the inbreeding coefficients (F si, F di) of both parents. The model, therefore, is a special kind of reduced model (Quaas and Pollak, Reference Quaas and Pollak1980).
The variance of the difference of the gametic effects as sire and as dam

corresponds to the imprinting variance  , which is a part of the total additive genetic variance
 . The other part of the total additive genetic variance is termed as Mendelian variance
 , which describes the ‘unimprinted’ component of the additive genetic variance (not to be confused with the Mendelian sampling variance). Thus, the additive genetic variance is the sum of Mendelian and imprinting variance. Moreover, the imprinting variance for a particular trait can be divided into a paternal contribution
 and a maternal contribution
 .
Animals and traits
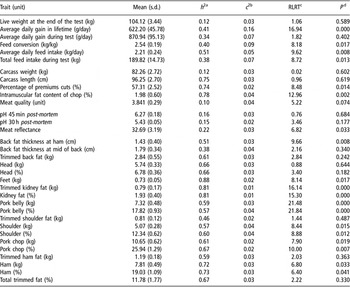
The data set was provided by the Swiss pig breeding organisation SUISAG. Between 1997 and 2006, 21 209 Large White pigs (females and castrates) were fattened and slaughtered at the central test station. The 33 traits were split into three groups: fattening traits (6), carcass traits (24) and meat quality traits (3). A comprehensive overview is given in Table 1. The pedigree included 15 747 ancestors of the slaughtered animals with a pedigree depth of up to 20 generations. The number of sows represented in the data with progeny from a single litter was 5188, 1213 sows had two litters, 284 had three litters and 93 contributed progeny from four or even more litters.
An overview of analysed traits: raw means with standard deviations, heritabilities, proportions of the phenotypic variance due to common litter environment, test statistic RLRT for significance of the imprinting variance and corresponding error probabilities

RLRT = REML likelihood ratio test.
The number of observations was always 21 209, except total feed intake during test with 17 033.
aHeritabilities from models assuming no imprinting, their s.e. were uniformly very close to 0.01.
bFraction of the phenotypic variance due to common litter environment, from models assuming no imprinting, their s.e. were uniformly very close to 0.01.
c2(LogL(impriting model)-LogL(Mendelian model)).
dError probabilities.
The structure of the data changed during time. In the beginning up to five animals per litter were tested. Since 2000, test groups consisted mostly of two animals per litter (one female and one male castrate). All pigs were generally slaughtered at 103 kg and cut according to the Swiss Pig Performance Testing Manual (internal documentation). The left half of the carcass was divided into 11 cuts and the weight of each cut was recorded. In addition to the percentage of the cut in comparison to the complete weight of the carcass side was calculated for selected cuts. Thus, for ham, pork belly, kidney fat, shoulder and pork chop there were two observations in the data set, weight of the cut in kilogram and in percentage.
Models
A linear model with one of the three different combinations of fixed effects was used according to the kind of trait, thereby following the standard genetic evaluations in the Swiss herdbook breeding program. For carcass and fattening traits (except live end weight) the following linear model was employed

where y is the vector of observations, Si is the fixed effect of sex, Bj is the fixed effect of the interaction between barn and cycle, b 1 is the linear regression on carcass weight (x 1), pk is the random effect of pen, fl is the random effect of the interaction between farm of origin and year, lm is the random effect of litter, sn is the random additive genetic effect as sire, do is the random additive genetic effect as dam, ycp is the random y-chromosomal effect and mq the random mitochondrial effect and eijklmnopqr is the random residual.
For meat quality traits the interaction between barn and cycle was replaced by SDj the fixed effect of the slaughter day as this contemporary group effect is far more important for these traits than the interaction between barn and cycle.

In the analysis of carcass weight and live end weight, the linear regression on carcass weight was replaced by the linear regression (b 2) on age (x 2)

y-chromosomal and mitochondrial genetic effects were included to avoid inflated estimates of the imprinting variance as a consequence of contributions of the y-chromosomal or mitochondrial variance to the covariance between paternal and maternal half sibs. For each observation paternal inheritance in the pedigree was traced back until the first male founder was identified. The number of this male founder was assigned to this observation as the corresponding y-chromosomal effect. It was assumed that the variance of the y-chromosomal effects was  , where I is an identity matrix with dimension YC, and YC is the number of distinct founder y-chromosomes in the pedigree. We used the same system for the mitochondrial inheritance and traced back the maternal inheritance. The variance of the mitochondrial effect was assumed as
 where I is an identity matrix with dimension MI, and MI is the number of distinct founder mitochondria in the pedigree.
The ASReml program was used for variance component estimation (Gilmour et al., Reference Gilmour, Cullis, Welham, Gogel and Thompson2004). Approximative standard errors for heritabilities and other functions of variance components were derived by applying the delta method.
Hypothesis testing
The matrix S

contains the genetic covariance components. Under the null hypothesis of no imprinting ( ) all variances are equal and S is not a positive definite. Two models were fitted to each trait in our data set, the imprinting model and an equivalent non-imprinting model (Mendelian model). From the restricted maximum likelihood (REML) log-likelihood of both models an REML likelihood ratio test (RLRT) with two degrees of freedom was calculated to test the hypothesis of imprinting against the absence of imprinting.
If  is the REML log-likelihood of the more general model and
 is the REML log-likelihood of the restricted model (REML log-likelihood under the null hypothesis), then the RLRT is given by:

With the assumption of between-subject independence (in this case no relationships between animals), the RLRT under the null hypothesis is asymptotically distributed as a 1 : 1 mixture of two χ 2 distributions with a single and two degrees of freedom (Self and Liang, Reference Self and Liang1987). Since this condition is not fulfilled and the ratio of the mixture is unknown in our case we used a conservative test with a χ 2 distribution with two degrees of freedom to minimise the risk of falsely rejecting the null hypothesis.
Estimation of imprinting effects
The differences between estimated genetic effects as sire and as dam correspond to the imprinting effect; for animal  in the pedigree,

with the corresponding precision

where the prediction error variances and covariances of both genetic effects for each animal were retrieved from the inverted left-hand side of the mixed model equations as described for ASReml in Gilmour et al. (Reference Gilmour, Cullis, Welham, Gogel and Thompson2004) and Welham et al. (Reference Welham, Cullis, Gogel, Gilmour and Thompson2004).
Results and discussion
Genetic parameters
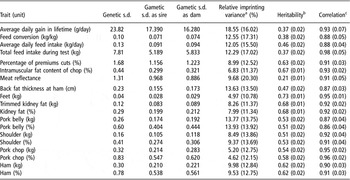
Significant imprinting variances were found for 19 traits (Table 2). Imprinting variances of significant traits were between 5% and 19% of the total additive genetic variance. Average daily gain in lifetime reached the highest proportion with nearly 19%. Many of the estimated imprinting variances accounted for around 12% to 14% of the total additive genetic variance (back fat thickness at ham, pork belly (kg) and pork belly (%), feed conversion, average daily feed intake, average daily gain during test). For another group of traits imprinted inheritance contributed a proportion between 6% and 10% to the additive genetic variance (kidney fat (kg), kidney fat (%), shoulder (kg), shoulder (%), ham (kg) and ham (%), percentage of premiums cuts, intramuscular fat content of chop, meat reflectance). Among the traits with the smallest imprinting variance were feet, pork chop (kg) and pork chop (%) with around 5%. Standard errors for the absolute imprinting variances of significantly imprinted traits were all below 1% of the estimates.
Results from the imprinting analysis for all traits with a significant genetic imprinting variance

aThe imprinting variance is expressed relative to the total additive genetic variance (s.e. in brackets).
bHeritability is from the imprinting model (s.e. in brackets).
cEstimates for the correlations between breeding values as sire and as dam (s.e. in brackets).
The estimated imprinting variances are a result of the incomplete genetic correlation between both genetic effects (Table 2) and the differences between their variances. For significant traits these correlations ranged from 0.86 for pork belly (%) to 0.98 for average daily gain during lifetime. Several traits (e.g. daily gain during test) had a genetic correlation close to one, but showed a significant imprinting variance, which is mainly caused by a difference between both genetic variance components.
In the extreme case, the genetic correlation could be exactly one with both gametic variances different and a ratio of  , resulting in
 . It should be mentioned that matrix S would not be positive definite in that case. A reviewer’s proposal was to fit the gametic models that explicitly account for a perfect genetic correlation by employing a matrix
 as covariance matrix of gametic effects, where G is the gametic relationship matrix and D is a diagonal matrix with one and f on alternate rows. The inverse of G* can be computed from the pedigree for known f. With a proper incidence matrix assigning observations to gametes f could be estimated, for example, by a grid search. For the non-significant traits correlations between both genetic effect were between 0.87 and 0.99 and the f-coefficients (derived from estimated variance components) were always smaller than 1.07. It may be expected that we did not miss a significant result by not applying this kind of model because f = 1.07 corresponds to <1% of the additive genetic variance due to imprinting. When applied to the significant traits it would, however, provide a separate test for a perfect v. non-perfect genetic correlation between both kinds of breeding values.
Heritability estimates from Mendelian models (i.e. assuming no imprinting) ranged from 12% for live end weight up to 88% for feet weight (Table 1); standard errors were very uniform and close to 1%. Reported heritability estimates from the literature vary widely for economically important traits in pigs. Most of the estimates for back fat thickness are between 50% and 70%, for carcass length between 52% and 63%, for intramuscular fat content of chop between 38% and 67% and the results for pH 45 min post-mortem are between 15% and 40% (e.g. Enfield and Whatley, Reference Enfield and Whatley1961; Cameron, Reference Cameron1990; Hovenier et al., Reference Hovenier, Kanis, van Asseldonk and Westerink1992; Lo et al., Reference Lo, McLaren, McKeith, Fernando and Novakofski1992; Knapp et al., Reference Knapp, Willam and Sölkner1997; Cassady et al., Reference Cassady, Young and Leymaster2002). In general, estimates from the literature tend to be smaller than our estimates.
The imprinting model heritabilities for all significant traits are presented in Table 2, together with their approximate standard errors. The estimated heritabilities ranged from 37% to 73% and were somewhat lower than the corresponding Mendelian model heritabilities, whereby reductions were between 1% and 15%. Animal model and imprinting model heritabilities were also compared by Engellandt and Tier (Reference Engellandt and Tier2002). However, they used the Mendelian genetic variance divided by the phenotypic variance  and found lower values for the imprinting model heritabilities, while we looked at the proportion of the phenotypic variance, which is explained by the additive genetic variance, that is the sum of Mendelian and imprinting variance
 . Reductions of heritabilities reported by Engellandt and Tier (Reference Engellandt and Tier2002) were up to 30% for kidney fat (pelvic fat, 15% and meat percentage, 20%) in their imprinting analysis of data from German Gelbvieh finishing bulls. Applying our definition of heritability to their results yields smaller reductions of imprinting model heritabilities (kidney fat 21%, pelvic fat 4% and meat percentage 13% relative to the larger animal model estimates).
Generally, results for mitochondrial and y-chromosomal variance components show very small estimates (<1%, not shown). This is in good agreement with results from quantitative analyses of beef traits (Reinsch et al., Reference Reinsch, Engellandt, Schild and Kalm1999; Engellandt and Tier, Reference Engellandt and Tier2002), who found no significant influence of y-chromosomal inheritance in cattle carcass traits.
Jeon et al. (Reference Jeon, Carlborg, Törnsten, Giuffra, Amarger, Chardon, Andersson-Eklund, Andersson, Hansson, Lundström and Andersson1999), Nezer et al. (Reference Nezer, Moreau, Brouwers, Coppieters, Detilleux, Hanset, Karim, Kvasz, Leroy and Georges1999) and Van Laere et al. (Reference Van Laere, Nguyen, Braunschweig, Nezer, Colette, Moreau, Archibald, Haley, Buys, Tally, Andersson, Georges and Andersson2003) reported effects of a polymorphism of the imprinted IGF2 locus on carcass traits in pigs. In the Swiss Large White population this polymorphism seems to be of minor or no importance, since all of about 200 genotyped boars had the same homozygous genotype. Therefore, the IGF2 locus does not contribute to the observed imprinting variances.
Parental contributions to the imprinting variance
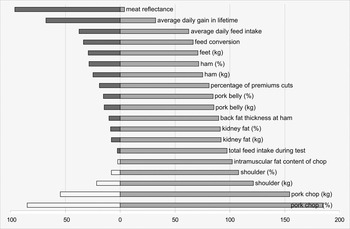
Different parental contributions to the imprinting variance are graphed in Figure 1.
Parental contributions to the imprinting variance of significant traits (expressed in percentage of the total imprinting variance): Paternal contributions on the left, maternal contributions on the right. Negative estimates were obtained for the paternal contributions of the last five traits, therefore the paternal contributions appear empty and the maternal contributions numerically are larger than 100%. The difference of these bars equates to 100%.

The x-axis shows the contribution in percent; the maternal contribution  is on the right, the paternal contribution
 is on the left. The traits in the upper area (meat reflectance and average daily gain in lifetime) presented a higher paternal contribution
 . The paternal contribution for meat reflectance amounted to 96% and for average daily gain in lifetime to 68%. All other traits showed a higher maternal contribution
 to the imprinting variance: average daily feed intake (62%), feed conversion (66%), feet weight (71%), ham percent (72%), ham kilogram (76%), percentage of premiums cuts (81%), pork belly percent (85%), pork belly kilogram (86%), back fat thickness at ham (90%), kidney fat percent (91%), kidney fat kilogram (92%) and average daily gain during test (97%). For the traits intramuscular fat content of chop, shoulder (kilogram and percent) and pork chop (kilogram and percent), the calculation resulted in positive maternal contributions and negative paternal contributions, which is unexpected, but mathematically possible if large differences between both genetic variances occur and the covariances are higher than one of the parental variances. For these traits the covariance was higher than the paternal variance. We assume that the paternal contribution is actually very small or 0 and negative estimates for one of the parental contributions are a result of estimation errors. Exactly equal parental contributions or a contribution exclusively from a single parental side are rather special cases.
Imprinting effects
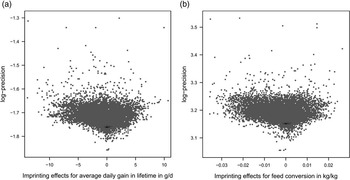
Estimates of imprinting effects (i.e. differences between paternal and maternal breeding values) for all animals are shown as scatter plots together with their log-precision in Figure 2 for the example traits average daily gain in lifetime and feed conversion.
Two-dimensional plot of estimated imprinting effects for all animals in the pedigree and their log-precision for the traits average daily gain in lifetime in g/day (a) and for feed conversion in kg/kg (b). The left side corresponds to higher breeding values as sire. Units for log-precisions are ln(g/day)−2 (a) and ln(kg/kg)−2 (b).

Average daily gain in lifetime showed positive and negative imprinting effects of up to 15 g/day and for feed conversion of more than 0.03 kg/kg. Both plots contain estimates for all animals in the pedigree. Most estimates are concentrated around 0, as expected for the random imprinting effect. In the lower parts of both plots, where precision is low, the differences between breeding values deviate less from 0 since estimates are regressed towards 0. This is due to the lack of information, for example, for animals many generations back in the pedigree without direct progeny with records in the data. The spread of estimated imprinting effects for animals with sufficient precision is roughly two thirds of a genetic standard deviation for average daily gain and one third of a genetic standard deviation for feed conversion.
Parent-of-origin-specific genetic trends
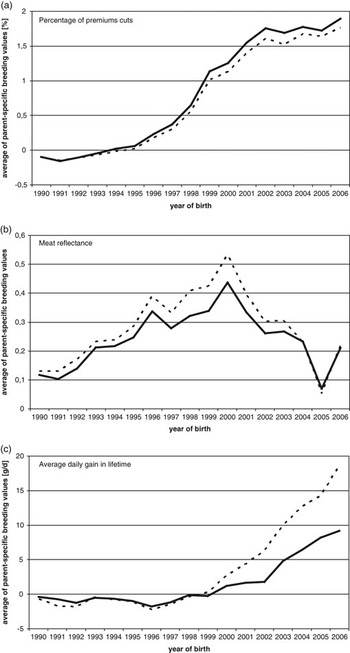
Parent-of-origin-specific genetic trends are shown for the percentage of premiums cuts, meat reflectance and average daily gain in lifetime in Figure 3(a–c).
Parent-of-origin-specific genetic trends for percentage of premiums cuts (a) in percent, meat reflectance (b) and average daily gain in lifetime (c) in g/day. Genetic trends as dam (as sire) are represented as black lines (dotted lines).

Genetic trends as sire and as dam for percentage of premiums cuts (Figure 3a) nearly coincide closely until 1993. In 1994, genetic trends split and the trend as dam evolved somewhat steeper than that as sire. In later years (1999 to 2006) the difference between both curves remained more or less constant. The pattern for meat reflectance is quite different (Figure 3b): during the 1990s the gap between both trends increased continuously until a maximum divergence was reached in the year 2000. With the beginning of the new millennium both trends turned negative with a shrinking difference until they coincided for the last 3 years. Meat reflectance was a selection goal during the beginning of the 1990s. Breeders stopped selecting for this trait for a while and started again in the last years.
Positive trends for average daily gain in lifetime (Figure 3c) have been observed since 1999 with virtually no difference between both trends during the years before. Since 1999, the slope of the genetic trend as sire was roughly twice as that as dam and the absolute difference between both trends is still increasing. Apparent separation of estimated genetic trends is influenced by the fact that observations in the data set were not collected earlier than 1997. The overall picture of genetic trends was very similar to that for the trait percentage of premium cuts in Figure 3a. The shape of genetic trends for reflectance is presumably a product of the selection history of this trait, which was a component of the breeding goal at the beginning of the 1990s, but later it was not considered in the breeding goal for some years although the recording of the trait was maintained. Since 2000, selection pressure was put again on meat reflectance and obviously forced both genetic trends together, whereas a lack of selection pressure in the years before allowed some divergence of trends. Average daily gain in lifetime is not a component of the total breeding value in Switzerland, whereas daily gain during test is. Therefore, since both growth traits are genetically correlated, there is only an indirect selection on gain during lifetime. If we further assume that genomic imprinting mainly affects the early growth (for gain during test no significant imprinting variance was found) then this may explain the divergent evolution of genetic trends as sire and as dam in this particular case. For the majority of imprinted traits there was, however, nearly no visible divergence of genetic trends.
Correlations between imprinting effects
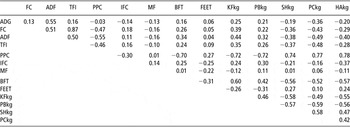
In order to get insight into the genetic correlations between imprinting effects we computed pair-wise correlations between estimates for imprinting effects of different significant traits, as a convenient surrogate for a comprehensive multi-trait analysis. Table 3 shows the correlation between the significant traits; seven proportion traits (e.g. ham (%)) are not shown, because they were nearly perfectly (0.98 to 0.99) correlated with their respective weight traits (e.g. ham (kg)). Many of the correlations in Table 3 are low to moderate. The highest value of 0.87 was observed between feed conversion and total feed intake during test. Larger correlations between 0.7 and 0.8 were also observed between the percentage of premium cuts and the single cuts shoulder, pork chop and ham, while the correlations with the fatness-related traits back fat thickness at ham, kidney fat and pork belly were of a similar magnitude but of opposite sign. A similar pattern was observed for the correlations between imprinting effects for ham (kg) and other lean cuts (correlations with shoulder 0.47 and with pork chop 0.42) on one hand and fat cuts on the other hand (negative correlations of about 0.55 with back fat at ham, kidney fat and pork belly). The overall picture is, that correlations between imprinting effects for different traits show the same direction as genetic correlations as reported in the literature (e.g. Hermesch et al., Reference Hermesch, Luxford and Graser2000; Kadarmideen et al., Reference Kadarmideen, Schwörer, Ilahi, Malek and Hofer2004).
Correlations between estimated imprinting effects of different traits

ADG = average daily gain in lifetime; FC = feed conversion; ADF = average daily feed intake; TFI = total feed intake during test; PPC = percentage of premiums cuts; IFC = intramuscular fat content of chop; MF = meat reflectance; BFT = back fat thickness at ham; FEET = feet (kg); KFkg = kidney fat (kg); PBkg = pork belly (kg); SHkg = shoulder (kg); PCkg = pork chop (kg); HAkg = ham (kg).
Separation of variance components
Separation of y-chromosomal and the mitochondrial variances from the imprinting variance are possible because their covariance structure differs from other random effects (diagonal matrices:  and
 ).
The case is, however, different for genetic maternal effects variance. Partitioning maternal genetic variance, if existent, from the imprinting variance causes problems. In this case the variance of the observations  can be written as:

where M, S and C are matrices derived from the design matrices for genetic maternal effects, genetic effects as sire and genetic effects as dam and I is an identity matrix. It can be seen that the variance component associated with M is a function of the gametic variance as dam  plus the genetic maternal variance
 and the covariance between maternal effects and genetic effects as dam σ m,d. Matrix C has an associated variance component, which is composed by the covariance between genetic maternal effects and genetic effects as sire σ m,s and the covariance between genetic effects as sire and as dam σ s,d. As a consequence our estimates for the imprinting variances of different traits may be contaminated by fractions of maternal genetic variances. These are, however, considered to be absent or of minor importance for the spectrum of traits analysed; for example, Tholen et al. (Reference Tholen, Jüngst, Schulze-Langenhorst and Schellander2005) and Habier et al. (Reference Habier, Götz and Dempfle2007) estimated very small common environmental litter variances, which are indicators for minor importance of maternal effects. Our estimates are in good agreement with these results (Table 1), since the relative proportion of common litter variance (c 2) was always beyond 10%, with the exception of average daily gain in lifetime with c 2 = 0.16.
Conclusion
There is evidence that parts of the additive genetic variance in pig traits are influenced by imprinting effects. Genetic evaluation could account for such imprinting by estimation of two parental breeding values per animal. It is possible to derive the imprinting variance as the variance of the difference between both breeding values per animal. In a comprehensive data set on Large White pigs, significant genetic imprinting variance was observed for 19 traits. Between 5% and 19% of the total additive genetic variance was controlled by imprinted loci. Therefore, different breeding values for each animal that account for imprinting effects would be helpful especially in crossbreeding schemes. In dam lines one should use the breeding values as dam and in sire lines the breeding values as sire to better attain the breeding goal.
Acknowledgement
We thank an anonymous reviewer for helpful and constructive comments, Dr R. Pfuhl for their assistance with the terminology of carcass traits and I. Räder for the technical assistance.