For nongovernmental organizations (NGOs), electoral candidates, and rebel leaders alike, changing people's behavior by providing them with new information is a fundamental goal. Doing so is especially challenging, however, in situations where the information is difficult for receivers to verify and the behavior's potential returns are uncertain. For example, public health officials seek to increase uptake in healthy practices in rural villages through information campaigns countering unfounded rumors of potential side effects. Opposition candidates in authoritarian regimes try to influence vote choice with information about their character and policy platforms. Rebel group leaders aim to attract supporters by persuading villagers that they are likely to succeed. NGOs encourage citizens to speak up when witnessing corruption on the part of public officials.
In sum, outcomes ranging from public health crises to violent conflict depend not only on new information spreading widely, but also on people opting to act on difficult-to-verify information and in the face of uncertain outcomes. This two-step process is foundational to core theories in political scienceFootnote 1 and to the success of myriad policy interventions, and the two steps can operate differently. For example, someone may hear about a politician's alleged corruption while running errands, but mere market chatter may not be enough to motivate them to turn out to vote for the opposition. Likewise, it is one thing for a villager to hear that international health workers have arrived to deal with a local outbreak of Ebola; it is quite another for them to stop tending to sick family members in the usual ways and instead take them to the quarantine tent. This gap between information provision and behavioral change has been identified in numerous recent studies (for example, Chong et al. Reference Chong2015; Dunning et al. Reference Dunning2019; Lieberman, Posner, and Tsai Reference Lieberman, Posner and Tsai2014) and raises important questions about when and how it can be closed.
Recent studies suggest that part of the answer depends on social networks. It is well known that social networks spread information (Banerjee et al. Reference Banerjee2013; Larson and Lewis Reference Larson and Lewis2017; Mobius, Phan, and Szeidl Reference Mobius, Phan and Szeidl2015) and that peers can influence behavior (Bond et al. Reference Bond2017; Sinclair, McConnell, and Michelson Reference Sinclair, McConnell and Michelson2013). Less well known is how exactly networks convert information into action. This article joins a small, new literature in political science that uses original network data collected in the field to disentangle the processes by which social networks disseminate information versus how they motivate action (Eubank et al., Reference Eubank2021; Ferrali et al. Reference Ferrali2019; Nathan and Atwell Reference Nathan and Atwell2020).Footnote 2
Specifically, we designed a study that zooms in on the social processes by which people come to hear new, hard-to-verify information and decide whether to act on it. We implemented our study in a rural village in Eastern Uganda. We provided seven randomly chosen households with information in person that in three days, an event would be held just outside the village at which every adult in attendance would receive a valuable block of soap in exchange for taking our survey. After seeding this information, the research team left the village for the three interim days and then returned to host the event during the next three days. Of the roughly 1,400 residents of the village and its outskirts we studied, 138 attended the event. Surveys at the event inquired about a person's sources of information about the event, as well as demographic and social network information. Once the event concluded, surveys were conducted throughout the village to complete our mapping of social networks and to measure the reach of information. We thus have a record of those who both heard the information and changed behavior based on it—138 people heard about and attended the event—as well as a measure of the reach of information that did not change behavior—an additional 130 people in our data heard about but did not attend the event.
We find that the seeded information spread through the community exclusively through face-to-face interactions along social ties of various types. Straightforwardly, and consistent with contagion models of information diffusion through networks (Centola Reference Centola2013; Centola and Macy Reference Centola and Macy2007; Chwe Reference Chwe1999; Jackson and Rogers Reference Jackson and Rogers2007; Newman Reference Newman2000), people who had more social ties that heard about the event were more likely to hear about it themselves. However, the social process that motivated some to act on this information was more complicated. Having more social contacts who attended the event is robustly not predictive of a person's attendance, even conditional on hearing about the event.Footnote 3 In the language of Young (Reference Young2009), simple contagion does not explain behavior in this village, so we probe the possibility of social influence and social learning as well.
To interpret our results, it is important to consider how villagers understood the information we shared. The behavior we elicited was perceived as uncertain or potentially sensitive by our respondents. This may have been due to the difficult-to-verify nature of our information, the relatively unusual way we communicated it, or the unusual nature of the event itself. We designed the study with the aim of ethically introducing this kind of uncertainty since we sought to approximate the substantive contexts sketched earlier, in which the information spread—for example, about the promises of a new health practice or a new rebellion—is inherently difficult for villagers to confirm.Footnote 4 While we obtained all required approvals for our study, including district-level approval, we intentionally did not coordinate with village officials prior to the event, which precluded villagers from confirming with local leaders the existence of the event or the reputations of its organizers.Footnote 5 Our intervention therefore relates most directly to cases of new information spreading that is difficult to verify; this could be villagers initially hearing novel news from a resident of another village, from a not fully trusted outside entity like a new NGO or politician, or from a trusted local official but about a new behavior with uncertain returns. Further, although a soap event may seem mundane, it was unusual in this context—there had not been a similar event in this area in recent years, according to local officials.Footnote 6 Consequently, a villager who heard the news could not be certain that the event would be held, that attending would be valuable, that attending would not entail risks, or that attending would be viewed favorably by fellow villagers. In such a setting, we might expect people to turn to their social contacts before deciding what to do.
Indeed, we find evidence consistent with social learning (Young Reference Young2009): a greater propensity for villagers to act on the information after observing early attenders of the event who could confirm its validity and utility. The eleven villagers who attended on the first day saw the event with their own eyes, experienced a low-risk event, and received the promised block of soap. Social proximity to one of these eleven early attenders is the strongest predictor of subsequent attendance. Occupying a network position one step closer to an early attender—a “friend of a friend” instead of a “friend of a friend of a friend,” say—is associated with a 16 per cent increase in one's likelihood of attending. This relationship is larger and stronger even than social proximity to a seed, a person who received the information via a personal visit by an enumerator. Social contacts who test out new behavior first and are able to credibly convey its benefit or low risk appear crucial to its subsequent popularityFootnote 7 and, notably, may be different individuals than those selected as seeds.
Our results further highlight the subtle role that network centrality plays. Villagers who are more central in the network (high closeness centrality) and who have connections to peers who themselves have lots of connections (high eigenvector centrality) are, as expected, more likely to have heard about the event. These network positions afford privileged access to information flowing through the network. However, among those who were informed, the less central were more likely to act on the information and attend. We discuss possible explanations, such as that those with less well-connected peers are freer to take novel, potentially risky actions, which is consistent with a social influence model in which conformity motives can act as accelerators or inhibitors of innovation (Young Reference Young2009). It could also be that the most central face a higher economic—rather than social—opportunity cost to acting on new information. Adjudicating among these mechanisms is left for future research.
As a whole, our findings contribute new knowledge about how social networks play a role in the diffusion and adoption of new, difficult-to-verify, actionable information, first via a simple transmission of the seeded information, then followed by a more complex process that creates secondary, social information that can motivate action. In the present context of valuable, actionable information spread in a village, the latter appears to be a function of lending credibility to the information. In sensitive situations, social ties may operate to reassure, reinforce, vet, and pass judgment on the action suggested by the seeded information. Consequently, social proximity to those who tested the action early is a powerful motivator, more powerful than proximity to those who heard first, and although the central network positions are indeed more likely to encounter the seeded information, they are not necessarily more likely to be convinced to act on it.
Beyond the insights into how social networks function to motivate (or inhibit) behavior, our results also highlight important policy implications. When interventions include information campaigns, for instance, about the quality or corruption of local governance, best health practices, security incidents, and so on, an important design consideration is whom to choose as the injection points. Our findings suggest potentially different answers depending on whether the goal is exclusively to spread information or to change behavior based on the information. While seeding information with people who have high network centrality may be optimal for the wide reach of information (Banerjee et al. Reference Banerjee2013), a different set of injection points may be optimal for encouraging the most people to act on it if the information is sufficiently hard to verify and is encouraging behavior that is sufficiently unusual. When this is the case, rather than targeting the most central, our findings suggest that targeting a tight-knit pocket within the network, whether central or not, and encouraging them to act early may generate the largest cascade of behavior.
These conclusions are drawn from the spread of a single type of information in a single setting. Of course, much is left for future work, especially establishing the generality of these findings. After describing the design and ethics of the study in greater detail, and then presenting the results, in the conclusion, we return to important considerations for the design of related future studies, as well as promising directions.
Social Networks in Rural Uganda
We implemented our study in a village in the Teso region of Uganda.Footnote 8 The study village has approximately 1,400 adult residents, is comprised predominantly of peasant farmers, and is largely ethnically homogeneous. Detailed demographic information can be found in Section 1 of the Online Supporting Information.
In our intervention, we seeded information with seven households, one selected at random from each of seven equally sized areas within the village. For each selected “seed” household, a Ugandan enumerator who was not from the village personally visited and shared the information that starting in three days, an event would be held at which all adults who take a survey would receive a large block of soap. The seeds were told that they were welcome to tell others, were asked a few basic questions about their household, and were given a sheet of paper containing the same information they were told about the event. Enumerators then left the village and stayed away for the next three days.
On the fourth day, the survey event began. The event was hosted at a church just outside of the village. A total of 138 people from the village or its outskirts attended the event, which was held over three days. Attendance exhibited a pattern of “early adopters” leading a cascade: eleven attended the first day, eighty-one the second day, and forty-six the third day.Footnote 9
During the week following the event, enumerators conducted door-to-door surveys throughout the study village. All adults in all households within view of the seed households were invited to take the survey, and at least one adult in all other households in the village was invited to take the survey. In total, 328 individuals were surveyed.
Surveys administered at the event asked demographic information questions, general networks questions, and questions specific to learning and spreading word about the event, including from whom the respondent heard the information and whom they told. Surveys administered after the event asked demographic information questions, general networks questions, whether or not the respondents knew about the event, and, if they claimed to know, who they heard from and whom they told. Additional details about the design can be found in Section 2 of the Online Supporting Information.
Our data are novel in two respects. First, in addition to a measure of who heard and acted on the information—a record of who attended the event—we also have a measure of who merely heard the information. Our surveys reveal that an additional 130 individuals throughout the village heard about the event but did not attend. By conditioning our analyses of attendance on hearing about the event, we can explore the role of networks in encouraging attendance beyond an information effect.
Secondly, because our event was held over multiple days, we can separate out those classically called “early adopters” in technology adoption studies. Here, we refer to the eleven who attended on day one of the event as the “early attenders.|” As we demonstrate in the following sections, social proximity to these individuals turns out to be the most robust determinant of attendance.
The Uncertainty of the Seeded Information
One important feature of our design is the novelty of the information that we seeded and the action that it motivated. Although it would be easy to classify the news of “free soap” as benign, risk-free, and even boring, the reaction of the villagers suggests it was not regarded this way. Extensive daily, in-person discussions between one of the authors who was in Teso throughout the study and the local enumeration team indicate that many villagers found the event to be unusual. For example, despite the team's care to convey the information clearly, a few villagers expressed concerns about the possible presence of witchcraft at the event.
This uncertainty is further compounded by the opportunity cost of attending. Travel to the event could be a substantial investment of time—respondents who did attend reported traveling between 2 and 180 minutes to reach the church, with a mean travel time of 50 minutes. Any doubt about whether the event would, in fact, be held or would, in fact, offer soap could render this travel time not worthwhile. If social networks play a special role in environments of uncertainty or sensitivity, we expect our design to capture this.
Ethics
When designing the study, we carefully considered the ethical issues posed by seeding new information in a community. Importantly, we wanted to provide information that, while novel and not straightforward to verify, would pose minimal, if any, risk of harm. With this goal in mind, we opted to share accurate information about a future event of our own design.
Participation was voluntary; we carefully trained enumerators to request informed consent to receive information about the event and to respond to our event and post-event survey. We chose soap as the compensation for participating in our survey in consultation with several Ugandan colleagues who had experience as both researchers and with NGOs; our aim was to provide an item that would be genuinely useful to any household in the village.
We selected Teso because it was a region where one of the authors had conducted extensive qualitative fieldwork on a prior project and knew the local political and social terrain well. That author remained in Teso for the duration of the study to engage with local officials and directly oversee data collection. We chose the study village because of its size, demography, and rural character; it appeared to be roughly representative of typical villages in Teso.
We conducted the study with prior approvals from the authors' university institutional review boards, from Uganda's National Council on Science and Technology, and from the relevant district-level officials. As discussed earlier, we waited until after our information was seeded and our event had ended before debriefing with the relevant village officials; we wanted to learn about how villagers would respond to new information that could not be easily verified with their local official.
When we learned on the last day of our event that some villagers had conveyed concern about the possibility of witchcraft at our event, we immediately arranged meetings with local village officials and local religious officials to understand the nature and extent of these concerns in the village. We learned from these meetings that any concerns that had existed were held by just a small number of villagers and had reflected general skepticism about the existence of and intention behind the event, rather than a perception of physical danger.Footnote 10 We trained the research team that conducted surveys in the village after the event to offer and to share transparently any details of our study with villagers.
The Social Network of a Village in Eastern Uganda
Both the event and the post-event surveys collected information on seven dimensions of a social network. Respondents were asked to name up to five other individuals with whom they discuss politics, discuss religion, speak on the phone, share secrets, share meals, and spend time, and whose homesteads they visit, for a possible maximum of 35 total names offered. The exact text of the network elicitation questions can be found in the Online Supporting Information, along with additional information about each network.
We selected these networks to maximize coverage of opportunities for word-of-mouth communication that are present in a rural village. Figure 1 shows the extent to which ties in one network are also present in each of the other networks. While there is considerable overlap, each network type contributes substantial information about a person's social relationships.
Heatmap of overlap between networks.
Notes: we define overlap as the proportion of links of the overlapped layer (x-axis) contained in the overlapping layer (y-axis). Percentages are low, in part, because respondents could name anyone, including those outside of our sample. The same figure including only links that connect two respondents can be found in the Online Supporting Information.

We begin our analyses using the union of these seven networks to capture an aggregate social network. Later, we disaggregate the network to explore the role of each type of link.
Who Heard and Who Attended?
Our data contain two outcomes: learning new information (hearing about the event); and acting on new information (attending the event). Our measure of who acted on the information is perfect: we observed attendance at the event. Our measure of who heard the information is perfect for those who attended (who could not have attended without hearing the information we seeded) and self-reported for those who heard but did not attend. In the post-event survey, we asked those who claimed to have heard about the event to name the item given to attenders. All who claimed to have heard correctly named “soap.” While we cannot be sure that those who claimed they did not hear were being truthful, the great extent of people reporting that they did hear suggests that saying so was not generally perceived to be costly.
Table 1 reports raw comparisons of mean demographic information for those who neither heard nor attended, those who heard but did not attend, and those who attended. Relative to nonattenders, those who attended were significantly more likely to be female. No other demographic difference is statistically significant at the 0.05 level.
Raw comparisons of mean demographic information between those who did not hear and did not attend (Base), those who heard but did not attend (Hearers) and those who heard and attended (Attenders) the event.

Notes: Base are those who neither heard nor attended. Hearers are those who heard but did not attend. Attenders are those who both heard and attended the event. P-values in the hearers and attenders columns are from comparison to base, and in the hear versus attend column are from comparison of hearers and attenders. * p < 0.1; ** p < 0.05; *** p < 0.01.
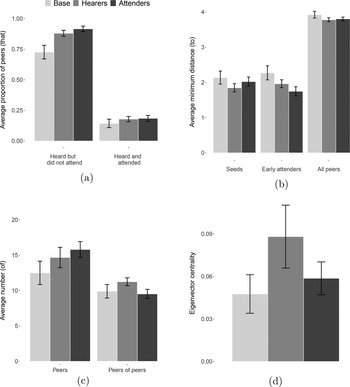
Network measures, on the other hand, differ starkly between those who heard and those who did not, and between those who attended and those who heard but did not attend (see Figure 2). A few differences in network position stand out. First, we look at eigenvector centrality, a standard measure of a node's influence in a network. A node has a high score (is influential) if it is itself connected to other highly connected nodes. We observe that those who heard but did not attend are much more eigenvector central in the network than those who did not hear and are also significantly more eigenvector central than those who attended (see Figure 2d). Secondly, both those who heard and those who attended have a larger proportion of their network neighbors who heard (see Figure 2a). Finally, both those who heard and those who attended are significantly closer—are separated by a fewer number of edges—to early attenders than those who neither heard nor attended (see Figure 2b).Footnote 11 Interestingly, distance to a seed—a person with first knowledge of the information and given an information sheet from the information source—is less separating: those who heard are closer to a seed, but those who attended are not.
Average and 95% confidence interval of various network measures grouped by hearing and attendance.
Notes: Base are those who neither heard nor attended. Hearers are those who heard but did not attend. Attenders are those who both heard and attended the event. The same legend applies to all figures: (a) average proportion of peers that heard but did not attend and proportion of peers that heard and attended; (b) average distance to seeds, early attenders, and all peers; (c) average number of peers and peers of peers; and (d) eigenvector centrality.

In both the event and post-event survey, in addition to inquiring about social network ties in general, we asked respondents to name people who told them and whom they told about the event. By comparing these initial sources of information about the event to the reported social network ties, we can identify the kinds of relationships that transmitted information about the event.
Figure 3 shows the proportion of ties of each type that were reported to have transmitted information about the event. All seven relationships were capable of transmitting information about the event. Ties that connote sharing secrets and spending time are particularly conducive—about a fourth and a fifth of secret and time ties in our data were reported to have also directly transmitted information about the event. The phone network is least conducive. While this may seem counterintuitive, respondents were also asked by what means they learned about the event. Exactly zero respondents learned about the event over the phone, and fewer than a third of respondents own a phone.Footnote 12
Percentage of links of each type a respondent said were used to transmit information about the event.

Inquiring about a person's source and target of information reveals only a small part of the process by which people become informed and motivated. This question detects the most salient initial sources and targets of information, and confirms that social networks provide opportunities to pass information along. However, social networks also provide opportunities to generate social information—to discuss, verify, vet, establish social judgment about, and reinforce new information. Our direct questioning of initial sources and targets only scratches the surface of this process. In the next section, we use information about who heard, who attended, and respondents' social networks to dig deeper into the process by which social networks inform and motivate.
Overview of Methods
Our approach in the next section is to relate the network position of individuals to both their propensity to hear and their propensity to attend conditional on hearing. The network position of one respondent in a village is, by definition, not independent of the network position of other respondents in that village. For this reason, we risk attributing too much precision to the results of regressions that rely on independence assumptions.Footnote 13 We take a number of measures to ensure that our results are statistically and substantively significant. When we use a parametric model, we employ a high threshold of statistical significance and verify the result with a battery of alternate specifications. Some of our results rely on comparisons of the same model (other than the dependent variable) on the same network; comparisons of precision and magnitude hold the dependency structure constant. We further confirm results with a nonparametric test that takes the dependencies in the network as given. As many network statistics are themselves correlated, we verify the importance of seemingly significant statistics with placebo tests that also allow us to compare results within the dependency structure of our particular data. These verifications and robustness checks can be found in the Online Supporting Information.
Results
We begin by assessing evidence for the contagion of information and of behavior through the social network. If straightforward contagion were at play as stipulated in the diffusion literature, the larger the proportion of a villager's neighbors that exhibit the outcome, the more likely the villager is to exhibit the outcome as well.
Assessing Simple Contagion
We perform three tests for simple contagion. First, we use logistic regression to test the unconditional relationship between the proportion of one's neighbors who exhibit the outcome (hear or attend) and whether one exhibits the outcome. If contagion were simply a matter of exposure to others in a social network, the effect of network neighbors should be apparent unconditionally—regardless of demographic or other network attributes. Secondly, we respecify the logistic regressions to condition on the number of network neighbors. Thirdly, we use a nonparametric approach to examine the extent of clustering in the social network with respect to hearing and to attending. All three tests strongly support the simple contagion of hearing and cast strong doubt on the simple contagion of attending.
Table 2 reports the results of the first and second tests for the outcome of hearing about the event, displaying the marginal effects of each variable. Here, we see strong evidence supporting simple contagion: the larger the proportion of a person's network neighborhood that heard about the event (Proportion of peers that heard), the more likely it is that the person heard about the event. A person whose full neighborhood heard is 68 per cent more likely to have heard than a person for whom none of their neighbors heard. Controlling for the size of the neighborhood (Number of peers) changes the relationship little. This finding is consistent with a straightforward contagion process in which greater exposure to hearing about an event made a person more likely to “catch” the information.
Relationship between proportion of peers who heard and hearing about the event

Notes: Reported values are the marginal effects for the average observation. Network statistics are calculated for the undirected aggregate social network. * p < 0.1; ** p < 0.05; *** p < 0.01.
Table 3 reports the results of the first and second tests for attendance for all who heard about the event. In contrast with the spread of information, the spread of behavior does not appear to exhibit simple contagion. It is not the case that the more of one's network neighbors who attended the event, the more likely one is to have attended.Footnote 14 The Online Supporting Information contains additional analyses which show that these results are not sensitive to including those who did not hear in the attendance regressions, to using the existence of a tie to one who heard or attended instead of the proportion of peers who heard or attended, or to including various sets of control variables.
Relationship between proportion of peers who attended and attending the event

Notes: Reported values are the marginal effects for the average observation. Data include all respondents who heard about the event. Network statistics are calculated for the undirected aggregate social network. * p < 0.1; ** p < 0.05; *** p < 0.01.
As a third test for contagion, we turn to a nonparametric approach that naturally accounts for the dependencies in network data.Footnote 15 If an outcome spread through a network from node to node via a contagion process, then those nodes exhibiting the outcome should be more connected to one another in the network than a randomly selected set of nodes of the same size from the same network would be. Following this logic, we randomly sample sets of 268 nodes—the number that heard about the event—from the network and compare the number of ties among these sets to the number of ties observed among the 268 whom we know heard. We find that a number of ties as high as the observed value would only be expected by chance less than 0.1 per cent of the time—a statistical significance at the 0.001 level. Performing the same on sets of nodes of size 138—the number of attenders—reveals that we would observe a number of ties at least as high as the number among the actual attenders 18 per cent of the time, falling short of conventional thresholds for statistical significance. Figure 4 shows the sampling distributions generated by this test. The nonparametric approach confirms that hearing about the event likely followed a contagion process, while attending the event did not.
Sampling distribution of number of ties among groups of people the same size as the group of all hearers (268, left) and the same size as the group of all attenders (138, right).
Notes: The vertical line indicates the number of ties of the observed group of hearers and attenders, respectively. Hearers cluster in the network consistent with a simple contagion process, while attenders do not. (a) Samples of the same size as the group of hearers. (b) Samples of the same size as the group of attenders.

If the social network played a role in encouraging attendance, it was not via a simple contagion process. We now turn to a deeper investigation of the determinants of attendance.
Social Networks as Sources of Credibility
Next, we examine evidence that the network functions as a source of credibility, in line with social learning models of diffusion (Young Reference Young2009). In this conceptualization, people can use their ties to vet or verify information. Consider two types of people who could be useful in establishing the credibility of this intervention's information. The first is the “seeds”; these seven individuals were personally visited by enumerators and given an information sheet about the event; they received the information first. The second is the “early attenders”; these eleven individuals chose to attend the event on the first day.Footnote 16 We calculate the network distance separating a person from their closest seed: if a person has a seed as a network neighbor, the shortest distance to a seed (Minimum distance to seeds) is 1; if a person has no seed as a neighbor but one of her neighbors has a seed as a neighbor, the shortest distance to a seed is 2; and so on. We calculate the same for distance to an early attender (Minimum distance to early attenders). Section 6 of the Online Supporting Information shows that a person directly connected to an early attender is at least 11.5 per cent more likely to attend than a person whose closest connection to an early attender is a friend of a friend. In this network, a person as close as possible to an early attender is 34 per cent more likely to attend than a person as far as possible from an early attender.
Figure 5 shows the extent of hearing and of attendance at an increasing distance to an early attender. At network distances farther out from the early attenders, fewer and fewer people heard or attended. For contrast, Figure 6 shows the same by distance to a seed instead of to an early attender. As the analyses in Section 6 of the Online Supporting Information confirm, distance to a seed is not related to attendance in the same way. While fewer and fewer people heard as the distance from a seed increases, more and more people attended.Footnote 17
Proportion of those in the sample at different distances to an early attender who heard and attended, showing that fewer of those farther from an early attender attended.

Proportion of those in the sample at different distances to a seed who heard and attended, showing that more of those farther from the seeds attended.

On the one hand, the seeds were privy to the original version and possessed a means of corroborating their message: showing the information sheet. On the other hand, given the novelty of an event like this one in an otherwise rural, remote village, there may have been doubt about whether soap would, in fact, be available, or even concern about the true purpose or ulterior motive of the hosts. In an environment of uncertainty or possible perceived risk, social proximity to one who tests out attending, reports the low risk, and credibly demonstrates the existence of soap would reasonably be motivating.Footnote 18 Section 7 of the Online Supporting Information compares the demographic characteristics and network positions of the eleven early attenders to the 127 later attenders. The two groups do not differ significantly in demographic attributes, but they are distinguished by their network positions. The early attenders occupy a close-knit community within the network that is near the seeds.
Disaggregating Network Type
Our data allow us to consider qualitative differences in social relationship type. As Larson and Rodriguez (Reference Larson and Rodriguez2020) point out, if people prefer to pass information along selectively, systematically making use of some ties and ignoring others, then aggregating network ties may miss this specialized diffusion. Table 4 separates the social network into its seven constituent layers, each treated as a separate network. Now, the proportion of peers that attended is calculated with respect to the number of peers in this network only (as opposed to the union of the seven).
Relationship between attending the event and neighbors in each network type who attended

Notes: Reported values represent the marginal effects for the average observation. Network statistics are calculated for the undirected network comprised of a single tie type. * p < 0.1; ** p < 0.05; *** p < 0.01.
Indeed, although we find no evidence for contagion of attendance in the aggregate social network, we see that contagion may be present here with respect to two link types. In both the sharing meals and the visiting homes networks, having more network neighbors who attended is associated with attending. In other words, the more people with whom a person shares meals or visits that attended, the more likely a person is to attend. The magnitude is large as well: a person with all of their meal partners attending is 28 per cent more likely to attend than a person with none of their meal partners attending; and a person with all of their visit partners attending is 25 per cent more likely to attend than a person with none of the people they exchange visits with attending.Footnote 19 The Online Supporting Information contains additional specifications and nonparametric tests that corroborate these rough magnitudes, as well as other information about each link type.
Motivation to attend appears to have spread more readily through the visits and meals links. Our data do not let us say precisely why relationships of these types were more relevant than others. Perhaps conversations about upcoming plans and their value happen most often in exchanges over meals and during visits, or perhaps those whom one visits and with whom one shares meals are those whose opinions matter most about right actions.
Digging Deeper into Attendance
To fill out the story of who hears and who attends, we add a battery of demographic and network controls. Table 5 confirms the consistent story for hearing about the event: hearing is robustly contagious, so that the more network neighbors who heard, the more likely one is to have heard. Moreover, being eigenvector central, female, socially proximate to an early attender, and wealthier (estimated by the quality of wall material) are positively associated with hearing.
Relationship between peers who heard and hearing, conditional on other network attributes and ego and peer demographic characteristics

Notes: Reported values represent the marginal effects for the average observation. Network statistics are calculated for the undirected aggregate social network. * p < 0.1; ** p < 0.05; *** p < 0.01.
Table 6 shows the same specification for attending. Even conditional on own demographic, neighbors' demographic, and network characteristics, attending is still not contagious in the full social network—the proportion of one's peers who attend is unrelated to one's own attendance. The story continues to be one of social proximity to an early attender. For the average villager in our sample, having a path to an early attender that is one link shorter—moving from having a friend of a friend to having a friend who attended on day 1, say—is associated with being 12 per cent to 15 per cent more likely to attend. Next, we zoom in on the negative relationship between eigenvector centrality and attendance.
Relationship between peers who attended and attendance, conditional on other network attributes and ego and peer demographic characteristics

Notes: Reported values represent the marginal effects for the average observation. Network statistics are calculated for the undirected aggregate social network. Data include all respondents who heard about the event. * p < 0.1; ** p < 0.05; *** p < 0.01.
Role of Network Centrality
Network theory and existing empirical studies hold that greater network centrality should be associated with greater access to information spreading through a network (Ballester, Calvó-Armengol, and Zenou Reference Ballester, Calvó-Armengol and Zenou2006; Banerjee et al. Reference Banerjee2013, Banerjee et al. Reference Banerjee2014; Borgatti Reference Borgatti2005; Kempe, Kleinberg, and Tardos Reference Kempe, Kleinberg and Tardos2003). Indeed, we find that greater network centrality is, in general, positively associated with hearing information about the event. The closer a person is to other people (low Average distance to all), and the more a person is connected to other highly connected people (high Eigenvector centrality), the more likely a person is to hear information spreading through their network.
It would be easy to conclude that the relationship between network centrality and acting on the information should be positive as well. However, among our sample of those who heard, centrality measures are consistently negatively related to acting on the information. Given that a person has heard the information, being more central is associated with a lower likelihood of attending.
Table 7 explores this relationship by stripping out other controls and assessing the connection between network position and attendance. While the size of one's neighborhood—one's “degree centrality”—is positively associated with attending (though with varying precision), the other measures all relate negatively. The more central a person is—measured in terms of the size of their neighbors' neighborhoods, their average distance to everyone else in the network, and their eigenvector centrality—the less likely they are to attend (though again with varying precision).Footnote 20
Relationship between network centrality and attending the event

Note: Reported values represent the marginal effects for the average observation. Network statistics are calculated for the undirected aggregate social network. Data include all respondents who heard about the event. * p < 0.1; ** p < 0.05; *** p < 0.01.
Table 8 presents the raw comparison between the twenty villagers in the sample with the highest eigenvector centrality and the twenty with the lowest. The most eigenvector central in the sample are less female and less Catholic (lending credence to the specifications of the last section that added these demographic characteristics as controls). Of course, due to the definition of eigenvector centrality, they also mechanically have larger neighborhoods, have neighbors with larger neighborhoods, and are closer to everyone on average. Consequently, they also have lower distances to both the seeds and the early attenders.
Comparison of the twenty villagers with the highest eigenvector centrality and the twenty with the lowest eigenvector centrality in the social network

The notable comparisons are in terms of hearing and attending. While more of the top eigenvector-central villagers heard about the event, a significantly smaller proportion of those who heard attended. This raw comparison, combined with the controlled comparisons earlier, implies the following role of centrality: central network positions are, indeed, privileged in terms of access to information. When information is flowing through a network, the most central are most likely to hear it. However, among those who receive the information, it is the least central who are most likely to act on it. This latter finding would be masked by studies that only measure acting on information; as a group, those who act on information are more central than those who do not. However, this is due to their access to information. Conditional on receiving information, it is the least central who are most likely to act on it.
There are many reasons why greater network centrality may discourage those who receive information to act on it. It could be that the most central have less need for soap or have a higher implied opportunity cost of attending the event than the less central. Table 8 shows that the twenty most and least central are similar in terms of the quality of their house's wall material (a proxy for wealth) and employment status (which speaks to opportunity cost), which casts some doubt on these explanations. It could also be that the most central are interested in acquiring the soap but are better able to send someone else to attend and acquire the soap on their behalf than the less central. This would suggest a positive relationship between centrality and the proportion of peers who attended. Table 8 shows this is not the case; if anything, the proportion of peers who attended is slightly smaller for the more central. Alternatively, if network neighbors serve as channels of peer pressure and social judgment, those with more influential neighbors—for example, neighbors with large neighborhoods or that have high eigenvector centrality—may face greater novelty-resisting pressure. In the presence of new opportunities, those less central may be less encumbered by expectations of their peers. This last explanation is in line with a social influence model, according to which conformity motives can act as accelerators or inhibitors of innovation (Young Reference Young2009). While our data cannot fully adjudicate among explanations for the negative relationship between network centrality and attendance among those who heard, we encourage future researchers to explore this finding, which has potentially large consequences for interventions aiming to motivate actions with novel information.
Conclusion
By randomly seeding novel information with individuals in a village in the Teso region of Eastern Uganda, detecting who learned it and who acted on it, and measuring personal information sources and social networks, we offer a rare, direct examination of the process by which social networks help inform and motivate in a rural, developing-country context.
We show that information spreads through the network along a myriad of social ties and that, in general, the more of one's social contacts who hear the information, the more likely one is to hear the information. The pattern, verified by several parametric and nonparametric specifications, is consistent with a process of simple contagion assumed by many theories of information diffusion. Also, consistent with the proposition in network theory that central positions within a network offer greater access to information, we find that network centrality is associated with hearing the seeded information.
On the other hand, the process by which people become motivated to act on new information is more complicated. Notably, behavior—in this case, attending an event—does not spread so easily through the network and does not follow a pattern of simple contagion. It is not the case that the more of a person's social contacts that attend, the more likely a person is to attend.
Instead, we find that while the proportion of one's peers who attend is unrelated to attending, social proximity to someone who was willing to attend the event before most others—the “early adopters”—is strongly related to attending. In fact, social proximity to these sources of secondary, “social information” is more important than proximity to people who were the initial recipients of the original information. We also find a surprising relationship between network centrality and acting on the new information. While the most central are more informed, among those who are informed, it is the less central who act on it.
These findings are consistent with social networks serving an important role beyond merely spreading the seeded information. Social contacts can also serve to reinforce, verify, and pass judgment on topics like whether new information is worth acting on. These ties give a person access to the social information that early attenders bring back from their attendance of the event and provide a forum for deliberating future actions. When one's most trusted contacts endorse an action, one is more likely to take the action as well. The potential for negative judgment may also deter new, sensitive, or unconventional behavior. In the language of (Young Reference Young2009), while the seeded information seems to have spread via simple contagion, social learning and social conformity both appear to have played a role in motivating behavior.
Our results suggest a number of important lessons and avenues for future research. First, the relationship we document between network centrality and behavior flags the importance for both theory and measurement to separately consider hearing information and acting on it. Without including in our study those who heard the information but did not act on it, we could not have observed the negative relationship between centrality and action among the informed, which would have generated misleading policy implications.
Secondly, these results highlight the importance of being sensitive to a local context before implementing interventions aimed at changing behavior. It may be tempting to suppose that all that will be required to change behavior is to spread true, sensible information. However, if the recipients of the information regard the action encouraged to be uncertain, or even merely socially sensitive, then the spread of behavior will likely take a very different form than the spread of information.
Thirdly, the fact that a core group of early adopters appear to have been important to subsequent behavior is consistent with critical mass theory, empirical studies of cascades in technology adoption, and the spread of political communication technologies (see, for example, Centola Reference Centola2013; Ferrali et al. Reference Ferrali2019; Foster and Rosenzweig Reference Foster and Rosenzweig1995); however, little is known about how to encourage this initial group. Our study hints that a tight-knit group may be a fruitful target for the initial group, establishing a local pocket of common knowledge that makes attending less costly within the group and encouraging action by others outside the initial group later on. It should be noted that in our study, this group of early adopters was self-selected; whether interventions that require early participation by a few are equally effective as those relying on voluntary early participation remains to be seen via future research.
Lastly, our results corroborate methodological work about the importance of disaggregating social-tie types when diffusion is link specific (Larson and Rodriguez Reference Larson and Rodriguez2020). We find that secondary, social information, such as about the veracity, value, and risk associated with a future event, is an example of link-specific diffusion—villagers selectively shared with social ties with whom they share meals and homestead visits over other types of ties. Measuring the relevant ties and disaggregating tie data are essential to uncovering link-specific spread.
Supplementary Material
Online appendices are available at: https://doi.org/10.1017/S0007123421000454
Data Availability Statement
Replication data and code for this article can be found in the Harvard Dataverse at: https://doi.org/10.7910/DVN/AC1GCB and in GitHub at: https://github.com/prodriguezsosa/FromChatterToAction.
Acknowledgments
We thank Erin Baggott, Pablo Barberá, Robert Bates, Andrew Bertoli, Brett Carter, Andrew Coe, Cali Ellis, Ben Graham, Franziska Keller, James Lo, Jonathan Markowitz, Bryn Rosenfeld, Amy Erica Smith, Dustin Tingley, the Yale University Leitner Seminar participants, and especially Pia Raffler for helpful comments on pieces of this project. We are also grateful to: Vianney Mbonigaba and Innovations for Poverty Action's Uganda Office for crucial advice about implementing the study; Juliet Ajilong and an excellent team of research assistants for their efforts collecting the data in Uganda; Batuhan Gorgulu for careful data-entry assistance; and the study participants for generously giving their time.
Financial Support
We received support for this project from Harvard University's Institute for Quantitative Social Science.
Competing Interests
None.