INTRODUCTION
The Amazon Basin holds the world's most diverse freshwater fish fauna (Henderson & Crampton Reference HENDERSON and CRAMPTON1997, Saul Reference SAUL1975), with probably more than 2500 species (Junk & Soares Reference JUNK and SOARES2001). About half of these species are restricted to small tributaries of large rivers, many of which dissect the upland or terra firme interfluves in a vast and dense hydrological network (Junk et al. Reference JUNK, SOARES and BALEY2007). These upland streams usually drain heavily leached soils. Their waters are poor in nutrients and dissolved solids, and are characterized by a low primary productivity and a low biomass of aquatic macrophytes (Lowe-McConnell Reference LOWE-MCCONNELL1987, Mendonça et al. Reference MENDONÇA, MAGNUSSON and ZUANON2005, Walker Reference WALKER, Tundisi, Bicudo and Matsumura-Tundisi1995). Yet, the surrounding forests provide a mix of food resources (arthropods, leaves, flowers, fruits, seeds and pollen) in support of the fish communities, which generally show a high species diversity (dos Anjos & Zuanon Reference DOS ANJOS and ZUANON2007, Goulding et al. Reference GOULDING, LEAL-CARVALHO and FERREIRA1988, Knöppel Reference KNÖPPEL1970, Lowe-McConnell Reference LOWE-MCCONNELL1987).
Most ecological studies of upland-stream fish communities have focused on habitat use, feeding habits, spatial and temporal distribution, and community structure (Arbeláez et al. Reference ARBELÁEZ, GÁLVIS, MOJICA and DUQUE2004, Bührnheim & Cox-Fernandes Reference BÜHRNHEIM and COX-FERNANDES2001, Reference BÜHRNHEIM and COX-FERNANDES2003, dos Anjos & Zuanon Reference DOS ANJOS and ZUANON2007, Henderson & Walker Reference HENDERSON and WALKER1986, Reference HENDERSON and WALKER1990; Knöppel Reference KNÖPPEL1970, Sabino & Zuanon Reference SABINO and ZUANON1998, Silva Reference SILVA1993). Fish catches per unit of effort were almost five times higher in floodplains of the Amazon River than in floodplains of the Rio Negro River (Saint-Paul et al. Reference SAINT-PAUL, ZUANON, CORREA, GARCIA, FABRE, BERGER and JUNK2000). Low concentrations of dissolved mineral salts in water bodies might restrict certain fish species by affecting their ionic and acid-basic regulation (Mendonça et al. Reference MENDONÇA, MAGNUSSON and ZUANON2005). Although some ecological studies included tributaries at wide spatial scales (Crampton Reference CRAMPTON, Queiroz and Crampton1999, Galacatos et al. Reference GALACATOS, STEWART and IBARRA1996, Galvis et al. Reference GALVIS, MOJICA, DUQUE, CASTELLANOS, SÁNCHEZ-DUARTE, ARCE, GUTIÉRREZ, JIMÉNEZ, SANTOS, VEJARANO, ARBELÁEZ, PRIETO and LEIVA2006, Saul Reference SAUL1975, Silvano et al. Reference SILVANO, DO AMARAL and OYAKAWA2000), few specifically addressed fish community turnovers between geological units in upland forests.
In Colombian Amazonia, two geological units are widely found: the Pebas formation and the Terciario Superior Amazónico (Tsa) unit (PAT 1997, Proradam 1979). Deposits of the Pebas formation are generally fine-textured (Hoorn Reference HOORN1994). They are known for their comparatively high base concentrations (Kalliola & Flores Paitan Reference KALLIOLA and FLORES PAITAN1998), and are presumably of Andean origin (Hoorn Reference HOORN1994, Lips & Duivenvoorden Reference LIPS and DUIVENVOORDEN1996, Vonhof et al. Reference VONHOF, WESSELINGH and GANSSEN1998). In contrast, geostratigraphic studies in the middle and lower Caquetá basin, about 200 km north of Leticia, suggested that sediments of the Tsa unit originated from the Guiana Shield (Hoorn Reference HOORN1994, Reference HOORN2006). Duivenvoorden & Lips (Reference DUIVENVOORDEN and LIPS1993, Reference DUIVENVOORDEN and LIPS1995) associated this unit to soils that were more leached and showed coarser textures than soils developed in Pebas sediments, and to forests which differed in tree species composition compared to forests found on Pebas sediments.
This study aimed to compare fish communities in upland streams draining the Pebas or Tsa units, in the southernmost part of Colombian Amazonia. Soil and water samples were taken to corroborate our assumptions that the Pebas streams would show higher levels of conductivity and elemental concentrations than the Tsa streams. We expected to find that the fish communities from the Pebas streams would show the highest biomass and species richness, and that the species composition would vary significantly between the two upland systems.
METHODS
Study area and sampling locations
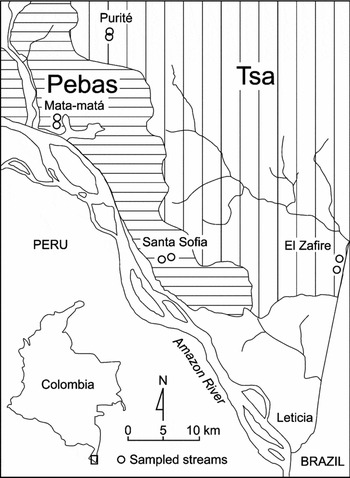
Fieldwork took place between November 2005 and March 2006 in the southern part of Colombian Amazonia (Figure 1). This area is characterised by a humid and hot equatorial climate. The annual rainfall at Leticia averages 3400 mm (over 1973–2004). Mean annual temperature is 25.7 °C, and mean annual relative humidity 86% (Galvis et al. Reference GALVIS, MOJICA, DUQUE, CASTELLANOS, SÁNCHEZ-DUARTE, ARCE, GUTIÉRREZ, JIMÉNEZ, SANTOS, VEJARANO, ARBELÁEZ, PRIETO and LEIVA2006, Rudas-Lleras & Prieto-Cruz Reference RUDAS-LLERAS and PRIETO-CRUZ2005).

Sampling was performed in forest streams draining uplands belonging to either the Tsa unit or the Pebas formation. Based on geological maps (PAT 1997, Proradam 1979) (Figure 1), two locations were chosen in each geological unit. The two Pebas locations included forest streams near the village of Santa Sofia (03°58′44″S, 70°06′58″W; 03°58′58″S, 70°07′38″W) and near the Mata-matá River biological station (03°48′23″S, 70°15′58″W; S03°47′53″S, 70°15′58″W), whereas the two Tsa locations included forest streams near the El Zafire Biological Station (04°00′26″S, 69°53′47″W; 03°59′5″S, 69°53′24″W) and the headwaters of the Purité River (03°41′54″S, 70°12′24″W; 03°41′38″S, 70°12′27″W). Both Mata-matá and Purité sampling locations were within the Amacayacu National Park.
At each sampling location, two upland streams were chosen based on advice from local people. The lack of detailed cartography precluded stream pre-selection. Sampling was probably in second-order or third-order streams. Criteria for stream choice were: (1) the stream source must be inside a well-developed forest (with a dense canopy cover) that lacked signs of recent human disturbance; (2) the stream channel must be located above the floodplains of the main rivers (Purité, Mata-matá and Amazon rivers), implying that the stream water level was not affected by the hydric pulse of these rivers; (3) the stream should not dry up at any time; and (4) the stream channel should not be wider than 6 m.
Soil and water sampling
Along each stream, between three and five 700-cm3 superficial soil samples (A horizon, 0–5 cm depth) were collected in the floodplain forest surrounding the streams. They were taken at distances of 3–5 m from the stream channel and 10–15 m apart. Three 500-ml water samples from the middle part of the stream were taken on sampling days 0, 2 and 4. Water samples were put in plastic bottles, which were submerged in running water for cooling, and afterwards stored in a refrigerator. Also, pH, conductivity, dissolved oxygen and temperature were measured in each stream on sampling days 0, 2 and 4, using a portable multiparameter HACH Sension TM156 meter. Soil and water samples were analysed at the IGAC (Instituto Geográfico “Agustín Codazzi”) soil laboratory in Bogotá, Colombia. Soil analyses comprised: granulometry with a Boyoucous hydrometer, after dispersion with Na2P2O7; pH (H2O) in a volumetric 1:1 soil:water solution; exchangeable acidity (meq per 100 g) by extraction in 1 N KCl and titration with 0.1 N NaOH in the presence of phenolphthalein; percentage of organic C, according to the Walkley–Black method; exchangeable bases (meq per 100 g) after extraction with 1 N NH4 OAc (pH = 7) with Ca and Mg complexed with EDTA, and Na and K measured by flame photometry; cation exchange capacity (CEC; meq per 100 g) using the 1 N NH4OAc (pH = 7) method; and available P (ppm) by extraction with 0.1 N HCl and 0.13 N NH4F, according to BrayII (IGAC 1990). Water analyses comprised: pH by potentiometry; conductivity (μS cm−1); calcium and magnesium (meq L−1) by atomic absorption; potassium and sodium (meq L−1) by atomic emission; total bases (meq L−1); sulphates (meq L−1) by turbidimetry; and chlorides, carbonates and bicarbonates (meq L−1) by potentiometric titulation (IGAC 1990).
Fish sampling
In each stream, four daily sampling events took place. Each sampling day consisted of a 5-h routine from 14h30 to 19h30, covering afternoon, dusk and night hours, during which three fishing methods were used: one cast net (multifilament, 1.8 m radius, 1.5 cm2 mesh) for 5 h, two dip nets (50 cm diameter, 0.5 mm mesh) for 2 h (14h30–16h30) and one seine net (2 × 3.5 m, 0.5 mm mesh) for 3 h (16h30–19h30). The sampling started at a fixed position, alternating each day between upstream and downstream transects of 100 m, and attempting to cover every fish microhabitat within the transect. All captured individuals were preserved in formalin (10%). At the Humboldt Institute (IAvH) in Villa de Leyva, Colombia, fish were preserved in ethanol (70%), identified, and counted. All individuals of a species captured on each sampling day were weighed together using an electronic balance. Weights were approximated to the nearest gram and only measurements higher than 10 g were recorded; for those lower than 10 g, a uniform value of 5 g was assigned. Samples were deposited in the fish collection of the IAvH (IAvHP 8220 to 8425 and IAvHP 8647 to 9459).
Data analyses
In order to identify the main patterns in the soil and water physicochemical variables, Principal Components Analysis (PCA) was applied. Averages for each stream were used as input values for each PCA. In the water analyses, three variables (sulphate, chloride and carbonate concentrations) were discarded for having too many undetected values (i.e. below the detection threshold of the analytical method). Four samples showed undetected values for calcium and/or magnesium concentrations; for the averages used in the PCA, those values were changed to 0.1 of the smallest detected amount for that particular variable. Field pH and conductivity were not used in the PCA, but served to identify outliers from the laboratory analyses of the water samples. Based on that criterion, two samples from Tsa-El Zafire were removed for showing highly elevated values of conductivity (46.9 and 55.6 μS cm−1) compared with the field measurements (average = 12.4, max = 23.8 μS cm−1) and to the other samples. All variables used in PCA were inspected for normality using a Kolmogorov–Smirnov test with Lilliefors significance correction. Calcium concentration was ln-transformed to achieve normality following Zar (Reference ZAR1996). Samples scores along the main PCA axes were tested for differences between geological units and between sampling locations using one-way ANOVA. When the variances among sampling locations were significantly different, a Tukey's honest significant difference post hoc test was computed to compare location means. In all ANOVA analyses, residuals showed normal distributions.
In order to get an overall estimate of the fish species richness in the area, species accumulation tables and richness estimators were computed for all sampling days using EstimateS 8.0.0 (http://www.purl.oclc.org/estimates) with 1000 randomizations without replacement and shuffling of individuals among samples within species. The index used for actual richness was Species Observed (Mau Tao), with its 95% confidence intervals, as computed by the software. Two abundance-based richness estimators were used: Chao1 with bias correction and its 95% confidence intervals, and Abundance-based Coverage Estimator (ACE) and its standard deviation, with 10 individuals as the upper abundance limit for infrequent species.
Correlations between species richness, biomass and numbers of individuals, with stream averages of the water variables were examined by means of Pearson correlation coefficients. Differences in fish species richness, numbers of individuals and total biomass were examined between geological units and between sampling locations. For this purpose, ANOVA with repeated measures was performed, using streams as replicates and the four sampling days as four levels of variation of the within-stream sampling factor. ANOVA, Pearson correlation and PCA analyses were performed in SPSS 11.5.
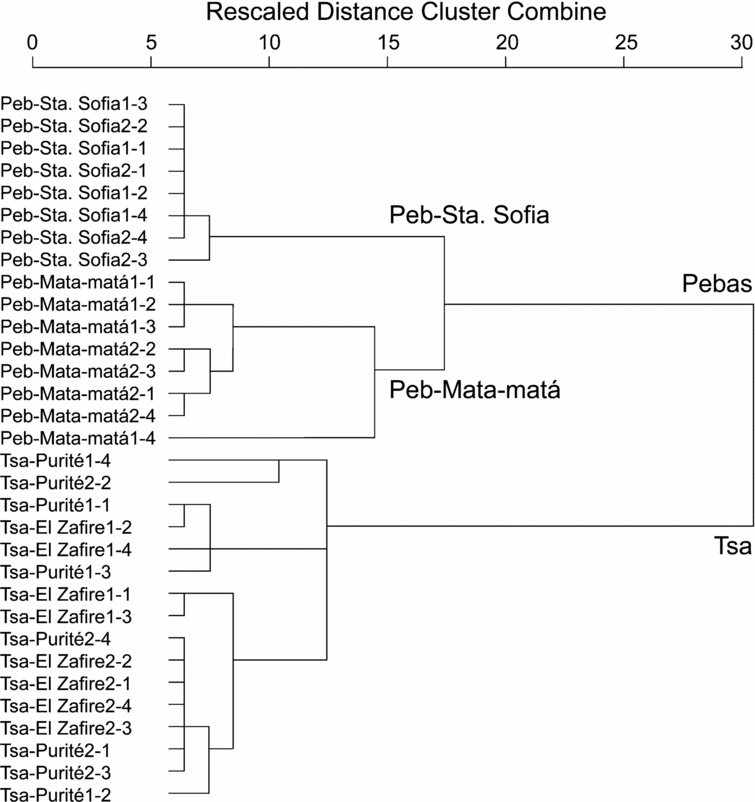
Patterns of fish species composition were studied by means of detrended correspondence analysis (DCA) on the basis of numbers of individuals per species for each sampling day. Detrended correspondence analysis was performed using CANOCO for Windows (Version 4.51), with detrending by second-order polynomials, scaling on inter-sample distances, biplot scaling and down-weighting of rare species. The DCA scores were used for a hierarchical cluster classification with the nearest neighbour method, measuring the squared Euclidian distance between sampling days, using SPSS 11.5.
RESULTS
Soil and water analyses
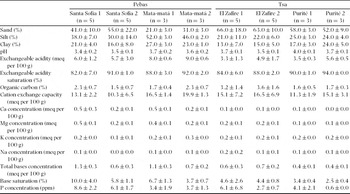
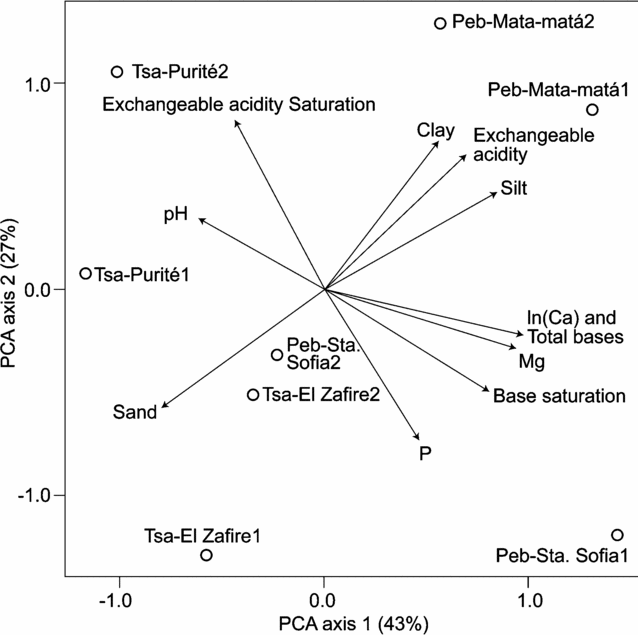
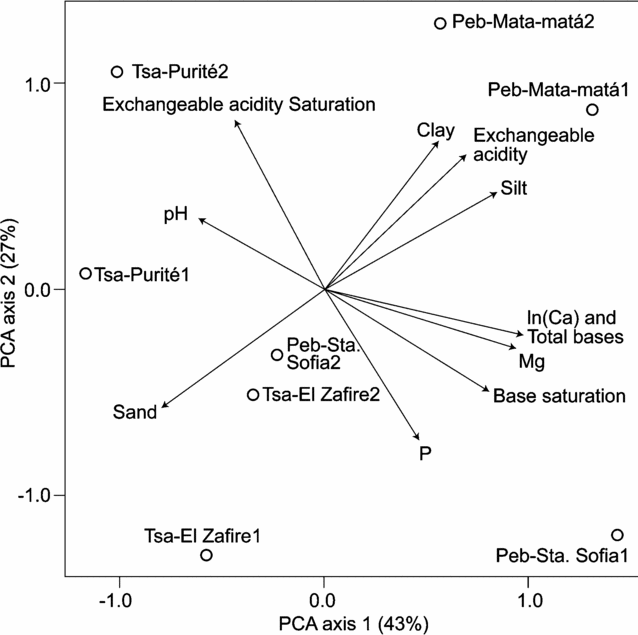
The first axis of the PCA of the soil variables (Table 1, Figure 2) explained 43% of the variance and significantly separated Pebas and Tsa samples (ANOVA F = 13.0, P = 0.01). As shown by the loadings, Tsa samples tended to be comparatively sandy, whereas Pebas samples tended to be siltier, with higher levels of exchangeable acidity, Ca, Mg and total bases. The sampling locations did not differ significantly along the first or second PCA axis (ANOVA, P > 0.05).
Physicochemical data of soil samples (mean ± SD) taken in floodplain forests along eight upland streams, arranged over two geological units (Pebas and Tsa) and four sampling locations.

Results of a PCA based on soil sample averages of 15 physicochemical variables recorded in floodplains along eight upland streams. The scatter plot shows the scores along the first and second PCA axis for each stream, labelled according to geological unit, sampling location and stream number. The arrows denote the variable loadings on the axes (only variable loadings > 0.6 along PCA axis 1 or 2 are depicted).
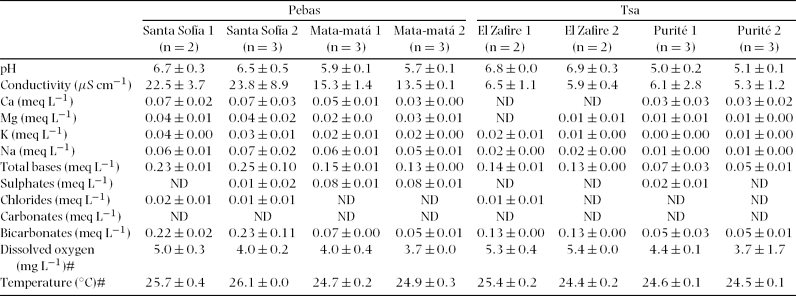
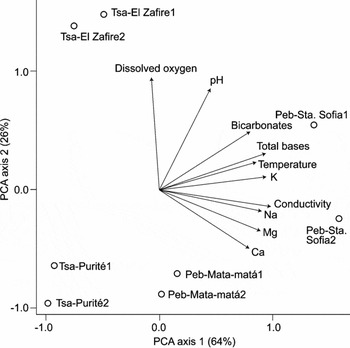
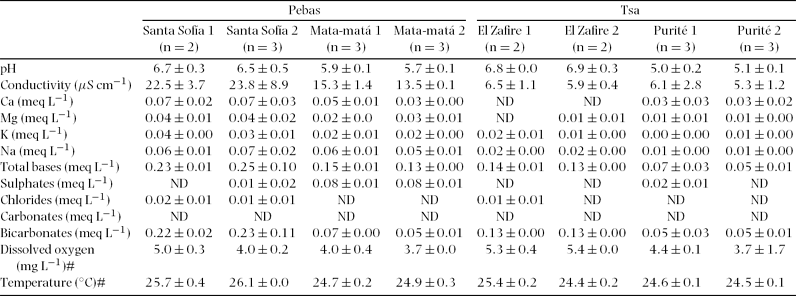
In the PCA of the water analytical variables (Table 2, Figure 3), the first axis, which explained 67% of the variation, yielded a significant separation of the Pebas and Tsa samples (ANOVA F = 12.0, P = 0.01). Regarding sampling locations, there was a segregation between the two Pebas locations (Peb-Santa Sofía and Peb-Mata-matá; ANOVA F = 128, P < 0.01, Tukey's HSD test). Conductivity, concentrations of bases (Ca, Mg, K and Na), bicarbonates, and temperature, showed higher values in Pebas samples, especially in Peb-Santa Sofía, than in Tsa samples. Along the second PCA axis, which explained 26% of the variance, the geological units did not differ (ANOVA F = 0.7, P = 0.4), but the samples from Tsa-El Zafire had significantly higher scores than the other locations (ANOVA F = 24.5, P < 0.01, Tukey's HSD test) due to their higher pH and dissolved oxygen.
Physicochemical data of water samples (mean ± SD) taken in eight upland streams, arranged over two geological units (Pebas and Tsa) and four sampling locations (ND = undetected values; # field measurements).
Results of a PCA based on sample averages of ten water physicochemical variables recorded in eight upland streams. The scatter plot shows the scores along the first and second PCA axis for each stream, labelled according to geological unit, sampling location and stream number. The arrows denote the variable loadings on the axes.

Ichthyofauna
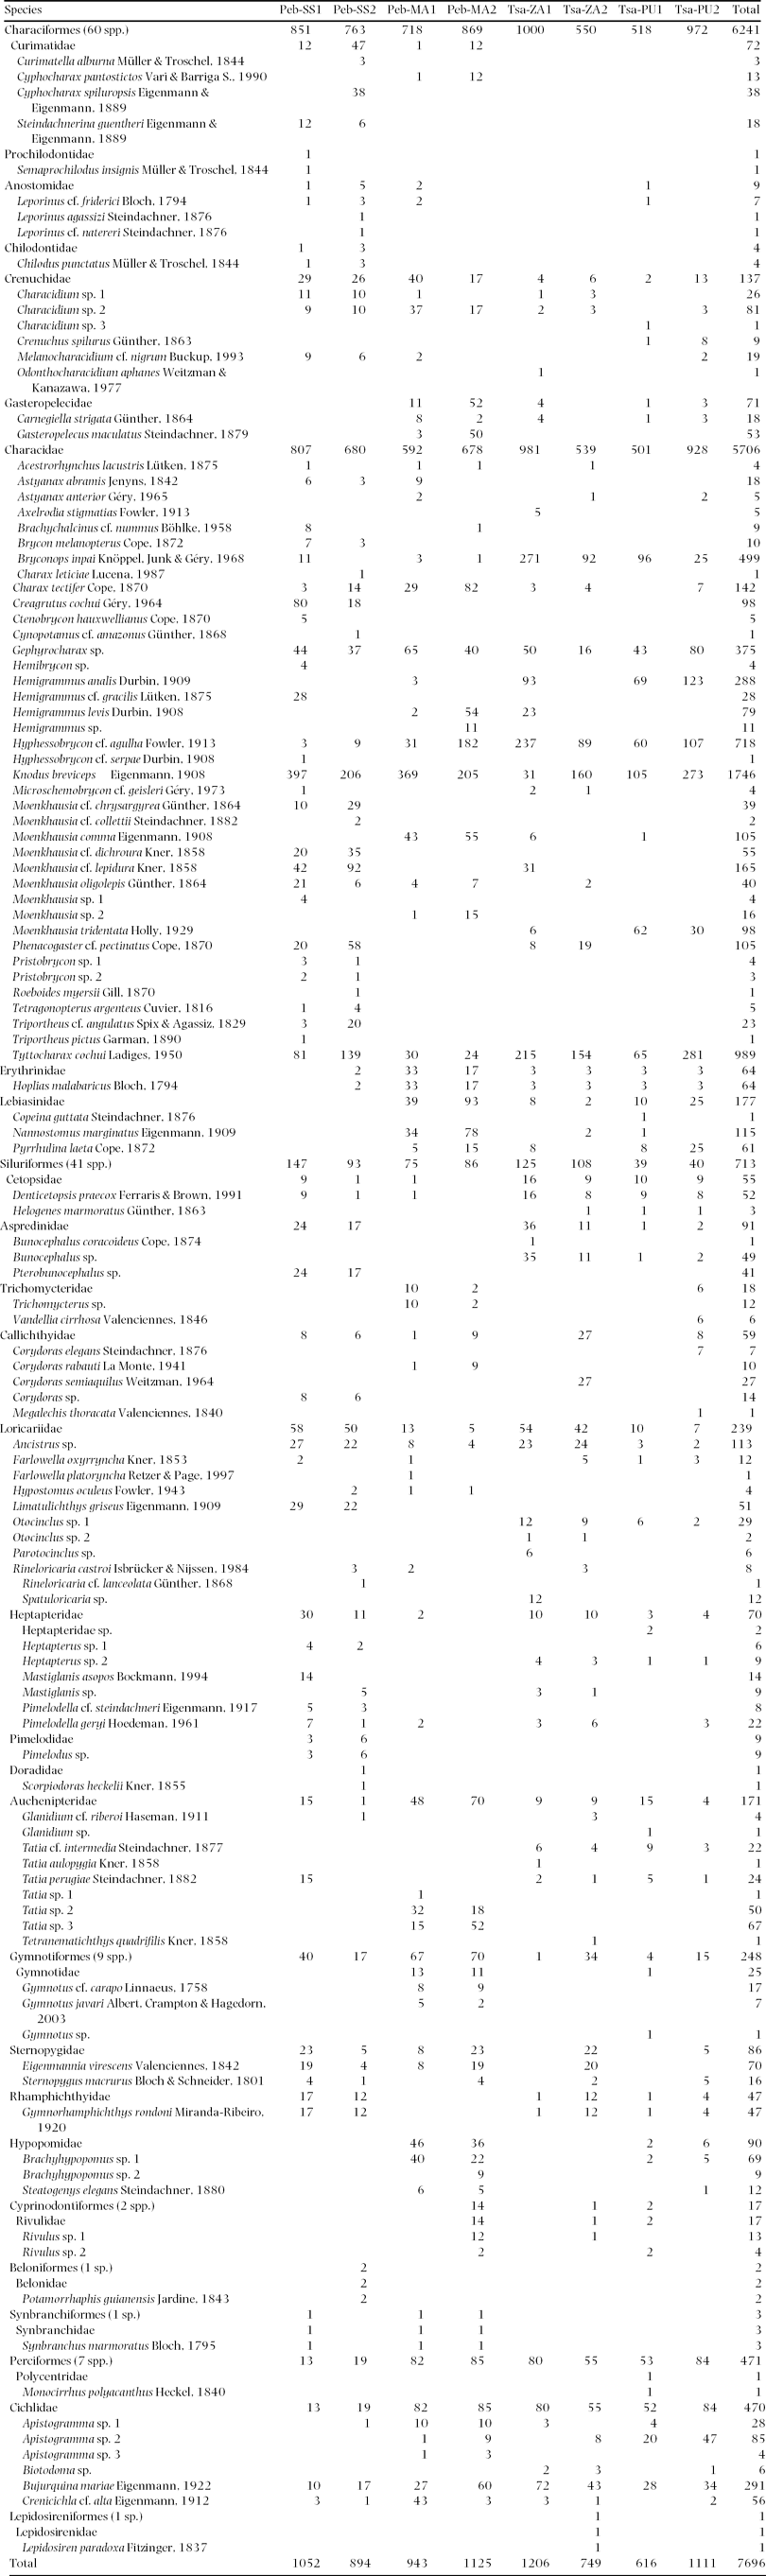
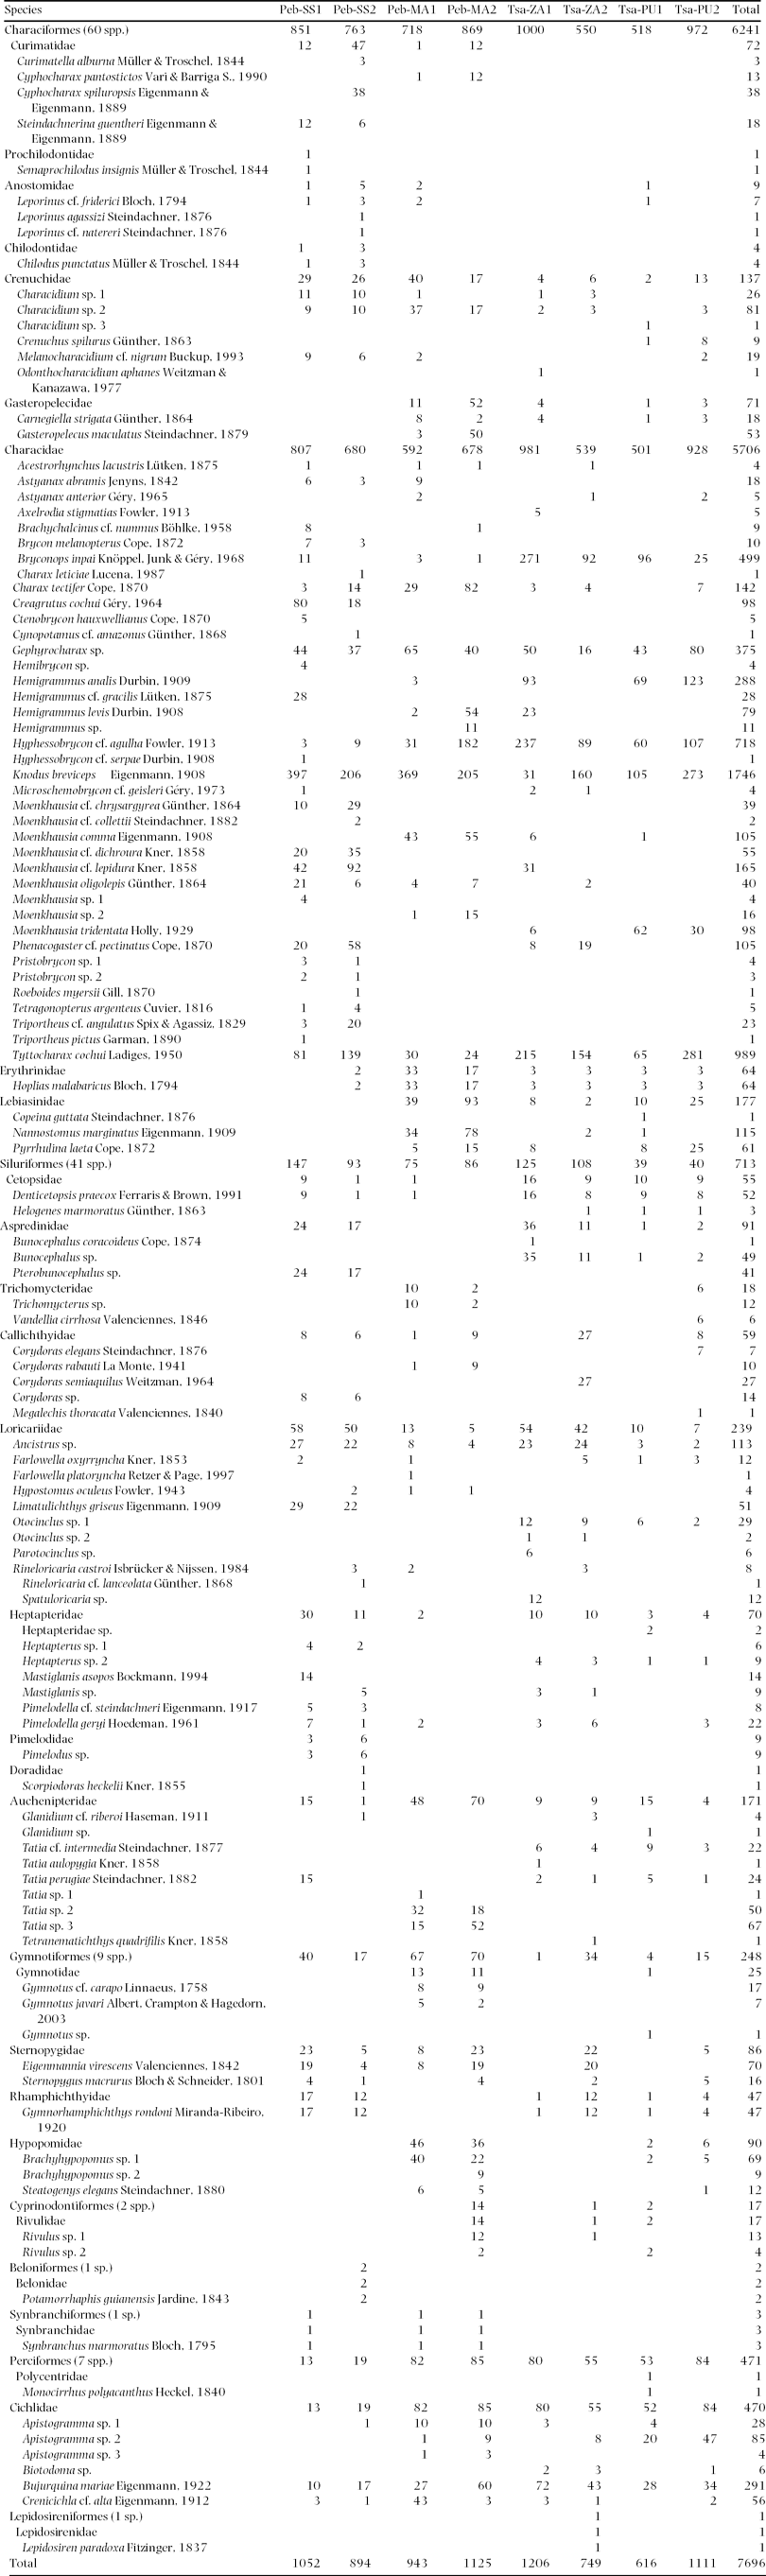
In total, 7696 fish individuals were captured, belonging to eight orders, 28 families and 122 species (Appendix 1). The orders Characiformes and Siluriformes comprised 83% of the total species. These orders were also the most abundant, in particular Characiformes, which accounted for 81% of the captured individuals. The family Characidae showed the highest species richness (32%), followed by Loricariidae (9%) and Auchenipteridae (7%). The most abundant family was Characidae (74%), followed by Cichlidae (6%) and Loricariidae (3%). According to the Chao1 richness estimator, all samples contained 173 species (139–272 as 95% confidence interval). The ACE predicted 140 species (SD = 2.5), whereas the observed richness was 122 species (109–135 as Mao Tau 95% confidence interval). Thus, the observed richness accounted for 71% to 87% of the average estimated species number in the entire area.
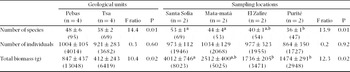
The average richness per stream was 43 species, ranging from 35 species in stream Tsa-Purité1, to 54 in stream Peb-Santa Sofía1. Pebas streams had 1.3 times more species than Tsa streams, and more than twice the total biomass (Table 3). The number of individuals did not differ between geological units or sampling locations.
Number of species, number of individuals, and total biomass (mean ± SD, cumulative totals in parentheses) in eight upland streams, arranged by geological unit and sampling location. F ratio and P are ANOVA results; a, b indicate results of Tukey's HSD test (P < 0.05).

Species richness was highly correlated with conductivity (r = 0.96, N = 8, P < 0.01), and water concentrations of Mg (r = 0.84, N = 8, P < 0.01), K (r = 0.88, N = 8, P < 0.01) and Na (r = 0.93, N = 8, P < 0.01). Biomass was strongly correlated with conductivity (r = 0.94, N = 8, P < 0.01), and water concentrations of Mg (r = 0.90, N = 8, P < 0.01), Na (r = 0.87, N = 8, P < 0.01) and dissolved oxygen (r = 0.88, N = 8, P < 0.01). The number of individuals, however, was not correlated with any water analytical variable. Biomass and species richness were significantly correlated (r = 0.90, N = 8, P < 0.01).
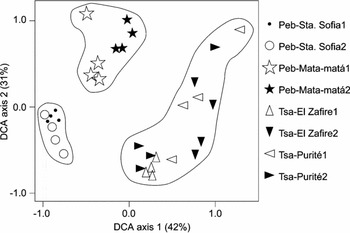
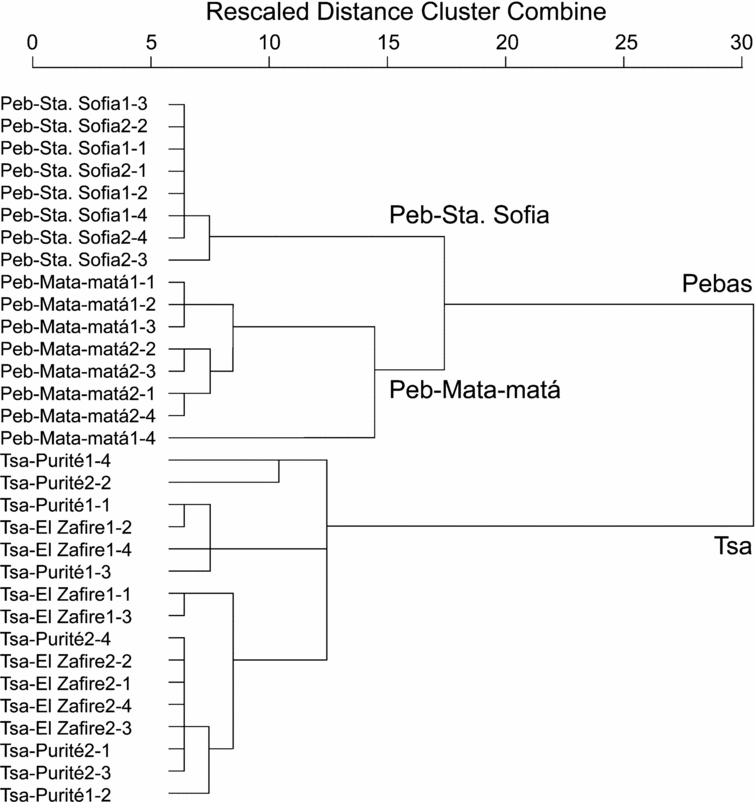
The graphic representation of the DCA (Figure 4) clearly grouped the daily samples by geological unit. The subsequent cluster analysis (Figure 5) confirmed that the Pebas sampling locations were well separated in the ordination diagram of the first and second DCA axes. However, the Tsa samples failed to separate according to sampling location.
Results of a DCA based on the number of individuals per species for each sampling day in eight upland streams. The scatter plot shows the scores along the first and second DCA axis for 32 daily samples, labelled according to geological unit, sampling location, and stream number. Delineations illustrate the main groups formed by Hierarchical Cluster Analysis (Figure 5).

Dendrogram of a Hierarchical Cluster classification based on square Euclidean distances between the daily sample scores along DCA axis 1 and 2, shown in Figure 4. Each daily sample is labelled according to geological unit, sampling location, stream number and day number.
DISCUSSION
Fish biomass, species richness and composition between geological units and sampling locations
The topsoil samples of the Tsa unit were sandier, had a lower CEC and lower exchangeable cation concentrations. Water samples from streams draining this unit had distinctly lower base concentrations compared with samples from the Pebas Formation. The Pebas streams supported more than twice the fish biomass found in Tsa streams. Total fish biomass was highly correlated with conductivity, and Mg and Ca concentrations. These results are in line with the positive correlations between fish biomass and water nutrient concentration documented elsewhere in Amazonia (Galacatos et al. Reference GALACATOS, STEWART and IBARRA1996, Galvis et al. Reference GALVIS, MOJICA, DUQUE, CASTELLANOS, SÁNCHEZ-DUARTE, ARCE, GUTIÉRREZ, JIMÉNEZ, SANTOS, VEJARANO, ARBELÁEZ, PRIETO and LEIVA2006, Ibarra & Stewart Reference IBARRA and STEWART1989, Saint-Paul et al. Reference SAINT-PAUL, ZUANON, CORREA, GARCIA, FABRE, BERGER and JUNK2000).
Tsa streams supported a lower fish species richness than Pebas streams. Since the number of individuals captured was not significantly different, this difference was probably not due to undersampling. A high correlation was found between stream species richness and conductivity. Conductivity values (mean = 6.0 μS cm−1, range = 5.3–6.5 μS cm−1) and total species richness (69 species) of Tsa streams were quite similar to values reported from Manaus, Brazil (mean = 3.7 μS cm−1, range = 3.0–8.0 μS cm−1, 49 species; Mendonça et al. Reference MENDONÇA, MAGNUSSON and ZUANON2005). Pebas streams showed conductivity and species richness values (mean = 18.8 μS cm−1, range = 13.5–23.8 μS cm−1, 95 species) similar to an upland stream draining fluvial terraces of the Amazon River near Leticia, Colombia (mean = 30.6 μS cm−1, range = 18.0–38.0 μS cm−1, 120 species in Arbeláez et al. (Reference ARBELÁEZ, GÁLVIS, MOJICA and DUQUE2004), which increased to 137 following more recent surveys by Galvis et al. (Reference GALVIS, MOJICA, DUQUE, CASTELLANOS, SÁNCHEZ-DUARTE, ARCE, GUTIÉRREZ, JIMÉNEZ, SANTOS, VEJARANO, ARBELÁEZ, PRIETO and LEIVA2006).
Fish species composition differed significantly between geological units. Species turnover was not related to distance between sampling locations, since streams 14 km away from each other had highly differentiated faunas (Peb-Mata-matá and Tsa-Purité), whereas the two samples from Tsa, 50 km apart from each other, had quite similar faunas. In upland streams, some fish taxa may not tolerate extremely low levels of elemental concentrations. This could explain the divergence of species assemblages in a mosaic of physical-chemical conditions (Mendonça et al. Reference MENDONÇA, MAGNUSSON and ZUANON2005). Possibly, differences in forest plant composition between the two geological units contributed to the divergent patterns in fish composition, as well. A differential distribution of stream fish species was also observed between two drainage basins that differed in soil texture and water properties (average conductivity and suspended particles) in the Reserva Florestal Adolfo Ducke, Central Amazonia (Mendonça et al. Reference MENDONÇA, MAGNUSSON and ZUANON2005). Faunal distribution patterns can be due to biogeographic history or to ecological requirements of species relative to habitat conditions related to soil geochemistry (Tuomisto Reference TUOMISTO2007). Because of the short distances along which the species turnover occurred in the present study, the latter seems more probable.
Ichthyofauna and total species richness
The dominance in number of species and individuals of Characiformes, followed by Siluriformes, Perciformes (mainly Cichlidae) and Gymnotiformes, is commonly found in Amazonian fish communities (Galvis et al. Reference GALVIS, MOJICA, DUQUE, CASTELLANOS, SÁNCHEZ-DUARTE, ARCE, GUTIÉRREZ, JIMÉNEZ, SANTOS, VEJARANO, ARBELÁEZ, PRIETO and LEIVA2006, Goulding et al. Reference GOULDING, LEAL-CARVALHO and FERREIRA1988, Lowe-McConnell Reference LOWE-MCCONNELL1987, Val & de Almeida-Val Reference VAL and DE ALMEIDA-VAL1995). In north-west Amazonia upland streams, the genera Moenkhausia and Hemigrammus (Characidae) appear to be particularly diverse (Arbeláez et al. Reference ARBELÁEZ, GÁLVIS, MOJICA and DUQUE2004, Galacatos et al. Reference GALACATOS, STEWART and IBARRA1996), which was confirmed in this study (4 and 9 species, respectively; Appendix 1). Six species of Tatia (Auchenipteridae) were captured, which is a high number for upland streams. Three of these and one species of Bunocephalus (Aspredinidae) were sampled exclusively in Tsa locations and are probably new to science. With 122 species captured in eight streams, our study confirmed the high fish species richness in Amazonian upland streams (dos Anjos & Zuanon Reference DOS ANJOS and ZUANON2007, Knöppel Reference KNÖPPEL1970, Lowe-McConnell Reference LOWE-MCCONNELL1987, Mendonça et al. Reference MENDONÇA, MAGNUSSON and ZUANON2005). Totals of 137 and 143 species were captured in two streams near Leticia, Colombia (Arbeláez et al. Reference ARBELÁEZ, GÁLVIS, MOJICA and DUQUE2004, Galvis et al. Reference GALVIS, MOJICA, DUQUE, CASTELLANOS, SÁNCHEZ-DUARTE, ARCE, GUTIÉRREZ, JIMÉNEZ, SANTOS, VEJARANO, ARBELÁEZ, PRIETO and LEIVA2006). Three lowland tributaries of the Napo basin in Ecuador yielded 104 species (Galacatos et al. Reference GALACATOS, STEWART and IBARRA1996). In contrast, surveys in Central Amazonia reported only 61 species in nine streams (dos Anjos & Zuanon Reference DOS ANJOS and ZUANON2007), 53 species in three streams (Knöppel Reference KNÖPPEL1970), or even fewer species in an unspecified number of streams (Bührnheim & Cox-Fernandes Reference BÜHRNHEIM and COX-FERNANDES2003, Henderson & Crampton Reference HENDERSON and CRAMPTON1997, Mendonça et al. Reference MENDONÇA, MAGNUSSON and ZUANON2005). Tributaries of the Juruá River in Brazilian Amazonia yielded 35 species in four streams (Silvano et al. Reference SILVANO, DO AMARAL and OYAKAWA2000). The above comparisons are hazardous because different fish sampling protocols were applied, which influence species richness estimates (dos Anjos & Zuanon Reference DOS ANJOS and ZUANON2007).
The Chao1 estimator predicts richness based on the number of singletons (species with only one individual) and doubletons (species with two individuals) in each step of the sample accumulation procedure. In contrast, ACE uses a subjective number of individuals (10 in this case) to distinguish between infrequent and abundant species, and estimates species richness based on the occurrence of these infrequent species (Chao Reference CHAO, Balakrishnan, Read and Vidakovic2005). Because many species occurred with only one individual (19%), the Chao1 estimator predicted a larger richness (173 species) than ACE (140 ± 2.5 species), particularly in its upper 95% confidence interval (272 species). Even though the observed richness (122 species) was significantly lower than the estimated richness, it accounted for more than 71% of the latter. Its upper 95% confidence interval (135 species) was not very different from the estimated lower confidence intervals (139 and 137.5 species), implying that the data probably represented adequate approximations of the regional species richness.
ACKNOWLEDGEMENTS
Financial and logistical support was given by Tropenbos-Colombia, WWF-Education for Nature- Russel E. Train Fellowship programme, Institute for Biodiversity and Ecosystem Dynamics (IBED), Idea Wild, Instituto Alexander von Humboldt and Fundación BioDiversa Colombia. María Cristina Peñuela, Iván Arce, Juan David Bogotá, Donald Taphorn (Characiformes taxonomy), Alexandro Banda (map of Colombia), staff from the El Zafire field station and the Amacayacu National Park, and the communities of Santa Sofía, Mocagua and San Martín helped substantially. This study was part of the MSc in Tropical Ecology at the Universiteit van Amsterdam.
Number of individuals of fish taxa recorded in eight upland streams, arranged over two geological units (Peb = Pebas, Tsa = Terciario Superior Amazónico) and four sampling locations (SS = Santa Sofía; MA = Mata-Matá; PU = Purité; ZA = El Zafire).