INTRODUCTION
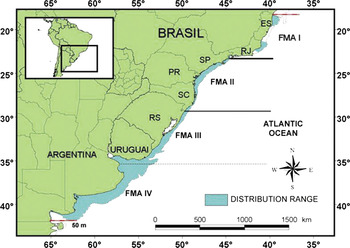
Phenotypic data such as osteological and morphological characters as well as coloration patterns, along with other proxies such as molecular biology, reproduction, contaminant loads, parasite and feeding ecology, can offer valuable insights to identify demographically discrete units for management and conservation of threatened or exploited cetacean populations (e.g. Kasuya et al., Reference Kasuya, Miyashita and Kasamatsu1988; Christensen et al., 1990; Perrin et al., Reference Perrin, Akin and Kashiwada1991; Heyning & Perrin, Reference Heyning and Perrin1994; Andrade et al., Reference Andrade, Pinedo and Pereira1997; Wang et al., Reference Wang, Chou and White1999, Reference Wang, Chou and White2000b; Rodriguez et al., Reference Rodriguez, Rivero and Bastida2002; Perrin et al., Reference Perrin, Dolar and Amano2003; Secchi et al., Reference Secchi, Danilewicz and Ott2003; Jefferson & Van Waerebeek, Reference Jefferson and Van Waerebeek2004). However, for cetaceans, because it is difficult to assemble large sample sizes of fresh specimens, there are only a few studies with measurements of external morphology (e.g. Christensen et al., Reference Christensen, Haug and Wiig1990; Perrin et al., Reference Perrin, Akin and Kashiwada1991; Gao et al., Reference Gao, Zhou and Wang1995; Wang et al., Reference Wang, Chou and White2000b). Franciscana, Pontoporia blainvillei (Gervais & d'Orbigny, 1844), is a small cetacean with distribution restricted to coastal waters of the western South Atlantic, where it is seriously threatened by incidental catches in gillnets. Several studies on genetics and osteology have shown the existence of distinct populations along the coast (Pinedo, Reference Pinedo1991; Secchi et al., Reference Secchi, Wang, Murray, Rocha-Campos and White1998; Higa et al., Reference Higa, Hingst-Zaher and De Vivo2002; Ramos et al., Reference Ramos, Di Beneditto, Siciliano, Santos, Zerbini, Bertozzi, Vicente, Zampirolli, Alvarenga and Lima2002; Lázaro et al., Reference Lázaro, Lessa and Hamilton2004). Four Franciscana Management Areas (FMAs) were proposed using the phylogeographical concept applied to genotypical, phenotypical, population response and distributional data. FMA I: the coastal waters of Espírito Santo and Rio de Janeiro States; FMA II: the coastal waters of São Paulo, Paraná and Santa Catarina States; FMA III: the coastal waters of Rio Grande do Sul and Uruguay; FMA IV: the coastal waters of northern Argentina (Secchi et al., Reference Secchi, Danilewicz and Ott2003).
There is strong evidence that the populations from FMAs I, II and III represent distinct demographic entities with limited gene flow, especially between the former and any other FMA. However, evidence for splitting FMA III from IV is weak. The genetic results from microsatellite analysis of nuclear DNA and molecular analysis of variance of mitochondrial DNA (Ott, Reference Ott2002; Lázaro et al., Reference Lázaro, Lessa and Hamilton2004) indicated no significant differences between franciscana populations from these two FMAs.
Mendez et al. (Reference Mendez, Rosembaum and Bordino2007) analysed the mitochondrial DNA of franciscana samples from distinct locations of Argentina and compared them to data published by Lázaro et al. (Reference Lázaro, Lessa and Hamilton2004), finding evidence for a small-scale structuring. They recommended that, for management purposes, animals from FMA IV should be split further into at least two distinct units named San Clemente and Claromecó populations, both from the northern Buenos Aires coast. Therefore, genetic and morphological studies on a finer scale and with samples from Rio Grande do Sul, Uruguay (FMA III) and distinct locations within Argentina (FMA IV) are needed for improving our understanding about small-scale population structures.
This study aimed at providing additional information about the franciscana phenotype, by examining geographical variation in external morphology and evaluating whether the results are consistent with the proposed FMAs.
MATERIALS AND METHODS
Data
A total of 259 franciscanas caught in gillnets between October 1989 and August 2006 in Rio de Janeiro, São Paulo and Rio Grande do Sul States, Brazil, and Buenos Aires Province, Argentina were classified, respectively, as FMA I to IV, as proposed by Secchi et al. (Reference Secchi, Danilewicz and Ott2003) (Figure 1). Up to 47 external metric characters were measured using standardized methods based on Norris (Reference Norris1961). Measurements were taken to the nearest 0.1 cm or 0.2 cm by trained researchers from each location using a commercial measuring tape.
Map showing the southern and northern limits of the franciscana range and the four proposed Franciscana Management Areas (FMAs) (modified from Secchi et al., Reference Secchi, Danilewicz and Ott2003). Unshaded areas represent gaps in franciscana distribution.

The probable effects of sexual differences were excluded by analysing sexes separately. To exclude the effects of ontogenetic variation, only adults were considered. Prior information about reproductive status allowed the classification of specimens from Rio Grande do Sul, Rio de Janeiro and Argentina into adults and juveniles. For the samples from São Paulo State, adults were selected based on an estimate of body length at attainment of sexual maturity (Rosas & Monteiro-Filho, Reference Rosas and Monteiro-Filho2002).
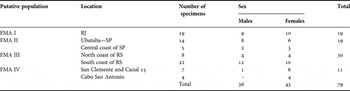
After excluding immature animals, the sample size was reduced to 79 individuals (Table 1). The sample from Argentina was composed of one male and ten females (Table 1). Therefore, FMA IV was included in the analyses of variation in external morphology among the putative populations, only for females.
Number of adult specimens by location, sex and putative population used in the analyses. The only male from Franciscana Management Area (FMA) IV was not included.

RJ, Rio de Janeiro; RS, Rio Grande do Sul; SP, São Paulo.
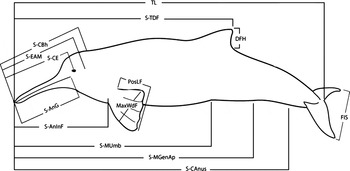
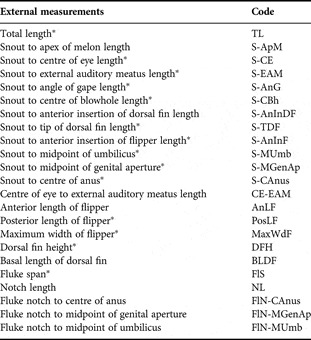
The number of measured characters and the way in which measurements were performed (e.g. on both sides of the body, or just on the left side; as an axial projection or point-to-point) varied among and, sometimes, within locations. Furthermore, measurements were taken by different observers without prior calibration, which could introduce biases in the analyses and result in confounding between systematic differences in measurement procedures and variation among locations. To minimize the risk of possible confounding results due to ‘observer-effect', we decided to: (1) only use the measurements referring to the left body side and which were clearly undertaken in the same way by researchers from FMA I, FMA II and FMA III (Figure 2; Table 2); and (2) exclude all metric characters considered subjective and prone to different interpretations regarding the exact position of limiting points of a measurement (e.g. snout to apex of melon, snout to anterior insertion of dorsal fin, anterior length of flipper and basal length of dorsal fin).
Schematic description of the measurements used in the morphometric analysis of franciscanas.

External morphometric characters common to Franciscana Management Areas (FMAs) I, II and III.

*, measurements used in the analyses with males and females from FMA I, II and III; for definitions of codes see text.
From twenty-three external morphometric characters initially selected, fourteen measurements were finally used in the analyses to examine the existence of variation among the first three FMAs (Table 2; Figure 2). The measurements ‘snout to external auditory meatus length' and ‘snout to midpoint of umbilicus' were not taken from the specimens from Argentina and, therefore, were excluded from the analyses when FMA IV was included in the analyses.
Statistical analyses
The statistical analyses were carried out in R version 2.2.1 (R Development Core Team, 2005). All selected characters, when examined individually, showed approximate normality. Hence, it was considered reasonable to assume a joint multivariate normal distribution for all 14 characters (Manly, Reference Manly1994). Each of the 14 characters was tested individually for differences among localities and between sexes using a two-way analysis of variance (ANOVA).
Before performing multivariate analyses, and to avoid exclusion of animals with only a few missing measurements, absent values for a given specimen were replaced with the expected values of the multivariate normal distribution after conditioning on all observed characters for that specimen (Chattfield & Collins, Reference Chatfield and Collins1980). In the data matrix with 14 characters and 68 individuals, that is, for the analysis carried out for males and females from FMAs I, II and III, 99 cells were filled in missing values. A maximum of 9 missing values were necessary per individual. For the analysis carried out only with females from the four areas, similar methods were employed to estimate the 45 missing values in the matrix of data with 43 specimens and 12 characters. A maximum of 7 missing values were necessary to complete per individual.
A canonical variate analysis (CVA) (Reyment et al., Reference Reyment, Blackith and Campbell1984), was employed to assess variation between males and females from FMA I, FMA II and FMA III, and among the females from all four FMAs. This method maximizes between-group variation in relation to the within-group variation, producing maximal separation between groups. The function ‘lda’ (linear discriminant analysis) from the MASS library of R was applied for this purpose. The multiple-group principal component analysis (MGPCA) was used complementarily. It works similarly to the principal component analysis (PCA) but, instead of starting with the global covariance matrix, it uses the within-group covariance matrix (Thorpe, Reference Thorpe1988). The advantage of MGPCA is its direct relationship to CVA (Thorpe, Reference Thorpe and Felsenstein1983a). When a MGPCA is run on a set of characters and their component scores are used as inputs for CVA, identical results to those of CVA on the original set of characters will be obtained. However, only the former allows for assessing the contribution of within-group components to the between-group discrimination (Thorpe et al., Reference Thorpe, Corti and Capanna1982; Thorpe, Reference Thorpe and Felsenstein1983a, Reference Thorpeb; Thorpe & Leany, Reference Thorpe and Leany1983).
In this study a MGPCA was initially carried out to describe the relationships of growth and size among males and females from FMAs I, II and III and also to describe the relationship among females from all four areas. Variables were standardized to have a mean of zero and variance of one before starting the analysis (Reyment et al., Reference Reyment, Blackith and Campbell1984; Manly, Reference Manly1994). Each of the scores was subject to a two-way ANOVA to evaluate if individual components showed significant differences between sexes and locations. The relative contribution of each of the components for discrimination among groups was verified for both males and females through a one-way ANOVA (see details in Malhotra & Thorpe, Reference Malhotra and Thorpe1997).
A significance level of α = 0.05 was adopted for all analyses. The main differences and similarities among the groups were graphically portrayed by 95% confidence contours (Reyment et al., Reference Reyment, Blackith and Campbell1984) for the estimated mean for each group on the first three canonical variates.
Assessment of ‘observer-effect’
In order to examine whether observed differences between centroids of canonical variates (CV1, CV2 and CV3) could have derived from systematic differences in measurements taken by researchers in different locations, a simulation study was carried out using the results obtained with females from the four areas as if they were ‘true' data. Simulated data were produced with the same number of specimens (N = 43), divided among locations as in the original data.
Hypothetical systematic errors were defined for each area as known deviations in the mean vectors of the 12 characters. FMA III was the reference location, without systematic errors. In FMA I all the measurements were overestimated, with means 10% higher than the correspondent means in FMA III. In FMA II all the measurements were underestimated, with means 10% lower than the correspondent means in FMA III. Finally, in FMA IV half of the measurements were overestimated by 10% while the other half was underestimated by 10%. A total of 300 Monte Carlo simulations were produced. For each simulated data set a CVA was carried out and Mahalanobis distances were calculated among the four centroids (distances I–II, I–III, I–IV, II–III, II–IV and III–IV). Finally, an average Mahalanobis distance was calculated to describe the distance between centroids. The ‘true' average distance was compared to the simulated distribution of mean distances. A ‘true' average distance similar in line to the simulated distribution would indicate a possible ‘observer-effect' as a confounding factor with differences among locations.
RESULTS
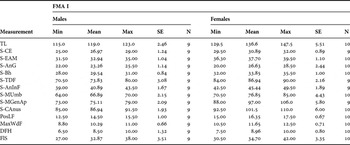
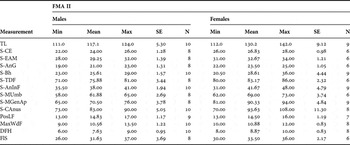
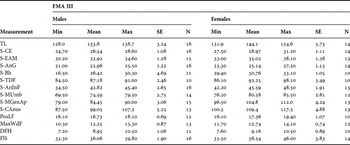
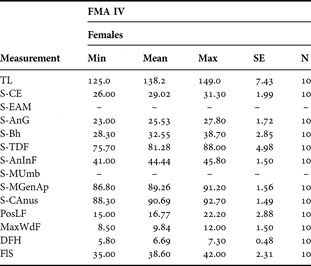
The means, standard errors, ranges and the number of specimens for each one of the external morphometric characters analysed for both males and females from FMAs I, II and III and for females from FMA IV are given in the Tables 3, 4, 5 and 6.
Summary of external morphological measurements of mature males and females from Rio de Janeiro. FMA, Franciscana Management Area; Min, minimum; Max, maximum; SE, standard error; N, number. For definitions of codes see text.

Summary of external morphological measurements of mature males and females from São Paulo. FMA, Franciscana Management Area; Min, minimum; Max, maximum; SE, standard error; N, number. For definitions of codes see text.

Summary of external morphological measurements of mature males and females from Rio Grande do Sul. FMA, Franciscana Management Area; Min, minimum; Max, maximum; SE, standard error; N, number. For definitions of codes see text.

Summary of external morphological measurements of mature females from Argentina. FMA, Franciscana Management Area; Min, minimum; Max, maximum; SE, standard error; N, number. For definitions of codes see text.

To facilitate reference to each of two analyses, we will refer to the analysis with males and females from FMA I, II and III as ‘B' (for both sexes) and the analysis with females only but from all four areas as ‘F' (for females).
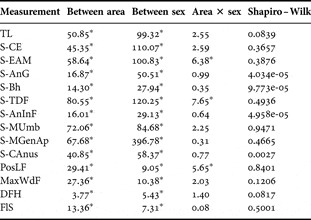
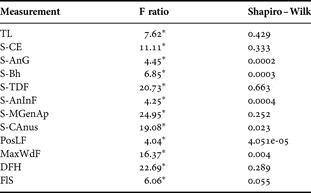
For case ‘B', four characters, when evaluated individually for approximate normality: S-AnG, S-CBh, S-AnInF, S-CAnus failed the Shapiro-Wilk test (P < 0.05; Table 7). The same occurred for two other characters in case ‘F': PosLF and MaxWdF (P < 0.05; Table 8). Since a visual inspection of qq-plots indicated that they were only slightly deviated from normality, they were analysed without transformation.
Results of a two-way analysis of variance and Shapiro–Wilk test for each one of the 14 external morphometric characters (2 df for area and 1 df for sex). For definitions of codes see text.

Reference value for F ratio: * = α < 0.05.
Results of analysis of variance and Shapiro–Wilk test for each one of 12 external morphometric characters (3 df). For definitions of codes see text.

Reference value for F ratio: * = α < 0.05
The two-way ANOVA for each one of 14 external characters showed significant differences between areas and between sexes for all characters. There was significant sex–area interaction for S-EAM, S-TDF and PosLF, suggesting that observed differences between sexes for these measurements vary geographically (Table 7). In the ANOVA carried out with females from all four areas, significant differences also occurred. S-MGenAp, DFH and S-TDF showed the best contributions to discriminating females from the four areas (Table 8).
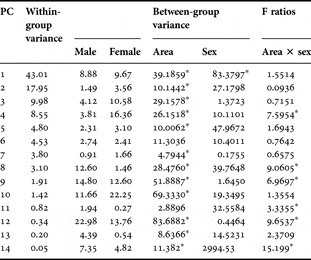
Multiple-group principal component analysis carried out for case ‘B' showed that 70.94% of overall within-group variation can be explained by the first three components (Table 9). PC1 assumes high positive correlations with all characters analysed. This is frequently interpreted as an index of general size. The other components show positive and negative correlations of varied magnitude, and are indicative of shape variation. PC2 and PC3 describe the most important characters related to shape, to explain the variability between animals within groups. PC2 can be interpreted as a contrast between DFH and two other measurements, since the latter have positive correlations and DFH, negative correlation with PC2. For PC3 contrasts involve mainly S-CAnus, S-MUmb and S-AnG. The first two characters show positive correlations, while S-AnG shows negative correlation with PC3.
Analysis of variance (ANOVA) of multiple-group principal component analysis (MGPCA) scores. Within-group variance is the percentage of within-group variation summarized by the multiple group principal components. Between-group variance is the percentage that each component contributes to between-group variance (for males and females separately). The F ratios are derived from a two-way ANOVA of the MGPCA scores, and show how individual components differentiate between sexes and localities.

Reference value for F ratio: * = α < 0.05
The relative contributions from PC1, PC2 and PC3 to discriminating among groups are smaller than from other PCs. The components that best explain the between-group variation were PC8, PC9 and PC12, for males and PC4, PC10 and PC12 for females (Table 9). These components contribute, respectively, with 50.38% and 52.37% of between-group variation for males and females. PC12, which shows a relationship between S-MUmb and S-CAnus, is the component that best explains the between-groups variation for males (22.98%). It also has a high contribution for between-group variation for females (13.76%). Nevertheless, for within-group variation, its contribution is 0.34%. PC9 and PC10 can be interpreted as a component related to beak size/shape for males and females, respectively. The former establishes high correlations with S-AnG and S-AnInF and the latter establishes correlations mostly with S-CE, S-EAM and S-AnG. PC8 can be interpreted in terms of contrast between two measurements related to flipper shape, PosLF and MaxWdF and PC4 can be explained by contrast between MaxWdF and DFH, also being a component related to appendix shape.
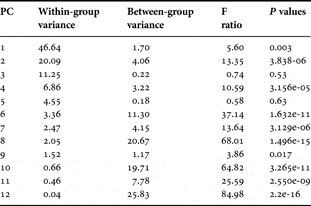
For the analysis carried out for case ‘F', MGPCA showed that the first three components together explain 77.98% of overall within-group variation (Table 10). All PCs explain shape variation. Characters S-TDF, PosLF, MaxWdF and DFH, were the least correlated with PC1, reflecting the small importance of measurements related to appendix shape in defining this component. PC2 can be interpreted as a component related to appendix shape, since the highest correlations were established with PosLF, MaxWdF, FlS and DFH, all of them positive.
Analysis of variance (ANOVA) of multiple-group principal component analysis (MGPCA) scores. Within-group variance is the percentage of within-group variation summarized by the multiple group principal components. Between-group variance is the percentage that each component contributes to between-group variance. The F ratios derived from ANOVA of the MGPCA scores show how individual components differentiate between localities.

Like in the analysis carried out with case ‘B', the first three components obtained for case ‘F' contribute most to explain within-group variation. The importance of PC1, PC2 and PC3 to explain between-groups variation is reduced when compared to the importance of PC8, PC10 and PC12 (Table 10). PC3 does not allow for discrimination between areas (F = 0.74, P = 0.53) and PC1 and PC2 explain only 1.70% and 4.06% of between = groups variation, respectively. In contrast, PC8, PC10 and PC12 contribute together with 66.21% of between-groups variation. Individual scores calculated for PC8, allows for discriminating FMA IV from other areas. All females from FMA I establish positive scores in this component, as well as most females from FMAs II and III, contrasting with negative scores for females from FMA IV. These results suggest that dorsal fins of FMA IV females are shorter than those of the females of the other areas. Thus, the differences between FMA I and FMA IV are more conspicuous. PC10 establishes a similar pattern to PC8 in discriminating between areas but with opposite signs: positive for FMA IV and negative for all the other FMAs. This shows that the measure which establishes the higher correlation with PC10, R-BH, assumes the largest size in FMA IV. Individual scores obtained for PC12 allowed for discriminating females from FMA II and IV, the former presenting negative and the latter, positive values. The position of the genital slit in relation to the anus must present significant variation between areas allowing for their discrimination.
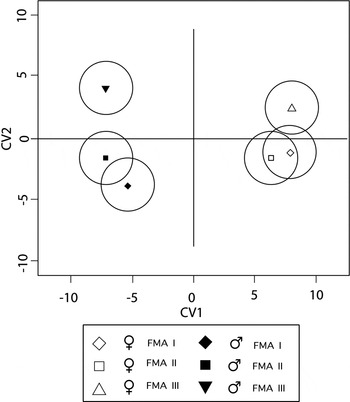
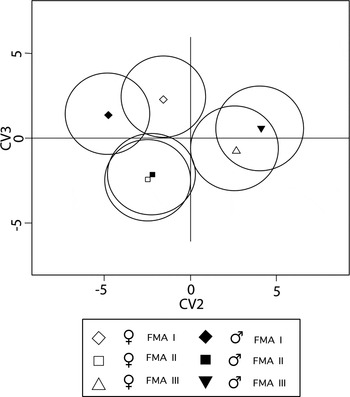
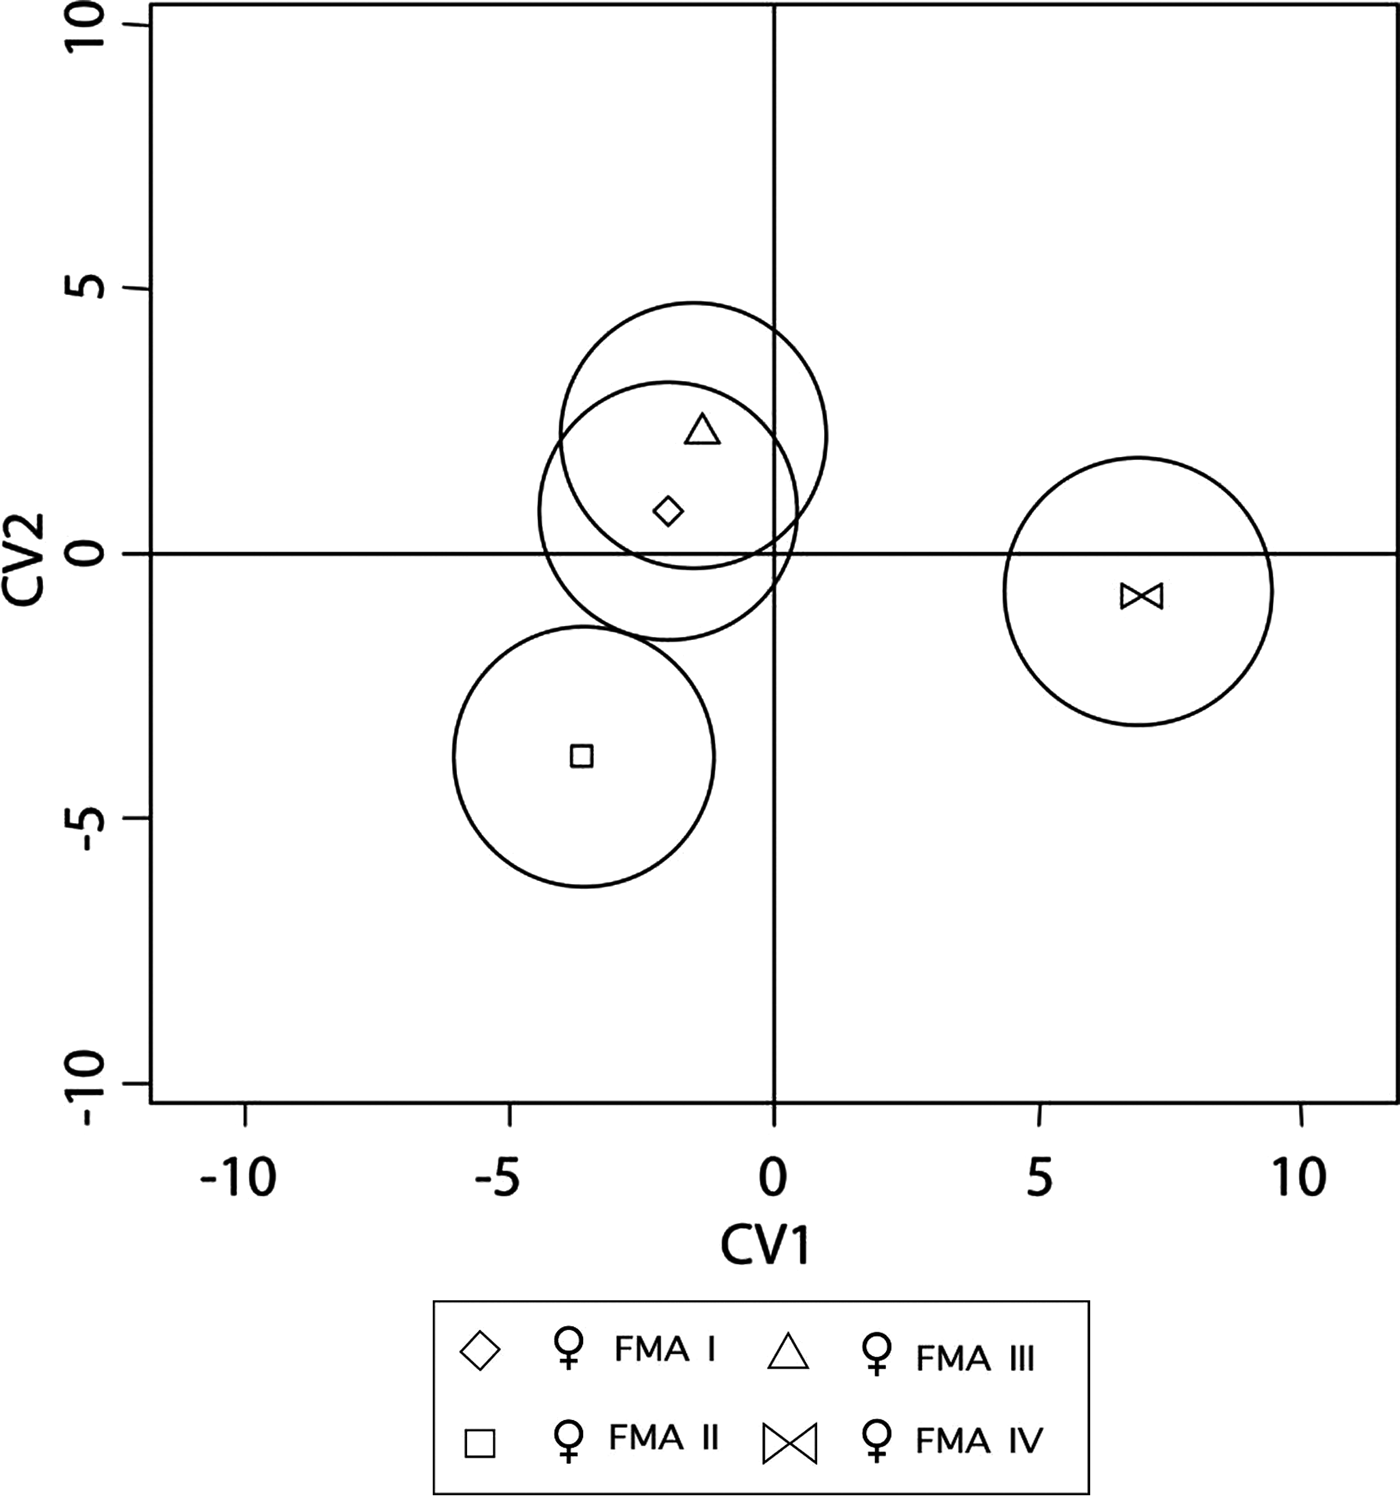
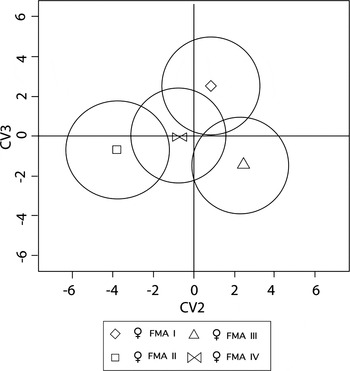
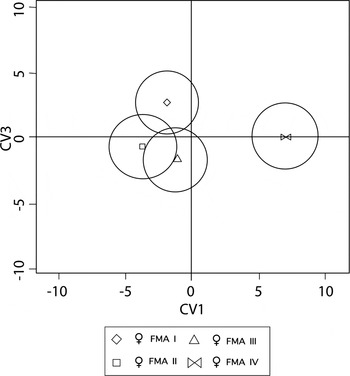
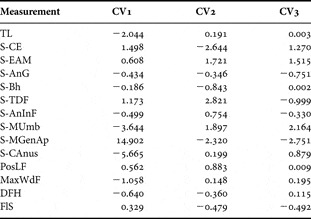
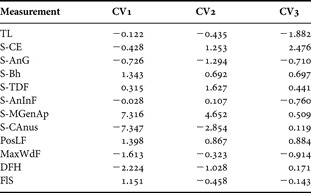
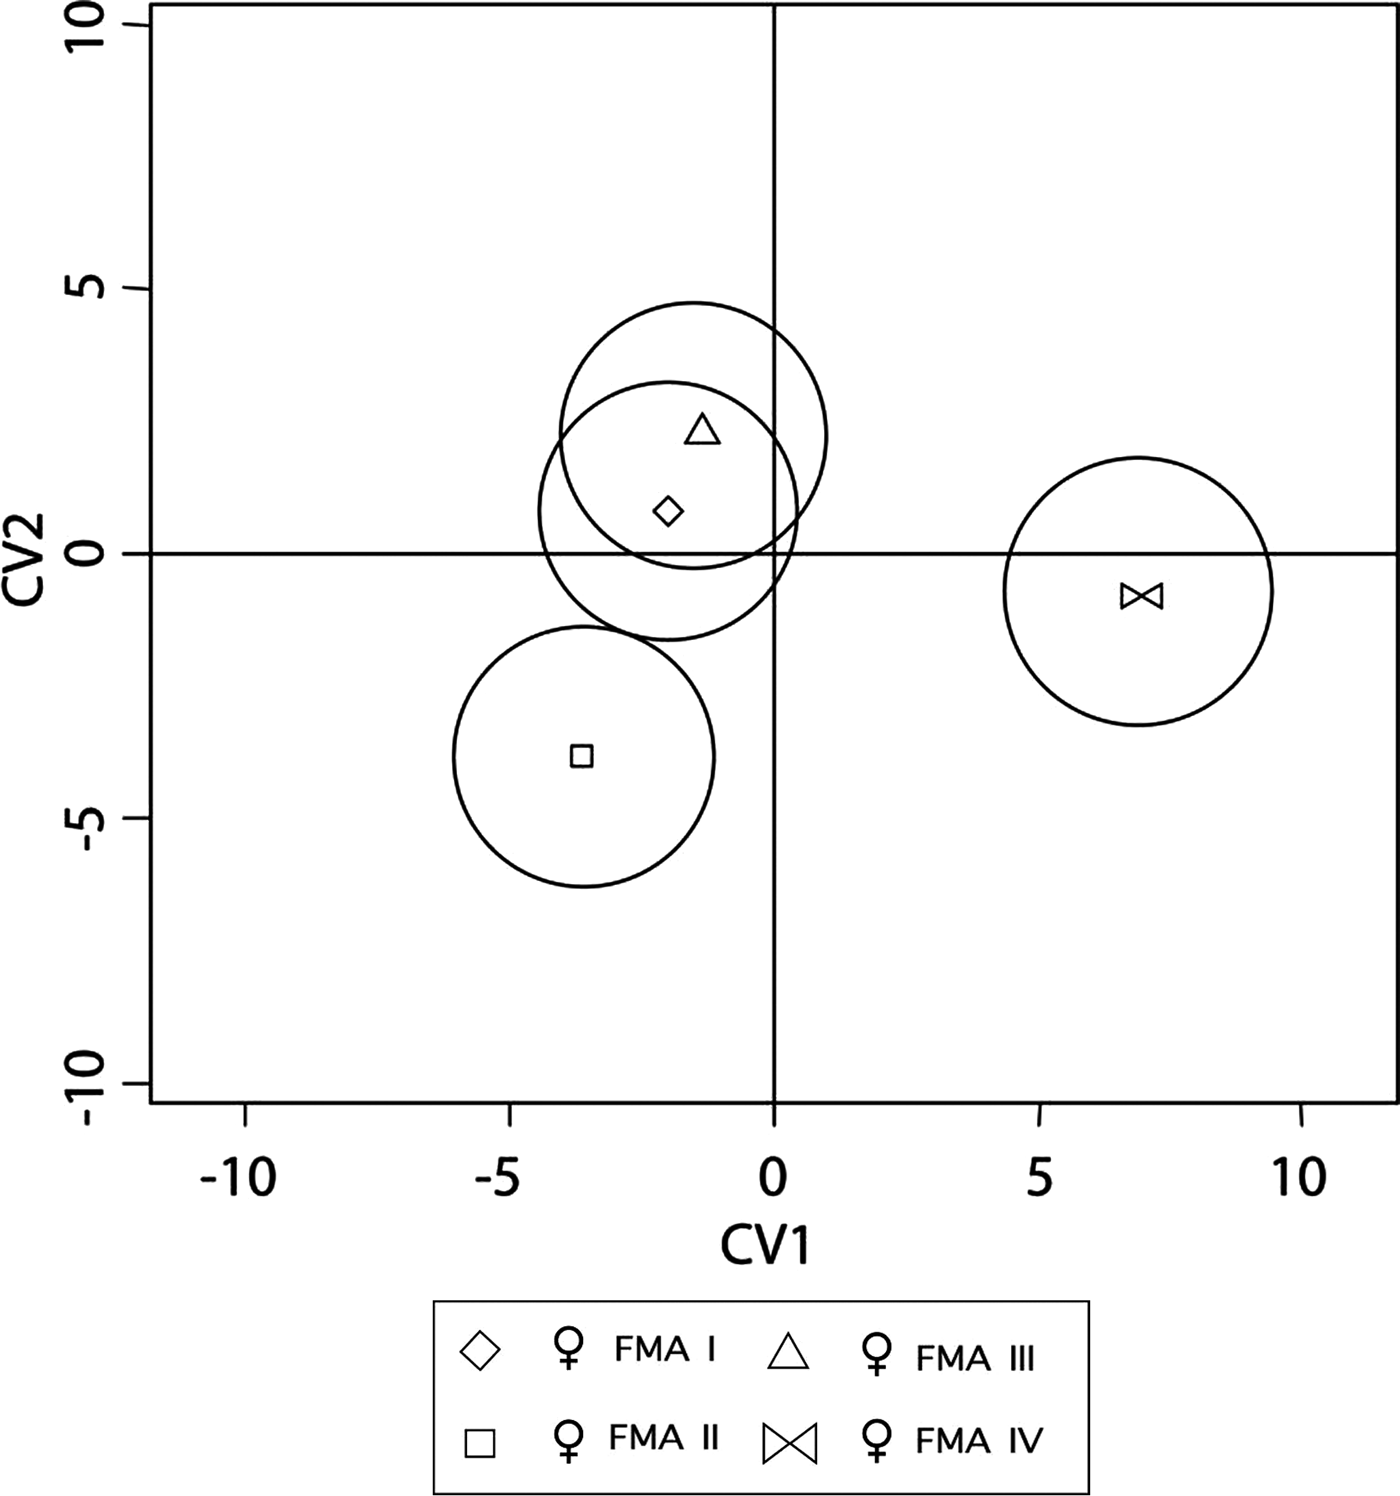
Canonical variate analysis allowed maximizing discrimination between areas in both analyses, cases ‘B' and ‘F' (Tables 11 & 12). These differences are visualized by the graphical display of 95% confidence contours of estimated mean individual scores (Figures 3, 4, 5, 6 & 7). In case ‘B', while CV1 × CV2 showed the differences between sexes (Figure 3), CV2 × CV3 clearly separated areas (Figure 4). In the CV1 axis, all females assume positive scores and all males assume negative scores. This is related to position of umbilicus, genital slit and anus. CV2 discriminates FMA III from FMA I and II. It is probable that in specimens from FMA III the dorsal fin is further backwards since the sampled specimens from FMA III show positive scores to S-TDF and the sampled specimens of other areas assume negative scores. In contrast, the anterior portion of the body seems to be longer in specimens from FMA I. CV3 discriminates mainly FMA I from FMA II, but when plotted against CV2, differences between three areas can be observed. Specimens from FMA I assume positive scores on CV3 while specimens from FMA II, negative scores, suggesting that the characteristics separating FMA I franciscanas from the others are related to beak size.
95% confidence contours from individual scores of canonical variates CV1 × CV2.

95% confidence contours from individual scores of canonical variates CV2 × CV3.

95% confidence contours from individual scores of canonical variates CV1 × CV2.
95% confidence contours from individual scores of canonical variates CV2 × CV3.

95% confidence contours from individual scores of canonical variates CV1 × CV3.

Standardized component scores from canonical variates analysis. The three components summarize, respectively, 79.31%, 15.65% and 4.01% of overall variation for males and females analysed together. For definition of codes see text.

Standardized component scores from canonical variates analysis. The three components summarize, respectively, 67.21%, 22.19% and 10.61% of overall variation for females. For definitions of codes see text.

For case ‘F', CV1 clearly discriminates females from FMA IV from all others, but CV2 does not. Individual scores from FMA IV on CV1 were all positive, while for other areas scores are negative or near null (Figures 5 & 7). Similar results were obtained with PC12, the component of MGPCA that mostly contributed to the discrimination between areas. CV2 allowed for discriminating females from FMA II from the others (Figure 6). The differences detected by CV2 suggest that the beak of females from FMA II is shorter than females from other areas. CV3 establishes positive coefficients of high magnitude with S-CE and negative coefficients with TL. This suggests the same pattern of morphological differences found in case 'B' analyses. Females from FMA I assume positive scores and females from FMA III negative scores (Figures 6 & 7), indicating that the former have larger S-CE, suggesting that the beak in this area is longer than in the other areas. On the other hand, females from FMA III attain the longest body lengths. Females from FMA IV have an intermediate total length between FMA I and III, which also can to be verified by mean absolute values of body size to these areas. Females from FMA II are smaller than females from all other areas.
Monte Carlo simulation
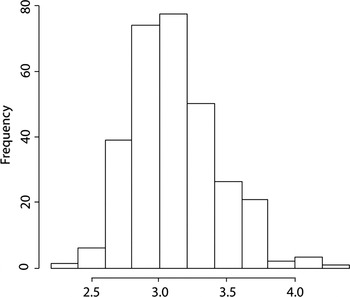
The distribution of the average Mahalanobis distances between the defined centroids for CV1, CV2, and CV3, obtained from Monte Carlo simulation, showed a mean of 3.11 with the minimum and maximum values of 2.23 and 4.38, respectively (Figure 8). The real data average distance was 7.71. This value is considerably higher than the highest simulated value, suggesting that the observer-effect is relatively small and that between-group differences obtained in the analyses are likely to represent true spatial variation.
Frequency distribution of mean Mahalanobis distance between centroids, derived through 300 Monte Carlo simulations.

DISCUSSION
Differences in external morphology of franciscanas between distinct locations, as well as, between sexes are significant. Individual scores calculated for PC1 produced higher values for females than males in FMA I, II and III, indicating that females are larger than males. This has already been observed in other studies throughout most of the species range (e.g. Kasuya & Brownell, Reference Kasuya and Brownell1979; Pinedo, Reference Pinedo1995; Ramos et al., Reference Ramos, Di Beneditto and Lima2000, Barreto & Rosas, Reference Barreto and Rosas2006), demonstrating the existence of sexual dimorphism in size for this species. Larger females are also observed in other species of small cetaceans, such as harbour porpoise (Phocoena phocoena), the vaquita (Phocoena sinus) and the dolphins of the genus Cephalorhynchus (Hohn et al., Reference Hohn, Read, Fernandez, Vidal and Findley1996; Read & Tolley, Reference Read and Tolley1997; Dawson, Reference Dawson, Perrin, Würsig and Thewissen2002). In franciscanas, the selection pressure associated with larger females might be related to the need of giving birth to larger calves which would increase their chances of survival (Slooten, Reference Slooten1991; Chivers, Reference Chivers, Perrin, Würsig and Thewissen2009).
Besides the differences in total length, other differences between males and females included body shape and a more elongated anterior body in females. Females in FMAs I, II and III had larger mean body shape values than males, corroborating other studies (Pinedo, Reference Pinedo1995; Ramos et al., Reference Ramos, Di Beneditto, Siciliano, Santos, Zerbini, Bertozzi, Vicente, Zampirolli, Alvarenga and Lima2002). Marked differences were found between males and females from FMA III, including a more elongated anterior portion of the body, which may reflect a relatively longer beak in females. Pinedo (Reference Pinedo1995) observed that females from Rio Grande do Sul had larger body size, beak length and distance between the blowhole and dorsal fin basis than males. Males, on the other hand, showed taller dorsal fins. Other male odontocetes have taller dorsal fins than females (e.g. Orcinus orca (Ford et al., Reference Ford, Ellis and Balcomb2000) and Phocoena dioptrica (Goodall & Schiavini, Reference Goodall and Schiavini1995)). However, the differences in dorsal fin height between males and females in franciscanas are not as evident as that observed in the other species, and should not be regarded as functional sexual dimorphism.
The relative position of umbilicus, genital aperture and anus were the characteristics that allowed splitting markedly the sexes. However, the position of genital aperture, occupying a more forward position in males is a common characteristic in cetaceans (e.g. Sergeant, Reference Sergeant1962; Perrin, Reference Perrin1975; Yonekura et al., Reference Yonekura, Matsui and Kasuya1980) and most mammals (Pough et al., Reference Pough, Janis and Heiser2005).
Graphical representation of 95% confidence contours established for the mean scores, obtained with CVA, allowed documenting the main similarities and differences between populations. CV2 × CV3 produced similar results to those observed with MGPCA scores. Morphological difference related to dorsal fin position and beak length were the most evident results (Figure 4). The dorsal fin is located further backwards in individuals from FMA III than FMA I, and the beak was longest in animals from FMA I. Variations in the anterior measurements of the body strongly affected by condylobasal length (Perrin, Reference Perrin1975), can be related to changes in oral apparatus and feeding habits. In fact, snout to centre of eye length and snout to external auditory meatus length contribute to explain CV2 and CV3. Besides PC9 and PC10, the principal components that best discriminate areas, for males and females, respectively, are defined by the measurements snout to angle of gape, snout to anterior insertion of flipper, snout to centre of eye and snout to external auditory meatus. These differences could indicate that franciscanas from different areas show morphological differences related to distinct feeding habits. The diet of individuals from Rio de Janeiro and Espírito Santo (FMA I) is considerably different from that of animals from Rio Grande do Sul, Uruguay and Argentina. Franciscanas in the southernmost portion of their distribution feed mainly on demersal species (Fitch & Brownell, Reference Fitch and Brownell1971; Rodriguez et al., Reference Rodriguez, Rivero and Bastida2002; Bassoi, Reference Bassoi2005), while franciscanas from Rio de Janeiro prey more often upon pelagic species (Di Beneditto & Ramos, Reference Di Beneditto and Ramos2001). Morphological differences related to anterior dimensions of the body detected in this study discriminate, mainly, FMA I and FMA III. Although morphological differences have been detected in FMA II, a biological explanation for such differences could not be determined.
Morphological differences between females from FMA IV and females from the other areas (Figures 5, 6 & 7) provide support for the hypothesis that the population from northern Argentina can be treated as a distinct unit as proposed by Secchi et al. (Reference Secchi, Danilewicz and Ott2003). Females from FMA IV show intermediary values between FMA I and FMA III in regard to anterior measurements of the body, which are related to condylobasal length and body size. Although the absolute mean values of the measurements associated with condylobasal length (with the exception of snout to centre of blowhole length) in females from FMA IV are close to those from FMA III and lower than those from FMA I, graphical representation of 95% confidence contours of the mean individual scores to CV2 shows more similarities between FMA IV and FMA I (Figures 5 & 6). This difference can be explained by the character snout to tip of dorsal fin length, which also influences CV2. This measure points to differences in position of the dorsal fin among all areas.
Differences in size and shape constitute valuable information that can be used along with genetic, parasite and contaminant loads, feeding ecology and reproductive biology data to help identify discrete units for management and taxonomic purposes (e.g. Dizon et al., Reference Dizon, Lockyer, Perrin, Demaster and Seisson1992; Moritz, Reference Moritz1994; Avise, Reference Avise2000; Wang, Reference Wang, Perrin, Würsig and Thewissem2002). Congruent differences were found by Wang et al. (Reference Wang, Chou and White2000a, Reference Wang, Chou and Whiteb) and Baker et al. (Reference Baker, Smith and Pichler2002), using genetic, osteological and morphological data between two sympatric forms of bottlenose dolphins in the waters of China and between populations of Hector's dolphin from New Zealand, respectively.
In the southern portion of the species range, a high genetic similarity among populations from Argentina, Uruguay and the States of Rio Grande do Sul and southern Santa Catarina was observed (Ott, Reference Ott2002), suggesting the existence of only one large genetic population throughout this area, which spreads out from the southernmost part of FMA II to FMA IV. The greatest levels of genetic differentiation that were observed within this region were around ten times lower than differences between these areas altogether and populations from São Paulo and Paraná States, Brazil (Ott, Reference Ott2002). Lázaro et al. (Reference Lázaro, Lessa and Hamilton2004) also detected substantial levels of gene flow between populations from Rio Grande do Sul, Uruguay and Argentina. Like Ott (Reference Ott2002) and Lázaro et al. (Reference Lázaro, Lessa and Hamilton2004), our findings do not support the split of populations from Argentina, Uruguay and Rio Grande do Sul into two distinct management areas as proposed by Secchi et al. (Reference Secchi, Danilewicz and Ott2003). Our results, however, constitute morphological evidence that supports splitting part of FMA IV from FMA III as distinct management areas. The sampled specimens in San Clemente and Cabo San Antonio, located in northern Buenos Aires Province, are morphologically different from those of FMA III and more similar to individuals from FMA I in terms of body size and measurements related to the anterior portion of the body (Figures 5, 6 & 7). Furthermore, Mendez et al. (Reference Mendez, Rosembaum and Bordino2007) compared mitochondrial DNA from distinct locations in Argentina with data from Lázaro et al. (Reference Lázaro, Lessa and Hamilton2004), finding evidence for the presence of at least two genetically different populations within FMA IV: San Clemente and Claromecó. The population from northern Buenos Aires Province constitutes the most isolated population from Argentina and this is in agreement with morphological differences found here.
The specimens from Argentina used in this study were mostly the same individuals as those sampled for the genetics study by Mendez et al. (Reference Mendez, Rosembaum and Bordino2007) and had been incidentally caught in gillnet fisheries operating in estuarine waters of the La Plata River (Samborombón Bay). A similar pattern of genetic differentiation between estuarine and marine coastal individuals has recently been documented by Costa et al. (Reference Costa, Lessa and Secchi2008) in Uruguayan waters.
Morphological differences found in this study and the genetic differences found by Mendez et al. (Reference Mendez, Rosembaum and Bordino2007) between populations from Argentina and the other populations could be reflecting a possible ecological separation or habitat partitioning, at least around the boundary between oceanic and estuary waters near the La Plata River mouth. Such segregation could be related to the use of different feeding resources. The diet and parasite infestation levels were more similar between Rio Grande do Sul and Uruguay than between any of these two areas and Argentina (Fitch & Brownell, Reference Fitch and Brownell1971; Aznar et al., Reference Aznar, Raga, Corcuera and Monzon1995; Andrade et al., Reference Andrade, Pinedo and Pereira1997; Rodriguez et al., Reference Rodriguez, Rivero and Bastida2002; Bassoi, Reference Bassoi2005). Differences in diet were also important between individuals collected in the estuary waters of Samborombón Bay and those sampled in the oceanic coastal waters of Argentina (Rodriguez et al., Reference Rodriguez, Rivero and Bastida2002).
Systematic errors from the observer when following measurement protocols can be considered to have had, at most, only minor effects on the morphological differences observed here. Inter-observer systematic errors were shown by the simulation study to be negligible when compared to variations between FMAs. However, if feasible, calibration experiments prior to the study are recommended in order to increase accuracy of the analyses. To reduce the effects of stochasticity larger sample sizes are also desirable. The level of morphological differentiation observed between the sampled populations in this study, agrees with some results of genetic studies and gives additional support for the separation of the proposed FMA I, II and III and, at least, part of FMA IV. Populations from these areas represent distinct demographic entities and, therefore, must be managed independently to guarantee the maintenance of intraspecific genetic variability.
Furthermore, the occurrence of unique haplotypes in the population from Rio de Janeiro, negligible gene flow with adjacent areas, the distinct reproductive pattern, the difference in growth and demographic parameters and the indications of a geographical isolation (Secchi et al., Reference Secchi, Wang, Murray, Rocha-Campos and White1998; Di Beneditto & Ramos, Reference Di Beneditto and Ramos2001; Ott, Reference Ott2002; Siciliano et al., Reference Siciliano, Di Beneditto and Ramos2002), constitute evidence indicating that FMA I is a distinct evolutionarily significant unit (sensu Ryder, Reference Ryder1986). Franciscanas from FMA I might be considered a distinct subspecies, if the same criteria used by Baker et al. (Reference Baker, Smith and Pichler2002) are adopted, which are congruent lines of morphological and genetic evidences and a relatively short time of divergence to the occurrence of an event of speciation. Phylogenetic analysis of haplotypes carried out by Lázaro et al. (Reference Lázaro, Lessa and Hamilton2004) pointed out that one of the haplotypes found in the population from Rio de Janeiro is more closely related to the haplotypes found in the southern populations than those of the population from Rio de Janeiro, suggesting that these populations separated recently in their evolutionary paths.
ACKNOWLEDGEMENTS
We would like to thank all fishermen who kindly brought franciscanas caught in their nets and all the researchers who took the measurements. Dr W.F. Perrin and Dr K. Van Waerebeek made valuable comments on an earlier version of the manuscript. Lauro Barcellos (Director of the Museu Oceanográfico Prof. Eliézer de Carvalho Rios) provided logistical conditions for storing and measuring some of the dolphins. Ignacio B. Moreno prepared the map used in this paper. This study was made possible thanks to the financial support from Yaqu Pacha, Cetacean Society International, Fundação O Boticário de Proteção à Natureza and FAPESP. E.R. Secchi was sponsored by CNPq (PQ 305219/2008-1), A.P.M. Di Beneditto was supported by CNPq (Grant number 300241/09-7) and FAPERJ (Grant number E-26/103.038/08) and J. Marigo was sponsored by FAPESP (Grant number 00/14669-0). The Wildlife Trust, Whitley Laing and Rufford foundations, the New England Aquarium, Foundacion Vida Silvestre Argentina and Chicago Zoological Society also provided significant funding for the field aspects of this study. This research is part of the first author's MSc dissertation under the guidance of the last. The Conselho Nacional para Desenvolvimento Científico e Tecnológico of the Brazilian Government (CNPq) has granted her a graduate fellowship (Grant number 132344/2006-8). This is a contribution of the Research Group Ecologia e Conservação da Megafauna Marinha—EcoMega.