1. Introduction
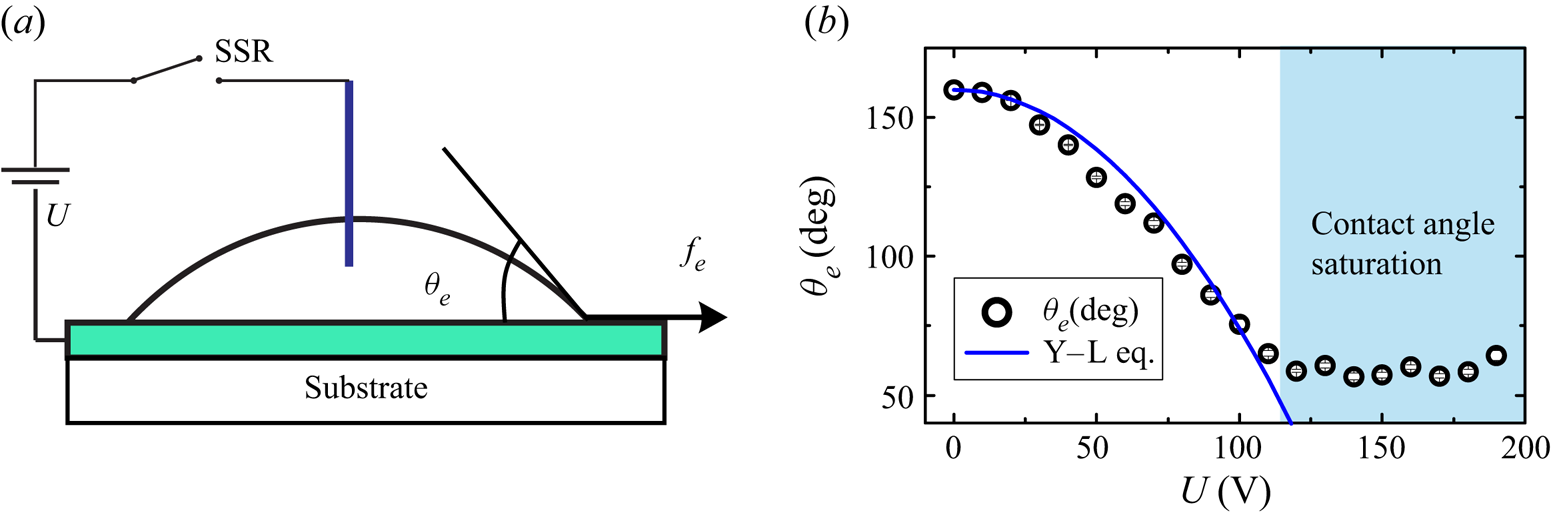
The contact angle of an electrically conductive droplet on an electrode covered by a dielectric layer reduces when a voltage  $U$ is applied between the droplet and the electrode (see figure 1a). This phenomenon, known as electrowetting on dielectric (EWOD), is one of the most effective techniques for droplet manipulation in three-dimensional digital microfluidics (Jun Lee, Lee & Kang Reference Jun Lee, Lee and Kang2012; Hong & Lee Reference Hong and Lee2015), anti-icing (Mishchenko et al. Reference Mishchenko, Hatton, Bahadur, Taylor, Krupenkin and Aizenberg2010), self-cleaning (Blossey Reference Blossey2003) and control of droplet deposition (Baret & Brinkmann Reference Baret and Brinkmann2006). At low applied voltages, the equilibrium contact angle
 $\theta _{e}$ after
 $U$ is applied directly relates to the voltage
 $U$ and droplet's initial contact angle
 $\theta _{0}$ via the so-called Young–Lippmann equation (Mugele & Baret Reference Mugele and Baret2005),
 \begin{equation} \cos \theta_{e} - \cos \theta_{0} = \frac{\epsilon \epsilon_0 U^{2}}{2 \sigma d}, \end{equation}
where  $\epsilon _0$ is the permittivity of free space;
 $\epsilon$ and
 $d$ are, respectively, the dielectric constant and thickness of the dielectric coating,
 $\sigma$ is surface tension of the droplet. When the applied voltage is sufficiently high,
 $\theta _{e}$ fails to follow (1.1) and is limited by a phenomenon known as contact-angle saturation (CAS) (see figure 1b).
(a) Schematic showing the EWOD set-up. (b) Plot showing the dependence of the equilibrium contact angle  $\theta _{e}$ on the applied voltage
 $U$. The solid curve represents (1.1) without any fitting parameter. Contact-angle saturation is observed for
 $U \ge U_{s} \approx 110$ V.

While transient behaviours of droplets under electrowetting actuation within the saturation limit are well-established (Mugele & Baret Reference Mugele and Baret2005; Vo & Tran Reference Vo and Tran2018; Vo, Su & Tran Reference Vo, Su and Tran2018), the dynamics of droplets with applied voltage exceeding the CAS threshold remains elusive. Consequently, most applications utilising electrowetting use applied voltage within the saturation value,  $U_{s}$, a requirement significantly limiting EWOD's capabilities, especially in manipulating small and viscous droplets (Fair Reference Fair2007; Vo & Tran Reference Vo and Tran2019). Therefore, it is of practical importance to explore how droplet spreading dynamics is affected when the applied voltage is higher than the CAS threshold.
In this paper, we investigate the transient behaviours of droplets when the applied voltage  $U$ is higher than the CAS voltage
 $U_{s}$. We focus on small droplets with radius below capillary length and study their spreading behaviours in silicone oil medium under electrowetting actuation. We reveal a direct influence of increasing the applied voltage on enhancing the initial spreading velocity of droplets even when
 $U \ge U_{s}$. We also observe strong capillary waves on the droplet–oil interface and analyse their occurrence with the enhancement of the initial spreading velocity. We then propose and verify a theoretical model to explain the relation between the capillary waves under electrowetting actuation and the applied voltage.
2. Experimental set-up, materials and method
In our experiment, we prepare test substrates using indium tin oxide (ITO) glass slides, each covered by a layer of fluoropolymer (Teflon, Dupont) having thickness  $d = 2.5\ {\mathrm {\mu }\textrm {m}}$. We dip an
 $18\ \mathrm {\mu }$m-wire electrode made of tungsten into the droplet and connect it to the positive terminal of a direct current power supply via a solid state relay (SSR) (see figure 1a), while the negative terminal is connected to the indium tin oxide layer. The voltage applied to the two electrodes takes the form of a step function having amplitude
 $U$ and duration
 $T_{p}$; the duration
 $T_{p}$ is set sufficiently long to ensure that droplets under the electrowetting effect reach a new equilibrium in every actuation. The amplitude
 $U$ is varied between
 $0\ \textrm {V}$ to
 $190\ \textrm {V}$. The CAS is experimentally determined at
 $U_{s} = 110$ V by observing the saturation behaviour of the contact angle when
 $U$ is gradually increased (figure 1b). We note that the observed change of the equilibrium contact angle
 $\theta _{e}$ follows the Young–Lippmann equation (1.1) when
 $U < U_{s}$ (figure 1b, solid curve).
We use a 0.125 M sodium chloride aqueous solution to generate droplets. For each experiment, we immerse a droplet and the substrate in silicone oil having viscosity  $\mu _{o} = 1.8\ \textrm {mPa}\ \textrm {s}$. The interfacial tension of the solution in the silicone oil is measured experimentally at
 $\sigma = 37.2 \pm 0.5\ \textrm {mPa}\ \textrm {s}$. The temperature of the oil pool is kept at
 $20 \pm 0.5\,^{\circ }\textrm {C}$ to maintain consistent experimental conditions. The radius of the droplet is
 $R = 0.5\ \textrm {mm}$, well below the capillary length
 $\unicode{x0142} _{c} = [\sigma /(\rho - \rho _{o}) g]^{1/2} = 5.5 mm.$ Here,
 $g = 9.781\ \textrm {m}\ \textrm {s}^{-1}$ is the gravitational acceleration,
 $\rho = 1000\ \textrm {kg}\ \textrm {m}^{-3}$ and
 $\rho _{o} = 873\ \textrm {kg}\ \textrm {m}^{-3}$ the density of the working liquid and the oil, respectively. We capture the behaviours of droplets using a high speed camera (Photron, SAX2) typically running at 5000 frames per second.
3. Results and discussions
3.1. Spreading dynamics by electrowetting beyond CAS
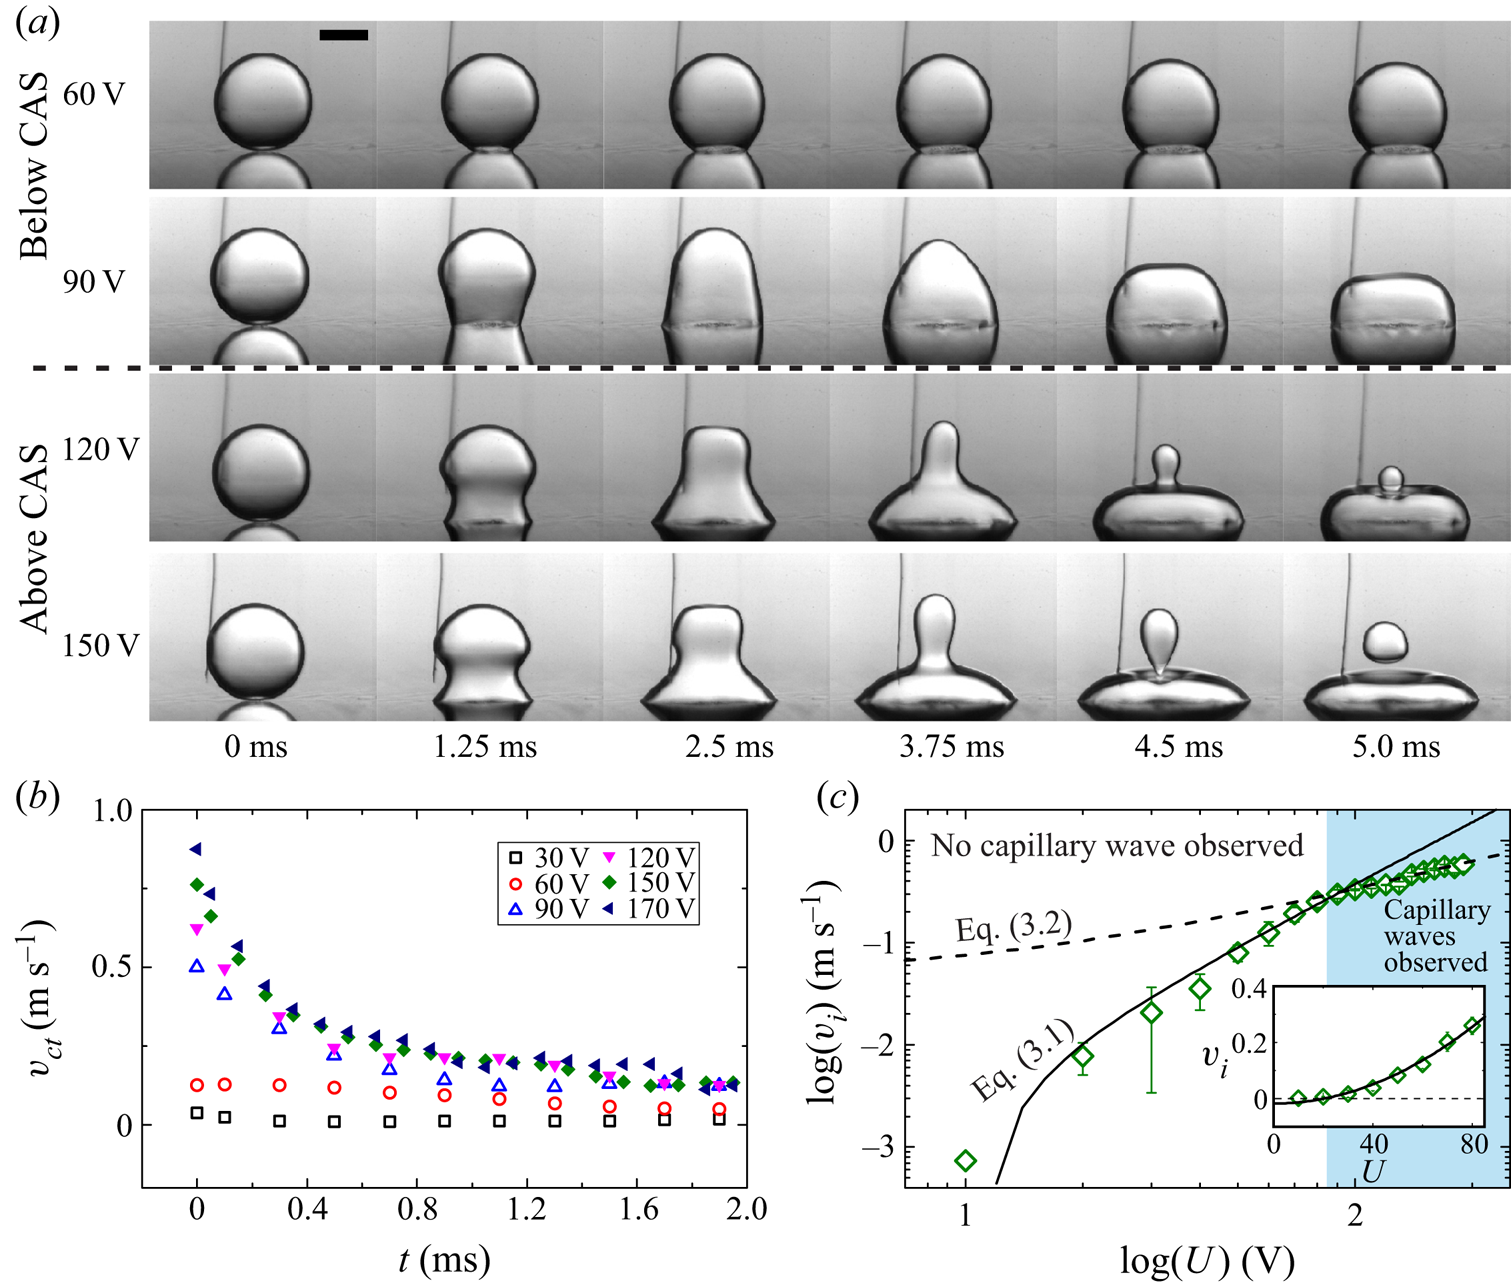
In figure 2(a), we show several series of snapshots of droplets shortly after a voltage  $U$ is applied. Generally, we observe that a higher applied voltage causes more violent spreading behaviours due to larger contact-line tension imbalance (Mugele & Baret Reference Mugele and Baret2005). For instance, at
 $U = 60$ V (figure 2a, top subpanel), the droplet gently spreads and maintains its spherical shape at all times. At
 $U = 90$ V (figure 2a, second subpanel), faster contact-line motion generates capillary waves on the liquid–oil interface and consequently causes substantial deformation of the droplet's shape. When the voltage increases above
 $120$ V, the capillary waves become so strong that the deformation at the liquid–oil interface causes small satellite droplets to eject from the primary droplets (figure 2a, bottom two subpanels). In such droplet-ejection instances, the size of the satellite droplets increases when
 $U$ varies from
 $120$ V to
 $150$ V.
(a) Snapshots showing the contact-line behaviours of droplets under different applied voltages  $U$ varying from
 $60\ \textrm {V}$ to
 $150\ \textrm {V}$. The scale bar represents 0.5 mm. Capillary waves on droplet's surface are observed when
 $U \ge 90\ \textrm {V}$. (b) Plot showing the contact-line velocity
 $v_{ct}$ versus time
 $t$: open markers for those of voltage below the saturation value, i.e.
 $U < 110$ V; solid markers for those of voltage above the saturation value, i.e.
 $U > 110$ V. (c) A log–log plot showing the initial contact-line velocity
 $v_{i}$ versus the applied voltage
 $U$. Inset: linear plot of
 $v_{i}$ versus
 $U$ for
 $U < 90$ V, the voltage's range in which no capillary wave is observed on the droplet's surface.

Surprisingly, we also observe from figure 2(a) that droplet deformation increases with the applied voltage even at  $U \ge U_{s} = 110$ V. As the deformation is caused by the capillary waves originating from the contact-line initial motion, we hypothesise that CAS has little effect on the early dynamics of the contact line. In figure 2(b), we show how the contact-line velocity
 $v_{ct}$ depends on time for several values of
 $U$ from
 $30$ V to
 $170$ V. We observe that when
 $U < U_{s}$, increasing
 $U$ shifts the velocity curves upwards, indicating that both early-time and late-time spreading dynamics are affected by the applied voltage (figure 2b, open markers). However, when
 $U > U_{s}$, escalating
 $U$ only increases the initial values of
 $v_{ct}$. Subsequently,
 $v_{ct}$ of all the values of
 $U > U_{s}$ converge to the same curve (figure 2b, solid markers). This observation confirms that the contact-line initial velocity and the resulting capillary waves on the droplet's surface are not limited by CAS; CAS only affects the late-time spreading dynamics of the droplets.
In figure 2(c), we show the initial contact-line velocity  $v_{i}$, i.e.
 $v_{ct}$ measured at
 $t = 0$, versus the applied voltage
 $U$. We observe that although
 $v_{i}$ increases with
 $U$ in the whole range of the applied voltage, the increasing rate of
 $v_{i}$ is higher for
 $U < 90$ V compared with that for
 $U \ge 90$ V. Beyond the critical voltage
 $U_{c} = 90$ V, determined where the switch in the increasing rate of
 $v_{i}$ occurs, it is possible to observe capillary waves on the droplet–oil interface (see figure 2a). The occurrence of the capillary waves when the applied voltage is increased beyond
 $U_{c}$ suggests that the initial driving force generated by the electrowetting effect is opposed by the resistive force at the contact line for
 $U < U_{c}$, and by the droplet's inertia for
 $U \ge U_{c}$. As a result, the relation between
 $v_{i}$ and
 $U$ can be obtained by balancing the driving force
 $\,f_{e} = \epsilon \epsilon _0 (2d)^{-1} U^{2}$, resulting from strong localisation of the electrical field at the contact line (Mugele & Baret Reference Mugele and Baret2005), and either the resistive force
 $v_{i} \lambda + f$ for
 $U < U_{c}$, or inertia
 $\rho r_0 v_{i}^{2}$ for
 $U \ge U_{c}$. Here,
 $\lambda$ is the contact-line friction coefficient described by the geometric mean of the droplet's viscosity and the oil's viscosity (Vo & Tran Reference Vo and Tran2018), and
 $f$ is the contact-line elasticity force caused by microscopic defects on the surface (Joanny & de Gennes Reference Joanny and de Gennes1984; De Gennes Reference De Gennes1985). If we assume that
 $\,f_{e} = \epsilon \epsilon _0 (2d)^{-1} U^{2}$ is independent from CAS in the early-time dynamic, we obtain
 $$\begin{gather} v_{i} = \epsilon \epsilon_0 (2 d \lambda)^{{-}1} U^{2} - f \lambda^{{-}1},\quad \textrm{for}\ U \le U_{c} = 90\ \textrm{V}, \end{gather}$$
 $$\begin{gather}v_{i} = (\epsilon \epsilon_0)^{1/2} (2 d \rho r_0)^{{-}1/2}(U - U_{c}) + v_{c}, \quad \textrm{for}\ U \ge U_{c} = 90\ \textrm{V}, \end{gather}$$
where  $v_{c} = \epsilon \epsilon _0 (2 d \lambda )^{-1} U_{c}^{2} - f \lambda ^{-1}$ is the critical contact-line velocity above which the capillary wave is observed on the droplet–oil interface. In our experiment,
 $v_{c} = 0.3\ \textrm {m}\ \textrm {s}^{-1}$. In figure 2(c), we plot both (3.1) (solid lines in the main figure and the inset) and (3.2) (dashed line). We observe an excellent agreement between the experimental data and both equations in their respective validity ranges. Best fit of (3.1) to the data in figure 2(c) gives
 $\lambda = 0.075 \pm 0.005\ \textrm {Pa}\ \textrm {s}$, in good agreement with the previously reported values for the contact-line friction coefficient in the same systems (
 $\lambda \approx 0.1 \pm 0.01\ \textrm {Pa}\ \textrm {s}$) (Vo & Tran Reference Vo and Tran2018; Vo et al. Reference Vo, Su and Tran2018). The fitting also reveals the contact-line elasticity force
 $f = (2.1 \pm 0.2) \times 10^{-3}\ \textrm {N}\ \textrm {m}^{-1}$, which is of the same order as the previously reported value, i.e.
 $(8.6 \pm 0.9) \times 10^{-3}\ \textrm {N}\ \textrm {m}^{-1}$ in Vo & Tran (Reference Vo and Tran2019).
3.2. Capillary waves
Fast contact-line motion generated by the electrowetting effect when  $U \ge U_{c}$ causes capillary waves on the droplet's surface. A remarkable feature of the generated capillary waves is that their amplitude increases with the applied voltage
 $U$ even when
 $U$ is higher than the CAS voltage (see figure 2). To exploit this feature in practical applications, e.g. manipulating small and viscous droplets (Fair Reference Fair2007; Vo & Tran Reference Vo and Tran2019), inducing droplet jumping by modulating actuation time (Wang et al. Reference Wang, van den Ende, Pit, Lagraauw, Wijnperle and Mugele2017), and controlling droplet ejection (Vo & Tran Reference Vo and Tran2021), we examine the induced capillary waves on the water–oil interface to reveal the dependence of the wave amplitude on the applied voltage.
3.2.1. Capillary-wave generation
To induce capillary waves on the surface of a droplet, the contact-line velocity has to overcome the inertial-capillary velocity  $(\sigma /\rho r_0)^{1/2}$, formulated using the stabilising velocity of a deformed droplet's surface to minimise its curvature (Taylor Reference Taylor1959). In normal wetting phenomena, the maximum velocity of the contact line that can be theoretically achieved is
 $\sigma /\lambda$. As a result, the condition enabling capillary waves becomes
 $\sigma /\lambda \ge (\sigma /\rho r_0)^{1/2}$, or
 $\xi = \lambda /(\sigma \rho r_0)^{1/2} \le 1$. Here, the so-called damping coefficient
 $\xi$ measures the viscous effects in both the droplet and the outer oil against inertia for capillary flows. We note that
 $\xi$ is defined similarly to the Ohnesorge number
 ${Oh} = \mu /(\sigma \rho r_0)^{1/2}$, where
 $\mu$ is the liquid viscosity. In wetting phenomena driven by the electrowetting effect,
 $v_{i}$ is determined by (3.1) and (3.2), resulting in another condition for capillary waves to occur:
 $v_{i} \ge (\sigma /\rho r_0)^{1/2}$. Using the experimental parameters in our experiment, the condition for the contact-line velocity to generate capillary waves is
 $v_{i} \ge (\sigma /\rho r_0)^{1/2} = 0.27\ \textrm {m}\ \textrm {s}^{-1}$, consistent with our experimental results shown in figure 2(c), i.e. capillary waves are observable when
 $v_{i} \ge 0.3\ \textrm {m}\ \textrm {s}^{-1}$. We note that if we define a Weber-like number
 ${We} = v_{i}^{2} \rho r_0/\sigma$, the condition for capillary waves to occur then takes the form
 ${We} \ge 1$.
3.2.2. Capillary-wave characteristics
To quantify the amplitude and phase of the capillary waves on a droplet having spherical-cap radius  $r_{s}$ and contact angle
 $\theta _0$, we use a polar coordinate system
 $(r, \phi )$ with origin
 $(r = 0, \phi = 0)$ at a distance
 $r_s$ below the droplet's apex and the polar axis vertically upward (figure 3a, inset). For droplets in our experiment,
 $\theta _0 \approx {\rm \pi}$ and
 $r_{s} \approx r_0$. In this coordinate system, the droplet–oil profile, which is also the capillary waveform, is
 $(r_{d}, \theta _0 - \phi )$, where
 $\theta _0$ is the wave's position of the contact line at
 $t = 0$. The displacement of the capillary wave is, therefore,
 $a = r_{d} - r_s$, measured by the deviation of the droplet–oil interface from the droplet's initial shape (
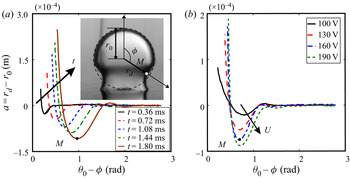
 $r_d = r_s$). In figure 3(a), we show
 $a$ versus
 $\theta _0 - \phi$ at several instances of time
 $t$ when
 $U = 150$ V is applied. When
 $t$ increases, the waveform moves from left to right indicating that the wave propagates farther from the contact line and towards the apex of the droplet (
 $\phi = 0$). Furthermore, we observe that while the wave's propagating velocity reduces with time, its amplitude increases suggesting that the wave's kinetic energy, originating from the fast initial motion of the contact line, is progressively converted to surface energy during its propagation.
(a) Plot showing the displacement  $a$ versus the wave's position
 $\theta _0 - \phi$ of the capillary waves propagating along the droplet–oil interface at different time
 $t$ when
 $U = 150$ V is applied. (b) Plot showing
 $a$ versus
 $\theta _0 - \phi$ of the capillary waves at
 $t/\tau = 1$ and at different applied voltages varying from
 $100$ V to
 $190$ V. Here,
 $\tau = (\rho r_0^{3}/\sigma )^{1/2}$ is the inertia-capillary time. The maximum displacement (at point M) increases with the applied voltage regardless of CAS.

In figure 3(b), we show a plot of  $a$ versus
 $\theta _0 - \phi$ at
 $t = \tau$ for different values of
 $U$ varying from
 $100$ V to
 $190$ V. Here,
 $\tau = (\rho r_0^{3}/\sigma )^{1/2}$ is the inertial-capillary time. We observe that the displacement at point M significantly increases with
 $U$, while the wave's position of the point M does not depend on
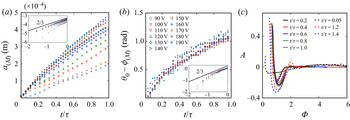
 $U$. This observation is examined more quantitatively in figure 4(a,b) where we, respectively, show
 $a_{(M)}$ and
 $\theta _0 - \phi _{(M)}$ versus
 $t/\tau$ for all the values of
 $U$ ranging from 90 V to 190 V. Here,
 $a_{(M)}$ and
 $\theta _0 - \phi _{(M)}$ denote the displacement and the position of the waves at point
 $M$, respectively. On the one hand, we observe that the slopes of
 $a_{(M)}$ versus
 $t/\tau$ increase with
 $U$ showing that the dependence of
 $a_{(M)}$ on
 $t/\tau$ is stronger at higher applied voltages. On the other hand,
 $\theta _0 - \phi _{(M)}$ is independent from
 $U$ at any values of
 $t/\tau$ indicating that the propagating velocity only depends on the hydrodynamical properties of the droplets, not the contact-line velocity.
(a) Plot showing the displacement of point  $M$,
 $a_{(M)}$, versus
 $t/\tau$ for
 $U$ varying from
 $90$ V to
 $190$ V. Inset: log–log plot of the data in the main plot showing the power law dependence
 $a_{(M)}\sim (t/\tau )^{2/3}$. The legends are given in panel (b). (b) Plot showing the wave's position of point M,
 $\theta _0 - \phi _{(M)}$, versus
 $t/\tau$ for
 $U$ varying from
 $90$ V to
 $190$ V. Inset: log–log plot of the data in the main plot revealing the power law dependence
 $\phi _0 - \phi _{(M)} \sim (t/\tau )^{2/3}$. (c) Plot showing the dimensionless displacement
 $A$ versus the dimensionless wave's position
 $\varPhi$ at different values of
 $t/\tau$ varying from
 $0.05$ to
 $1.4$. We observe self-similar behaviours of the capillary waves for
 $0.2 \le t/\tau \le 1$ (solid curves). Whereas the capillary waves are not self-similar for
 $t/\tau < 0.2$ and
 $t/\tau > 1$ (dashed curves).

The scaling laws for the displacement and the position of capillary waves on the surface of a spreading droplet were proposed by Ding et al. (Reference Ding, Li, Zhang, Sui, Spelt and Thoroddsen2012) by adapting the self-similarity theory for surface-tension driven flows of Keller & Miksis (Reference Keller and Miksis1983),
 \begin{equation} a = A r_0 \left( \frac{t}{\tau} \right)^{2/3} \quad \textrm{and}\quad \theta_0 - \phi = \varPhi \left( \frac{t}{\tau} \right)^{2/3}, \end{equation}
where  $A$ and
 $\varPhi$ denote the dimensionless displacement and the dimensionless position of the waves, respectively. In the insets of figure 4(a,b), we show the log–log plots of
 $a_{(M)}$ versus
 $t/\tau$ and
 $\theta _0 - \phi _{(M)}$ versus
 $t/\tau$, respectively. We observe that
 $a_{(M)} \sim (t/\tau )^{2/3}$ and
 $\theta _0 - \phi _{(M)} \sim (t/\tau )^{2/3}$, implying that (3.3a,b) is also applicable in our system in which the capillary waves are generated by electrowetting actuation. To further test (3.3a,b), in figure 4(c), we show the dimensionless waveforms, i.e.
 $A = a r_0^{-1}(t/\tau )^{-2/3}$ versus
 $\varPhi = (\theta _0 - \phi )(t/\tau )^{-2/3}$ when
 $t/\tau$ varies from
 $0.05$ to
 $1.4$. We observe that all the waveforms for
 $0.2 \le t/\tau \le 1$ collapse onto a single one confirming the self-similar behaviour of the capillary waves in this time range. However, we notice that capillary waves are not self-similar for
 $t/\tau < 0.2$ and
 $t/\tau > 1$ (see the dashed curves in figure 4c). At
 $t/\tau < 0.2$, i.e. a short time after wetting is initiated, the waves are local at the contact line region (Cox Reference Cox1986), whereas, at
 $t/\tau > 1$ the capillary waves reach the apex of the droplet and start interacting with the waves coming from the other side of the droplet. As a result, at both extremes the capillary waves on the droplet's surface are more complicated and cannot be described by a single self-similar scaling law.
3.2.3. Profiles of capillary waves
With the self-similar behaviour of the capillary waves, it is possible to reduce the wave's profile  $a(\phi ,t)$ at any time
 $t$ by a time-invariant dimensionless profile
 $A(\varPhi )$. The first solution for
 $A(\varPhi )$ was proposed by Keller & Miksis (Reference Keller and Miksis1983) who modified the calculation of Jeffreys & Jeffreys (Reference Jeffreys and Jeffreys1999) for inviscid, self-similar capillary-driven flows in a fluid wedge. Later, Billingham (Reference Billingham1999) theoretically incorporated viscosity effects using the capillary-viscosity velocity. However, both the solutions of Keller & Miksis (Reference Keller and Miksis1983) and Billingham (Reference Billingham1999) fail to fit our experimental data. While the solutions of Keller & Miksis (Reference Keller and Miksis1983) lack the viscous effects, the model of Billingham (Reference Billingham1999) is only applicable at a very early time after the wave is generated, and in a very small region close to the wave's source, e.g. the time and length scales, respectively, are
 $\approx 0.2$ ns and
 $\approx 10$ nm for water.
We seek an alternative expression for  $A(\varPhi )$ taking into account the viscosity effect in our system. The self-similar profiles
 $A(\varPhi )$ (see the profiles of
 $0.2 \le t/\tau \le 1$ in figure 4c) can be approximated by spatially decaying waves driven by interfacial tension and resisted by inertia and viscous forces. For such waves, we expect that
 $A(\varPhi )$ is the solution of an one-dimensional time-invariant wave equation, with a spatial damping coefficient
 $\xi = \lambda /(\sigma \rho r_0)^{1/2}$, i.e.
 \begin{equation} \frac{\textrm{d}^{2} A}{\textrm{d} \varPhi^{2}} + 2 k \xi \frac{\textrm{d} A}{\textrm{d} \varPhi} + k^{2} A = 0, \end{equation}
where  $k = 2 {\rm \pi}/ \lambda _{\varPhi } = 2 {\rm \pi}$ is the wavenumber and
 $\lambda _{\varPhi } = 1$ is the dimensionless wavelength. We note that the damping coefficient
 $\xi$ does not depend on the strength of the driving force at the contact line. Our discussion is also limited to the case where
 $\xi < 1$, for the possibility of capillary wave generation as discussed in § 3.2.1.
If we denote  $\varPhi _0 \ge 0$ the dimensionless position of the contact line, the profile
 $A$ in (3.4) is required to satisfy the following boundary conditions:
 $$\begin{gather} A\bigg \rvert_{\varPhi = \varPhi_0} = A_{ct} = \frac{a _{ct}}{r_0 (t/\tau)^{2/3}}, \end{gather}$$
 $$\begin{gather}\frac{\textrm{d} A}{\textrm{d} \varPhi}\bigg \rvert_{\varPhi = \varPhi_0} = \frac{\textrm{d} A_{ct}}{\textrm{d} \varPhi_{ct}} = \frac{\dot{a}_{ct} r_0^{{-}1} - (2/3) a _{ct} r_0^{{-}1} t^{{-}1}}{- \dot{\phi}_{ct} - (2/3) (\theta_0 - \phi_{ct})t^{{-}1}}, \end{gather}$$
where  $a _{ct} = r_{ct} (\sin \phi _{ct})^{-1} - r_{0}$ is the contact line's displacement,
 $\phi _{ct}$ its wave's position,
 $r_{ct}$ the contact radius,
 $\dot {a}_{ct}$ denotes the time derivatives of
 $a_{ct}$ and
 $\phi _{ct}$ the time derivatives of
 $\dot {\phi }_{ct}$. As we consider the capillary waves generated a short time after the electrowetting effect is activated, we can approximate
 $a _{ct} \approx 0$,
 $\phi _{ct} \approx \theta _0$,
 $a _{ct} t^{-1} \approx \dot {a}_{ct} \approx v_{i} \sin \theta _0$ and
 $- (\theta _0 - \phi _{ct})t^{-1} \approx \dot {\phi }_{ct} = - k_{\phi } r_0^{-1} (\sigma /\rho r_0)^{1/2}$, where
 $k_{\phi }$ is a positive constant. As a result, we obtain
 $$\begin{gather} A\bigg \rvert_{\varPhi = \varPhi_0} = 0, \end{gather}$$
 $$\begin{gather}\frac{\textrm{d} A}{\textrm{d} \varPhi}\bigg \rvert_{\varPhi = \varPhi_0} = \frac{v_{i} \sin \theta_0}{k_{\phi} (\sigma/\rho r_0)^{1/2}} = \frac{{We}^{1/2} \sin \theta_0}{k_{\phi}}. \end{gather}$$
The general solution of (3.4) is
 \begin{equation} A = \exp({-k \xi (\varPhi - \varPhi_0)}) \left[\alpha \cos k_{d} (\varPhi - \varPhi_0) + \beta \sin k_{d} (\varPhi - \varPhi_0)\right]. \end{equation}
Here,  $k_{d} = 2 {\rm \pi}(1 - \xi ^{2})^{1/2}$ is the attenuated wavenumber due to the damping coefficient
 $\xi$. Applying (3.7) and (3.8) to (3.9), we obtain
 $\alpha = 0$ and
 $\beta = {We}^{1/2} \sin \theta _0 (k_{d} k_{\phi })^{-1}$. Consequently, we obtain an explicit expression of
 $A(\varPhi )$ as follows:
 \begin{equation} A = \frac{{We}^{1/2} \sin \theta_0}{k_{\phi} k_{d}}\, \exp({-k \xi (\varPhi - \varPhi_0)})\,\sin [k_{d}(\varPhi - \varPhi_0)]. \end{equation}
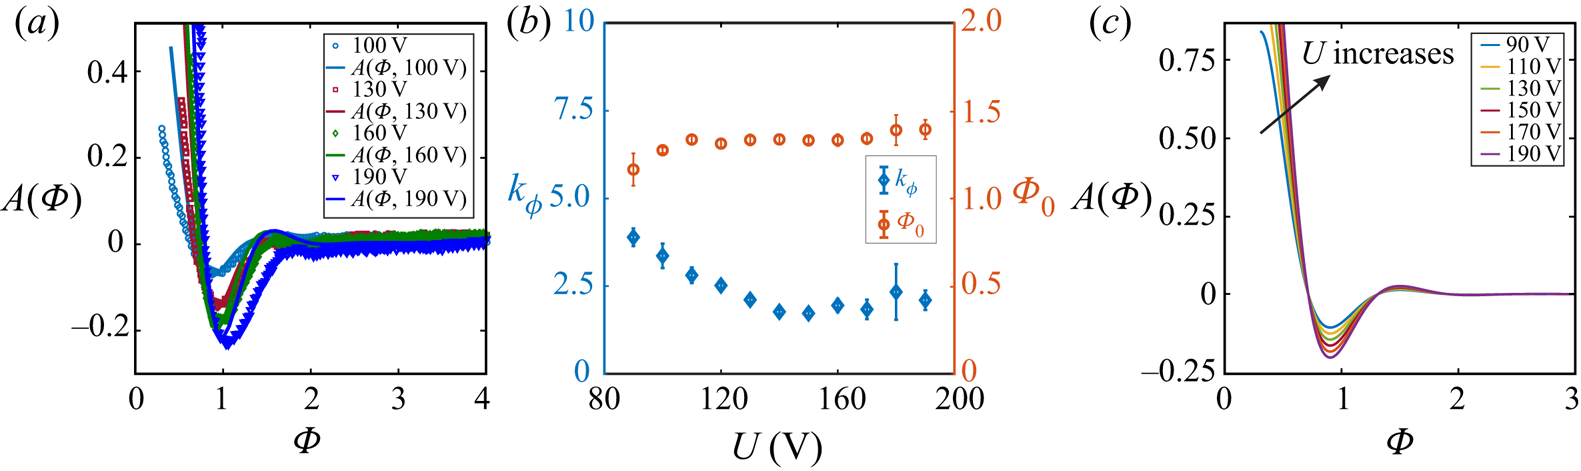
To verify (3.10), we use the least mean square method to fit the experimental data of  $A$ versus
 $\varPhi$ to (3.10) with the fitting parameters
 $\varPhi _0$ and
 $k_\phi$. Examples of the fittings at
 $t/\tau = 0.25$ and for different applied voltages
 $U$ are shown in figure 5(a). Similar results obtained for different values of
 $t/\tau$ varying from
 $0.2$ to
 $1$ indicate a good agreement between (3.10) and the experimental data. In figure 5(b), we show the values of
 $k_\phi$ (left-hand axis) and
 $\varPhi _0$ (right-hand axis) that both can be approximated as constants, i.e.
 $k_\phi = 2.4 \pm 0.7$ and
 $\varPhi _0 = 1.32 \pm 0.06$, for
 $U$ varying from 90 V to 190 V. All solutions for
 $90 \le U \le 190$ V are plotted in figure 5(c).
(a) Examples of fitting the experimental data of  $A$ versus
 $\varPhi$ at
 $t/\tau = 0.25$ to (3.10). Similar results are obtained for other values of
 $t/\tau$ varying from
 $0.2$ to
 $1$. (b) Plot showing the fitting parameters
 $k_\phi$ (on the left-hand axis) and
 $\varPhi _0$ (on the right-hand axis) versus the applied voltage
 $U$. Both
 $k_\phi = 2.4 \pm 0.7$ and
 $\varPhi _0 = 1.32 \pm 0.06$ appear to be constants in the voltage's range. (c) Plot representing (3.10) for different applied voltage varying from
 $90$ V to
 $190$ V, and with
 $k_\phi = 2.4$ and
 $\varPhi _0 = 1.32$.

4. Conclusions
We have shown that the initial contact-line velocity of a droplet spreading on a solid substrate under the electrowetting effect is not affected by the CAS. We theoretically derived and experimentally verified the relation between the initial contact-line velocity and the applied voltage. The magnitude of the capillary waves on the droplet–oil interface also depends on the applied voltage regardless of CAS. Based on theories describing the self-similar behaviours of interfacial-tension-driven flows, we then proposed a mathematical expression and provided experimental verification for the far-field capillary-wave profiles incorporating viscous effects. The proposed model strengthens our current understanding on how the capillary waves generates, propagates and decays. The model is also useful in understanding other capillary-wave-driven phenomena such as droplet jumping (Vahabi et al. Reference Vahabi, Wang, Mabry and Kota2018), droplet/bubble ejection by coalescence (Zhang & Thoroddsen Reference Zhang and Thoroddsen2008; Zhang, Li & Thoroddsen Reference Zhang, Li and Thoroddsen2009; Zhang et al. Reference Zhang, Thoraval, Thoroddsen and Taborek2015), bubble-busting jet at a liquid–air interface (Gordillo & Rodríguez-Rodríguez Reference Gordillo and Rodríguez-Rodríguez2019) and bouncing of impacting droplets on a solid substrate (Richard, Clanet & Quéré Reference Richard, Clanet and Quéré2002; Renardy et al. Reference Renardy, Popinet, Duchemin, Renardy, Zaleski, Josserand, Drumright-Clarke, Richard, Clanet and Quéré2003).
Funding
This study is supported by Nanyang Technological University, the Republic of Singapore's Ministry of Education (MOE, grant no. MOE2018-T2-2-113), and the Agency for Science, Technology and Research (A*STAR, grant no. 1523700102).
Declaration of interests
The authors report no conflict of interest.