Implications
Glycerine is generated as a by-product of biodiesel production. This study investigated the effect of two glycerine products with different purities: low- and high-purity glycerine. The products were supplemented to the diet of lactating dairy cows, and effects on feed intake, milk performance and blood metabolites were evaluated. The results showed that low-purity glycerine did not affect dry matter intake compared with high-purity glycerine (P = 0.37). However, low-purity glycerine had lower milk protein concentration (P = 0.03) and tended to reduce milk fat + protein yield (P = 0.06).
Introduction
Early lactation is associated with reduced dry matter intake (DMI) and increased nutrient requirements, particularly glucose, to support lactose synthesis in the mammary gland (Overton and Waldron, Reference Overton and Waldron2004). Not only in north-western Europe but also in other regions, the rations fed to lactating dairy cows are generally based on grass silage supplemented with concentrates (Khalili et al., Reference Khalili, Varvikko, Toivonen, Hissa and Suvitie1997). Glycerine is an energy-rich by-product; the energy content has been estimated to be 16.2 MJ metabolisable energy (ME)/kg (Mach et al., Reference Mach, Bach and Devant2009) with glucogenic properties, produced when biodiesel is manufactured from rapeseed oil (Thompson and He, Reference Thompson and He2006). It can be used as an energy supplement to dairy cows during early lactation (DeFrain et al., Reference DeFrain, Hippen, Kalscheur and Jardon2004; Wang et al., Reference Wang, Liu, Yang, Huo, Dong, Huang, Yang and He2009; Carvalho et al., Reference Carvalho, Schmelz, White and Donkin2010) or mid-lactation (Khalili et al., Reference Khalili, Varvikko, Toivonen, Hissa and Suvitie1997; Donkin et al., Reference Donkin, Koser, White, Doane and Cecava2009). In general, glycogenic substrates support the supply of glucose and enhance the metabolic status of dairy cows in early lactation, as a substrate for gluconeogenesis (Leng, Reference Leng1970; Ingvartsen, Reference Ingvartsen2006). Donkin et al. (Reference Donkin, Koser, White, Doane and Cecava2009) have shown that up to 15% of the total ration dry matter (DM) for dairy cows can be replaced by high-purity glycerine without causing negative effects on feed intake, milk production or milk composition.
Depending on the extent of refinement of the low-purity glycerine during biodiesel production, glycerine of different qualities can be found on the market (Südekum, Reference Südekum2008). High-purity glycerine (>99%) is the most valuable by-product, but identification of other uses for low-purity glycerine is important in order to make biodiesel production more competitive on the growing global market for biofuels. Low-purity glycerine contains water, different mineral salts and methanol in addition to glycerine, and has a marked odour. When using low-purity glycerine in feed rations for farm animals, removing as much of the methanol as is technically possible has previously been advocated for feed safety reasons. In Germany, it is recommended that the methanol content of glycerine used as feed should not exceed 0.5% (Südekum, Reference Südekum2008). DeFrain et al. (Reference DeFrain, Hippen, Kalscheur and Jardon2004) fed lactating dairy cows 860 g/day of glycerine with a methanol content of 1.3% and reported no negative effects of methanol. Methanol is efficiently metabolised by the rumen microorganisms, mainly to methane (Pol and Demeyer, Reference Pol and Demeyer1988; Neumann et al., Reference Neumann, Weigand and Most1999). Previous studies have examined different glycerine administration strategies, for example, top-dressed or mixed into the total mixed ration (TMR; DeFrain et al., Reference DeFrain, Hippen, Kalscheur and Jardon2004; Wang et al., Reference Wang, Liu, Yang, Huo, Dong, Huang, Yang and He2009; Carvalho et al., Reference Carvalho, Schmelz, White and Donkin2010), or within the concentrate ration (Fisher et al., Reference Fisher, Erfle and Sauer1971; Khalili et al., Reference Khalili, Varvikko, Toivonen, Hissa and Suvitie1997). Furthermore, glycerine products of different qualities have been used, for example, low-purity glycerine. DeFrain et al. (Reference DeFrain, Hippen, Kalscheur and Jardon2004) top-dressed TMR with low-purity glycerine containing 1.3% methanol, whereas Wang et al. (Reference Wang, Liu, Yang, Huo, Dong, Huang, Yang and He2009) and Carvalho et al. (Reference Carvalho, Schmelz, White and Donkin2010) fed high-purity glycerine in studies evaluating the effects of glycerine supplementation on feed intake, milk performance and blood metabolites. Varying effects of glycerine on DMI are reported. Dry cows receiving glycerine top-dressed on the TMR responded with reduced DMI (DeFrain et al., Reference DeFrain, Hippen, Kalscheur and Jardon2004). Variations in DMI induced by glycerine might involve palatability effects and metabolic consequences.
Objectives of the present study were to compare low- and high-purity glycerine, top-dressed on the concentrate, in order to determine treatment effects on silage intake, milk yield, milk composition and selected blood plasma parameters in early lactating cows.
Material and methods
Animals, management and experimental design
The experiment included 42 cows of the Swedish Red Breed and was conducted during two 6-month periods in spring 2008 and 2010 at Kungsängen Research Centre, Swedish University of Agricultural Sciences, Uppsala, Sweden. The experimental design and all handling of animals were approved by Uppsala Ethical Committee, Sweden (C:212/6). In 2008, both primiparous cows (n = 8) and multiparous cows (n = 14) were used, but in 2010 only multiparous cows were included (n = 20). Average milk yield in the herd was 9498 kg energy-corrected milk (ECM) in 2008 and 9215 kg ECM in 2010. The cows had an average BW of 659 kg (range 553 to 745 kg) at the start of the experiment. The cows were divided into 14 blocks of three cows according to the expected day of parturition and parity, and randomly assigned to one of three dietary treatments within blocks: supplementation with 0.5 kg low-purity glycerine/day (7.3 ME/day); supplementation with 0.5 kg high-purity glycerine/day (7.4 ME/day); and a control group with no extra energy supplementation of the diet, and thus the diets were not isoenergetic. The low-purity glycerine contained 88.1% glycerine, 9.3% water, 0.9% ash and 0.8% methanol, and the high-purity glycerine contained 99.5% glycerine (AkoGly 100, AarhusKarlshamn, Karlshamn, Sweden). The experimental period started 2 days after parturition and continued for 4 weeks. Cows were not adapted to glycerine when the experiment started by feeding the compounds during the dry period.
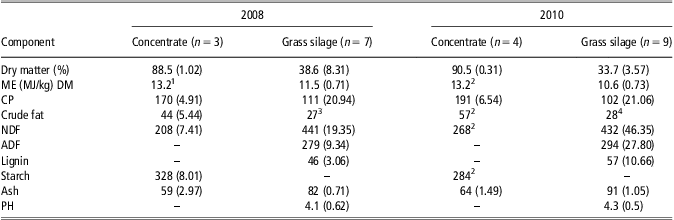
The cows were housed indoors in individual tie stalls on rubber mats with chopped straw as bedding throughout the experiment. The amount of silage fed was adjusted to ensure ad libitum consumption with approximately 5 to 10% feed refusals. At calving, the amount of concentrate fed was 2 kg/day for primiparous cows and 4 kg/day for multiparous cows and the amount was increased to about 6 kg/day for primiparous cows and about 7 kg/day for multiparous cows at 1 week after parturition. A restricted concentrate ration that was similar for all cows was used to facilitate determination of treatment effects on silage intake. The ingredients in the concentrate mixture were (% of DM): oats (23.4), barley (23.2), peas (20.0), rapeseed cake (12.5), beet fibre (9.0), wheat bran (7.0), whole crushed rapeseed (2.5), minerals and vitamins (2.4; EKO, Lantmännen Lantbruk, Sweden). The cows had free access to water cups, salt-licks and minerals (%): Ca (2.2), P (6.0), Mg (23.0) and Na (8.0; Gårdsmineral, Kvarnbyfoder, Sweden). Silage and concentrates were fed separately at 0600, 0900, 1300 and 1700 h. Glycerine was poured, in equal amounts, twice daily on top of the concentrate at 0900 and 1700 h. The chemical composition of the feeds is shown in Table 1. All cows in the third lactation or older received an oral milk fever prophylactic treatment containing calcium (Bovikalc®, Boeringer Ingelheim GmbH, Ingelheim am Rhein, Germany) within 16 h after parturition. Milking was performed twice per day, starting at approximately 0630 and 1530 h.
Composition of the concentrates and grass silages used (g/kg DM unless otherwise stated)
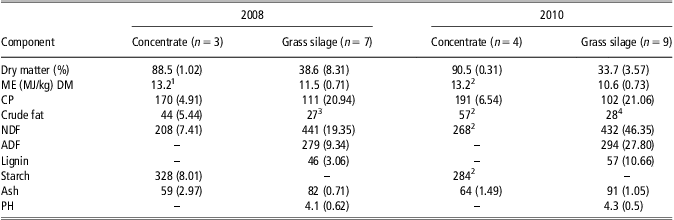
Glycerine was poured on top of the concentrate, thus diets were not isoenergetic. Data are based on 2008 (January to June) and 2010 (March to July) and are presented as mean analysis for composite samples (standard deviations).
ME = metabolisable energy.
1Metabolisable energy reported from the feed manufacturer (EKO, Lantmännen Lantbruk, Malmö Sweden).
2Metabolisable energy, crude fat, NDF and starch reported by the feed manufacturer (Solid 120, Lantmännen Lantbruk, Malmö Sweden).
3Pooled sample (n = 7).
4Pooled sample (n = 9).
Sampling and laboratory procedures
Feed refusals were weighed daily. Samples of silage were collected 5 days a week, immediately frozen and pooled into one sample over a 14-day period. Concentrate was sampled twice a week, and pooled in the same way as the silage. Conventional chemical analyses: DM, NDF assayed with heat stable amylase and expressed exclusive of residual ash (aNDFom), ADF, lignin, CP and starch (for concentrate), ash and calculated ME were performed as described by Bertilsson and Murphy (Reference Bertilsson and Murphy2003). Crude fat content was determined according to standard procedures (Anonymous, 2009). Determination of pH was performed on silage juice.
Blood was sampled from a coccygeal artery or vein into heparinised 10-ml vacuum tubes with lithium heparin as anticoagulant (Venoject, Terumo Europe N.V., Leuven, Belgium). Blood sampling was performed between 0930 and 1100 h once a week. The blood was centrifuged within 1 h after sampling at 1800 × g for 10 min at 20°C and the plasma samples were stored at –20°C until further analysis. All plasma samples were centrifuged at 13 200 × g for 5 min at 20°C after thawing. Plasma was analysed for glycerine and glucose using enzymatic colorimetric tests (Glycerol, R-Biopharm AG, Darmstadt, Germany and Glucose liquicolor, Human, Wiesbaden, Germany) and spectrophotometry (Ultrospec K, Boule Nordic, Huddinge, Sweden). The insulin concentration in plasma was analysed using a commercial enzyme immunoassay method adapted for bovines (Mercodia Ultrasensitive Bovine Insulin ELISA, Mercodia AB, Uppsala, Sweden) and the concentration of non-esterified fatty acids (NEFA) in plasma using an enzymatic colorimetric test (NEFA C, Wako Chemicals GmbH, Neuss, Germany). The concentration of β-hydroxybutyrate (BHBA) in plasma was analysed by a kinetic enzymatic method (RANBUT, Randox Laboratories Limited, Crumlin, UK), all using a combined shaker and plate reader (Multiscan FC, Thermo Fisher Scientific, Vantaa, Finland).
Milk yield was measured at four consecutive milkings/week using Truetest tubes in 2008 and a milk metre in the DelPro system (mm25w, De Laval, Tumba, Sweden) in 2010, and milk samples were taken from individual cows at the same time. Milk sampling tubes containing ∼50 ml milk were preserved with 50 μl (20% w/v) 2-bromo-2-nitropropane-1.3-diol (VWR International AB, Stockholm, Sweden). The milk samples were stored at 4°C and analysed for protein, fat and lactose on the following day by an infrared spectroscopy method (Fourier Transform Instrument, FT 120, Foss Electric, Hillerød, Denmark).
Body condition score (BCS) was recorded twice during the experiment, immediately after parturition and at the end of the experiment, by one individual using a 5-point scale with half-point increments, where a score of 1 indicates severe underconditioning and a score of 5 indicates severe obesity (Gillund et al., Reference Gillund, Reksen, Karlberg, Randby, Engeland and Lutnæs1999).
Statistical analysis
The data were analysed using the MIXED procedure of SAS (version 9.2; SAS Institute Inc., Cary, NC, USA, 2008). The model accounted for effects of treatment, parity group, year and time (as day or week) and data from each cow were subjected to first-order autoregressive covariance structures for each variable tested. The effect of treatment on kg DM silage intake and total DMI were analysed using repeated measures by day. Average weekly milk production; milk yield and milk composition, and plasma metabolites were analysed using repeated measures by week. Analyses of BCS were performed using the difference between week 1 and week 4 for each cow. The feed conversion ratio (FCR) expressed as kg ECM/kg DM for each treatment and week was also analysed. The fixed effects included in the models were treatment group (3 levels), year (2 levels), day (28 levels) or week (4 levels) and parity group (2 levels), and the two-way interactions year × treatment, day or week × treatment and parity × treatment. Non-significant interactions (P > 0.20) were dropped from the model one at a time, starting with the least significant, for each variable tested. Designed contrasts were low-purity glycerine v. no glycerine (control group), high-purity glycerine v. no glycerine (control group) and low-purity glycerine v. high-purity glycerine. Least square means were calculated using the LSMEANS/PDIFF option, and statistical differences between diets were determined following the Tukey adjustment (P = 0.05). The effect of blocks was tested in the initial model for each variable tested and then dropped from the model when no significant effects could be shown. Variable residuals were checked for normality and insulin and NEFA values required log transformation before statistical analysis.
The fixed effects were considered significant at P < 0.05 and trends noted if 0.05 < P < 0.10. Results from the statistical analyses are presented as least squares means and associated standard error of the means. Thirty-two cows completed the experiment. Data from four cows in 2008 were omitted from the statistical analysis because of a respiratory syncytial virus infection in the herd, and data from two cows in 2008 and four cows in 2010 were excluded because of mastitis. Data reported were for 10 cows in the control group, 12 cows fed low-purity glycerine and 10 cows fed high-purity glycerine, including two primiparous cows in the control group, and three primiparous cows each in the low- and high-purity glycerine groups.
Results
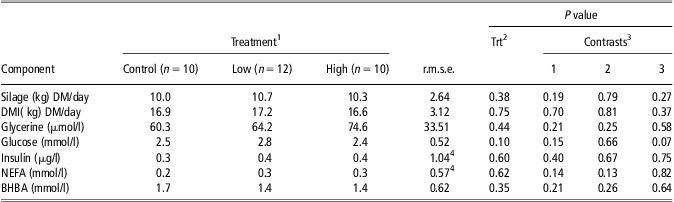
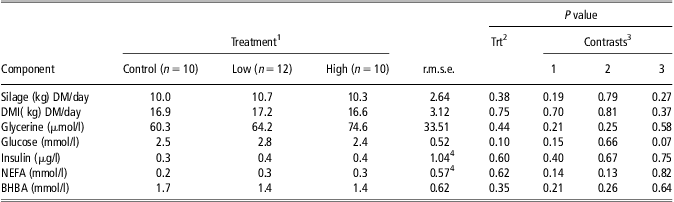
Cows fed glycerine and the control group had similar daily silage intake and total DMI during the first 4 weeks of lactation (P = 0.38 and P = 0.75, respectively; Table 2). Silage intake and total DMI differed between years (P = 0.01 and P = 0.04, respectively), with a higher amount of silage intake in 2008 than in 2010 and, conversely, a lower amount of total DMI in 2008 than in 2010. Silage intake was similar between primiparous and multiparous cows (P = 0.14), and there was a tendency for higher total DMI (P = 0.05) in multiparous cows compared with primiparous cows.
Silage and total DM intake and plasma metabolites during 4 weeks after parturition in cows fed high-purity glycerine, low-purity glycerine and the control diet
Results in least squares mean.
DM = dry matter; DMI = dry matter intake; NEFA = non-esterified fatty acids; BHBA = β-hydroxybutyrate.
1Treatments: control = without addition of extra energy supplementation to the diet; low-purity glycerine = 0.5 kg/day; high-purity glycerine = 0.5 kg/day.
2Effect of treatment.
3Contrasts: 1 = low-purity glycerine v. control group, 2 = high-purity glycerine v. control group, 3 = low-purity glycerine v. high-purity glycerine.
4Values are based on log-transformed data.
Glycerine concentration in plasma did not differ among treatments (P = 0.44; Table 2). The concentration of glycerine in plasma differed between years (P = 0.03), with higher concentrations in 2008 than in 2010. However, the concentration of glycerine in plasma did not differ between primiparous and multiparous cows (P = 0.88) and did not change over time (P = 0.78). Glucose concentration in plasma tended to be higher in cows consuming low-purity glycerine (P = 0.07). The concentration of glucose in plasma altered over time (P = 0.003), with decreased concentration during the second and third week compared with the first and fourth week. Primiparous cows had a higher glucose concentration in plasma (P = 0.01) than multiparous cows. No main effects of treatment on the concentrations of insulin (P = 0.60), NEFA (P = 0.62) and BHBA (P = 0.35) in plasma were observed. However, the insulin concentration in plasma tended to increase the last 2 weeks of the experiment (P = 0.05). There were no differences in concentration of insulin in plasma between primiparous and multiparous cows (P = 0.94) or between years (P = 0.18). The concentration of NEFA in plasma did not differ with parity number (P = 0.47), week (P = 0.73) or year (P = 0.77). The concentration of BHBA in plasma was lower during the first week than during the remaining weeks (P < 0.001). There were no effects of parity number (P = 0.28) or year (P = 0.45) on BHBA concentration in plasma.
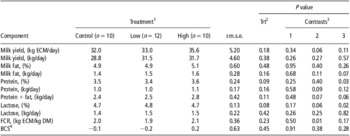
Cows fed high-purity glycerine tended to have higher milk yield expressed as kg ECM/day than the control group (P = 0.06), whereas no differences in yield expressed as kg milk/day were observed (P = 0.27; Table 3). All cows increased their milk yield (kg ECM/day and kg milk/day) week-by-week during the experiment (P = 0.003 and P < 0.001, respectively). The milk yield as kg ECM and kg milk differed between years, (P = 0.01 and P = 0.007, respectively), with lower milk yield in 2008 than in 2010. Differences in milk yield between primiparous and multiparous cows as kg ECM/day were not observed (P = 0.42). Milk composition altered over time, with decreasing fat concentration (P = 0.03) and protein concentration (P < 0.001) and increasing lactose concentration (P < 0.001) during the experiment. Milk fat concentration and milk fat (kg/day) did not differ among treatments (P = 0.48 and P = 0.16, respectively). Cows fed high-purity glycerine had a tendency for higher milk fat (kg/day) than in cows fed low-purity glycerine (P = 0.07), whereas no differences in milk fat concentration were observed (P = 0.26). In addition, there was a tendency for higher protein + fat (kg/day) in cows fed high-purity glycerine than in cows fed low-purity glycerine (P = 0.06) and the control group (P = 0.07). The milk fat concentration in 2010 tended to be lower than in 2008 (P = 0.05). Differences in milk fat concentration between primiparous and multiparous cows were not observed (P = 0.62). The milk protein concentration tended to differ among treatments (P = 0.09) and cows fed high-purity glycerine had higher milk protein concentration than cows fed low-purity glycerine (P = 0.03). The milk protein concentration differed between years (P =< 0.001), with lower protein concentration in 2010 than in 2008. Multiparous cows had a higher milk protein concentration (P = 0.02) than primiparous cows. The milk lactose concentration tended to differ among treatments (P = 0.08) and cows fed low-purity glycerine had higher milk lactose concentration than cows fed high-purity glycerine (P = 0.02). The milk lactose concentration differed between years (P = 0.007), with higher lactose concentration in 2010 than in 2008. Primiparous cows had a higher milk lactose concentration (P = 0.01) than multiparous cows. Cows fed high-purity glycerine had higher FCR (kg ECM/kg DM) than the control group (P = 0.01).
Milk yield and composition during 4 weeks after parturition in cows fed high-purity glycerine, low-purity glycerine and the control diet

Results in least squares mean.
ECM = energy corrected milk; FCR = feed conversion ratio; DM = dry matter; BCS = body condition score.
1Treatments: control = without addition of extra energy supplementation to the diet; low-purity glycerine = 0.5 kg/day; high-purity glycerine = 0.5 kg/day.
2Effect of treatment.
3Contrasts: 1 = low-purity glycerine v. control group, 2 = high-purity glycerine v. control group, 3 = low-purity glycerine v. high-purity glycerine.
4Change in BCS between weeks 1 and 4.
The change in BCS between weeks 1 and 4 was similar among treatments (P = 0.45) and there were no differences between years (P = 0.29). Multiparous cows lost more BCS than primiparous cows (P = 0.01). In total, the cows lost on average 0.3 BCS, and the score ranged from 2.5 at the start of the experiment to 2.2 at the end.
Discussion
The present study appears to be the first comparing the effects of glycerine products of different purities on feed intake. The results showed that neither of the two glycerine products tested affected total feed intake. The intake of concentrate, top-dressed with glycerine, was similar for the low- and high-purity glycerine treatments and there were virtually no concentrate refusals. Thus, methanol and other compounds in the low-purity glycerine obviously did not reduce feed intake. Methanol is a normal compound of rumen fluid and produced by rumen bacteria, especially when the animals are consuming diets containing pectins. Methanol, in turn, is metabolised by the rumen bacteria, to methane (Pol and Demeyer, 1987; Neumann et al., Reference Neumann, Weigand and Most1999). The intake of methanol in the present study, 2 g twice daily, did probably only induce a marginal increase in rumen fluid methanol concentration. The cows were fed silage ad libitum and silage intake was not affected by treatment, suggesting that the glycerine did not induce any metabolic satiety effect in the animals. In previous studies, glycerine has usually been top-dressed or mixed into TMR (DeFrain et al., Reference DeFrain, Hippen, Kalscheur and Jardon2004; Wang et al., Reference Wang, Liu, Yang, Huo, Dong, Huang, Yang and He2009; Carvalho et al., Reference Carvalho, Schmelz, White and Donkin2010) and feed intake was not affected by glycerine addition in any of these studies. Fisher et al. (Reference Fisher, Erfle and Sauer1971) reported an appetite-stimulating effect when feeding 472 g glycerine/day within the concentrate mixture. Donkin et al. (Reference Donkin, Koser, White, Doane and Cecava2009) found that high-purity glycerine could replace maize grain in diets for lactating dairy cows and that it could be included in rations to a level of at least 15% of DM without adverse effects on milk production or milk composition. Furthermore, up to 10% of DM can be supplied as impure forms of glycerine (Schröder and Südekum, Reference Schröder and Südekum1999). In the present study, the two types of glycerine tested did not replace any dietary fraction, but were instead added to the diet.
Higher plasma concentration of glycerine in blood plasma in cows receiving glycerine was not observed in the present study. In contrast, Goff and Horst (Reference Goff and Horst2001) observed increased glycerine concentrations in blood plasma when cows were drenched with glycerine. Glycerine is more metabolically favourable than propionate, as it enters the gluconeogenic pathway at the triose phosphate level (Leng, Reference Leng1970) and thus might efficiently contribute to glucose synthesis in the liver. However, despite improved availability of glycogenic substrates, in the present study the plasma levels of glucose and insulin were not affected by glycerine. Cows fed high-purity glycerine tended to have higher lactose yield and it might be speculated that increased lactose drain masked the improved glucose supply. The tendency for increased ECM yield in cows fed high-purity glycerine is in line with results reported by Bodarski et al. (Reference Bodarski, Wertelecki, Bommer and Gosiewski2005), who observed increased milk yield in cows fed a diet supplemented with glycerine at a rate of 300 or 400 ml/day during 10 weeks of lactation. In contrast, a number of studies have found no effect of glycerine on milk yield (Khalili et al., Reference Khalili, Varvikko, Toivonen, Hissa and Suvitie1997; Wang et al., Reference Wang, Liu, Yang, Huo, Dong, Huang, Yang and He2009; Carvalho et al., Reference Carvalho, Schmelz, White and Donkin2010), and DeFrain et al. Reference DeFrain, Hippen, Kalscheur and Jardon(2004) observed a tendency for decreased milk yield. However, in all these studies, concentrate was replaced by glycerine, whereas in the present study glycerine was provided in addition to concentrate. Cows receiving high-purity glycerine had a higher protein concentration in milk and tended to have higher yield of milk fat + protein than cows receiving low-purity glycerine. On the other hand, daily lactose production in cows receiving high- and low-purity glycerine was almost identical (P = 0.82). Thus, it is possible that the two glycerine products were equally good in improving glucose supply, and thus lactose synthesis, but that compounds in the low-purity glycerine negatively affected yield of milk fat and protein.
The energy status of early lactating dairy cows can be monitored indirectly by determination of NEFA and BHBA concentrations in blood plasma (Herdt, Reference Herdt2000). In the present study, these plasma compounds were not affected by treatment, nor were there any differences in loss of body condition during the 4-week experimental period. Taken together, these results indicate that energy balance was not affected by treatment. It is worth noting that the average plasma BHBA concentration ranged from 1.4 to 1.7 mmol/l for the three treatments in the present study. Duffield et al. (Reference Duffield, Lissemore, McBride and Leslie2009) concluded that cows with serum BHBA concentration higher than 1.4 mmol/l can be classified as subclinically hyperketonemic, and might be compromised and milk production may be reduced. The early lactating cows in the present study were fed a restricted amount of concentrate to determine treatment effects on silage intake without interactions with varying concentrate intake. It is possible that the limited concentrate allowance aggravated the negative energy balance and increased liver ketogenesis.
Conclusions
This study showed that both low- and high-purity glycerine can be supplemented to cows on a grass silage-based diet without negative effects on silage intake. Furthermore, high-purity glycerine-supplemented cows tended to yield more milk. Milk protein concentration was enhanced and milk fat + protein yield tended to be higher among cows receiving high-purity glycerine than cows fed low-purity glycerine.
Acknowledgements
The Swedish Farmers’ Foundation for Agricultural Research is acknowledged for financial support (Project H0530211). AarhusKarlshamn, Sweden, is gratefully acknowledged for providing the glycerine supplement used in the study. The authors thank Håkan Wallin and Camilla Andersson for technical assistance and for performing the analyses. We thank Claudia von Brömssen for statistical support.