





Impact statement
Existing research on adolescent suicide attempts in low- and lower-middle-income countries (LLMICs) has examined risk factors in isolation. This left the conditional interrelationships among behavioral, mental health and social factors poorly understood in these settings. Using network analysis, an approach not previously applied to this population in this research area, this study examined the conditional associations among suicide attempt risk and protective factors in 25,761 school-going adolescents across 12 LLMICs. A key finding is that behavioral factors, including drug use, smoking and alcohol use, showed the highest capacity to strongly connect other risk factors in the network, suggesting they may be important intervention points. Additionally, bullying and worrying also showed strong conditional associations with suicide attempts, while having close friends and peer support showed protective conditional associations. These findings offer an additional understanding of the risk and protective factors of suicide attempts in LLMICs, with implications for the design of school-based prevention programs that address behavioral risk factors and strengthen peer connectedness alongside mental health support. The findings also highlight areas of future research, including clustering and co-occurrence of these risk and protective factor profiles that lead to suicide attempts among adolescents.
Introduction
Suicide is the third-leading cause of death among adolescents globally (World Health Organization, 2024b). According to the World Health Organization (WHO), 73% of global suicides take place in low- and middle-income countries (World Health Organization, 2024b). Although countries in this group have seen gradual decreases in the burden of suicide among adolescents over the decades, low- and lower-middle-income countries (LLMICs) remain among those with some of the highest adolescent suicide mortality rates globally (Yan et al., Reference Yan, Luo, Mackay, Wang, Wang, Wang, Shiferaw, Wang, Tang and Yan2024). Previous suicide attempts are a known major risk factor for subsequent suicide death (O’Connor et al., Reference O’Connor, Cleare, Eschle, Wetherall and Kirtley2016; Turecki and Brent, Reference Turecki and Brent2016). A previous study found that the prevalence of suicide attempts among adolescents was 12.7% in 46 developing countries, with a higher prevalence among girls than boys (Li et al., Reference Li, You, Ruan, Xu, Mi, Cai and Han2021a).
Previous studies showed that suicide attempts were associated with sex, age, loneliness, anxiety, a lack of close friends, resilience, drug and alcohol use, among other factors (Tetteh et al., Reference Tetteh, Ekem-Ferguson, Swaray, Kugbey, Quarshie and Yawson2020; Li et al. Reference Li, You, Ruan, Xu, Mi, Cai and Han2021a, Reference Li, Zhao, Shi and Wang2021b; Diallo et al., Reference Diallo, Aldridge, Bass, Adams and Spira2023; Peng et al., Reference Peng, Tang, Wu, Tan and Pan2024; Tetteh et al., Reference Tetteh, Ekem-Ferguson, Quarshie, Dwomoh, Swaray, Otchi, Adomako, Quansah and Yawson2024). Furthermore, factors including having friends, family support and positive emotions were previously found to be protective of suicidal ideation among adolescents (Diallo et al., Reference Diallo, Aldridge, Bass, Adams and Spira2023; Peng et al., Reference Peng, Tang, Wu, Tan and Pan2024).
Suicide was previously studied as a complex multidimensional phenomenon for which intervention includes a multitude of analyses and inputs (Turecki and Brent, Reference Turecki and Brent2016; Fonseca-Pedrero et al., Reference Fonseca-Pedrero, Al-Halabí, Pérez-Albéniz and Debbané2022; Holman and Williams, Reference Holman and Williams2022). In previous studies, when the complexity of suicide has been explored, it has been a result of multifaceted neurobiological, social and cultural factors, and many studies have emphasized the central role of mental disorders in the complex web of causation for suicide that has not been exhaustively studied to date (Haw and Hawton, Reference Haw and Hawton2015; De Berardis et al., Reference De Berardis, Martinotti and Di Giannantonio2018).
Additionally, with limited and low-quality data about suicidal behaviors in LLMICs (De Beurs et al., Reference De Beurs, Bockting, Kerkhof, Scheepers, O’Connor, Penninx and van de Leemput2021; Lovero et al., Reference Lovero, Dos Santos, Come, Wainberg and Oquendo2023; World Health Organization, 2025), previous studies that have focused on identifying factors associated with suicidal behavior have used regression methods, which use a single outcome and model predictors in a unidirectional framework. Network analysis measures conditional dependence by assuming no single unidirectional outcome, measuring interactions between all variables while accounting for the presence or absence of other variables, and identifies central nodes that are highly connected within the network, which may be key targets for interventions (Borsboom, Reference Borsboom2017; De Beurs et al., Reference De Beurs, Bockting, Kerkhof, Scheepers, O’Connor, Penninx and van de Leemput2021; Zhang and Chen, Reference Zhang and Chen2024). In addition to quantification, network analysis visualizes the complex interactions among the factors included in the model while controlling for all the other factors (Borsboom, Reference Borsboom2017; Ni et al., Reference Ni, Wang, Ou, Chen, Zeng, Liao and Yu2025). Network analysis was used in many studies to study the complexity of suicidal behavior (De Beurs, Reference De Beurs2017; De Beurs et al., Reference De Beurs, Van Borkulo and O’Connor2017; Fonseca-Pedrero et al., Reference Fonseca-Pedrero, Al-Halabí, Pérez-Albéniz and Debbané2022; Holman and Williams, Reference Holman and Williams2022; Fonseca-Pedrero et al., Reference Fonseca-Pedrero, Díez-Gómez, de la Barrera, Sebastian-Enesco, Ortuño-Sierra, Montoya-Castilla, Lucas-Molina, Inchausti and Pérez-Albéniz2024; Peng et al., Reference Peng, Tang, Wu, Tan and Pan2024; Choi et al., Reference Choi, Sempungu, Park, Yu, Lee, Han and Lee2025) and has emerged as a statistical method in psychiatric research with the ability to study the connections between risk and protective factors and the dynamics between variables around suicidal behavior, including suicide attempt (De Beurs, Reference De Beurs2017; De Beurs et al., Reference De Beurs, Bockting, Kerkhof, Scheepers, O’Connor, Penninx and van de Leemput2021; Fonseca-Pedrero et al., Reference Fonseca-Pedrero, Al-Halabí, Pérez-Albéniz and Debbané2022). In previous studies investigating adolescent suicide attempts in LLMICs, however, research using these methods has not been expedited (De Beurs et al., Reference De Beurs, Bockting, Kerkhof, Scheepers, O’Connor, Penninx and van de Leemput2021; World Health Organization, 2025).
This study, therefore, aimed to investigate the social, mental and behavioral risk and protective factors associated with suicide attempts among adolescents in LLMICs and to examine indirect and direct relationships between each variable and the other variables, including suicide attempts, through network analysis utilizing one of the few data sources that exist in LLMICs for suicide-related outcomes. We focused on only the LLMICs because most of these maintain the highest suicide mortality rate globally (Yan et al., Reference Yan, Luo, Mackay, Wang, Wang, Wang, Shiferaw, Wang, Tang and Yan2024). We also conducted sex-specific analyses to examine differences in networks between female and male adolescents.
Methods
Data sources and study sample
We used data from the Global School-Based Student Health Survey (GSHS). The GSHS are school-based, multi-country self-administered surveys developed by WHO and the United States Centers for Disease Control (World Health Organization, 2018). GSHS surveys are cross-sectional, conducted using two-stage cluster sampling to select participants for 158 surveys in 104 countries. In the first stage, schools are chosen with a selection probability proportional to enrollment size. In the second stage, in selected schools, classes are randomly selected with all students having a systematically equal opportunity of being selected. The surveys are pre-approved by the ministries of health and education in the countries. Additional explanations of the GSHS methodology have previously been provided elsewhere (World Health Organization, 2024a). Data from the GSHS are publicly available at https://extranet.who.int/ncdsmicrodata/index.php/home.
In this study, we selected data collected after 2010 from countries classified as low-income countries or lower-middle-income countries by the World Bank classification (Metreau et al., Reference Metreau, Young and Eapen2024). For countries with more than one dataset, the most recent survey was selected. After setting our exclusion criteria, we excluded participants with missing data on any of the variables of interest and countries with response rates below 50%. Thus, our final sample included 25,761 participants from 12 countries, as shown in Table 1. Further descriptions of our exclusion criteria are included in the supplementary materials (Supplementary Figure S1).
Countries included in this study and study participants
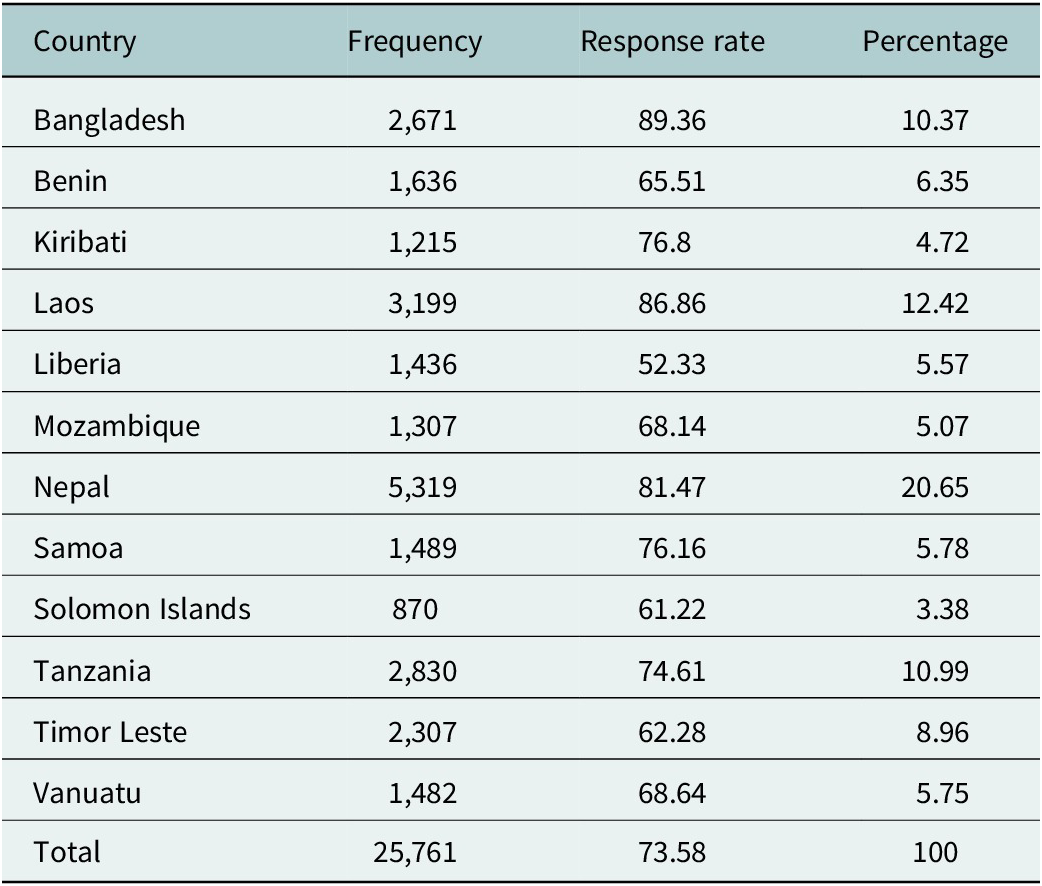
Table 1. Long description
The table contains four columns: Country, Frequency, Response rate, and Percentage.
* Bangladesh: 2,671 frequency, 89.36 response rate, 10.37 percentage.
* Benin: 1,636 frequency, 65.51 response rate, 6.35 percentage.
* Kiribati: 1,215 frequency, 76.8 response rate, 4.72 percentage.
* Laos: 3,199 frequency, 86.86 response rate, 12.42 percentage.
* Liberia: 1,436 frequency, 52.33 response rate, 5.57 percentage.
* Mozambique: 1,307 frequency, 68.14 response rate, 5.07 percentage.
* Nepal: 5,319 frequency, 81.47 response rate, 20.65 percentage.
* Samoa: 1,489 frequency, 76.16 response rate, 5.78 percentage.
* Solomon Islands: 870 frequency, 61.22 response rate, 3.38 percentage.
* Tanzania: 2,830 frequency, 74.61 response rate, 10.99 percentage.
* Timor Leste: 2,307 frequency, 62.28 response rate, 8.96 percentage.
* Vanuatu: 1,482 frequency, 68.64 response rate, 5.75 percentage.
* Total: 25,761 frequency, 73.58 response rate, 100 percentage.
Measures
Suicide attempt
Suicide attempt in this study was measured using a question that was asked to survey participants, quoting “During the past 12 months, how many times did you attempt suicide?”, with options including “0 times”, “1 time”, “2 or 3 times”, “4 or 5 times”, “6 or more times”. In this study, the question is recoded to mean that those who answered “0 times” have no suicide attempt, and the other responses mean the respondent attempted suicide.
Covariates
We used variables of socio-economic and behavioral importance, including sex (males versus females), age group (below 15 and 15 and above), physical attack, fighting, bullying, loneliness, worrying, having close friends, smoking, peer support, alcohol use and drug use. The most recent version of the GSHS questions used to collect data on these variables, along with the recoding into yes-or-no responses, is provided in the supplementary materials (Supplementary Table S1).
Statistical analyses
As all variables were recoded to have answers “yes” or “no,” binary variables used in this study are reported as numbers and percentages. As shown in Table 2. To estimate weighted percentages using complex survey weights from GSHS, we normalized individual weights across the 12 countries by dividing each by its country’s mean weight, then pooled. This ensured that each of the 12 countries contributed equally to the results, regardless of differences in sample size. This followed existing guidelines regarding the weighting of pooled results published previously (Elkasabi et al., Reference Elkasabi, Ren and Pullum2020).
Descriptive statistics of study participants
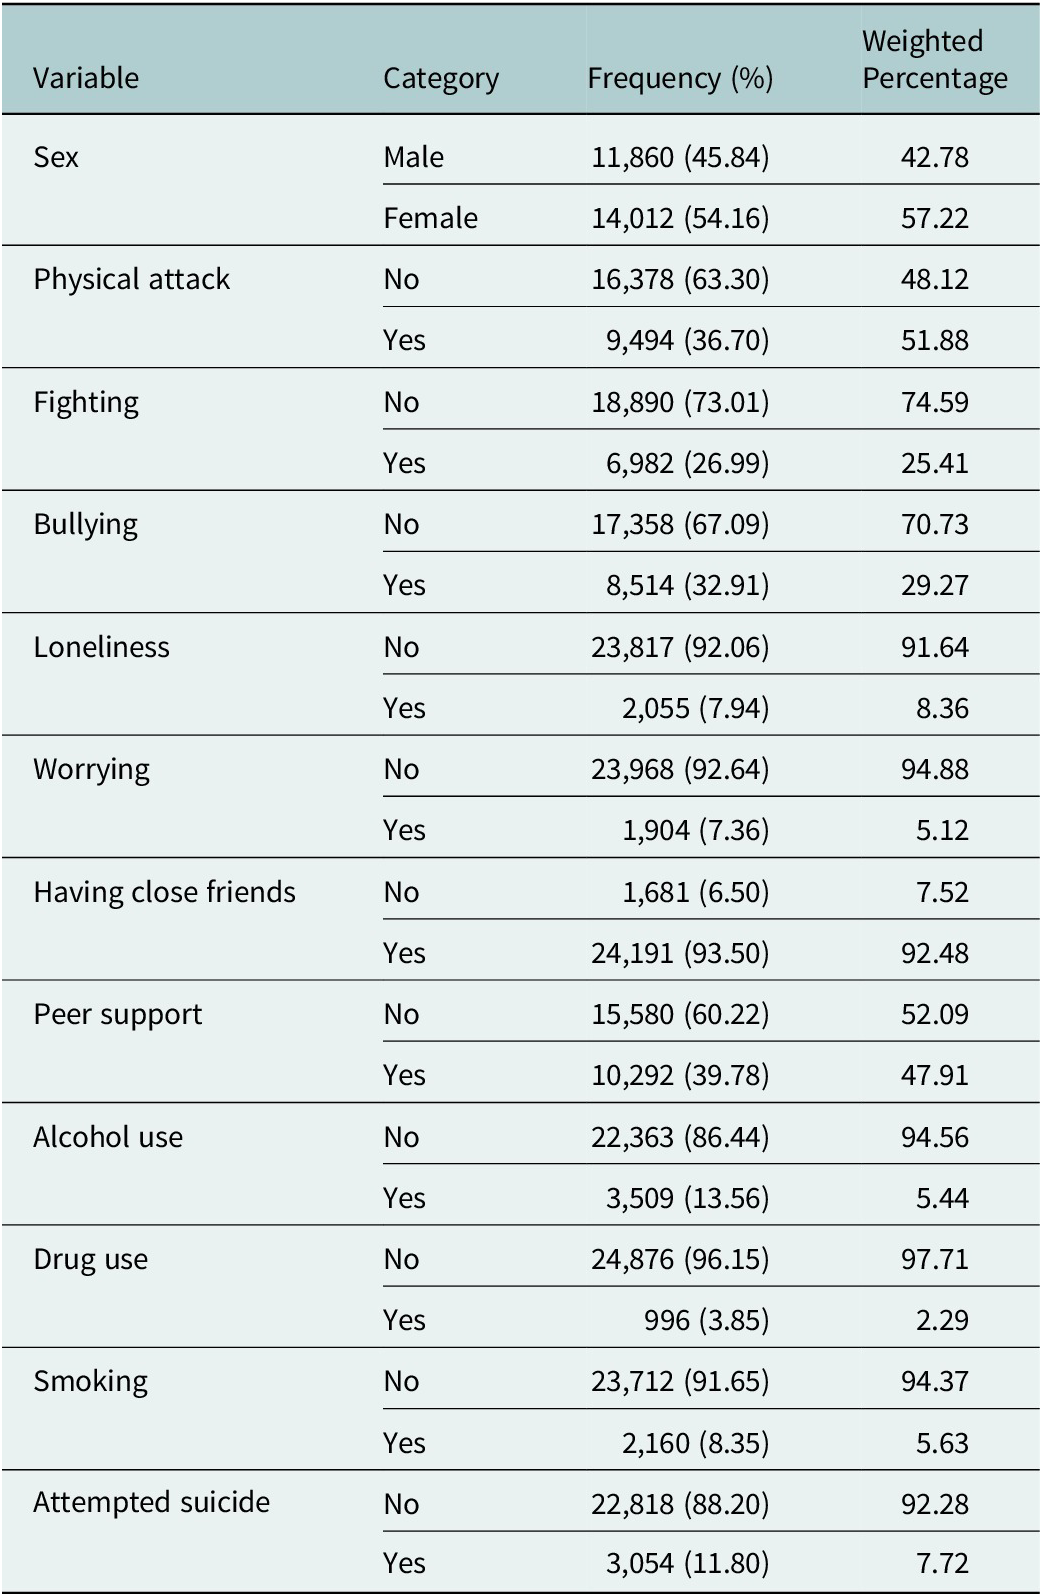
Table 2. Long description
The table contains four columns: Variable, Category, Frequency (%), and Weighted Percentage. Data is organized as follows:
* Sex: Male 11,860 (45.84%) with 42.78 weighted percentage; Female 14,012 (54.16%) with 57.22 weighted percentage.
* Physical attack: No 16,378 (63.30%) with 48.12 weighted percentage; Yes 9,494 (36.70%) with 51.88 weighted percentage.
* Fighting: No 18,890 (73.01%) with 74.59 weighted percentage; Yes 6,982 (26.99%) with 25.41 weighted percentage.
* Bullying: No 17,358 (67.09%) with 70.73 weighted percentage; Yes 8,514 (32.91%) with 29.27 weighted percentage.
* Loneliness: No 23,817 (92.06%) with 91.64 weighted percentage; Yes 2,055 (7.94%) with 8.36 weighted percentage.
* Worrying: No 23,968 (92.64%) with 94.88 weighted percentage; Yes 1,904 (7.36%) with 5.12 weighted percentage.
* Having close friends: No 1,681 (6.50%) with 7.52 weighted percentage; Yes 24,191 (93.50%) with 92.48 weighted percentage.
* Peer support: No 15,580 (60.22%) with 52.09 weighted percentage; Yes 10,292 (39.78%) with 47.91 weighted percentage.
* Alcohol use: No 22,363 (86.44%) with 94.56 weighted percentage; Yes 3,509 (13.56%) with 5.44 weighted percentage.
* Drug use: No 24,876 (96.15%) with 97.71 weighted percentage; Yes 996 (3.85%) with 2.29 weighted percentage.
* Smoking: No 23,712 (91.65%) with 94.37 weighted percentage; Yes 2,160 (8.35%) with 5.63 weighted percentage.
* Attempted suicide: No 22,818 (88.20%) with 92.28 weighted percentage; Yes 3,054 (11.80%) with 7.72 weighted percentage.
We fit a binary (Ising) network with the extended Lasso (eLasso) procedure implemented in “IsingFit.” (van Borkulo et al., Reference van Borkulo, Borsboom, Epskamp, Blanken, Boschloo, Schoevers and Waldorp2014; van Borkulo et al., Reference van Borkulo, Epskamp and van Borkulo2016). In this analysis, we set the hyperparameter to γ = 0.50. We used a neighborhood selection rule “AND” which retained only edges simultaneously selected in both nodewise regressions, maintaining a conservative structure in the resulting network. This means that the edge weights represent regularized conditional log-odds between the two nodes, while controlling for all others. The edge weights are not bound between −1 and 1, and values exceeding 1.0 are plausible and indicate strong conditional associations on the log-odds scale. In our visualization, edges with absolute weights below 0.10 were suppressed using a spring algorithm in “qgraph” (Epskamp et al., Reference Epskamp, Cramer, Waldorp, Schmittmann and Borsboom2012, Reference Epskamp, Borsboom and Fried2018). This visual threshold did not affect the estimation of the network structure. In the visualization, nodes were colored to show protective factors, risk factors and suicide; and edges were colored to indicate valence (burgundy = negative edge weights, midnight blue = positive edge weights). Network density and sparsity were computed using a minimum threshold of 0.01, retaining all edges with non-trivial weights and are ported consistently with this criterion in this article.
We also presented four estimates of node centrality, including strength, expected influence, closeness and betweenness. These are important for assessing the relative importance of the indicators in the network analysis. A node’s strength is computed by the sum of the magnitudes of each of its edges (Opsahl et al., Reference Opsahl, Agneessens and Skvoretz2010; De Beurs et al., Reference De Beurs, Van Borkulo and O’Connor2017). Expected influence is the signed sum of the edges attached to a node; it’s an indicator of the node’s role in activating the network and its neighbors (Robinaugh et al., Reference Robinaugh, Millner and McNally2016).
After conducting similar analyses as above for each sex, we also analyzed differences between male and female adolescents’ networks using the Network Comparison Test (NCT) (Van Borkulo et al., Reference Van Borkulo, van Bork, Boschloo, Kossakowski, Tio, Schoevers, Borsboom and Waldorp2023) using the “NetworkComparisontest” R package. NCT IS a resampling-based permutation test that compares two independently estimated networks on three aspects including network structure invariance, global strength and edge-level variance. Networks were re-estimated within each of 1,000 permutations of sex using the same analyses as used in the main analysis. The network structure invariance test statistic (M) is the maximum absolute edge-weight difference between the two networks. The global strength invariance test statistic (S) is the absolute difference in the sum of absolute edge weights between networks. Edge-level differences were tested for all 55 possible edges with Holm–Bonferroni correction, and strength invariance tested as a secondary analysis.
Sensitivity analysis
We gauged network accuracy using 1,000 nonparametric bootstrap resamples of the study’s full sample with the R package “bootnet”. Centrality stability was also tested using a 1,000-sample case-dropping bootstrap; the resulting correlation-stability coefficient was interpreted against the ≥.25 benchmark for robustness and found suitable (Epskamp et al., Reference Epskamp, Borsboom and Fried2018).
In this study, we excluded 9,252 adolescents who had any missing data on any of the variables included in the network analyses, representing 26.4% of the pooled sample (N = 35,013), to include 25,761 adolescents as shown in supplementary materials (Supplementary Figure S1). We therefore conducted survey-weighted logistic regression including country fixed effects to assess if there existed any differences between complete and missing cases to imply a selection bias. The results shown in the supplementary materials (Supplementary Table S2), indicated that excluded participants were more likely to report violence exposure, substance use and suicidal behaviors and this exclusion probability varied across countries (see Table 1 for response rates).
Data cleaning was carried out using STATA 18.5, and all analyses were performed using R using packages “haven”, “dplyr”, “IsingFit”, “qgraph” and “bootnet” (van Borkulo et al., Reference van Borkulo, Epskamp and van Borkulo2016; Epskamp et al., Reference Epskamp, Cramer, Waldorp, Schmittmann and Borsboom2012).
Results
Basic descriptive statistics
Among 25,761 participants from 12 countries, the majority were from Nepal (19.7%), Laos (11.8%) and Tanzania (10.5%). The sample comprised more females (54.2%) than males (45.8%). Among the participants, the prevalence of suicide attempts was 11.8% (n = 3,054) (Table 2).
Network
In Figure 1, we present a network structure of suicide attempts, risk factors and protective factors. The network shows factors clustering among risk factors, including mental health (loneliness and worrying), physical harm (physical attack, fighting and bullying), and behavioral factors (drug use, smoking and alcohol use). Results indicated that there were conditional associations between all risk factor clusters and suicide attempts. In the behavioral risk factors cluster, all factors had strong positive direct conditional associations with suicide attempt; that is, drug use (edge weight [EW] = 0.88), smoking (EW = 0.57) and alcohol use (EW = 0.45). Among the physical harm cluster, bullying had a strong positive conditional association with suicide attempt (EW = 0.75). In contrast, physical attack showed no direct conditional association, and fighting had an EW of 0.44. In the mental health cluster, worrying (EW = 0.61) had the strongest conditional positive association with suicide attempt. Loneliness (EW = 0.38), on the other hand, showed a weaker conditional positive association with suicide attempt.
Regularized conditional association network of mental health risk factors and protective behaviors in adolescents in LLMICs (N = 25,761). Edge weights <0.1 are suppressed and not visualized. alc, alcohol use; atk, physical attack; fgt, fighting; bul, bullying; drg, drug; frd – having close friends; lon, loneliness; per, peer support; smk, smoking; wor, worrying; sui, attempted suicide.
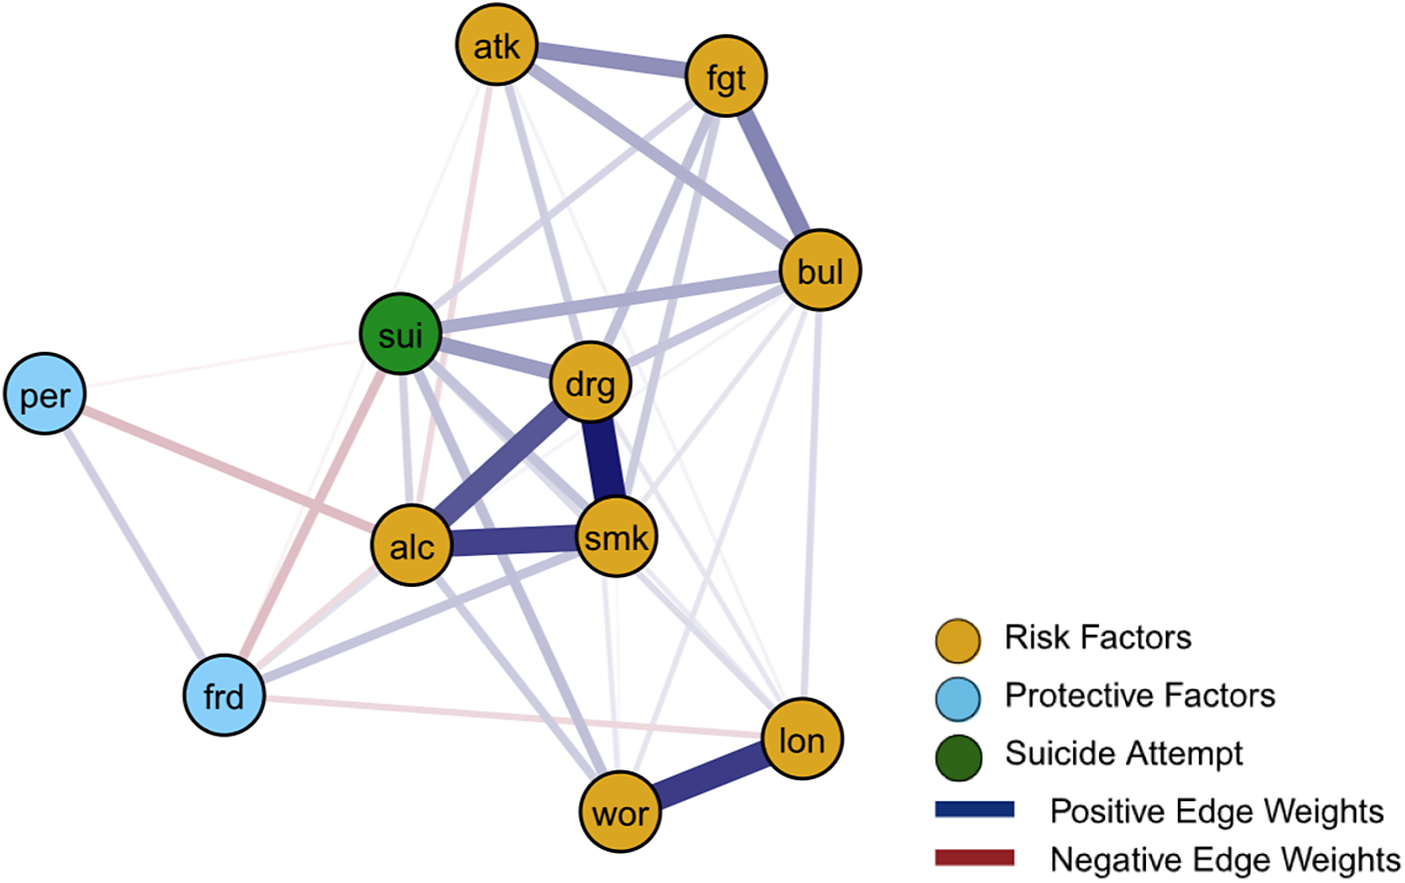
Figure 1. Long description
A network diagram with 11 circular nodes connected by lines of varying thickness. A legend on the right identifies yellow nodes as Risk Factors, light blue nodes as Protective Factors, and a dark green node as Suicide Attempt. Dark blue lines represent Positive Edge Weights, while red lines represent Negative Edge Weights.
* At the top are yellow nodes a t k (physical attack) and f g t (fighting), connected by a thick blue line.
* Below these is b u l (bullying), which has strong blue connections to f g t and a t k.
* In the center-left is the green node s u i (attempted suicide), connected to most other nodes. It has notable blue connections to b u l, a t k, and d r g (drug use).
* In the center is a tight triangular cluster of yellow nodes: d r g, a l c (alcohol use), and s m k (smoking), all joined by very thick dark blue lines.
* On the far left are light blue nodes p e r (peer support) and f r d (close friends). p e r has a red connection to a l c and a faint blue connection to f r d.
* At the bottom right are yellow nodes w o r (worrying) and l o n (loneliness), connected to each other by a thick blue line. l o n also has a faint red connection to f r d.
Among the two protective factors, having close friends (EW = −0.57) had a strong negative conditional association with suicide attempts, while peer support (EW = −0.19) was observed to have a weak conditional association but also a positive conditional association with having close friends and a negative conditional association with alcohol use. Other edge weights are shown in the supplementary materials (Supplementary Table S3).
As shown in Figure 2 suicide exhibited strong centrality relative to other covariates in the network across all measures. Behavioral factors like drug use (expected influence [EI] =1.43) and smoking (EI = 1.32) strongly connected the network more than other factors, indicating their capability to trigger other risk factors in the network. Bullying (EI = 0.54) was also an influential node within the estimated network. Having close friends (EI = −1.59) and peer support (EI = −1.7) had a low expected influence, indicating that they are likely to negatively influence other risk factors included in the network.
Centrality indices showing node importance in the adolescent suicidal attempt network. alc, alcohol use; atk, physical attack; fgt, fighting; bul, bullying; drg, drug; frd – having close friends; lon, loneliness; per, peer support; smk, smoking; wor, worrying; sui, attempted suicide.
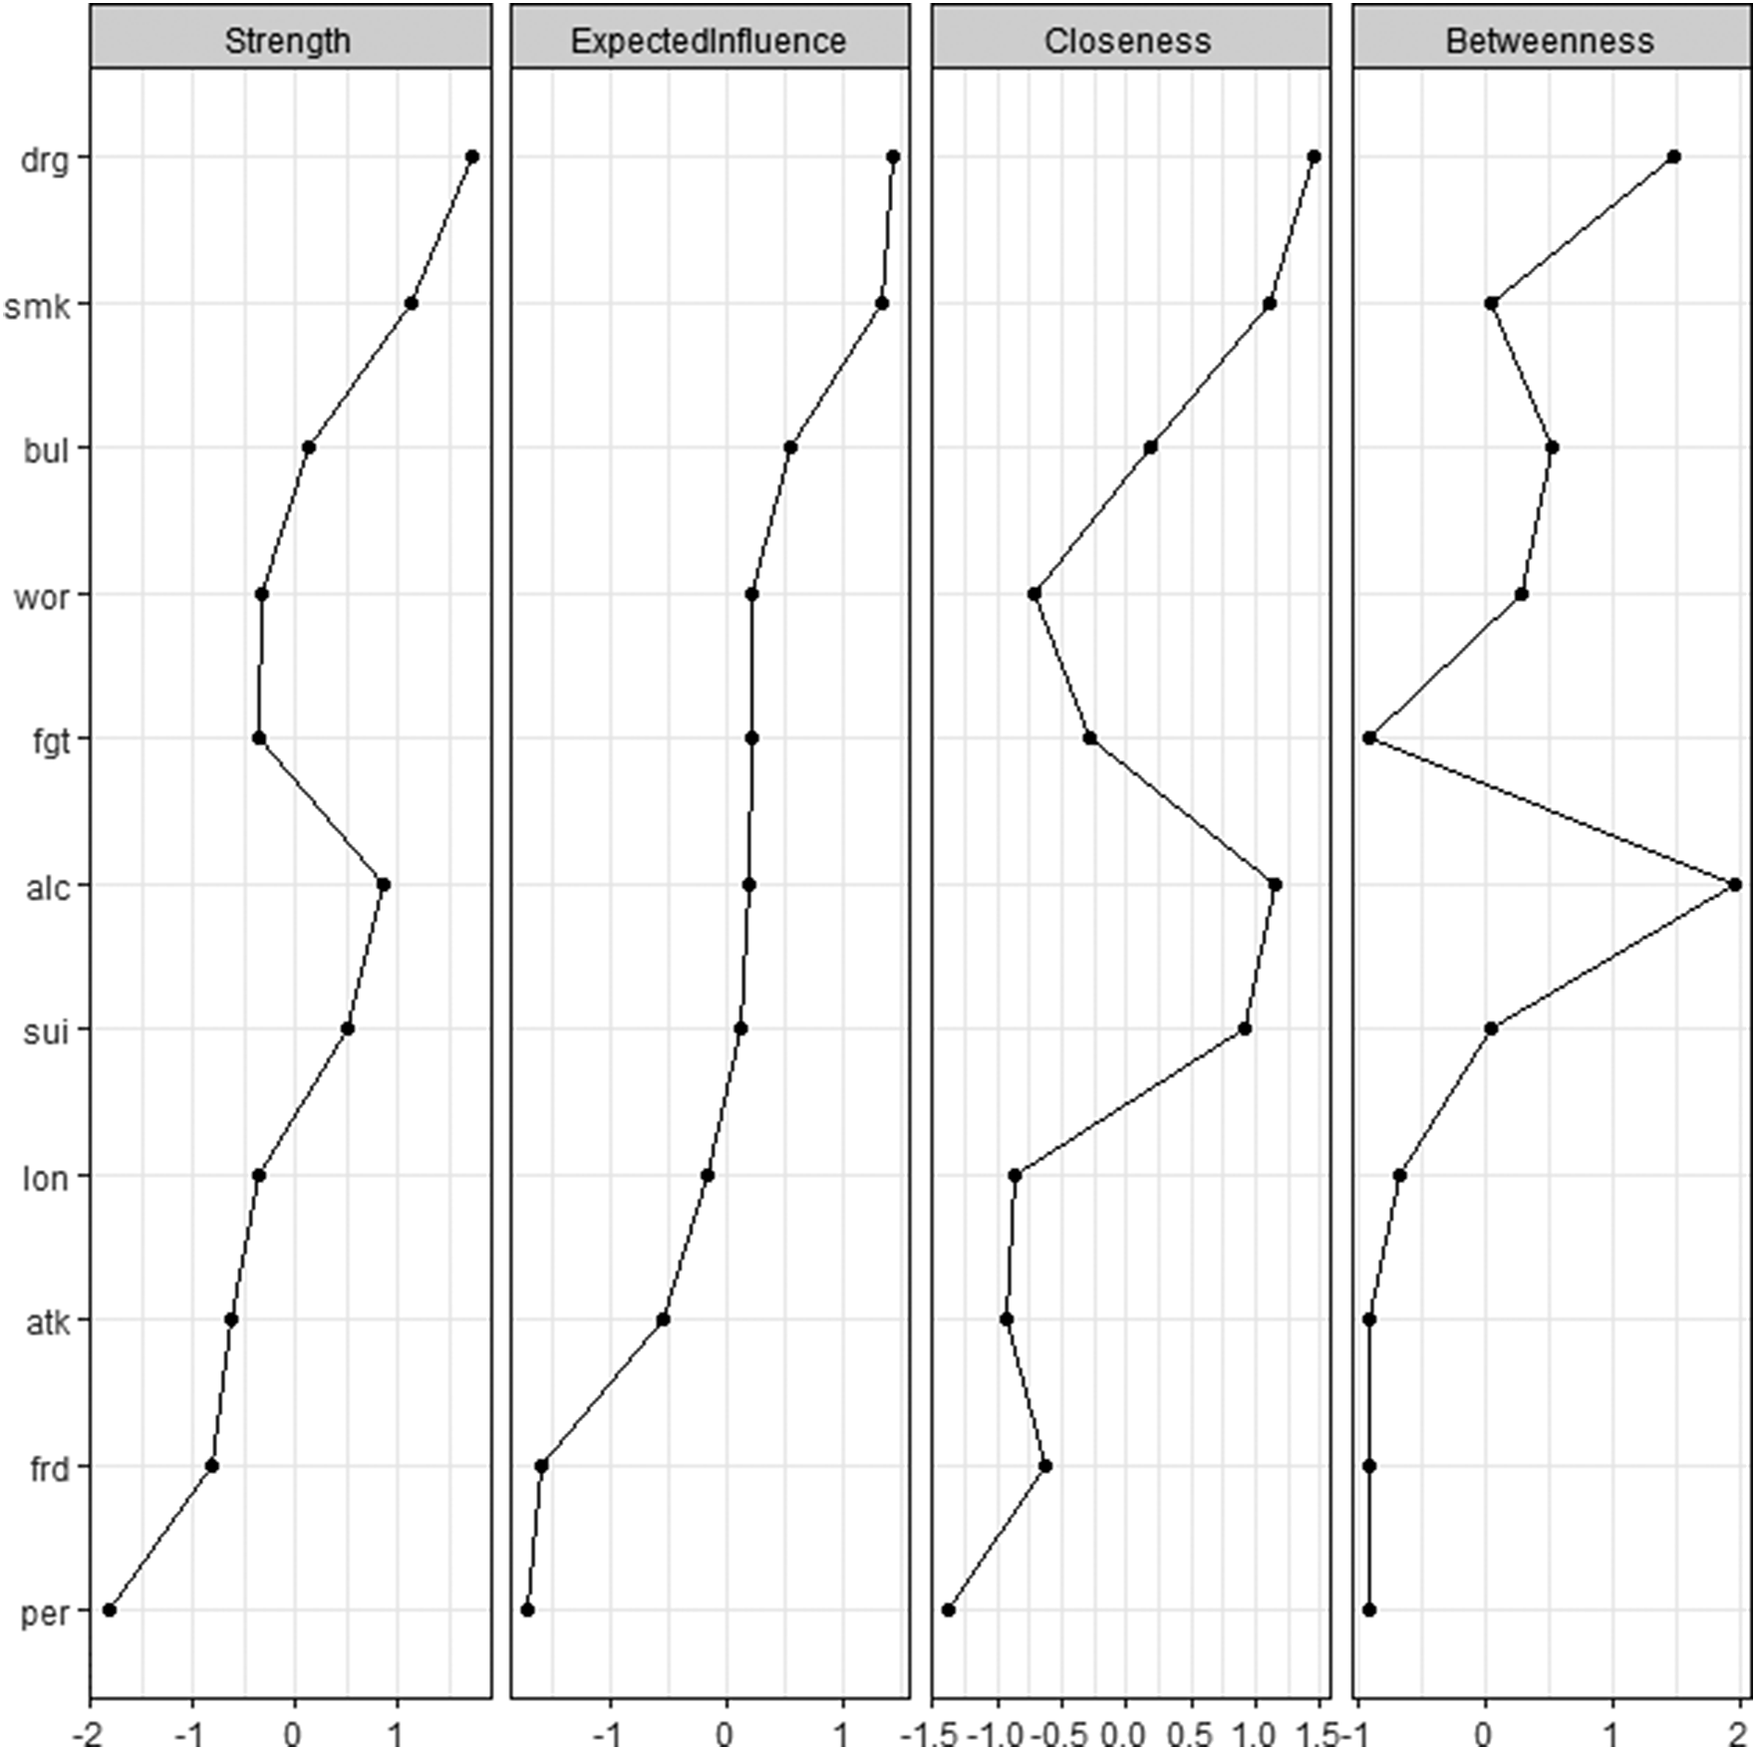
Figure 2. Long description
A multi-panel plot with four vertical sections. The shared Y-axis on the left lists eleven nodes from top to bottom: d r g, s m k, b u l, w o r, f g t, a l c, s u i, l o n, a t k, f r d, and p e r. Each panel has a unique X-axis scale representing standardized scores.
* Panel 1, Strength: The line starts at approximately 1.8 for d r g and trends generally downward to negative 1.8 for p e r. Notable peaks occur at a l c (0.8) and s u i (0.5).
* Panel 2, Expected Influence: The trend is similar to Strength, starting at 1.5 for d r g and ending at negative 1.8 for p e r. The line is more vertical between b u l and a l c, hovering near 0.2.
* Panel 3, Closeness: This panel shows higher variability. It starts at 1.5 for d r g, drops to negative 0.8 for w o r, peaks again at 1.2 for a l c, and ends at negative 1.5 for p e r.
* Panel 4, Betweenness: This panel shows the most extreme fluctuations. Most nodes cluster between negative 1 and 0.5, but a l c shows a significant outlier peak at 2.0, while f g t and a t k drop to the minimum value of negative 1.
Network comparisons
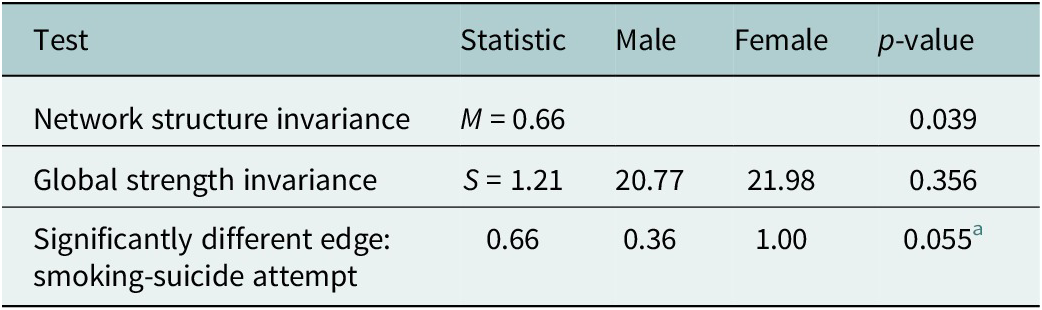
Network structures for the males and females are shown in Figure 3a and b, when we compared these networks using NCT, global strength did not differ between the networks (male = 20.77, female = 21.98 [S = 1.21], p = 0.356), indicating comparable overall connectivity. No node differed significantly in strength (best fit p = 0.066 for suicide attempt). The network structure invariance test was significant (M = 0.66, p = 0.039). M in this case reflected the largest absolute difference in EW, in this case the smoking-suicide attempts edge, which was stronger in the female network (EQ = 1.00) than in the male network (EW = 0.36 [Holm-corrected p = 0.55]). No other edge differed after correction (Results seen in Table 3 and other edge-level results are provided in Supplementary Table S4).
(a) Sex-specific regularized conditional association network of mental health risk factors and protective behaviors in adolescents in LLMICs for females (n = 13,964). (b) Sex-specific regularized conditional association network of mental health risk factors and protective behaviors in adolescents in LLMICs for males (n = 11,797). Edge weights <0.1 are suppressed and not visualized. alc, alcohol use; atk, physical attack; fgt, fighting; bul, bullying; drg, drug; frd – having close friends; lon, loneliness; per, peer support; smk, smoking; wor, worrying; sui, attempted suicide.
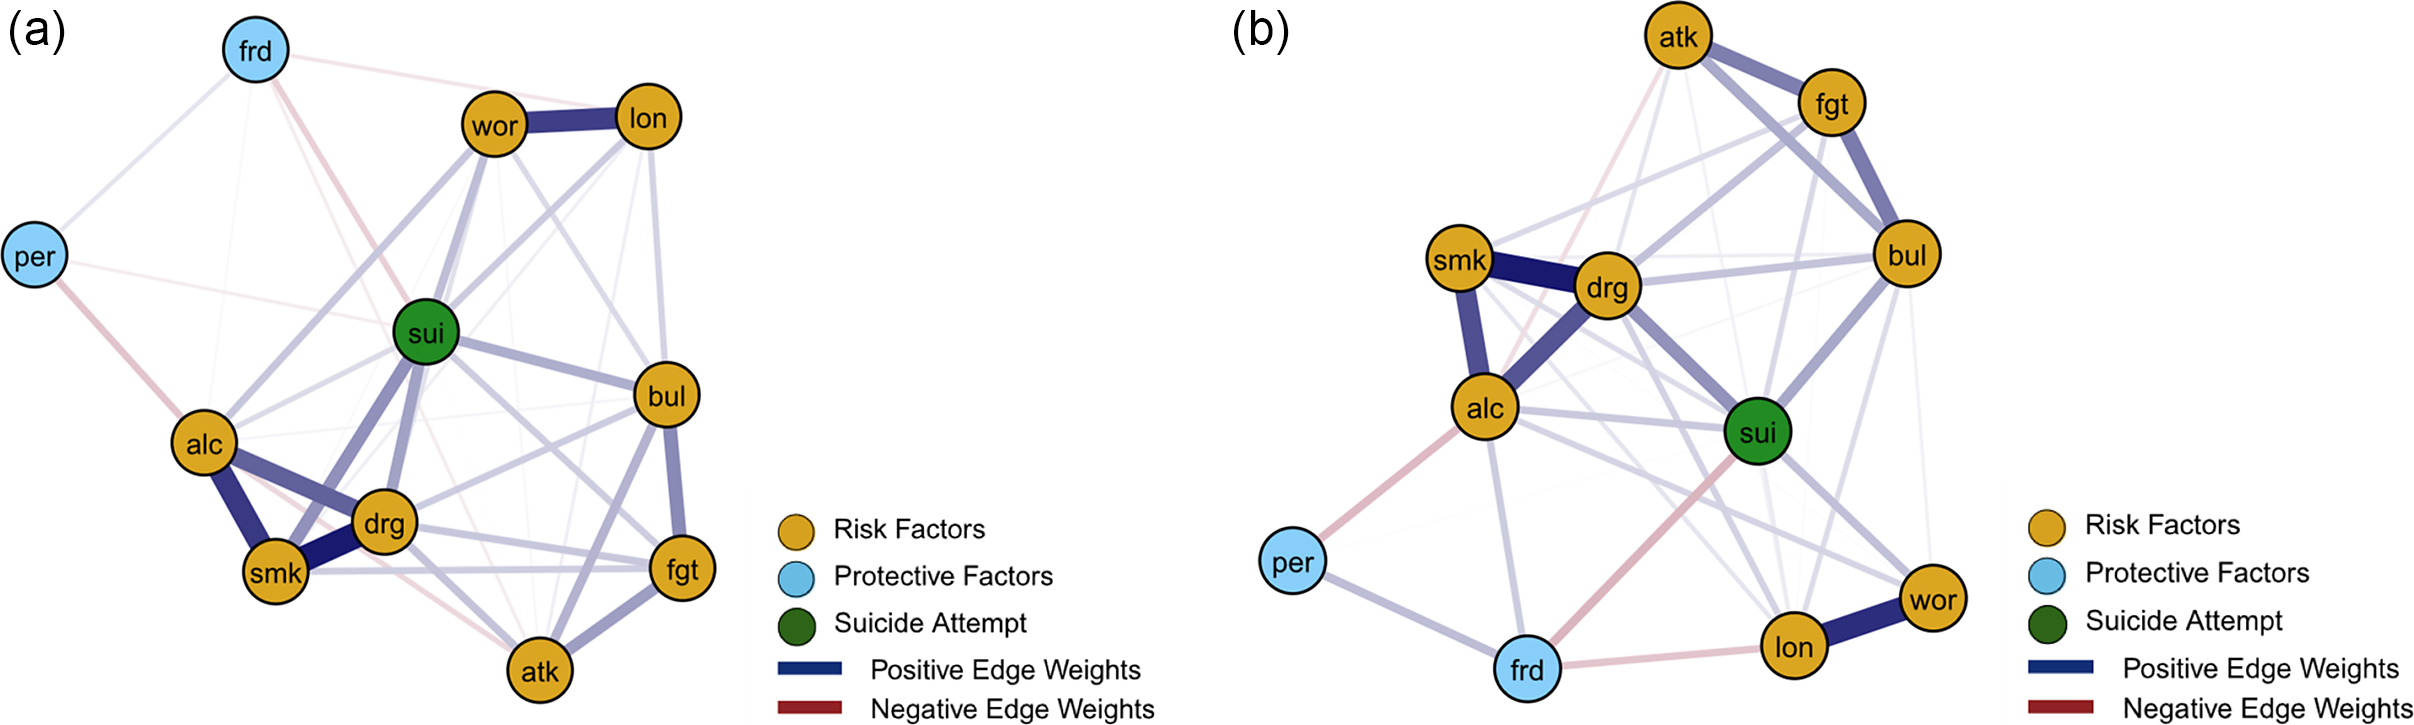
Figure 3. Long description
A network diagram with circular nodes connected by lines of varying thickness.
* At the center is a green node labeled s u i representing suicide attempt.
* Surrounding the center are yellow nodes representing risk factors. A thick blue line indicates a strong positive association between w o r (worrying) and l o n (loneliness) at the top.
* At the bottom left, a dense cluster of thick blue lines connects a l c (alcohol use), s m k (smoking), and d r g (drug use).
* Other yellow nodes include b u l (bullying), f g t (fighting), and a t k (physical attack) at the bottom right, which are interconnected with thinner blue lines.
* Light blue nodes representing protective factors, p e r (peer support) and f r d (close friends), are located on the far left and top left. They are connected to the risk factors by thin red lines, indicating negative associations.
A legend at the bottom right defines the colors and lines:
* Yellow circle: Risk Factors.
* Light blue circle: Protective Factors.
* Green circle: Suicide Attempt.
* Thick blue line: Positive Edge Weights.
* Thin red line: Negative Edge Weights.
Network comparison tests for males and females
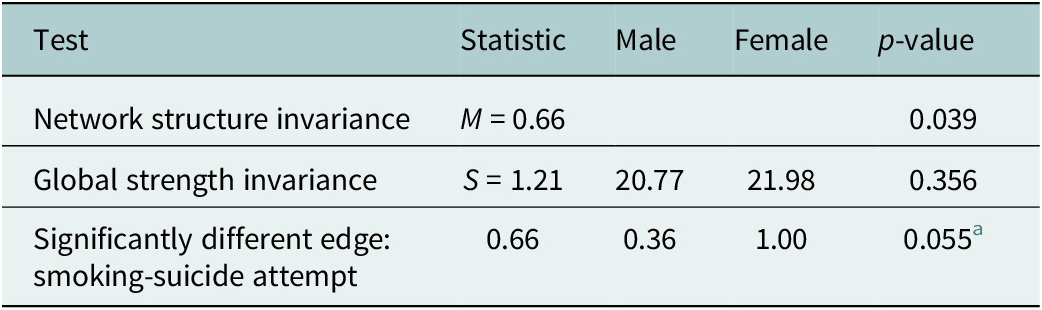
Table 3. Long description
The table consists of five columns: Test, Statistic, Male, Female, and p-value.
* Row 1: Network structure invariance. Statistic M equals 0.66. Male and Female columns are empty. p-value is 0.039.
* Row 2: Global strength invariance. Statistic S equals 1.21. Male value is 20.77. Female value is 21.98. p-value is 0.356.
* Row 3: Significantly different edge: smoking-suicide attempt. Statistic is 0.66. Male value is 0.36. Female value is 1.00. p-value is 0.055 super a.
Footnotes indicate that N C T was performed with 1,000 permutations. M represents the maximum absolute edge-weight difference across 55 edges. S represents the absolute difference in global strength. Edge-level p-values are Holm-Bonferroni corrected. The value 0.055 is the minimum attainable Holm-adjusted p-value.
Notes: NCT with 1,000 permutations (Van Borkulo et al., Reference Van Borkulo, van Bork, Boschloo, Kossakowski, Tio, Schoevers, Borsboom and Waldorp2023). Networks re-estimated within each permutation using IsingFit (AND-rule, γ = 0.5). M = maximum absolute edge-weight difference across all 55 edges; its null distribution is constructed over all edges and is therefore inherently corrected for multiple comparisons. S = absolute difference in global strength (sum of absolute edge weights). Edge-level p-values Holm–Bonferroni corrected across 55 comparisons.
a 055 is the minimum attainable Holm-adjusted p-value given 1,000 permutations and 55 edge comparisons.
Sensitivity analysis
We carried out two robust tests to ensure consistency and reliability. We first performed 1,000 non-parametric bootstrap resamples of the full networks to achieve 95% bootstrap confidence intervals (BCI) for each edge weight. The strongest positive and negative associations retained narrow BCIs that did not cross the 0 line. Even moderate associations were significant at p < 0.05 (Figure 4, Supplementary Table S5). We also performed case-dropping bootstrapping with 1,000 resamples to compute node strength at each time point and calculate the correlation stability (CS) coefficient. The CS was 0.75, indicating that up to 75% of the sample could be omitted, and the ordering of node strength would still exceed r = 0.70 (Supplementary Figure S2).
Bootstrap confidence intervals for network edge weights (1,000 bootstrap samples). alcohol, alcohol use; attack, physical attack; attempted_sui, attempted suicide; bully, bullying; current_smoking, smoking; drug, drug use; fight, fighting; friends, having close friends, lonely, loneliness; peer, peer support; worrying, worrying.
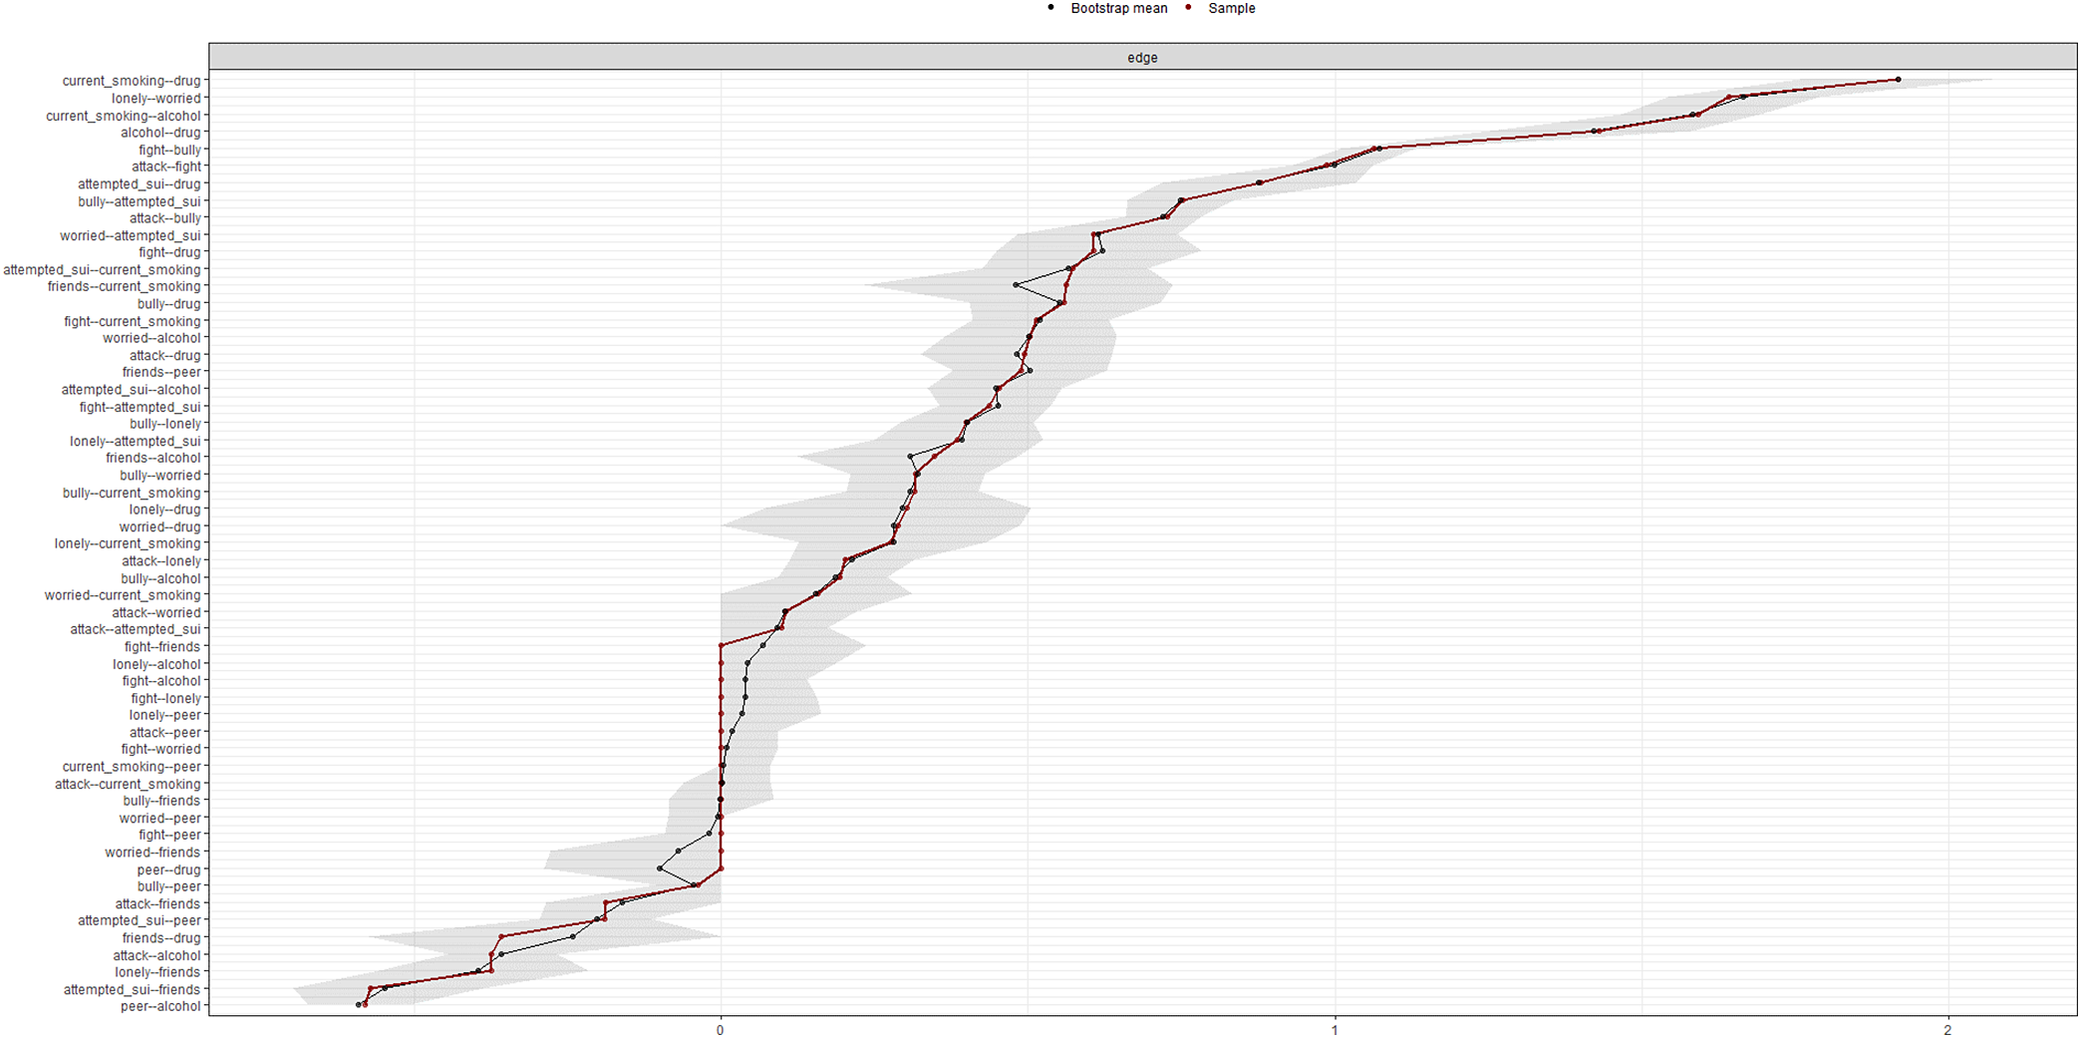
Figure 4. Long description
A network diagram with 11 circular nodes connected by lines of varying thickness and color.
Nodes and Connections:
* At the center is a green node labeled s u i (suicide attempt). It is connected to almost all other nodes.
* Surrounding the center are yellow nodes representing risk factors: a t k (attack), f g t (fighting), b u l (bullying), d r g (drug use), s m k (smoking), a l c (alcohol use), l o n (loneliness), and w o r (worrying).
* At the bottom-left periphery are light blue nodes representing protective factors: p e r (peer support) and f r d (close friends).
* Line thickness represents the strength of the relationship. The thickest blue lines connect s m k to d r g, a l c to d r g, and l o n to w o r.
* Line color indicates the nature of the relationship: dark blue lines represent positive edge weights (positive correlation), while thin red lines represent negative edge weights (negative correlation).
Legend on the right:
* Yellow circle: Risk Factors.
* Light blue circle: Protective Factors.
* Green circle: Suicide Attempt.
* Dark blue line: Positive Edge Weights.
* Dark red line: Negative Edge Weights.
Discussion
Main findings
Our study included 25,761 adolescents from 12 LLMICs. Using the GSHS, we applied a network analytical framework to estimate the conditional interrelationships among risk and protective factors associated with suicide attempts. This approach goes beyond standard regression by modelling how factors relate to one another and to suicide attempts within a single structure. Factors were clustered into three domains: mental health (loneliness and worrying), physical harm (physical attack, fighting and bullying) and behavioral factors (drug use, smoking and alcohol use). Within these clusters, most risk factors showed positive conditional associations with suicide attempts; notably, physical attack showed no direct conditional association. Both having close friends and peer support showed negative conditional associations with suicide attempts. These associations persisted after factors including mental health, physical harm and behavioral factors were accounted for in the network. The network was robust across sensitivity analyses, suggesting that suicide attempts are conditionally associated with a complex interdependent system of factors rather than a single predictor.
Comparison with previous studies
Previous studies have found that social determinants of health at an individual level are associated with suicide attempts and other suicidal behavior (Aggarwal et al., Reference Aggarwal, Patton, Reavley, Sreenivasan and Berk2017; Hasan et al., Reference Hasan, Fatima, Pandey, Tariqujjaman, Cleary, Baxter and Mamun2021; Tetteh et al., Reference Tetteh, Ekem-Ferguson, Quarshie, Swaray, Ayanore, Seneadza, Asante and Yawson2021; Holman and Williams, Reference Holman and Williams2022; Diallo et al., Reference Diallo, Aldridge, Bass, Adams and Spira2023; Peng et al., Reference Peng, Tang, Wu, Tan and Pan2024). Factors including worrying, loneliness, having close friends, bullying and others were associated with suicidal behavior, including attempts, among adolescents in LLMICs (Tetteh et al., Reference Tetteh, Ekem-Ferguson, Quarshie, Swaray, Ayanore, Seneadza, Asante and Yawson2021; Diallo et al., Reference Diallo, Aldridge, Bass, Adams and Spira2023). Our study extends this literature by estimating conditional associations within a single network structure, thus highlighting the unique association between each factor and suicide attempt after accounting for all other factors in the network. This allows for identification of associations that persist independently, and those that could be explained by co-occurring factors, a distinction that standard regression analyses do not capture.
When network analyses were used elsewhere, similar clustering structures and conditional associations have been reported (Fonseca-Pedrero et al., Reference Fonseca-Pedrero, Al-Halabí, Pérez-Albéniz and Debbané2022; Fonseca-Pedrero et al., Reference Fonseca-Pedrero, Díez-Gómez, de la Barrera, Sebastian-Enesco, Ortuño-Sierra, Montoya-Castilla, Lucas-Molina, Inchausti and Pérez-Albéniz2024; Peng et al., Reference Peng, Tang, Wu, Tan and Pan2024), and the present findings are consistent with those structures. The co-occurrence of clustered risk factors is consistent with literature suggesting that overlapping risk factors are associated with a higher likelihood of suicide attempt among adolescents (Flores et al., Reference Flores, Swartz, Stuart and Wilcox2020). This clustering is also reflected in the integrated motivational-volitional model of suicidal behavior, which posits interactions across behavioral, psychological and social domains (O’Connor et al., Reference O’Connor, Cleare, Eschle, Wetherall and Kirtley2016). Previous research has shown that physical harm is associated with experiences of defeat among adolescents (Meltzer et al., Reference Meltzer, Vostanis, Ford, Bebbington and Dennis2011), and bullying and fighting have been associated with social defeat, depression, anxiety and loss of self-esteem (Björkqvist, Reference Björkqvist2001; Chen et al., Reference Chen, Fernandez-Egea, Rotenberg, Cardinal, Machado, Smythe, Ford and Kuper2025) which in turn are associated with suicidal behavior among adolescents (Li et al., Reference Li, You, Ruan, Xu, Mi, Cai and Han2021a).
In our findings, physical attack did not have a significant direct conditional association with suicide attempt, despite previous literature associating physical attack with suicide attempt in similar populations (Smith et al., Reference Smith, McDermott, Jacob, Barnett, Butler, Shin and Koyanagi2020). As conditional associations estimated in this network analysis control for all variables in the network, future studies could examine the factors that account for this relationship and account for the potential attenuation of this important association in this population.
In our network, bullying had the strongest positive conditional association with suicide attempt but also interacted positively with the mental health risk factors loneliness and worrying, which are positively associated with suicide attempt in previous studies covering developing countries (Li et al., Reference Li, You, Ruan, Xu, Mi, Cai and Han2021a). These mental health risk factors have previously been found to have associations with entrapment and suicidal ideation, both of which are associated with suicidal behavior, including suicide attempt (Souza et al., Reference Souza, Sosu, Thomson and Rasmussen2024).
Worrying showed a stronger pathway to suicide attempts than loneliness, indicating the need for further investigation and distinguishing measures of psychological distress in suicide prevention. Evidence from previous studies has shown that in developing countries, anxiety-related disorders may carry a higher risk for suicide attempts than depressive symptoms alone (Nock et al., Reference Nock, Hwang, Sampson, Kessler, Angermeyer, Beautrais, Borges, Bromet, Bruffaerts, de Girolamo, de Graaf, Florescu, Gureje, Haro, Hu, Huang, Karam, Kawakami, Kovess, Levinson, Posada-Villa, Sagar, Tomov, Viana and Williams2009; Knipe et al., Reference Knipe, Williams, Hannam-Swain, Upton, Brown, Bandara, S-S and Kapur2019), further underscoring the importance of distinguishing between mental health constructs in intervention. In contrast, mood disorders appear more dominant in higher-income countries (Nock et al., Reference Nock, Hwang, Sampson, Kessler, Angermeyer, Beautrais, Borges, Bromet, Bruffaerts, de Girolamo, de Graaf, Florescu, Gureje, Haro, Hu, Huang, Karam, Kawakami, Kovess, Levinson, Posada-Villa, Sagar, Tomov, Viana and Williams2009). Worrying in this study is measured by a question that asks respondents, “During the past 12 months, how often were you so worried about something that you could not sleep at night?” and has previously been termed as anxiety in studies using this data (Abio et al., Reference Abio, Owusu, Posti, Bärnighausen, Shaikh, Shankar and Lowery Wilson2022; Li et al., Reference Li, You, Ruan, Xu, Mi, Cai and Han2021a). These studies and others indicated that this sleep difficulty is associated with rumination and failed thought suppression (Bloch-Elkouby et al., Reference Bloch-Elkouby, Gorman, Schuck, Barzilay, Calati, Cohen, Begum and Galynker2020), which are in turn associated with suicidal behavior (O’Connor et al., Reference O’Connor, Cleare, Eschle, Wetherall and Kirtley2016).
Previous studies have also indicated that peer support and having close friends, including significant others, were associated with protective effects against suicidal behavior (Fonseca-Pedrero et al., Reference Fonseca-Pedrero, Díez-Gómez, de la Barrera, Sebastian-Enesco, Ortuño-Sierra, Montoya-Castilla, Lucas-Molina, Inchausti and Pérez-Albéniz2024; Peng et al., Reference Peng, Tang, Wu, Tan and Pan2024). In the present network, having close friends showed a strong negative conditional association with suicide attempts, and peer support also showed a negative conditional association, consistent with prior evidence. This protective association has been attributed to the sense of belongingness that close friends may foster, alongside reduced social isolation and opportunities for interpersonal exchange, which are associated with improved affect and cognition (Whitlock et al., Reference Whitlock, Wyman and Moore2014). However, having friends could also be a risk factor if those friends attempt suicide themselves (Whitlock et al., Reference Whitlock, Wyman and Moore2014).
In our network, suicide maintained a central position and had a strong expected influence, consistent with its role as a point of convergence for the multiple conditionally associated risk factors. Behavioral risk factors showed the highest expected influence in the network, with drug use and alcohol use, showing their capacity to influence how other factors in the network are conditionally associated with each other. This suggests that these factors are conditionally associated with risk transmission across multiple domains in the network, rather than operating solely within their behavioral cluster. Prior studies have reported that alcohol use is associated with the relationship between bullying, a key factor in this study, and suicidal behavior (Eman et al., Reference Eman, Tauqeer, Ul Hassan, Bakhteyar and Arif2025), and that substance use is associated with maladaptive behaviors and reduced self-regulation, both of which have known associations with suicidal behavior (Rizk et al., Reference Rizk, Herzog, Dugad and Stanley2021). These findings suggest that interventions targeting behavioral factors may have broader impact across the network, and future research examining these conditional relationships between substance use and other suicide-related risk factors in this population remains necessary.
In sex-specific analyses, minimal structural variations were observed between the males’ and females’ networks, and NCT reaffirmed this by indicating no significant difference in the connectivity and centrality structure of both networks. Notably, the sole structural difference was that the conditional association between smoking and suicide attempt in the females’ network (EW = 1.00) was stronger than in the males’ network (EW = 0.36). This being one of 55 edges in comparable networks limits the sex-differences’ implications in this study, and future studies could test these complexities and replication in other independent samples could draw conclusions stronger than can be made from these findings.
Implications for LLMICs
Our research covering 12 LLMICs has implications for the countries studied and for other similar settings. The consistent network structure across diverse cultural and economic contexts suggests that the core risk and protective factors of suicide attempts in these countries may be similar despite variances in the prevalence of suicidal behaviors. The findings also suggest a high prevalence of suicide attempts, underscoring the need for interventions against risk factors and the development of prevention programs. The strong conditional associations between suicide attempt and substance use and bullying, and an interplay of clustered risk factors seen in this network suggest that altering these factors and the mechanisms that underlie their prevalence and co-occurrence may be associated with reductions in suicide attempt risk in these contexts.
Strengths and limitations
We acknowledge that this study’s findings should be interpreted with caution, given certain limitations. First, the cross-sectional design limits the ability to draw causal inferences, and the network represents conditional associations rather than causal pathways; the centrality indices presented are therefore most useful for hypothesis generation. Second, all items are self-reported and thus subject to recall and social desirability bias, the latter being a common concern for suicide-related and substance use items. Third, we excluded participants from countries with missing data on the variables studied, and those with missing data on any of the variables studied. As shown in our sensitivity analyses (Supplementary Table S2), excluded participants were more likely to report violence exposure, substance abuse and suicide attempts and the exclusion probability varied across countries. The exclusion of high-risk adolescents could attenuate edges involving suicide attempts and substance use (the most central nodes), underrepresenting those with a greater risk of these burdens. Fourth, variables were coded dichotomously; while appropriate for network analysis, this could have led to a loss of information about the severity and frequency of risk behaviors. Fifth, we used data from 12 of 77 LLMICs; thus, the data presented here may apply only to the countries studied. Moreover, the use of pooled data, including countries from different regions, introduces heterogeneity in the results presented. However, we included descriptive tables showing each country’s proportion of the total study population (Table 1) and descriptive statistics per country for all variables examined (included in Supplementary Table S6), which showed variance between countries across all variables. This remained a limitation of our study, as conducting country-, regional- and income-level-specific analyses was outside the scope of this paper. Pooling results increases statistical power for the findings shown, and standard survey questionnaires were used for the GSHS in each country to ensure comparable results. Future studies could incorporate continuous, longitudinal and clinically collected data. Additionally, GSHS uses a stratified, multi-stage cluster sampling design and provides sampling weights, which are helpful in the generalizability of the results attained when applied. However, Ising network estimation using EBIC-regularized graphical LASSO assumes independence between observations and provides no mechanism to incorporate complex survey design features such as clustering and stratification. This likely results in underestimated standard errors and may affect the precision of edge parameter estimates. It should, however, be noted that this represents a current methodological limitation of network psychometric approaches more broadly and is not unique to this study (van Borkulo et al., Reference van Borkulo, Borsboom, Epskamp, Blanken, Boschloo, Schoevers and Waldorp2014; Epskamp et al., Reference Epskamp, Borsboom and Fried2018). We, however, used the weights in our descriptive analysis, and the results showed minor differences from unweighted values. The study, however, used robust methodology and a large sample size (25,761) to examine a population that had not been studied exhaustively before. We also used one of the most widely recognized surveys to measure adolescent mental health in this population, and our findings do not contradict existing theory or prior studies.
Conclusion
This network analysis provides novel insights into the complex interplay of factors associated with suicide attempts in LLMICs. The identification of distinct risk factor clusters, the significant role of suicide attempts in the network and the protective effect of having close friends inform future interventions for suicide attempts in these countries. We also highlight the need to consider the complex pathways among socioeconomic, behavioral, and physical experiences and suicide in these contexts when making interventions.
Open peer review
To view the open peer review materials for this article, please visit http://doi.org/10.1017/gmh.2026.10294.
Supplementary material
The supplementary material for this article can be found at http://doi.org/10.1017/gmh.2026.10294.
Data availability statement
All data used in this study are publicly available at https://extranet.who.int/ncdsmicrodata/index.php/home.
Acknowledgements
None.
Author contribution
Conceptualization, Methodology, Investigation, Writing - Original Draft, Visualization: S.J.K.; Visualization, Methodology, Writing - Review & Editing: M.C.; Methodology, Writing - Review & Editing: H.P.; Conceptualization, Writing - Review & Editing: S.Y., Conceptualization, Writing - Review & Editing: J.H.; Conceptualization, Writing - Review & Editing: E.H.L.; Conceptualization, Writing – Review and Editing: I.B.S.; Conceptualization, Methodology, Investigation, Writing - Original Draft, Writing - Review & Editing, Visualization, Supervision, Funding acquisition: Y.H.L.
Competing interests
The authors have no conflict of interest to declare.
Ethics and approvals
As this study used publicly available secondary data, the Institutional Review Board (IRB) of Korea University waived ethical approval, and participant consent was not required (approval number: KUIRB-2025-0168).
Funding statement
Y.H.L. was supported by grants from the National Research Foundation of Korea (NRF) under the Ministry of Science and Information, Communication, and Technology (grant number: RS-2023-00249082), Korea University (grant number: K2225791), and the Korea Institute for Health and Social Affairs (grant number: Q2226381).




 Open access

