1 Introduction and context
An objective in turbulent boundary layer (TBL) research has been to identify the flow structure and associate it with turbulence statistics. Our present study considers the conceptual aspects of self-similar and wall-attached motions in TBL flows, specifically in the outer region where the motions are inertia-driven. Throughout this work, ‘self-similar’ will refer to the feature of geometrical self-similarity of various-sized turbulent motions. ‘Wall-attached’ will refer to the energy portions of turbulent fluctuations in the outer region, which are coherent with the wall-shear stress signature or the velocity fluctuations at a reference position deep within the near-wall region.
(a) Premultiplied energy spectrogram
 $k_{x}\unicode[STIX]{x1D719}_{uu}/U_{\unicode[STIX]{x1D70F}}^{2}$
(levels: 0.2 : 0.2 : 1.8) at
 $Re_{\unicode[STIX]{x1D70F}}\approx 14\,000$
(Baars, Hutchins & Marusic Reference Baars, Hutchins and Marusic2017), alongside a spectrogram of the surrogate dissipation
 $k_{x}^{3}\unicode[STIX]{x1D719}_{uu}$
(at each
 $z$
, the dissipative spectrum is normalized by its maximum value; levels: 0.15 : 0.15 : 0.9). The dashed line closely resembling the ridge in the dissipation spectrogram is
 $\unicode[STIX]{x1D706}_{x}=35\unicode[STIX]{x1D702}$
, where
 $\unicode[STIX]{x1D702}\equiv (\unicode[STIX]{x1D708}^{3}/\unicode[STIX]{x1D716})^{1/4}$
, with
 $\unicode[STIX]{x1D716}\equiv 15\unicode[STIX]{x1D708}\int k_{x}^{3}\unicode[STIX]{x1D719}_{uu}\,\text{d}\,\text{log}(k_{x})$
. (b) Regions in a TBL with a systems diagram depicting the coherence between a reference position,
 $z_{R}$
, and a range of
 $z$
positions.

A proposed structure for the energy-containing motions was described by Townsend (Reference Townsend1976) in his attached-eddy hypothesis (AEH) as a hierarchy of geometrically self-similar eddying motions that are inertially dominated, attached to the wall and scalable with their distance from the wall. Many studies have presented results that support the presence of self-similar wall-attached eddies. For example, Klewicki, Fife & Wei (Reference Klewicki, Fife and Wei2009) revealed from the Navier–Stokes equations that a self-similar hierarchical structure is required for invariant solutions of the leading-order mean dynamics; transient growth and resolvent analysis has also revealed self-similar behaviour (e.g. del Álamo & Jiménez Reference del Álamo and Jiménez2006; McKeon & Sharma Reference McKeon and Sharma2010); using direct numerical simulation (DNS), Lozano-Durán, Flores & Jiménez (Reference Lozano-Durán, Flores and Jiménez2012) described various statistics of the Reynolds stress transport via self-similarity of an ‘attached’ structure and Hwang (Reference Hwang2015) revealed a self-similar structure in self-sustaining motions. High-Reynolds-number experiments have provided support for a logarithmic scaling of the streamwise variance,
 $\overline{u^{2}}$
, predicted by the AEH (Marusic et al.
Reference Marusic, Monty, Hultmark and Smits2013). It is intriguing that
 $\overline{v^{2}}$
and
 $\overline{w^{2}}$
tend to obey the predicted behaviour of the AEH over a longer wall-normal range than
 $\overline{u^{2}}$
and start to hold at considerably lower Reynolds numbers (e.g. Talluru et al.
Reference Talluru, Baidya, Hutchins and Marusic2014; Lee & Moser Reference Lee and Moser2015; Örlü et al.
Reference Örlü, Fiorini, Segalini, Bellani, Talamelli and Alfredsson2017). Here,
 $u$
,
 $v$
and
 $w$
are the streamwise, spanwise and wall-normal components of velocity respectively, with associated coordinates
 $x$
,
 $y$
and
 $z$
. Finally, Hellström, Marusic & Smits (Reference Hellström, Marusic and Smits2016) employed velocity correlations via proper orthogonal decomposition (POD) of radial–azimuthal planes of pipe flow data, and thereby revealed a geometrical self-similarity of the POD modes over one decade of length scales.
When focusing on spectra of the streamwise velocity fluctuations, it is predicted via dimensional analysis and a spectral overlap that the energy spectra follow a
 $k_{x}^{-1}$
dependence in the inertial range (Perry & Abell Reference Perry and Abell1975; Perry, Henbest & Chong Reference Perry, Henbest and Chong1986; Davidson & Krogstad Reference Davidson and Krogstad2009); this is consistent with self-similar and wall-attached turbulent motions in the logarithmic region, as conceptualized in the AEH. In this regard, figure 1(a) displays the spectral energy density of
 $u$
in a premultiplied form,
 $k_{x}\unicode[STIX]{x1D719}_{uu}/U_{\unicode[STIX]{x1D70F}}^{2}$
, as a function of streamwise wavelength,
 $\unicode[STIX]{x1D706}_{x}\equiv 2\unicode[STIX]{x03C0}/k_{x}$
, for
 $10.5<z^{+}<\unicode[STIX]{x1D6FF}^{+}$
. Superscript ‘
 $+$
’ signifies a viscous scaling with the friction velocity
 $U_{\unicode[STIX]{x1D70F}}$
and length scale
 $\unicode[STIX]{x1D708}/U_{\unicode[STIX]{x1D70F}}$
(
 $\unicode[STIX]{x1D708}$
is the fluid kinematic viscosity), whereas the boundary layer thickness
 $\unicode[STIX]{x1D6FF}$
is employed for outer scaling. Accordingly,
 $Re_{\unicode[STIX]{x1D70F}}\equiv \unicode[STIX]{x1D6FF}U_{\unicode[STIX]{x1D70F}}/\unicode[STIX]{x1D708}$
is the friction Reynolds number (
 $Re_{\unicode[STIX]{x1D70F}}\approx 14\,000$
in figure 1
a). A second spectrogram in figure 1(a), following
 $k_{x}^{3}\unicode[STIX]{x1D719}_{uu}$
, serves as an indicator of the surrogate dissipation
 $\unicode[STIX]{x1D716}\equiv 15\unicode[STIX]{x1D708}\int k_{x}^{3}\unicode[STIX]{x1D719}_{uu}\,\text{d}\,\text{log}(k_{x})$
. Here, we adopted the local isotropy hypothesis, which is valid only well into the logarithmic region. See Jiménez (Reference Jiménez2012) for further details on the dissipation in the context of the turbulence cascade. In premultiplied form, the
 $k_{x}^{-1}$
scaling should appear as a plateau of
 $k_{x}\unicode[STIX]{x1D719}_{uu}/U_{\unicode[STIX]{x1D70F}}^{2}$
in a region of
 $(\unicode[STIX]{x1D706}_{x},z)$
-space, obeying inner and outer scaling (and where the dissipation is zero). Figure 1(a) shows that region as identified by Nickels et al. (Reference Nickels, Marusic, Hafez and Chong2005); one should note the zero-valued dissipation spectrogram at these scales. Due to the limited region of
 $k_{x}^{-1}$
scaling, convincing support for a self-similar range remains elusive, even in higher-
 $Re_{\unicode[STIX]{x1D70F}}$
pipe flow data (Rosenberg et al.
Reference Rosenberg, Hultmark, Vallikivi, Bailey and Smits2013). The true
 $k_{x}^{-1}$
scaling region is presumably larger, but is obscured due to spectral aliasing (Davidson, Nickels & Krogstad Reference Davidson, Nickels and Krogstad2006) and the presence of detached eddies (Marusic & Perry Reference Marusic and Perry1995) and (very) large-scale motions (e.g. Adrian, Meinhart & Tomkins Reference Adrian, Meinhart and Tomkins2000; Hutchins & Marusic Reference Hutchins and Marusic2007) accumulated in a broad outer peak.
Although the aforementioned studies of turbulence statistics may reveal trends that support a self-similar attached-eddy structure, correlations of the TBL flow with the near-wall region are needed for an assessment of the wall-attached aspect (preferably in a way that also allows inspection of the self-similarity). This requires at least two-point data separated in the wall-normal direction. Two-point correlations in
 $z$
have been studied (e.g. Tutkun et al.
Reference Tutkun, George, Delville, Stanislas, Johansson, Foucaut and Coudert2009, and references therein), but have generally been limited to physical space–space/time domains. In § 3, we apply a spectral coherence method to multipoint data (figure 1
b and § 2), covering
 $Re_{\unicode[STIX]{x1D70F}}\sim O(10^{3}){-}O(10^{6})$
, for simultaneous assessment of the self-similar and wall-attached nature of the flow.
Experimental parameters of studies containing multipoint synchronized data at a near-wall reference position (
 $z_{R}$
) and a wall-normal range of locations (
 $z_{min}^{+}$
–
 $z_{max}^{+}$
).

2 Experimental and numerical data
The TBL data, comprising synchronized two-point
 $u$
velocity signals at a near-wall reference position (denoted as
 $z_{R}$
) and a range of wall-normal positions (from
 $z_{min}$
to
 $z_{max}$
), are taken from DNS and three experiments (table 1). From the DNS by Sillero et al. (Reference Sillero, Jiménez and Moser2013), streamwise/wall-normal planes of data were extracted. These planes span the entire TBL in
 $z$
and extend
 ${\sim}11.9\unicode[STIX]{x1D6FF}$
in
 $x$
to include large-scale motions, while maintaining an acceptable Reynolds-number increase from
 $Re_{\unicode[STIX]{x1D703}}\equiv \unicode[STIX]{x1D703}U_{\infty }/\unicode[STIX]{x1D708}\approx 5110$
to
 $6010$
, where
 $\unicode[STIX]{x1D703}$
is the momentum thickness (
 $Re_{\unicode[STIX]{x1D70F}}\approx 1992$
at the streamwise centre of the planes). A modified Coles law of the wake fit (Jones, Marusic & Perry Reference Jones, Marusic and Perry2001), with log-law constants
 $\unicode[STIX]{x1D705}=0.41$
and
 $A=5.0$
, is used to obtain
 $\unicode[STIX]{x1D6FF}$
(all values for
 $\unicode[STIX]{x1D6FF}$
quoted in our work are found via this fit). The raw flow fields (
 ${\mathcal{S}}_{1}$
) comprise the spanwise resolution of the DNS (
 $\unicode[STIX]{x0394}y^{+}\approx 3.72$
), whereas the filtered data (
 ${\mathcal{S}}_{2}$
) are constructed using spanwise box filters of
 $\unicode[STIX]{x0394}y^{+}\approx 41$
and
 $\unicode[STIX]{x0394}y^{+}\approx 22$
for reference
 $z_{R}$
and range
 $z$
respectively. These spanwise resolutions, and the viscous scaled reference position
 $z_{R}^{+}\approx 4.3$
, are chosen to match the experimental dataset
 ${\mathcal{E}}_{2}$
(described next).
The two temporal datasets (
 ${\mathcal{E}}_{1}$
and
 ${\mathcal{E}}_{2}$
in table 1) acquired at Melbourne’s boundary layer facility correspond to
 $Re_{\unicode[STIX]{x1D70F}}\approx 13\,500$
(Hutchins et al.
Reference Hutchins, Monty, Ganapathisubramani, Ng and Marusic2011) and
 $Re_{\unicode[STIX]{x1D70F}}\approx 14\,000$
(Baars et al.
Reference Baars, Hutchins and Marusic2017). Both datasets employed a hotwire for mapping out a range of
 $z$
positions, which was synchronously acquired with a fixed near-wall reference sensor at the same
 $(x,y)$
position. Since the objective of our current study involves an analysis of what portion of the outer-region turbulence is coherent with the wall (e.g. wall-attached), the near-wall reference position should resemble the wall-shear stress signature. For practical reasons, the reference hotwire for dataset
 ${\mathcal{E}}_{2}$
was positioned at
 $z_{R}^{+}\approx 4.4$
, which is nominally within the linear region. The reference position of the DNS data (
 ${\mathcal{S}}_{1}$
and
 ${\mathcal{S}}_{2}$
) was chosen to match this position (
 $z_{R}^{+}\approx 4.3$
) to allow for a one-to-one comparison. For dataset
 ${\mathcal{E}}_{1}$
, the near-wall reference sensor comprised a skin-friction hotfilm at the wall (providing large-scale friction velocity fluctuations, see Hutchins et al.
Reference Hutchins, Monty, Ganapathisubramani, Ng and Marusic2011). As discussed in § 3.3, the coherence between the turbulence at
 $z^{+}\gtrsim 80$
and at the near-wall reference position
 $z_{R}$
, computed from the DNS data, was unaffected for
 $0<z_{R}^{+}\lesssim 15$
. Likewise, for our experimental data, the results of the coherence are nearly identical when the near-wall reference signature is the wall-shear stress (
 ${\mathcal{E}}_{1}$
) or the velocity signal at
 $z_{R}^{+}\approx 4.4$
(
 ${\mathcal{E}}_{2}$
).
Our highest-Reynolds-number data at
 $Re_{\unicode[STIX]{x1D70F}}\approx 1.4\times 10^{6}$
encompass the
 $u$
fluctuations in the atmospheric surface layer under near-neutrally buoyant conditions at SLTEST in Utah (
 ${\mathcal{E}}_{3}$
in table 1). These data were synchronously acquired using a wall-normal array of five sonic anemometers and one purpose-built wall-shear stress sensor situated under the array (Marusic & Heuer Reference Marusic and Heuer2007).
3 Coherence structure of self-similar wall-attached eddies
3.1 Linear coherence spectrum
To inspect the linear coupling between
 $u$
fluctuations of each scale – at a near-wall reference position
 $z_{R}$
and at a position
 $z$
in the TBL (see figure 1
b) – we compute the linear coherence spectrum (LCS), defined as
 $$\begin{eqnarray}\displaystyle \unicode[STIX]{x1D6FE}_{L}^{2}(z,z_{R};\unicode[STIX]{x1D706}_{x})\equiv \frac{|\langle \widetilde{U}(z;\unicode[STIX]{x1D706}_{x})\widetilde{U}^{\ast }(z_{R};\unicode[STIX]{x1D706}_{x})\rangle |^{2}}{\langle |\widetilde{U}(z;\unicode[STIX]{x1D706}_{x})|^{2}\rangle \langle |\widetilde{U}(z_{R};\unicode[STIX]{x1D706}_{x})|^{2}\rangle }=\frac{|\unicode[STIX]{x1D719}_{uu}^{\prime }(z,z_{R};\unicode[STIX]{x1D706}_{x})|^{2}}{\unicode[STIX]{x1D719}_{uu}(z;\unicode[STIX]{x1D706}_{x})\unicode[STIX]{x1D719}_{uu}(z_{R};\unicode[STIX]{x1D706}_{x})}. & & \displaystyle\end{eqnarray}$$
Here,
 $\widetilde{U}(z;\unicode[STIX]{x1D706}_{x})={\mathcal{F}}[u(z)]$
is the Fourier transform of
 $u(z)$
, in either
 $x$
or time, depending on the data. For temporal data, we transform frequency to wavelength using Taylor’s hypothesis, where the local mean velocity is taken as the convection velocity. The asterisk
 $\ast$
indicates the complex conjugate,
 $\langle \,\rangle$
denotes ensemble averaging and
 $\Vert$
designates the modulus. It is noted that by definition
 $0\leqslant \unicode[STIX]{x1D6FE}_{L}^{2}\leqslant 1$
, and that
 $\unicode[STIX]{x1D6FE}_{L}^{2}$
may be interpreted as the square of a scale-specific correlation coefficient (fraction of common variance shared by
 $u$
fluctuations at
 $z_{R}$
and
 $z$
). In (3.1) only the magnitude of
 $\unicode[STIX]{x1D719}_{uu}^{\prime }(z,z_{R};\unicode[STIX]{x1D706}_{x})\in \mathbb{C}$
is considered, meaning that a consistent stochastic phase shift between
 $u(z_{R})$
and
 $u(z)$
cannot be deduced from the LCS. Scale-dependent phase information is explicitly embedded in the phase of the cross-spectrum
 $\unicode[STIX]{x1D719}_{uu}^{\prime }$
. However, the LCS may be interpreted as an indirect measure of the phase consistency across ensembles of
 $u(z_{R})$
and
 $u(z)$
, with concurrent amplitude covariations. That is, if each ensemble used to construct the cross-spectrum contains a different random phase shift for a certain scale (a non-consistent phase shift), that scale is not correlated and hence
 $\unicode[STIX]{x1D6FE}_{L}^{2}\approx 0$
.
To illustrate the LCS, we consider one arbitrary velocity–velocity combination from dataset
 ${\mathcal{E}}_{2}$
: an outer-region signal at
 $z_{O}^{+}\equiv 3.9Re_{\unicode[STIX]{x1D70F}}^{1/2}\approx 473$
with its associated reference signal at
 $z_{R}^{+}\approx 4.4$
. The energy spectra and the LCS are shown in figures 2(a) and 2(b) respectively (all spectral quantities are bandwidth filtered at 20 %, meaning that the filtered quantity at wavelength
 $\unicode[STIX]{x1D706}_{xi}$
is averaged over
 $\unicode[STIX]{x1D706}_{xi}\pm 20\,\%$
). Evidently, the LCS reveals that the largest energetic scales are correlated to a degree of roughly 0.8, while the correlation drops below 0.1 for
 $\unicode[STIX]{x1D706}_{x}^{+}\lesssim 10^{4}$
(for this specific wall-normal separation between
 $z_{O}$
and
 $z_{R}$
). Application of (3.1) to the full
 $z$
range of dataset
 ${\mathcal{E}}_{2}$
provides an LCS for each
 $u(z_{R})$
–
 $u(z)$
combination. These
 $\unicode[STIX]{x1D6FE}_{L}^{2}$
spectra are shown in figure 2(c) as a coherence spectrogram – an isocontour map of
 $\unicode[STIX]{x1D6FE}_{L}^{2}(z,z_{R};\unicode[STIX]{x1D706}_{x})$
as function of
 $\unicode[STIX]{x1D706}_{x}$
and
 $z$
– overlaid on the energy spectrogram of figure 1(a).
(a) Premultiplied energy spectra of
 $u$
at
 $z_{O}^{+}\approx 473$
and
 $z_{R}^{+}\approx 4.4$
(dataset
 ${\mathcal{E}}_{2}$
) and (b) the corresponding LCS; it should be noted that
 $\unicode[STIX]{x1D706}_{x}\equiv U(z_{O})/f$
. (c) Coherence spectrogram (levels: 0.1 : 0.1 : 0.9) for dataset
 ${\mathcal{E}}_{2}$
, following
 $\unicode[STIX]{x1D6FE}_{L}^{2}(z,z_{R};\unicode[STIX]{x1D706}_{x})$
, overlaid on the energy spectrogram of figure 1(a) (the triangle is described in §§ 3.2–3.4).


3.2 Physical underpinning of the coherence spectrogram
In this section, we focus on the topography of the
 $\unicode[STIX]{x1D6FE}_{L}^{2}$
isocontours in the logarithmic region. A conceptual reconstruction of the
 $\unicode[STIX]{x1D6FE}_{L}^{2}$
isocontours is performed from an AEH point of view, which assumes the existence of a wall-attached structure with an embedded self-similar hierarchy of scales. However, alternative but equally valid explanations may exist for the empirically observed trends of the
 $\unicode[STIX]{x1D6FE}_{L}^{2}$
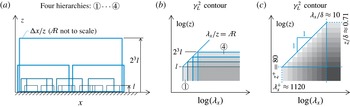
isocontours. Four discrete successive hierarchies of randomly positioned attached eddies are drawn in
 $(x,z)$
-space in figure 3(a), with each consecutive hierarchy being subject to a doubling in self-similar size and a halving of the number of eddies in this two-dimensional plane (it should be noted that the typical forward-leaning nature of the structures is neglected since a consistent phase shift is irrelevant in the context of the LCS; see 3.1). Self-similarity implies that each eddy hierarchy is associated with the same ratio of the minimum streamwise wavelength at which energetic variance still appears relative to its wall-normal extent. We refer to this ratio as the streamwise/wall-normal aspect ratio, denoted as
 Due to the streamwise repetition of eddies associated with one specific hierarchy, say ones with a wall-normal extent of
 $z=l$
, energetic variance may appear for all scales larger than the smallest energetic scale, e.g. energy appears for
 Therefore, for hierarchy

 $2^{(i-1)}l$
, a non-zero coherence in
 $(\unicode[STIX]{x1D706}_{x},z)$
-space appears for
 $z<2^{(i-1)}l$
and
 (see figure 3
b). The energy spectrum of the streamwise velocity fluctuations corresponding to one hierarchy of attached-eddy structures is likely non-uniform with
 $\unicode[STIX]{x1D706}_{x}$
and may depend on the
 $z$
position within the hierarchy. The magnitude of
 $\unicode[STIX]{x1D6FE}_{L}^{2}$
(the coherence between two locations separated in the wall-normal direction) may also vary with
 $\unicode[STIX]{x1D706}_{x}$
and
 $z$
(relative to
 $z_{R}$
). That is, the coherence may depend on
 $\unicode[STIX]{x1D706}_{x}$
within that particular hierarchy of eddies, and within the wall-normal range spanned by the hierarchy, the coherence with the wall may vary. However, for simplicity, we idealize a uniform coherence magnitude in figure 3(b), e.g. the coherence magnitude for one hierarchy is drawn with a uniform greyscale. It should be noted that even if the coherence magnitude for one hierarchy is non-uniform, we would still obtain the same final structure of the reconstructed coherence spectrogram in the limit of infinite Reynolds number (a limitless increase of the number of hierarchies). When superposing each hierarchy of self-similar scales, coherence contours are additive (see hierarchies
 $\unicode[STIX]{x2460}$
–
 $\unicode[STIX]{x2463}$
in figure 3
b), as each attached-eddy structure is, on average, randomly positioned (Woodcock & Marusic Reference Woodcock and Marusic2015). When increasing the number of hierarchies to 10 in figure 3(c), the contour clearly reflects a discrete version of the smooth
 $\unicode[STIX]{x1D6FE}_{L}^{2}$
isocontours in figure 2(c). Within a triangular region in (
 $\unicode[STIX]{x1D706}_{x},z$
)-space, bounded by a wall-normal height
 $z=l$
(the smallest self-similar structure in the eddy hierarchy), an inner limit (constant
 $\unicode[STIX]{x1D706}_{x}/z$
) and an outer limit (constant
 $\unicode[STIX]{x1D706}_{x}/\unicode[STIX]{x1D6FF}$
), the
 $\unicode[STIX]{x1D6FE}_{L}^{2}$
isocontours align with lines of constant
 $\unicode[STIX]{x1D706}_{x}/z$
(see the contours within the triangle in figure 3
c). The quantitative boundaries of this triangular region are discussed in § 3.4. Within the triangle, the magnitude of
 $\unicode[STIX]{x1D6FE}_{L}^{2}$
increases linearly with
 $\log (\unicode[STIX]{x1D706}_{x})$
(for constant
 $z$
) and decreases with
 $\log (z)$
(for constant
 $\unicode[STIX]{x1D706}_{x}$
), which is the natural artefact of a geometrically self-similar structure. Seemingly, the coherence magnitude obeys
 $\unicode[STIX]{x1D6FE}_{L}^{2}=C_{1x}\ln (\unicode[STIX]{x1D706}_{x})+C_{1z}\ln (z)+C_{2}$
. Since the aspect of self-similarity implies that constant
 $C_{1x}=-C_{1z}=C_{1}$
, the coherence magnitude within the self-similar region adheres to
 $$\begin{eqnarray}\displaystyle \unicode[STIX]{x1D6FE}_{L}^{2}=C_{1}\ln \left(\frac{\unicode[STIX]{x1D706}_{x}}{z}\right)+C_{2}. & & \displaystyle\end{eqnarray}$$
Evidently, a self-similar attached-eddy structure is ingrained within the TBL flow where the wall-coherent structure is described by (3.2); its universality is examined in § 3.4. It should be noted that the sole dependence of
 $\unicode[STIX]{x1D6FE}_{L}^{2}$
on
 $\unicode[STIX]{x1D706}_{x}/z$
follows a similarity hypothesis already proposed by Davenport (Reference Davenport1961) in an investigation of the square-root coherence,
 $\unicode[STIX]{x1D6FE}_{L}$
, in meteorological boundary layers. Morrison & Kronauer (Reference Morrison and Kronauer1969) studied the same similarity hypothesis in pipe flow, which Bullock, Cooper & Abernathy (Reference Bullock, Cooper and Abernathy1978) supported via two-point radial correlations of turbulence in narrow frequency bands. del Álamo et al. (Reference del Álamo, Jiménez, Zandonade and Moser2004) used the square-root coherence between two wall-normal locations as a function of both streamwise and spanwise wavelengths to also highlight an ‘attached’ self-similar structure.
Coherence and energy spectrograms, following
 $\unicode[STIX]{x1D6FE}_{L}^{2}(z,z_{R};\unicode[STIX]{x1D706}_{x})$
(levels: 0.1 : 0.1 : 0.9) and
 $k_{x}\unicode[STIX]{x1D719}_{uu}(z;\unicode[STIX]{x1D706}_{x})/U_{\unicode[STIX]{x1D70F}}^{2}$
(levels: 0.2 : 0.2 : 1.8) for all datasets listed in table 1. The triangles (and the regions identified with the dashed lines) are described in § 3.4 (it should be noted that the inner and outer limits of the triangle are listed in panel a).

3.3 Remarks about spanwise resolutions and temporal data limitations
Coherence spectrograms for all data listed in table 1 are shown in figure 4 (in the same way as in figure 2
c). A comparison of datasets
 ${\mathcal{S}}_{1}$
and
 ${\mathcal{S}}_{2}$
(figure 4
a,c) demonstrates that coarser spanwise resolutions (at least to the same degree as the laboratory experiments, simulated by
 ${\mathcal{S}}_{2}$
) do not affect the coherence spectrograms in our region of interest (
 $z^{+}\gtrsim 80$
per our discussion later on). The decrease in coherence for the filtered data
 ${\mathcal{S}}_{2}$
, in close proximity to
 $z_{R}$
, is an artefact of the different
 $\unicode[STIX]{x0394}y$
resolutions of the
 $z$
range and
 $z_{R}$
reference data (table 1). From figure 4(b,d), it can be concluded that the frequency attenuation in the hotfilm reference signal of
 ${\mathcal{E}}_{1}$
– compared with the hotwire reference of
 ${\mathcal{E}}_{2}$
– does not affect the coherence spectrogram. This insensitivity to spectral attenuation (or amplification) is an inherent advantage of the per-scale normalization in (3.1). Two-point correlation coefficients in the physical domain are fundamentally different in this regard, since the normalization utilizes the root mean square of all fluctuations via
 $\unicode[STIX]{x1D70C}_{uu}(z,z_{R},\unicode[STIX]{x1D70F})={\mathcal{F}}^{-1}[\unicode[STIX]{x1D719}_{uu}^{\prime }(z,z_{R};\unicode[STIX]{x1D706}_{x})]/[u_{rms}(z)u_{rms}(z_{R})]$
. As such,
 $\unicode[STIX]{x1D70C}_{uu}$
will differ for
 ${\mathcal{E}}_{1}$
and
 ${\mathcal{E}}_{2}$
since
 $u_{rms}(z_{R})$
of the attenuated hotfilm sensor signal includes more coherent energy (relative to the total resolved energy) in comparison to the hotwire reference signal (
 ${\mathcal{E}}_{2}$
). Even though phase information is embedded within the two-point correlation coefficient via the time shift
 $\unicode[STIX]{x1D70F}$
, a scale-dependent phase may also be considered directly from the complex cross-spectrum
 $\unicode[STIX]{x1D719}_{uu}^{\prime }$
(e.g. Baars, Hutchins & Marusic Reference Baars, Hutchins and Marusic2016; Baars et al.
Reference Baars, Hutchins and Marusic2017). A noticeable difference in
 $\unicode[STIX]{x1D6FE}_{L}^{2}$
from datasets
 ${\mathcal{S}}_{2}$
,
 ${\mathcal{E}}_{2}$
and
 ${\mathcal{E}}_{3}$
(figure 4
c,d) is the vanishing coherence in temporal data (
 ${\mathcal{E}}_{2}$
), compared with spatial data (
 ${\mathcal{S}}_{2}$
), for
 $\unicode[STIX]{x1D706}_{x}^{+}\lesssim 7000$
. Recently, Baars et al. (Reference Baars, Hutchins and Marusic2017) showed that the characteristic temporal frequency of the small scales (generally
 $\unicode[STIX]{x1D706}_{x}^{+}<7000$
) exhibits an enhanced large-scale (e.g.
 $\unicode[STIX]{x1D706}_{x}^{+}>7000$
) modulation in comparison with the spatial frequency modulation. This strengthening arguably arises from a varying convection velocity of the small scales via
 $U_{c}(z,t)\propto [U(z)+u_{L}(z,t)]^{1/2}$
(
 $u_{L}$
is the large-scale velocity), which to a fixed-observer sensor appears as an additional modulation to the already spatially modulated scales. Since this effect is driven by the amplitude of
 $u_{L}$
(varying in
 $z$
and time), the modulation is inconsistent across
 $z$
and therefore suppresses the phase-consistent coherence.
(a) Coherence spectrogram of dataset
 ${\mathcal{E}}_{2}$
(with the wavelength axis predivided by
 $z$
). The thicker portions of the curves correspond to
 $3Re_{\unicode[STIX]{x1D70F}}^{1/2}<z^{+}<0.15Re_{\unicode[STIX]{x1D70F}}$
and
 $20z<\unicode[STIX]{x1D706}_{x}<6\unicode[STIX]{x1D6FF}$
. It should be noted that the inclined plane with the solid boundary (bounded by
 $\unicode[STIX]{x1D6FE}_{L}^{2}=1$
) reflects (3.2) with
 $C_{1}\approx 0.302$
and
 $C_{2}\approx -0.796$
determined from fitting (3.2) to the thick portions of the coherence spectra. Relation (3.2) has a region of validity bounded by an inner limit of
 $\unicode[STIX]{x1D706}_{x}/z\approx 14$
, an outer limit of
 $\unicode[STIX]{x1D706}_{x}/\unicode[STIX]{x1D6FF}\approx 10$
and a wall-normal height of
 $z^{+}=80$
(this region is also indicated in figure 4
d). (b) Linear coherence spectra
 $\unicode[STIX]{x1D6FE}_{L}^{2}(z,z_{R};\unicode[STIX]{x1D706}_{x})$
for all datasets listed in table 1 for wall-normal positions within the range
 $3Re_{\unicode[STIX]{x1D70F}}^{1/2}<z^{+}<0.15Re_{\unicode[STIX]{x1D70F}}$
.

3.4 Universality of self-similar wall-attached eddies
As reasoned in the lead-up to (3.2), the coherence is anticipated to be a sole function of
 $\unicode[STIX]{x1D706}_{x}/z$
in a triangular region bounded by
 $z=l$
, an inner limit
 $\unicode[STIX]{x1D706}_{x}/z$
and an outer limit
 $\unicode[STIX]{x1D706}_{x}/\unicode[STIX]{x1D6FF}$
. We here perform a fit of (3.2) to dataset
 ${\mathcal{E}}_{2}$
, since its corresponding coherence spectrogram contains a larger self-similar range in the logarithmic region than its DNS counterparts (datasets
 ${\mathcal{S}}_{1}$
and
 ${\mathcal{S}}_{2}$
) and captures all energy in the largest scales (the large scales in the atmospheric surface layer data,
 ${\mathcal{E}}_{3}$
, were affected by filtering procedures to eliminate variations in the free-stream velocity; see Marusic & Heuer Reference Marusic and Heuer2007; Hutchins et al.
Reference Hutchins, Chauhan, Marusic and Klewicki2012). All
 $\unicode[STIX]{x1D6FE}_{L}^{2}$
-spectra from dataset
 ${\mathcal{E}}_{2}$
(used in creating the isocontour in figure 4
d) are replotted in figure 5(a) with the wavelength axis predivided by
 $z$
. To fit (3.2) to the coherence spectra – and thus determine
 $C_{1}$
and
 $C_{2}$
– we select portions of the spectra within the logarithmic region, taken as
 $3Re_{\unicode[STIX]{x1D70F}}^{1/2}<z^{+}<0.15Re_{\unicode[STIX]{x1D70F}}$
(Marusic et al.
Reference Marusic, Monty, Hultmark and Smits2013), and within a region bounded by inner and outer limits,
 $20z<\unicode[STIX]{x1D706}_{x}<6\unicode[STIX]{x1D6FF}$
(chosen by visual inspection). These portions are highlighted with thicker curves in figure 5(a) and are surrounded by the dashed lines indicating the bounds. It should be noted that these bounds for fitting (3.2) are redrawn on all panels in figure 4 for reference, and that the choice of lower limit
 $z^{+}=3Re_{\unicode[STIX]{x1D70F}}^{1/2}$
avoids the region where the spatial/temporal coherence discrepancy was observed (§ 3.3). A linear least squares fitting of (3.2) to the
 $\unicode[STIX]{x1D6FE}_{L}^{2}$
-spectra of
 ${\mathcal{E}}_{2}$
in the fitting region results in
 $C_{1}\approx 0.302$
and
 $C_{2}\approx -0.796$
. The corresponding surface represented by (3.2) is shown with the inclined triangular plane in figure 5(a) and is bounded by
 $\unicode[STIX]{x1D6FE}_{L}^{2}=1$
. Now, the inner-scaling limit of this plane may be taken as the
 $\unicode[STIX]{x1D706}_{x}/z$
value for which
 $\unicode[STIX]{x1D6FE}_{L}^{2}=0$
(see § 3.2); note this simultaneously exposes the aspect ratio of a self-similar attached-eddy structure. Hence, we obtain a stochastic streamwise/wall-normal aspect ratio of

indicated by the solid boundary of the triangle in the
 $\unicode[STIX]{x1D6FE}_{L}^{2}=0$
plane in figure 5(a).
At scales beyond an outer limit
 $\unicode[STIX]{x1D706}_{x}/\unicode[STIX]{x1D6FF}$
, the coherence is scale-independent, as is observed in figure 5(a). It should be noted that these scales are not part of the (3.2)-compatible self-similarity, because self-similar growth of these structures in
 $z$
is bounded by the boundary layer thickness; this results in scale-independent contours of
 $\unicode[STIX]{x1D6FE}_{L}^{2}$
(see the conceptual reconstruction of the coherence magnitude in figure 3
c). From (3.2), it follows that the scale-independent coherence should now adhere to
 $\unicode[STIX]{x1D6FE}_{L}^{2}=-C_{1}\ln (z)+C_{3}$
. This equation is fitted to the data of
 ${\mathcal{E}}_{2}$
within the range
 $0.07<z/\unicode[STIX]{x1D6FF}<0.50$
(plateau values of
 $\unicode[STIX]{x1D6FE}_{L}^{2}$
are indicated with the open circles in the
 $\unicode[STIX]{x1D706}_{x}/z=10^{4}$
plane in figure 5
a). The fit, indicated with the dashed line in the
 $\unicode[STIX]{x1D706}_{x}/z=10^{4}$
plane, intersects
 $\unicode[STIX]{x1D6FE}_{L}^{2}=0$
at
 $z/\unicode[STIX]{x1D6FF}\approx 0.710$
. Judiciously, an outer-scaling limit for (3.2) may be taken as
 and represents the transition in the coherence from a self-similar scaling via (3.2) to a scale-independent trend at
 $\unicode[STIX]{x1D706}_{x}/\unicode[STIX]{x1D6FF}\gg 10$
. Vassilicos et al. (Reference Vassilicos, Laval, Foucaut and Stanislas2015) emphasized that an outer-scaling limit is required for modelling suitable subranges in
 $(\unicode[STIX]{x1D706}_{x},z)$
-space where the spectral energy density adheres to the AEH; our identified limit of
 $\unicode[STIX]{x1D706}_{x}/\unicode[STIX]{x1D6FF}\approx 10$
supports this.
Finally, regarding the wall-normal extent
 $l$
of the smallest eddying motions in the self-similar hierarchy, results (not explicitly shown) suggest that
 $l^{+}\approx 80$
for all Reynolds numbers. It should be noted that a Reynolds-number dependence in the lower limit of a logarithmic layer, such as the
 ${\sim}Re_{\unicode[STIX]{x1D70F}}^{1/2}$
dependence (Klewicki et al.
Reference Klewicki, Fife and Wei2009), may be equally valid but is simply dependent on what types of motions are included in an analysis, namely self-similar or non-self-similar motions. Recent support for self-similar behaviour down to
 $l^{+}\approx 80$
was presented by Agostini & Leschziner (Reference Agostini and Leschziner2017) through examining subranges in (
 $\unicode[STIX]{x1D706}_{x},z$
)-space of isotropic (associated with detached eddies) and anisotropic scales (associated with attached eddies) in
 $Re_{\unicode[STIX]{x1D70F}}\approx 4200$
channel flow. A lower bound for the validity of (3.2) cannot be deduced by fitting a proposed relation to the coherence spectra. First of all, the spatial/temporal coherence discrepancy affects the
 $\unicode[STIX]{x1D6FE}_{L}^{2}$
-spectra of dataset
 ${\mathcal{E}}_{2}$
at
 $z^{+}\lesssim 3Re_{\unicode[STIX]{x1D70F}}^{1/2}$
(see § 3.3). Second, within the near-wall region, the coherence spectra are not only influenced by a self-similar wall-attached structure but also by the strong coherent near-wall streaks. This is particularly clear from the high magnitude of the coherence in the spatial DNS dataset,
 ${\mathcal{S}}_{1}$
, shown in figure 4(a).
To summarize the expected region of validity of (3.2), we drew a triangular plane in figure 5(a) with a lower limit of
 $z^{+}=80$
, an inner-scaling limit of
 and an outer-scaling limit of
 $\unicode[STIX]{x1D706}_{x}/\unicode[STIX]{x1D6FF}\approx 10$
(it should be noted that the coherence is bounded by
 $\unicode[STIX]{x1D6FE}_{L}^{2}=1$
). The same triangular region is drawn on all panels in figure 4 (with the bounds summarized in figure 4
a). Intriguingly, the coherence spectrograms of the DNS data (
 ${\mathcal{S}}_{1}$
and
 ${\mathcal{S}}_{2}$
) and atmospheric surface layer data (
 ${\mathcal{E}}_{3}$
) in figure 4(a,c) appear to adhere to these inner- and outer-scaling limits determined from dataset
 ${\mathcal{E}}_{2}$
(similarly for dataset
 ${\mathcal{E}}_{1}$
in figure 4
b, although this is expected due to the almost identical Reynolds number between
 ${\mathcal{E}}_{1}$
and
 ${\mathcal{E}}_{2}$
). To inspect the universality of (3.2) further, all
 $\unicode[STIX]{x1D6FE}_{L}^{2}$
-spectra within the range
 $3Re_{\unicode[STIX]{x1D70F}}^{1/2}<z^{+}<0.15Re_{\unicode[STIX]{x1D70F}}$
(the same wall-normal range as used for fitting (3.2)) are plotted as a function of
 $\unicode[STIX]{x1D706}_{x}/z$
in figure 5(b). A simultaneous increase in the greyscale and decrease in the line thickness indicates an increasing
 $z$
location of the coherence spectra. Relation (3.2), with
 $C_{1}$
and
 $C_{2}$
solely determined from dataset
 ${\mathcal{E}}_{2}$
, is superposed on all data. By inspection, we observe that the
 $Re_{\unicode[STIX]{x1D70F}}\approx 2000$
data from DNS contain the same self-similar streamwise/wall-normal structure of wall-attached turbulence as found in the laboratory (
 $Re_{\unicode[STIX]{x1D70F}}\approx 14\,000$
) and atmospheric data (
 $Re_{\unicode[STIX]{x1D70F}}\approx 1.4\times 10^{6}$
). This furthermore suggests the universality of (3.2) with constants
 $C_{1}\approx 0.302$
and
 $C_{2}\approx -0.796$
, and the associated region of validity drawn in figure 4.
Finally, in the context of self-similar structure identified in DNS of turbulent channel flow, our universal streamwise/wall-normal aspect ratio of  resides between two distinct self-similar components, described by Hwang (Reference Hwang2015) as long streaky structures (
 $\unicode[STIX]{x1D706}_{x}/z\simeq 100$
) and shorter vortex packet-type structures (
 $\unicode[STIX]{x1D706}_{x}/z\simeq 3\sim 6$
). Hwang’s observations are consistent with earlier work by, for instance, del Álamo et al. (Reference del Álamo, Jiménez, Zandonade and Moser2006). The self-similar components in DNS data have typically been extracted via asymptotic behaviours seen in unfiltered energy (co)spectra of velocities, which may obscure an underlying self-similarity (see § 1). del Álamo et al. (Reference del Álamo, Jiménez, Zandonade and Moser2004) showed, using the square-root coherence, that an inner limit of
 $\unicode[STIX]{x1D706}_{x}/z\approx 10$
separates the wall-attached and wall-detached eddies, closely resembling (3.3).
4 Concluding remarks
A universal wall-attached self-similar structure has been identified in TBL flows over a Reynolds-number range
 $Re_{\unicode[STIX]{x1D70F}}\sim O(10^{3}){-}O(10^{6})$
, and has been explained through the existence of an attached-eddy structure as conceptualized by the AEH of Townsend (Reference Townsend1976). The wall-attached eddy structure has been quantified in terms of a single streamwise/wall-normal aspect ratio of
 $\unicode[STIX]{x1D706}_{x}/z\approx 14$
. Evidence of the wall-attached nature of this self-similar structure follows directly from our spectral coherence analysis, applied to data comprising synchronized two-point streamwise fluctuating velocity signals at a near-wall reference position and a range of wall-normal positions. The results show that the wall-attached self-similar structure is ingrained in our data in a region defined by an inner-scaling limit of
 $\unicode[STIX]{x1D706}_{x}/z\approx 14$
and an outer-scaling limit of
 $\unicode[STIX]{x1D706}_{x}/\unicode[STIX]{x1D6FF}\approx 10$
, and may persist down to a lower limit of
 $z^{+}=80$
. Further research is required to reveal whether an unobstructed view of a
 $k_{x}^{-1}$
scaling – consistent with such a self-similar wall-attached eddy structure – will appear in a similar subrange of
 $(\unicode[STIX]{x1D706}_{x},z)$
-space.
Acknowledgements
We gratefully acknowledge the Australian Research Council for financial support and are appreciative of the publicly available DNS data of Sillero et al. (Reference Sillero, Jiménez and Moser2013).