Implications
The main finding of this study is that there has been a reduction in genetic variation within the international Brown Swiss population. Breeders should be aware of this situation, and breeding systems should be designed to foster and maintain genetic variation in the Brown Swiss population. Future research should focus on the global Brown Swiss pedigree as a whole in order to better assess genetic variation in Brown Swiss populations.
Introduction
Pedigree information plays an important role in genetic analysis and is used in the evaluation of genetic variation in populations. The analysis of a well-recorded pedigree makes it possible to describe genetic variability and evolution through generations (Gutierrez et al., Reference Gutierrez, Altarriba, Diaz, Quintanilla, Canon and Piedrafita2003). Measures of genetic variation assessed on the basis of pedigree information include inbreeding trends, effective number of founders, effective number of ancestors and effective population size (Boichard et al., Reference Boichard, Maignel and Verrier1997).
International genetic evaluations of dairy bulls in six major breeds performed since 1994 at the Interbull Centre based at the Swedish University of Agricultural Sciences have made it possible to study international dairy pedigrees. Updating the international dairy pedigrees housed at the Interbull Centre is a continuous process. Information on the latest young bulls is added, allowing corrections to the existing information (Philipsson et al., Reference Philipsson, Forabosco and Jakobsen2009). Recently, Interbull has developed a database for storing more complete pedigree data, including information on bull dams.
One of the six dairy breeds being evaluated by Interbull is the Brown Swiss. According to the Brown Swiss Association, the global Brown Swiss cattle population is ∼7 million, which makes it the second largest dairy cattle population in the world. Brown Swiss is one of the oldest cattle breeds and originates in the valleys and mountain slopes of Switzerland. It is now farmed mainly in Europe and the United States (Brown Swiss Association, 2006).
The aims of this study were to estimate population inbreeding, to identify the genetically most important individuals for study in genomic analyses and to assess genetic variation in the Brown Swiss populations using the available pedigree information, that is, the effective number of founders, the effective number of ancestors, the effective population size, individual inbreeding coefficients, rates of inbreeding and average relatedness (AR).
Material and methods
Data
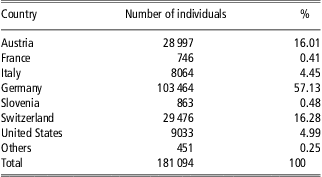
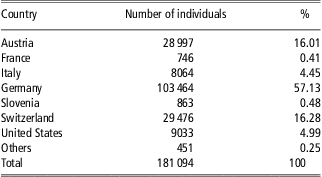
Pedigree information on 181 094 Brown Swiss cattle was used for the study. The number of males and females was 71 497 and 109 597, respectively. The pedigree data, sent to the Interbull Centre in Uppsala, Sweden, were derived from 22 countries in all, although seven countries contributed 99.75% of the pedigree (Table 1). The pedigree information included animal identification (ID), sire ID, dam ID, sex and birth date of the animal. Individuals in the pedigree were born between 1906 and 2009. Valid birth date records could not be provided for 36 895 individuals. Therefore, the birthdates of these individuals were inferred on the basis of information about the birthdates of their parents, offspring, siblings and contemporary individuals. The construction of the pedigree population started with artificial insemination (AI) Brown Swiss bulls alone; subsequently parental generations were added to the pedigree, before joining them to form a common reference population for an international genomic evaluation of dairy characters in this breed. The pedigree analysis was carried out using ENDOG software (Gutierrez et al., Reference Gutierrez, Altarriba, Diaz, Quintanilla, Canon and Piedrafita2003).
Data sources, number of individuals per country and percentage of the total world population
Ancestral contribution
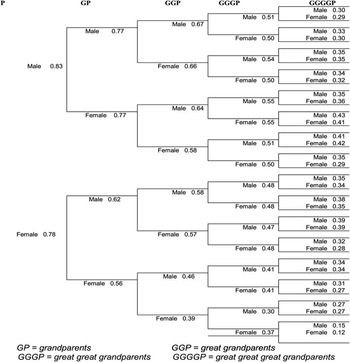
The ENDOG software calculated the contribution of each ancestor in the latest five parental generations. The calculation generated separated trees showing the male and female paths of each contributing ancestor. In other words, the genetic contribution made by the first paternal and maternal generation was calculated. For subsequent parental generations, the tree kept on dividing to the male and female ancestral paths until the fifth parental generation was reached (Gutierrez and Goyache, Reference Gutierrez and Goyache2005).
Inbreeding and AR
The inbreeding coefficient of an individual (F) is the probability that two alleles from the same gene were inherited from a common ancestor, that is, are identical by descent (Wright, Reference Wright1931). In this study, F was calculated using the Meuwissen and Luo (Reference Meuwissen and Luo1992) algorithm. Previous studies have shown that increase in average inbreeding coefficient can be used as a measure of reduction in genetic diversity (Quinton et al., Reference Quinton, Smith and Goddard1992; Wang, Reference Wang1997). The rate of inbreeding (ΔF) is the relative increase in inbreeding coefficient of individuals per generation. As proposed by Wright (Reference Wright1931), it was calculated as
 $$\rDelta F = ({{F}_t}{\rm{ - }}{{F}_{t{\rm{ - 1}}}})/({\rm{1 - }}{{F}_{t{\rm{ - 1}}}})$$
where Ft is the mean inbreeding coefficient at generation t, and Ft −1 is the mean inbreeding coefficient at generation t−1.
According to Dunner et al. (Reference Dunner, Checa, Gutierrez, Martin and Canon1998), AR can be defined as the probability that an allele randomly chosen from a pedigree population belongs to a certain individual. Accordingly, the AR coefficient was calculated as
 $${{c^{\prime}}} = ({{1/n}}){{1'A}}$$
where c′ is a row vector and is described as the average of AR coefficients in the row for individuals, A is a numerator of the relationship matrix, and n is its dimension.
Effective population size
Effective population size ( $$${{N}_e} $$$
) is an important parameter in population genetics for measuring the rate of inbreeding in a population (Caballero, Reference Caballero1994). It can be defined as the size of an ideal population that would have the same rate of inbreeding per generation as the actual population (Sölkner et al., Reference Sölkner, Filipic and Hampshire1998). Therefore,
 $$${{N}_e} $$$
was calculated as
 $${{N}_e} = {\rm{1}}/{{2\rDelta F}}$$
where, as stated above, ΔF is the rate of inbreeding.
Generation interval
Another important population genetics parameter estimated for the international Brown Swiss population was generation interval (L). This refers to the average age of parents when their offspring are born (Gutierrez et al., Reference Gutierrez, Altarriba, Diaz, Quintanilla, Canon and Piedrafita2003). Average generation intervals for the international Brown Swiss population and for each of the four ancestral paths (sire–son, sire–daughter, dam–son and dam–daughter) were calculated in this study.
Measures of genetic diversity
It is possible to analyse the probabilities of gene origin in a pedigree (Dickson and Lush, Reference Dickson and Lush1933; James, Reference James1972; Vu Tien Khang, Reference Vu Tien khang1983; Boichard et al., Reference Boichard, Maignel and Verrier1997). Essentially, this involves calculating the genetic contribution of the founders to the current population. According to Lacy (Reference Lacy1989), the effective number of founders ( $$${{f}_e} $$$
) is the number of equally contributing founders that would give rise to the same genetic diversity as in the reference population under study. Thus, it was calculated as
 $${{f}_e} = {\rm{1/}}\mathop{\sum}\limits_{k = {\rm{1}}}^f {q_{k}^{{\rm{2}}} } $$
where  $$${{q}_k} $$$
is the expected contribution of founder k.
The effective number of ancestors ( $$${{f}_a} $$$
) is defined as the minimum number of ancestors (not necessarily founders) that explains all of the genetic diversity in a reference population (Sölkner et al., Reference Sölkner, Filipic and Hampshire1998). The effective number of ancestors was thus calculated as
 $${{f}_a}\, = \,{\rm{1/}}\mathop{\sum}\limits_{k\, = \,{\rm{1}}}^f {p_{k}^{{\rm{2}}} } $$
where  $$$p_{k}^{{}} $$$
is the marginal contribution of an ancestor (Boichard et al., Reference Boichard, Maignel and Verrier1997). AR of a founder individual designates a percentage measure of the extent to which the founder can be regarded as the origin of the reference population. Thus, the founder contribution of a founder individual was calculated as its AR (Gutierrez and Goyache, Reference Gutierrez and Goyache2005).
Results
Ancestral contribution
This study showed that the paternal ancestry of the international Brown Swiss population was more complete than the maternal ancestry: the frequency of contribution of each ancestor in the pedigree to the fifth parental generation showed that the pedigree was 83% complete for sires and 78% complete for dams. The frequency of contribution of each ancestor in both paternal and maternal ancestral line in the five-generation pedigree is shown in Figure 1.
Contribution of ancestors in a five-generation pedigree.

Inbreeding and AR
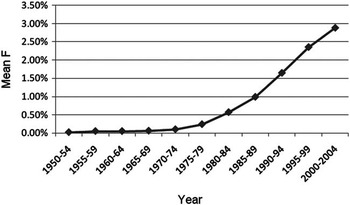
The mean inbreeding coefficient calculated for the whole pedigree population was 0.77%. Mean inbreeding coefficient per 5-year period, calculated from 1950 to 2004, showed a positive trend (Figure 2). The mean inbreeding coefficient for individuals born between the years 1950 and 1954 was 0.02%. The mean inbreeding coefficient showed a continuous increase during the period 1954 to 2004 and reached almost 1% between 1985 and 1989, 1.65% between 1990 and 1994 and 2.36% between 1995 and 1999. The highest mean inbreeding coefficient, 2.89%, was recorded in individuals born between 2000 and 2004.
Mean inbreeding coefficient (F) per 5-year period from 1950 to 2004.

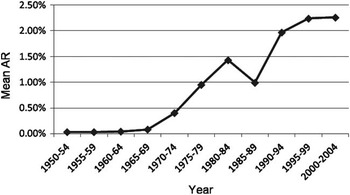
The mean AR calculated for the entire pedigree population was 1.1%. The average degree of relatedness between individuals increased through the years. The mean AR calculated for the period 1950 to 1954 was 0.03%. As with the mean inbreeding coefficient, there was only a slight increase in mean AR until 1970. But since 1970, with the exception of the decline between 1985 and 1989, mean AR showed a swift increase, and it reached 2.26% between 2000 and 2004 (Figure 3).
Mean average relatedness (AR) per 5-year period from 1950 to 2004.

Effective population size
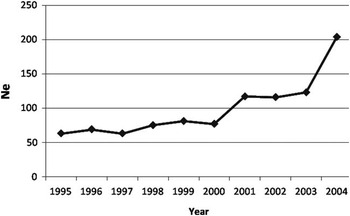
To obtain a clear understanding of the current nature of the international Brown Swiss population, effective population size was calculated for the most recent years. This, calculated per year between 1995 and 2004, ranged between 63 and 204. As can be seen from Figure 4, there was an increase in effective population size in seven of the 10 years examined. A decline in effective population size was registered in the years 1997, 2000 and 2002.
The Effective population size (Ne) per year from 1995 to 2004.

Generation interval
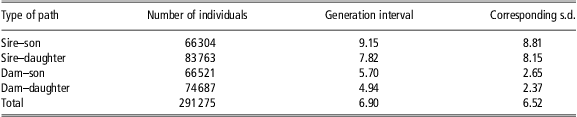
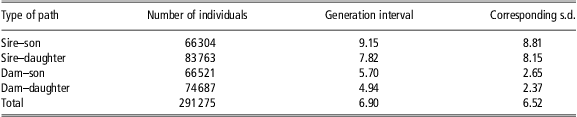
Generation intervals calculated for the four ancestral paths are shown in Table 2. The average interval for the total pedigree population was 6.90 years, with a high standard deviation of 6.52 years. The sire–offspring pathway had a higher interval than that calculated for the dam–offspring pathway. The sire–son interval was 9.15 years, whereas the sire–daughter interval had a value of 7.82 years. The dam–son and dam–daughter intervals were 5.70 and 4.94 years, respectively.
Generation intervals (years) across four selection pathways and standard deviation
Measures of genetic diversity
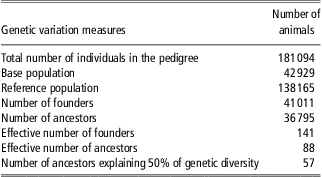
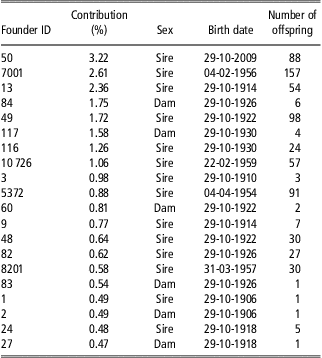
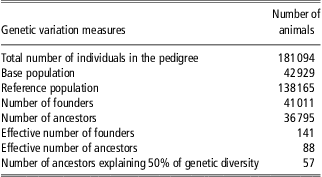
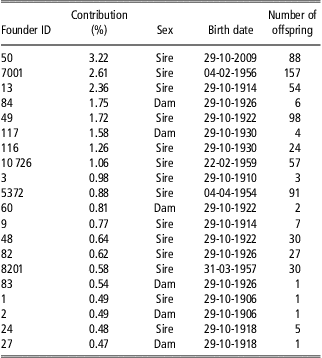
The number of founders of the Brown Swiss population was 41 011, which amounts to 22.65% of the total pedigree population (Table 3). The number of ancestors (not necessarily founders) was 36 795, which is equivalent to 20.32% of the whole population. The effective number of founders of the pedigree population was 141. Analysis of the top genetically contributing founders showed that most of these, that is, 14 of the top 20, were sires. The highest contributing founder sire had made a 3.22% genetic contribution, whereas the highest contributing founder dam had made a 1.75% genetic contribution (Table 4). The overwhelming majority of founders for the total reference population were from the US subpopulation.
Measures of genetic variation
Genetic contribution of top 20 founders
Discussion
The difference in the completeness of the paternal and maternal paths in this study is greater than that found in studies of the pedigree populations of other cattle breeds (Cassell et al., Reference Cassell, Adamec and Pearson2003; Gutierrez et al., Reference Gutierrez, Altarriba, Diaz, Quintanilla, Canon and Piedrafita2003). This could be because international genetic evaluations conducted at the Interbull Centre focus principally on bulls, given that the Brown Swiss population pedigree was constructed initially with bulls only. The findings of this study show a higher level of inbreeding in the Brown Swiss population than that found in most of the other cattle populations around the world. Again, it should be noted that pedigrees constructed starting from the earliest generation could lead to a different picture. The high level of inbreeding identified in this investigation, as compared with that in other studies, can be explained by the presence of a very large number of AI bulls with above-average individual inbreeding coefficients. An alternative explanation is that the animal recording for Brown Swiss started very early, with the top founders being born at the beginning of the 20th century, whereas with other breeds the recording started around the middle of the 20th century or later.
The fact that many of the bulls have a large number of offspring, with some of them in more than one country, could be another reason for the high level of inbreeding in the Brown Swiss population. The mean inbreeding coefficients for the British Holstein–Friesian population were clearly below 0.5% for individuals born in the late 1990s (Roughsedge et al., Reference Roughsedge, Brotherstone and Visscher1999). All eight Spanish cattle breeds studied by Gutierrez et al. (Reference Gutierrez, Altarriba, Diaz, Quintanilla, Canon and Piedrafita2003) showed <0.1% mean inbreeding coefficient in all periods, even in the late 1990s. However, higher mean inbreeding coefficients for cattle populations have also been reported. Hammami et al. (Reference Hammami, Croquet, Stoll, Rekik and Gengler2007) report mean inbreeding coefficients of 3.1% and 2.12% for the year 2000 in Holstein populations in Luxemburg and Tunisia, respectively. Wiggans et al. (Reference Wiggans, Van Raden and Zuurbier1995) report mean inbreeding coefficients between 3% and 4% for American dairy cattle breeds in the 1990s.
A 1.1% mean AR suggests a higher AR in the international Brown Swiss population than that in most other breeds (see Gutierrez et al., Reference Gutierrez, Altarriba, Diaz, Quintanilla, Canon and Piedrafita2003). Meanwhile, Peixoto et al. (Reference Peixoto, Poggian, Verneque, Egito, Carvalho, Penna, Bergmann, Viccini and Machado2010) calculated a 1.1% mean AR in the Guzerat breed in Brazil, which is identical to the value in the Brown Swiss population. The AR values in this study indicate that the relatedness of the newly born animals is increasing.
The increase in effective population size in 7 of the 10 years between 1995 and 2004 may be attributable to the decline in the rate of increase of inbreeding during those particular years. The exchange of genetic material between the contributing countries could provide another reason for the increase in effective population size. The start of national genetic evaluations in many European countries dates back to the 1980s, which witnessed a rising rate of exchange of the genetic material. The effective population size of the Brown Swiss population from 1995 onwards was above the recommended effective population size, that is, between 50 and 100 animals (Food and Agriculture Organization of the United Nations, 1998; Bijma, Reference Bijma2003; Sorensen et al., Reference Sorensen, Sorensen and Berg2005). It should be noted, however, that the recommended number was based on the assumption that natural selection cancels out inbreeding depression (Sorensen et al., Reference Sorensen, Sorensen and Berg2005). In 1998, Franklin and Frankham (Reference Franklin and Frankham1998) suggested that an effective population size of at least 500 is a requirement for maintaining genetic variation in the long term, which suggests that the Brown Swiss population could be at risk.
The average generation interval for the total pedigree population was 6.90 years, with a high standard deviation of 6.52 years. This interval is considerably higher than the average interval in other breeds. For Danish Holstein, Danish Jersey and Danish Red populations, generation intervals between 4.6 and 5.2 years have been reported (Sorensen et al., Reference Sorensen, Sorensen and Berg2005). Most of the Spanish beef breeds studied by Gutierrez et al. (Reference Gutierrez, Altarriba, Diaz, Quintanilla, Canon and Piedrafita2003) had average generation intervals of between 3.7 and 5.5 years; and Bozzi et al. (Reference Bozzi, Franci, Forabosco, Pugliese, Crovetti and Filippini2006) reported generation intervals <5.35 for three Italian beef breeds. The structure of the pedigree at the Interbull Centre, which is built primarily on the male side of the pedigree, can explain, in part, the long generation interval in our material: in that material the females without offspring are missing, and therefore the dam–daughter and sire–daughter generation intervals are overestimated. A similar explanation can be applied to sons that failed to produce any offspring that became a dam or a sire. For bulls, the overestimation problem may have been aggravated by the deletion of records of bulls without a second batch of daughters from the data. A hypothetical example can be used to explain this point. Consider a bull born in 1975 with a first crop of daughter only. Such a bull will not have any daughters recorded after 1981, which is the cut-off year for submission of data to the Interbull Centre. Consequently, it will be missing from the Interbull Centre's pedigree database.
The sire–offspring pathway showed the highest average generation intervals, implying that dams were replaced earlier than sires. Another explanation would be that the sire–son generation interval was based, not on the average of all sons, but on the average of those sons that survived to their second crop of daughters. Again, the use of semen from a top bull many years after the birth of its first offspring could also result in a high average generation interval for the sire–offspring pathway. The generation intervals calculated for the sire–offspring pathway were higher in the Brown Swiss population than they were in other breeds (Gutierrez et al., Reference Gutierrez, Altarriba, Diaz, Quintanilla, Canon and Piedrafita2003; Márquez and Garrick, Reference Márquez and Garrick2007; Mc Parland et al., Reference Mc Parland, Kearney, Rath and Berry2007). However, any conclusions drawn from this finding must reflect the fact that the construction of the pedigree in this study is based on bulls only.
The average generation intervals in the dam–offspring pathway in the Brown Swiss population were lower than those of most breeds studied by Gutierrez et al. (Reference Gutierrez, Altarriba, Diaz, Quintanilla, Canon and Piedrafita2003), Márquez and Garrick (Reference Márquez and Garrick2007. This disparity has to be interpreted with caution due to the particular approach to pedigree construction in the present study. It seems that the age of sires at the birth of their progeny varied considerably, as the average generation intervals for both sire–son and sire–daughter pathways showed high standard deviations.
Compared with the total number of founders, the number of effective founders was low. This suggests that the vast majority of founders made a low contribution to the genetic variability of the reference population, which led to a loss as a result of the unequal contribution of founders (Lacy, Reference Lacy1989).
The effective number of ancestors (88) was lower than the effective number of founders (141), which indicates that there might have been a genetic bottleneck in the pedigree population in one or more countries providing the data (Boichard et al., Reference Boichard, Maignel and Verrier1997). However, this contrast could also be explained by the fact that the exchange of genetic material among the European countries from the 1960s to the 1980s was very limited, with imports of North American animals being correspondingly dominant. Most of the top genetically contributing founders were sires, which might be due to the considerably larger number of offspring produced per sire than per dam. The relatively higher effective number of founders and effective number of ancestors in this study might explain the low genetic contribution made by top founders and ancestors.
Conclusions
Given that the pedigree population in this study was constructed initially with Brown Swiss bulls alone, with parental generations further being added to the pedigree to form a common reference population, the findings presented here should be handled with caution as a different type of pedigree may give a rather different picture. Future research on a more complete international Brown Swiss pedigree needs to be undertaken if we are to have a better assessment of the genetic variation and population structure of the international Brown Swiss cattle population.
What this study clearly indicates is that sires have been the most genetically influential individuals in the pedigree population under study. Therefore, it is important to increase the number of AI bulls, and to select for, and use, AI bulls with a low individual coefficient of inbreeding to maintain a desirable level of genetic variation in the Brown Swiss population. Decreasing the number of offspring per bull is a possible means of lowering the level of inbreeding in the population. On the basis of the findings of this paper, the descendants of the most genetically influential individuals (i.e. the descendants of the top 20 founders shown in Table 4) can be used for Interbull's Intergenomics project, which deals with Brown Swiss genomic evaluation. Frequent and accurate exchange of information between countries should be maintained for better decision making as far as the conservation of genetic variation is concerned.
Acknowledgements
The authors would like to acknowledge Interbull member countries for providing data. The first author is grateful to the Interbull Centre for providing all the necessary information, and for unstinting support. He wrote this paper as part of his MSc programme at the Swedish University of Agricultural Sciences.