





Major depressive disorder (MDD) is the second most prevalent psychiatric disorder worldwide, affecting an estimated 3.8% of the global population and 5% of adults. Reference Jiang, Zhu, Huang, Li, Chen and Jiang1 It accounts for 4.3% of the 13% global disease burden attributed to psychiatric and neurological disorders. Reference Ferrari, Charlson, Norman, Patten, Freedman and Murray2 MDD is characterised by persistently low mood or anhedonia for a period of at least 2 weeks, accompanied by cognitive, behavioural and neurovegetative symptoms such as poor concentration, hopelessness, worthlessness, guilt and, in moderate-to-severe cases, suicidal thoughts, intentions, plans or attempts. 3 Despite this canonical definition, depression frequently presents in clinical practice with somatic rather than psychological complaints. Approximately two-thirds of patients with depression first report physical symptoms such as fatigue, sleep disturbance, appetite changes, generalised pain, headaches, back pain or gastrointestinal disturbances. Reference Tylee and Gandhi4 This translation of emotional distress into recurring, multi-system bodily complaints without an identifiable organic cause is referred to as somatisation. Somatisation is recognised as a component of depression across many cultures, but in some settings it may be the predominant or even sole mode of presentation. Reference Kapfhammer5
Literature review
A growing body of work suggests that cultural beliefs, social norms and stigma shape how mental health conditions are experienced, expressed and managed. Reference Ntumi, Upoalkpajor and Nimo6–Reference Ibrahim, Amit, Shahar, Wee, Ismail and Khairuddin10 Cultural context influences not only symptom experience but also how individuals communicate distress to clinicians, including the omission of salient cognitive or emotional complaints due to shame or anticipated stigma, as described in several Asian populations. Reference Bhatt, Tomenson and Benjamin11,Reference Hussain, Rana, Ashraf, Khurram and Sindhu12 In many Asian cultures, overt expression of emotional distress or ‘dwelling’ on negative thoughts is discouraged, and distress is more often channelled into somatic complaints. Reference Hussain, Rana, Ashraf, Khurram and Sindhu12 Explanatory models that attribute depression and other psychiatric syndromes to spiritual or supernatural causes, curses, spirit possession or divine punishment can further heighten stigma, divert help-seeking towards traditional or religious healers and delay or prevent access to biomedical care. 13 Gender norms add an additional layer: in many Asian societies, men are less likely to acknowledge emotional distress or frame their difficulties in psychological terms. Reference Kim and Kim14 By contrast, although depression carries some stigma in the West, Reference Birtel and Mitchell15 individuals are generally more likely to endorse biological or psychological models of illness and to report internal states such as guilt, worthlessness and cognitive difficulties. Help-seeking patterns mirror these differences: people in Western settings are more likely to seek formal mental health or primary care services whereas individuals in Eastern settings often turn first to family, friends and traditional or religious healers, and may delay formal care until symptoms become ‘too severe to bear’. 13 Nonetheless, stigma persists in high-income Western settings as well; mental illness may still be construed as personal weakness or failure of self-control, and individuals with psychiatric disorders – particularly those with substance use disorders – may be perceived as dangerous or morally culpable rather than ill. Reference Altweck, Marshall, Ferenczi and Lefringhausen16
These patterns can be understood within a broad biopsychosocial framework in which depression arises from the interplay of biological vulnerability, psychological factors and social stressors, with the last of these activating latent susceptibility into manifest illness. Reference Schotte, Van Den Bossche, De Doncker, Claes and Cosyns17 Within this framework, culture acts as a mediating variable that shapes both the expression and perception of depressive symptoms. Core features such as low mood, anhedonia and functional impairment appear to be broadly universal, but the language, bodily focus and social meanings attached to these experiences vary across settings. Stigma – as a social, interpretive, cultural and moral process – is central to this variation, influencing whether distress is primarily articulated through psychological idioms (e.g. ‘feeling guilty’, ‘can’t concentrate’) or somatic idioms (e.g. ‘body pain’, ‘weakness’, ‘stomach problems’). Reference Yang, Kleinman, Link, Phelan, Lee and Good18
When local norms emphasise social harmony, family reputation and ‘face’, as in many collectivistic societies including Pakistan, mental illness may be seen as bringing shame to the individual and family, reinforcing a preference for somatic rather than cognitive or affective complaints.
Most empirical work on the expression of depression and related help-seeking behaviours, however, has been conducted in Western, high-income settings, leaving substantial gaps in understanding the phenomenology of depression in the global South. Pakistan – the world’s fifth most populous country – has a particularly high estimated burden of depression, with approximately 19.62% of adults meeting criteria for MDD compared with about 5% in the USA. 19
Depression is a major contributor to morbidity and disability-adjusted life years, Reference Alvi, Ashraf and Naz20 yet it remains underdiagnosed and undertreated. One likely explanation is that local presentations, shaped by cultural norms, stigma and explanatory models, diverge from the symptom patterns emphasised in psychiatric nosology and research, which are largely grounded in Western clinical experience. This mismatch may contribute to missed or delayed recognition of depression in general medical settings, where patients frequently present with somatic complaints and where time and mental health training are limited.
Rationale and aims
Against this backdrop, in Pakistan there is a clear need to examine depression simultaneously as both a universal disorder and a culturally patterned phenomenon, particularly in frontline medical settings where most patients first seek care. The present study addresses this gap by focusing on patients presenting to the medical department of a tertiary care centre in urban Pakistan. Specifically, we aimed to:
-
(a) estimate the prevalence and treatment rates of depression in this population;
-
(b) characterise the expression of depression, including somatic and cognitive symptom reporting, and compare these patterns with those described in the global North.
Method
Design: we conducted cross-sectional screening for depression via Patient Health Questionnaire 9 (PHQ-9) and concomitant chart review for symptoms.
Setting: we recruited the patients for our study from the waiting rooms of a busy general medical clinic in a tertiary care clinic in Lahore. Lahore is Pakistan’s second largest city, with a population of 14.8 million, and Urdu is the lingua franca.
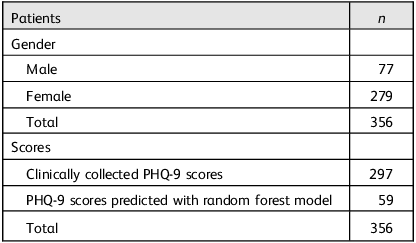
Our team interviewed 356 patients, of whom 279 were women and 77 men. We administered a PHQ-9 questionnaire to 297 patients. For the remaining 59, we used a predefined list of depression-related symptoms to compute a symptom count from their clinical records and applied a random forest model, trained on patients with observed PHQ-9 scores, to generate predicted PHQ-9 values. Table 1 summarises the demographic composition of the study sample.
Demographic composition of the study sample. The sample comprised 356 adults, including 77 men and 279 women. Patient Health Questionnaire 9 (PHQ-9) scores were directly collected for 297 participants, with symptom-based prediction using a random forest model applied to estimate PHQ-9 scores for the remaining 59 encounters with missing questionnaire data. All analyses were conducted on the combined data-set of observed and predicted PHQ-9 values

Table 1 Long description
The table presents the demographic composition of a study sample, focusing on gender distribution and PHQ-9 scores. It consists of 2 rows and 2 columns. The first row includes the headers Patients and n. The second row is divided into two subcategories: Gender and Scores. Under Gender, there are two subcategories: Male with a value of 77 and Female with a value of 279. The total number of patients is 356. Under Scores, there are two subcategories: Clinically collected PHQ-9 scores with a value of 297 and PHQ-9 scores predicted with random forest model with a value of 59. The total number of scores is 356.
Data collection: a study team member (STM) approached all patients waiting to be seen in the medical clinic in Services Hospital Lahore. If the patient was agreeable to participation in the study, the STM obtained informed consent verbally and explained the PHQ-9 and General Anxiety Disorder 7 (GAD-7) questionnaires to each patient, in Urdu. A copy of the medical records for the visit provided us with the symptoms of the patient and the treatment given. Because the clinic operated on a walk-in basis and issued new medical record numbers at every visit, we could not perform longitudinal tracking; therefore, we treated each patient encounter as an independent observation representing a single presentation of disease.
Ethical approval: the institutional review board (IRB) at Lahore University of Management Sciences reviewed and approved the study design for our study. Ethical approval was given for the period 20 June–20 August 2023.
All STMs received training for the conducting of human subject research, and were trained to administer both PHQ-9 and GAD-7.
The authors assert that all procedures contributing to this work comply with the ethical standards of the relevant national and institutional committees on human experimentation, and with the Helsinki Declaration of 1975 as revised in 2013. All procedures involving human subjects/patients were approved by the IRB, Lahore University of Management Sciences, under approval number LUMS-IRB/06202023/BA-FWA-00030383.
Analysis
Mixed-methods approach
We used a mixed-methods design that integrated quantitative modelling with qualitative interpretation of unstructured clinical text to characterise depressive symptom patterns. Clinical notes were preprocessed using Python-based natural language processing (NLP) pipelines to extract affective, behavioural and somatic symptoms (e.g. sadness, irritability, loss of motivation, fatigue, pain and gastrointestinal complaints). Each clinical encounter was encoded as a binary symptom vector, generating a feature matrix with encounters as rows and symptoms as columns.
Quantitative analyses included word-frequency matrices, heatmaps and logistic regression to identify patterns and predictors of depression severity. To address class imbalance driven by an over-representation of minimal and mild PHQ-9 scores, analyses were restricted to moderate, moderately severe and severe encounters.
The qualitative component consisted of visual inspection of symptom distributions, interpretation of text-derived visualisations (e.g. word clouds) and culturally informed analysis of somatic versus psychological symptom expression. Together, these approaches enabled empirical measurement of symptom patterns, while contextualising findings within cultural differences in how depression is expressed and documented in clinical encounters.
Qualitative visualisation of symptom patterns
To improve interpretability, we generated word clouds and normalised heatmaps across PHQ-9 categories. These visualisations highlighted frequently reported symptoms and revealed a consistent predominance of somatic complaints – particularly fatigue, headaches and gastrointestinal pain – across all severity levels. Higher-severity encounters showed increasingly complex symptom combinations, providing qualitative context that informed variable selection for the quantitative phase.
Quantitative modelling using logistic regression
We then fit multivariable logistic regression models to identify predictors of moderate-to-severe depression, treating each encounter independently. Covariates included gender, age, anxiety, headache, fatigue/weakness, bodily/back pain and gastrointestinal symptoms (modelled as composite and, separately, by subtype). Robust standard errors were used, and all models met recommended events-per-variable and diagnostic criteria, including acceptable calibration, discrimination and low multicollinearity (variance inflation factor <5).
Statistical work was performed using Stata version 19 for Windows. All analyses were conducted using macOS 26.2. Code was developed and executed in Visual Studio Code (version 1.119.0), developed by Microsoft Corporation, Redmond, Washington, USA, downloadable at https://code.visualstudio.com/download. Python (version 3.11), the programming language used for all analyses, runs on macOS in this project and is maintained by the Python Software Foundation, Wilmington, Delaware, USA, downloadable at https://www.python.org/downloads/. Data manipulation and analysis were performed using pandas (version 3.0.2) and NumPy, both open-source Python libraries run on macOS. Both are maintained by their respective open-source development teams (the pandas development team and the NumPy Developers) and are fiscally sponsored by NumFOCUS, headquartered in Austin, Texas, USA. pandas can be downloaded at https://pypi.org/project/pandas/ and NumPy at https://numpy.org/install/. Machine learning modelling was performed using scikit-learn (version 1.8.0), an open-source Python library run on macOS, maintained by the scikit-learn developers and fiscally sponsored by NumFOCUS (Austin, Texas, USA), with core development coordination based at Inria (Paris, France), downloadable at https://scikit-learn.org/stable/install.html. Data visualisation was performed using matplotlib (version 3.10.9) and seaborn (version 0.13.2), both open-source Python libraries run on macOS. Matplotlib is maintained by the Matplotlib Development Team and fiscally sponsored by NumFOCUS (Austin, Texas, USA), downloadable at https://matplotlib.org/stable/users/installing/index.html. Seaborn is maintained by Michael Waskom and seaborn contributors, an open-source community project without a fixed corporate headquarters, hosted on GitHub and PyPI, downloadable at https://seaborn.pydata.org/installing.html.
Model interpretation and reliability
Male gender was associated with reduced odds of moderate-to-severe depression whereas anxiety showed a positive association, although with wide confidence intervals. When gastrointestinal symptoms were disaggregated, constipation emerged as a significant predictor whereas diarrhoea did not. Complete-case analyses produced stable estimates, and stochastic imputation yielded similar results. Although some predictors showed borderline significance, the combined visual and statistical findings strengthened confidence in the overall symptom patterns identified.
Results
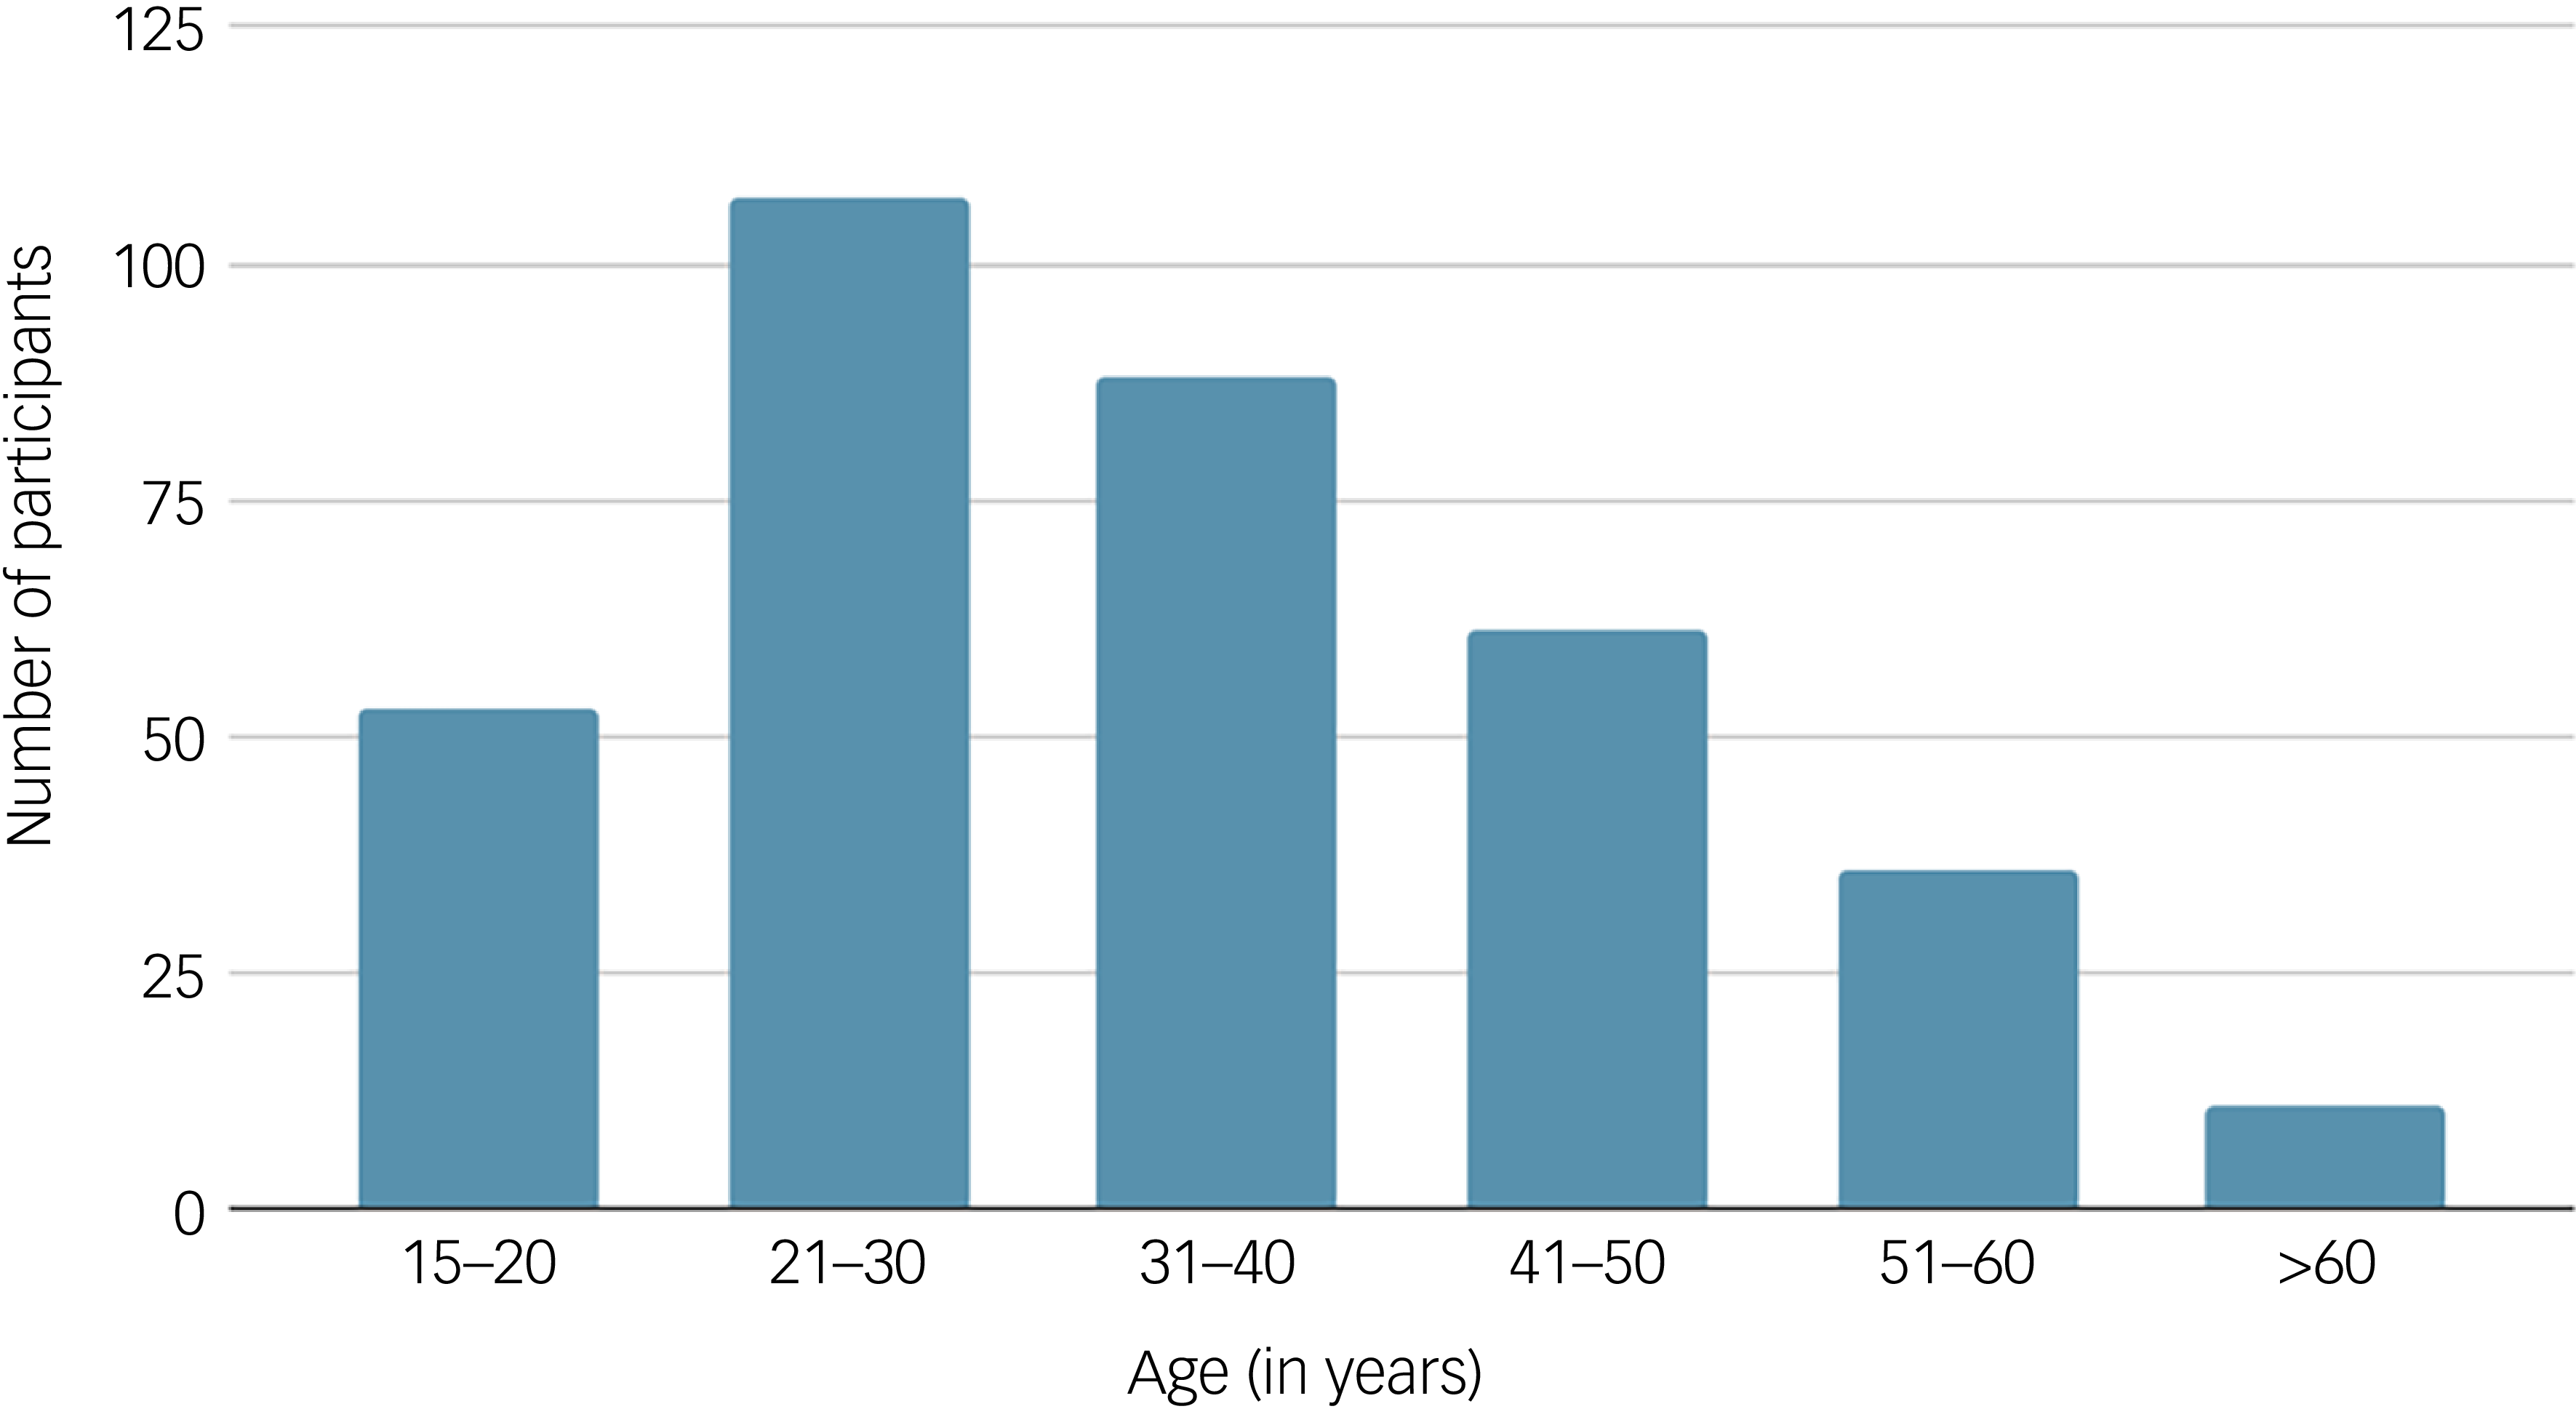
Our study participants ranged in age from 15 to 75 years, with median and mean of 33 and 34.97, respectively. Figure 1 shows the age distribution of our patients.
Age distribution (years) of study participants.

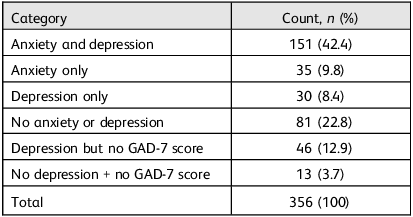
Of the 356 patients included, 7.5% had no depression, 30.0% had mild depression, 35.0% had moderate, 27.0% had moderately severe and 1.5% had severe depression; 63.0% of our patients had moderate-to-severe depression and an equal percentage had anxiety; most had both anxiety and depression but only 8.4% had depression only. The severity distribution of depression in our study population is depicted in Table 2, and Table 3 shows the depression–anxiety overlap in the study group.
Severity distribution for depression and anxiety (N = 356)

Table 2 Long description
A table comparing the severity distribution for depression and anxiety among 356 patients. The table has 2 rows and 6 columns. The columns are labeled Condition, No disease, Mild, Moderate, Moderately severe, Severe, and Missing GAD-7. The row labels are Depression and Anxiety. Each cell contains the count and percentage of patients in each severity category. Row 1: Depression, No disease, 27 (7.6 percent), Mild, 102 (28.7 percent), Moderate, 126 (35.4 percent), Moderately severe, 96 (27.0 percent), Severe, 5 (1.4 percent), Missing GAD-7, 0 (0 percent). Row 2: Anxiety, No disease, 28 (7.9 percent), Mild, 83 (23.3 percent), Moderate, 101 (28.4 percent), Moderately severe, N/A, Severe, 85 (23.9 percent), Missing GAD-7, 59 (16.6 percent).
GAD-7, General Anxiety Disorder 7; N/A, not available in this data-set. Values shown as n (% of total).
Anxiety–depression overlap and missing General Anxiety Disorder 7 (GAD-7) breakdown (N = 356)

Table 3 Long description
The table categorizes patients based on anxiety and depression counts and percentages. It has 7 rows and 2 columns. The columns are labeled Category and Count, n (%). The row labels and values are as follows: Row 1: Anxiety and depression, 151 (42.4); Row 2: Anxiety only, 35 (9.8); Row 3: Depression only, 30 (8.4); Row 4: No anxiety or depression, 81 (22.8); Row 5: Depression but no GAD-7 score, 46 (12.9); Row 6: No depression + no GAD-7 score, 13 (3.7); Row 7: Total, 356 (100). The table shows the distribution of anxiety and depression among 356 patients, with notable categories including Anxiety and depression, No anxiety or depression, and Depression but no GAD-7 score.
Because our study was conducted in a busy public hospital medical clinic in Pakistan, attendance at healthcare services there can itself be a source of distress. One of the aims of this study was to explore the extent to which clinically significant depression is under-recognised in busy primary care settings. In this context, mild depressive symptoms are both highly prevalent and more difficult to distinguish from background distress (i.e. a lower signal-to-noise ratio), which complicates reliable modelling in this subgroup. Therefore, we excluded visits scoring only mild on PHQ-9 during analysis.
Analysis of the clinical presentation of the participants included in the study demonstrated a predominantly somatic pattern, with several physical complaints emerging consistently across all depression severity levels.
Epigastric pain, fever, bodily aches/myalgia, headaches and weakness were the most prevalent symptoms across all PHQ-9 categories (see Figs 2–7).
Prevalence of symptoms across all Patient Health Questionnaire 9 (PHQ-9) categories: all study participants.

Prevalence of symptoms across all Patient Health Questionnaire 9 (PHQ-9) categories: patients with depression.

Prevalence of symptoms across all Patient Health Questionnaire 9 (PHQ-9) categories: patients with no depression.

Prevalence of symptoms across all Patient Health Questionnaire 9 (PHQ-9) categories: patients with moderate depression.

Prevalence of symptoms across all Patient Health Questionnaire 9 (PHQ-9) categories: patients with moderately severe depression.

Prevalence of symptoms across all Patient Health Questionnaire 9 (PHQ-9) categories: patients with severe depression.

Epigastric pain, followed by bodily aches, remained the most prominent symptoms across all groups, including participants with no depression, rendering this group less specific for prediction of depression in these populations.
Constipation emerged more strongly with increasing severity of depression, in contrast to the no-depression category, which reported this symptom less frequently.
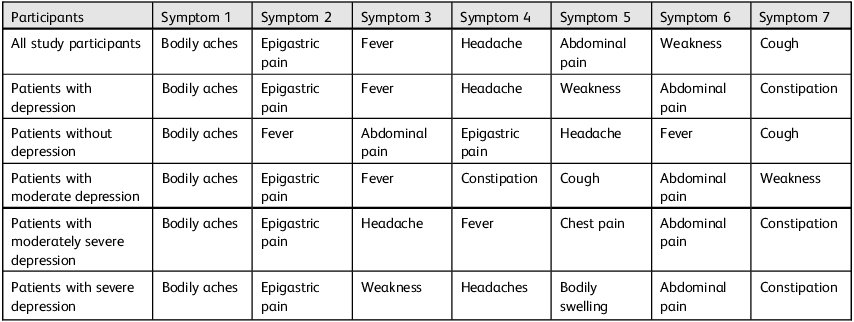
Table 4 summarises the most common symptoms reported by patients, grouped by the severity of their depression. Within moderate depression, the heatmap is characterised by a concentrated pattern dominated by epigastric pains (0.28), followed by bodily aches (0.25) and fever (0.15), with additional contributions from weakness (0.07) and cough (0.07). Gastrointestinal and pain-related symptoms such as abdominal pain (0.06), shortness of breath (0.06), constipation (0.06), diarrhoea (0.05), nausea (0.04) and chest pain (0.04) were present but at lower prevalence, whereas most other symptoms were near zero (≤0.03). This aligns with the overall observation that moderate depression patient encounters frequently include constipation and shortness of breath, in addition to prominent pain-related symptoms.
Most common symptoms reported by patients, grouped by severity of depression

Table 4 Long description
A table comparing common symptoms reported by patients grouped by the severity of their depression. The table has six rows and eight columns. The columns are labeled as Participants, Symptom 1, Symptom 2, Symptom 3, Symptom 4, Symptom 5, Symptom 6, and Symptom 7. The rows are labeled as All study participants, Patients with depression, Patients without depression, Patients with moderate depression, Patients with moderately severe depression, and Patients with severe depression. Row 1: All study participants, Bodily aches, Epigastric pain, Fever, Headache, Abdominal pain, Weakness, Cough. Row 2: Patients with depression, Bodily aches, Epigastric pain, Fever, Headache, Weakness, Abdominal pain, Constipation. Row 3: Patients without depression, Bodily aches, Epigastric pain, Fever, Abdominal pain, Epigastric pain, Headache, Fever, Cough. Row 4: Patients with moderate depression, Bodily aches, Epigastric pain, Fever, Constipation, Cough, Abdominal pain, Weakness. Row 5: Patients with moderately severe depression, Bodily aches, Epigastric pain, Headache, Fever, Chest pain, Abdominal pain, Constipation. Row 6: Patients with severe depression, Bodily aches, Epigastric pain, Weakness, Headaches, Bodily swelling, Abdominal pain, Constipation.
In moderately severe depression, the symptom profile broadened while remaining predominantly physical. Bodily aches (0.41) became the dominant feature, followed by epigastric pains (0.21) and headache (0.21), with fever (0.14) also prominent; abdominal pain (0.08), constipation (0.07) and chest pain (0.07) appeared as meaningful mid-tier contributors. Notably, fever (0.14) remained substantially more common than cough (0.03), consistent with a ‘fever > cough’ pattern across severity strata, and constipation remained at a higher level than in the moderate group.
In severe depression the heatmap shows a sharper peak, with bodily aches (0.37) predominant followed by epigastric pains (0.23) and then weakness (0.20) and headache (0.20). A secondary cluster is visible at lower prevalence, including abdominal pain (0.10) and bodily swelling (0.10), and a band around 0.07 comprising dizziness (0.07), nausea (0.07), constipation (0.07), fever (0.07), fatigue (0.07) and chest pain (0.07). Compared with lower-severity groups, severe patient encounters therefore show a more even spread of multiple co-occurring somatic symptoms, although the profile remains overwhelmingly physical.
Among patients from all PHQ-9 categories, the heatmap is characterised by a broad but still top-heavy pattern dominated by bodily aches (0.29), followed by epigastric pains (0.21) and fever (0.14), with secondary contributions from headache (0.10) and abdominal pain (0.10). A mid-tier cluster is then visible, including weakness (0.07), cough (0.05) and shortness of breath (0.05), alongside constipation (0.04) and chest pain (0.04). Lower-prevalence symptoms, such as nausea (0.03), diarrhoea (0.03), palpitations (0.03), bodily swelling (0.03) and anorexia (0.03), remained present but less dominant, whereas the remaining symptoms were comparatively rare (≤0.02).
Logistic regression on moderate/severe depression
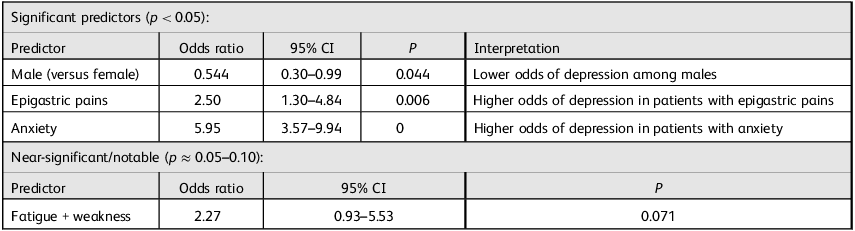
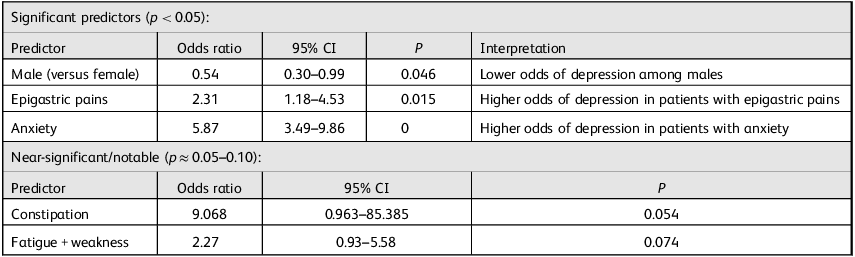
We estimated multivariable logistic regression models of moderate/severe depression. Table 5 evaluates gastrointestinal symptom composites and Table 6 evaluates constipation and diarrhoea as separate predictors. Odds ratios above 1 indicate higher odds of depression, with those below 1 indicating lower odds.
Constipation and diarrhoea in gastrointestinal symptom composites

Table 5 Long description
A table showing predictors of moderate/severe depression with odds ratios and confidence intervals. The table is divided into two sections: significant predictors and near-significant/noteable predictors. The significant predictors section includes three rows with columns for predictor, odds ratio, 95% confidence interval, p-value, and interpretation. The predictors listed are male (versus female), epigastric pains, and anxiety. The near-significant/noteable predictors section includes one row with columns for predictor, odds ratio, 95% confidence interval, and p-value. The predictor listed is fatigue plus weakness. The table provides detailed information on the odds ratios and confidence intervals for each predictor, along with their respective p-values and interpretations.
Constipation and diarrhoea as separate indicators

Table 6 Long description
A table comparing significant and near-significant predictors of depression. The table is divided into two sections: significant predictors and near-significant predictors. The significant predictors section includes predictors with a p-value less than 0.05, and the near-significant predictors section includes predictors with a p-value approximately between 0.05 and 0.10. Each section lists the predictor, odds ratio, 95% confidence interval, p-value, and interpretation. The significant predictors section has four rows and five columns. Row 1: Predictor, Male (versus female); Odds ratio, 0.54; 95% CI, 0.30-0.99; P, 0.046; Interpretation, Lower odds of depression among males. Row 2: Predictor, Epigastric pains; Odds ratio, 2.31; 95% CI, 1.18-4.53; P, 0.015; Interpretation, Higher odds of depression in patients with epigastric pains. Row 3: Predictor, Anxiety; Odds ratio, 5.87; 95% CI, 3.49-9.86; P, 0; Interpretation, Higher odds of depression in patients with anxiety. The near-significant predictors section has two rows and four columns. Row 1: Predictor, Constipation; Odds ratio, 9.068; 95% CI, 0.963-85.385; P, 0.054. Row 2: Predictor, Fatigue + weakness; Odds ratio, 2.27; 95% CI, 0.93-5.58; P, 0.074.
Consistency and differences across models
Male gender is consistently protective (≈64% lower odds) across specifications. Anxiety is a strong positive signal in both models, although confidence intervals are exceptionally wide, suggesting either sparse data or model instability. Epigastric pain is also a strong positive predictor in both models, with slightly stronger odds when diarrhoea and constipation are included in the gastrointestinal variable. When constipation and diarrhoea are modelled separately (Table 6), constipation emerges as marginal (odds ratio 9.07, p = 0.054), whereas diarrhoea remains null. Fatigue and weakness is borderline significant in both models (Tables 5 and 6).
Discussion
In this cohort, 63% of patients met the criteria for moderate-to-severe depression, a prevalence consistent with prior reports from Pakistan and comparable low- and middle-income settings. Reference Khan, Akhtar, Ijaz and Waqas21 Women constituted 60% of the sample, reflecting known healthcare-seeking patterns among urban women in the Indo-Pak subcontinent. Reference Maitra, Brault and Schensul22 Depression was more prevalent among women than men, and quantitative modelling demonstrated male gender to be protective against depression severity. This gender distribution aligns with regional epidemiologic studies reporting higher rates of depression among women, probably driven by a combination of social, economic and cultural stressors. Reference Abdullah, Shaikh and Sattar23
Somatic dominance in clinical presentation
One striking and consistent finding was the near-complete absence of canonical psychological symptoms of depression in patients’ presenting concerns – such as low mood, anhedonia or cognitive complaints. Rather, depressive severity was overwhelmingly associated with physical symptoms. This reinforces the notion that, in this population, depression is primarily expressed and communicated through somatic idioms rather than via psychological language.
Among all symptoms, epigastric pain emerged as the most consistent and prominent correlate of depression across severity levels. Prior studies have demonstrated an association between depression and upper gastrointestinal symptoms, including epigastric discomfort, Reference Jamil, Sarwar and Hussain24 supporting the interpretation that epigastric pain may function as a culturally salient marker of psychological distress. In this context, its recurrence across moderate-to-severe depression suggests that it may represent a dominant idiom of distress rather than coincidental comorbidity.
Constipation was the second most notable gastrointestinal symptom. Emerging literature suggests that constipation may act not only as a comorbid condition but also as an independent risk factor or prodromal feature of depression, possibly mediated through gut–brain axis dysregulation. Reference Wang, Shen, Wang and Jia25,Reference Yun, Wang and Chen26 These findings underscore the importance of bidirectional screening: clinicians should assess mood symptoms in patients presenting with constipation, while also proactively evaluating bowel habits and medication use in patients diagnosed with depression.
Pain, fever and myalgias as markers of severity
Although bodily aches and myalgias were common across the cohort, their clinical significance varied by severity. In severe depression, bodily aches frequently occurred in the absence of fever, suggesting a direct association with depressive pathology rather than intercurrent infection. By contrast, patients with moderate and moderately severe depression often presented with fever alongside myalgia, probably prompting medical evaluation during which depression was subsequently identified through screening.
Exploratory overlap analyses indicated that bodily aches and myalgias maintained an independent association with depression, rather than representing secondary manifestations of febrile illness. Figure 8 reflects this distinction, which is clinically important because pain syndromes without objective inflammatory findings may serve as indicators of more advanced depressive illness in medical settings. Reference Garcia-Cebrian, Gandhi, Demyttenaere and Peveler27
Overlap analyses of bodily aches and fever.

Progression of somatic burden with increasing severity
Symptom patterns showed a graded progression with increasing depression severity. Moderate depression was characterised by a limited cluster of somatic symptoms – epigastric pain, myalgia, fever, shortness of breath and weakness – suggesting that early depressive states present primarily as diffuse bodily and autonomic discomfort. With moderately severe depression, the somatic profile expanded to include headaches, abdominal pain and constipation, indicating increasing physiological burden. Severe depression was associated with a further accumulation of symptoms, most notably epigastric pain, weakness, headache, constipation and back pain, consistent with cumulative somatic load and neurovegetative dysregulation.
Although affective symptoms such as anhedonia, crying spells and suicidal ideation became more evident in severe depression, physical complaints remained predominant across all severity levels, underscoring the centrality of somatisation even in advanced illness.
Cultural context and somatisation
This pattern is consistent with prior studies from Pakistan and neighbouring regions, where psychological distress is often expressed through somatic symptoms. Cultural norms, stigma and limited mental health literacy probably contribute to this presentation, and the persistent prominence of epigastric pain may reflect a culturally mediated idiom of distress rather than a disorder-specific symptom.
Methodological contribution
Methodologically, this study employed a mixed-methods approach integrating NLP-based feature extraction with qualitative visualisation (word clouds and heatmaps) and quantitative modelling. Similar triangulated approaches have been used in prior work to contextualise symptom expression and semantic patterns in mental health research. Reference Chen, Ngai, Cheng and Hu28 This design allowed us to quantify symptom patterns while preserving interpretive insight into how depression is expressed and documented in routine clinical encounters.
Limitations
Our study has several limitations. Although data were drawn from a large tertiary care hospital, the quality of clinical documentation was variable. PHQ-9 scores were missing for a subset of patient encounters and were thus predicted using predefined symptom mappings, which may have introduced measurement bias. Incomplete demographic or prescription data led to exclusion of some patient visits. The sample was gender-imbalanced, with a higher proportion of women, potentially limiting generalisability to male patients. Our study was conducted in a busy public hospital medical clinic in Pakistan, where attendance at healthcare services can itself be a source of distress. In this context, mild depressive symptoms (PHQ-9 scores of 5–9), which are both highly prevalent and more difficult to distinguish from background distress (i.e. a lower signal-to-noise ratio), were excluded. Additionally, the relatively small number of patients with severe depression reduced statistical power for comparisons across severity strata. Finally, our study focused on anxiety as a driver for depression and did not explore its clinical presentation independently. Among our study patients, 49% had moderate or severe anxiety (28 and 24%, respectively) and 17% did not have a GAD-7 score. We suggest that the wide confidence interval associated with anxiety warrants further focused study of anxiety in our population.
Implications and future directions
Future research should aim to incorporate the full spectrum of depressive symptom severity, with more balanced samples of the extremes of the spectrum (i.e. mild and severe PHQ-9 scores, respectively). The inclusion of these cases in larger data-sets would allow for more nuanced stratification. Additionally, although moderate depression was not excluded in this study, grouping of moderate and severe categories in certain analyses due to the relatively small number of severe cases may have obscured important clinical distinctions; future studies with larger sample sizes should examine these categories separately. Another important methodological consideration is the handling of repeated measures. Due to limitations in patient identification, repeated visits by the same individuals may have been treated as independent observations. Future work should adopt longitudinal or clustered analytical approaches to account for within-patient correlation. Encouragingly, as a part of our work, there has been successful implementation of unified hospital management systems across tertiary care hospitals in Punjab, which now enables reliable patient-tracking across visits, making such analyses feasible. Finally, larger, multicentre studies conducted in both tertiary and primary care general medical settings would provide more representative data and allow for a more granular understanding of how depression manifests in the Pakistani population.
Pakistan has approximately 0.19 psychiatrists per 100 000 population, far below World Health Organization recommendations. 29 Given this constraint, most uncomplicated depression must be managed in primary care settings. Our findings suggest that routine depression screening should be implemented for patients presenting with unexplained somatic complaints – particularly gastrointestinal symptoms and pain syndromes – in general medical clinics. Validated, culturally adapted Urdu versions of PHQ-9 are available and should be incorporated into routine care. Reference Ahmad, Hussain, Akhtar and Shah30
With smartphone penetration exceeding 50–60% of the population, digital screening represents a feasible and scalable strategy. 31 Integration of PHQ-9 delivery at clinic check-in – potentially linked to national identity registration – could facilitate early detection. Strengthening such systems will require training primary-care clinicians in recognising and managing depression, an approach previously shown to improve outcomes in low-resource settings. Ultimately, culturally informed, mind–body-oriented models of care are essential to address the substantial burden of depression in Pakistan.
Acknowledgments
We thank Sarah Ahmad, FAST National University Lahore, for her assistance with data analysis; undergraduate students at Lahore University of Management Sciences for their support with data collection; and the Head of the Department of Medicine at Services Hospital Lahore, Dr Arif Nadeem, for facilitating access to the clinical setting and enabling the conduct of this study. We also acknowledge the use of artificial intelligence-based tools for assistance with manuscript formatting and summarisation of the literature.
Author contributions
S.I.: study design, formulation of research questions, manuscript writing. A.A.: data analysis, manuscript writing. C.M.C.: data analysis, data synthesis. S.Q.: study execution, manuscript writing. Z.M.: data collection, data extraction, literature search. M.E.P.: data collection, data extraction, literature search. B.A.: supervision of data collection, formulation of research questions, manuscript writing.
Funding
This research received no specific grant from any funding agency, commercial or not-for-profit sectors.
Declaration of interest
None.





 Open access


eLetters
No eLetters have been published for this article.