Implications
Data from 113 Dutch organic herds were analysed to determine the effect of cross-breeding on milk production, udder health and fertility. Cross-breeding Holstein cows with other breeds decreased milk production, but improved fertility and udder health. Farm characteristics like soil type or housing system showed significant effects on the analysed traits as well. The effect of Holstein on milk was twice as large in cubicle housing as in other housing systems. Jersey showed negative effect on fertility on sandy soils. Hence, breed effects differ across farming systems, which can help farmers to choose the right cow type for their farms.
Introduction
Organic farming in Europe has developed into a small (about 3% of total agricultural area) but important factor in agricultural production. In the Netherlands, organic dairy farming grew rapidly in the late 1990s. Farms converting to organic production implemented major changes in their farm management according to European Union regulations. The most important changes are: no use of chemical fertilizers, restricted use of concentrates and limited (not preventive) use of antibiotics. Because of the organic regulations, feed has a lower energy content and overall cows have a lower energy intake also due to less concentrates in the ration, which is expected to affect especially the high-producing cows (Padel, Reference Padel2000), usually Holstein–Friesians (HF). This was the predominant breed of the cows on most organic dairy farms in the Netherlands 10 years ago (Nauta et al., Reference Nauta, Veerkamp, Brascamp and Bovenhuis2006); but the importance of other breeds is growing (Smolders et al., Reference Smolders, Van der Werf, Van de Mortel and Kijlstra2005). Because of health problems with high yielding dairy breeds in the first years following conversion, farmers started crossing with more robust breeds (Freyer et al., Reference Freyer, König, Fischer, Bergfeld and Cassell2008). However, this happened without a clear insight on the effects of cross-breeding in an organic system or on a particular farm type (Nauta et al., Reference Nauta, Baars, Saatkamp, Weenink and Roep2009). Farmers were searching for the type of cows that fitted best to their farm conditions and many have chosen to breed with different breeds for better robustness and vigour, also from heterosis. It is known that the environment of the animal also affects the expressed heterosis, however, contrasting results have been published. A few studies have shown that the expressed heterosis is larger in suboptimal environments for high milk production, than in a supportive environment (Barlow, Reference Barlow1981; Penasa et al., Reference Penasa, Lopez-Villalobos, Evans, Cromie, Dal Zotto and Cassandro2010). However, other studies have shown that heterosis was largest in the intermediate environments, when construction of environmental groups was based on herd production level (Bryant et al., Reference Bryant, López-Villalobos, Pryce, Holmes, Johnson and Garrick2007; Kargo et al., Reference Kargo, Madsen and Norberg2012).
Organic farming is diverse in its nature. Farms are more dependent on their own resources due to lower inputs, that is, soil type, which highly differs between different regions in the Netherlands. Farmers also have introduced deep litter barns to meet animal's welfare and to produce better manure. This results in a large variation in management. Such aspects are connected with other aspects of the farm (e.g. type of ration, mineral supply, risks of infection, stress factors) and might influence the performance of cows. The question rises how different breeds and cross-breds do perform in the different circumstances (Kargo et al., Reference Kargo, Madsen and Norberg2012; Vance et al., Reference Vance, Ferris, Eilliott, McGettrick and Kilpatrick2012).
The aim of this study was to estimate the effects of cross-breeding of seven prominent breeds with HF cows for milk production, udder health and fertility and to investigate whether these effects differ in organic management systems, differentiated by soil type and housing systems. The hypothesis is that more robust breeds perform better and heterosis does strengthen the cows for udder health and fertility in organic environments. Robust breeds refer to breeds with a high (udder) health and fertility status and that are capable of taking care of themselves (Sorensen et al., Reference Sorensen, Norberg, Pedersen and Christensen2008).
Material and methods
Data
In February 2007, all 325 organic dairy farmers in the Netherlands were asked to give permission to use their animal data for data analyses. Hundred and 35 farmers responded (41.5%); 119 permitted usage of data for research and 16 reported that they ceased dairy farming or did not want to make their data available. Eight farms did not participate in regular milk recording and were skipped for that reason. Five farmers had not responded to the first request, but made their data available after taking part in a network group that stimulates discussions among farmers in the Netherlands. Therefore, in total data was available from 116 organic dairy farms (35.7%). Ideally, we would have liked to have more data available for the analyses, but this is still a large proportion of all Dutch organic farms and therefore assumed to be representative for the whole population.
All animal data from these 116 organic dairy farms between January 2003 and February 2009 were available from the national database. Milk recording data were collected from different organisations for the same period. Farm data originate from a questionnaire filled in by the farmers while permitting the use of data, and included herd number, soil type and region in the Netherlands. In total, data from 34 496 lactations from 15 396 cows were available. Three types of data were collected: animal data, milk recording data and farm data. Animal data included identification number, date of birth, breed composition, sire, dam, date of arrival on the farm and date of leaving the farm. Milk recording data included calving date, lactation number, 305-day milk yield, 305-day fat, 305-day protein (all in kg) and somatic cell count (SCC).
The number of unique cows per farm between 2003 and 2009 ranged from 17 to 700. Primiparous cows represented 28.3% of lactations, 23.2% were second lactations. In general, organic ration in the Netherlands consisted of fresh grass and some concentrates in the grazing period (April to October) and of wilted grass silage and concentrates during winter. In sandy areas (50 farms = 44%), it was common to supplement the ration with maize silage in autumn and winter. Most cows were housed in cubicle housing, but 14% of the farms had deep litter barns and 7% of the (smaller) farms used a stanchion barn system. Most cows were milked twice daily, but 9% of the farms used an automatic milking system in the latter part of the data collection period and had then a milking frequency between one and four times a day. One farm milked only once a day in the grazing period. At 19 farms (17%), the replacement calves suckled the dam for a period varying between 2 weeks and 3 months in the dairy herd or suckled foster mothers separated from the herd.
Breed compositions of the cows were divided into eight parts of 12.5% each. In total 24 different breeds were present, but Brown Swiss (BS), Dutch Friesian (DF), Fleckvieh (FLV), Groningen White Headed (GWH), HF, Jersey (JER), Montbéliarde (MON) and Meuse Rhine Yssel (MRY) cattle were presented most. The following breeds can be classified as dual-purpose breeds: BS, FLV, GWH, MRY and the other breeds (DF, HF, JER, MON) can be classified as dairy breeds (http://www.thedairysite.com/breeds/dairy/). In all breeds, a large spread of crosses was present (e.g. pure-bred parents (P1 and P2), first crosses of pure-bred parents (F1) and reverse crosses of F1 with either P1 or P2, referred to as R1 and R2, respectively). Most optimal would have been to set up a designed experiment that included all crosses and also the reciprocal crosses. Unfortunately, this was practically not achievable and we therefore analysed data collected on farms. However, we assured that information on a sufficient number of pure-bred cows of each breed was available, and that different breeds were present on each farm.
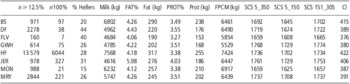
Number of animals carrying at least 12.5% genes of one of the eight analysed breeds (no. ⩾12.5%), number of pure-bred cows (no. 100%), percentage of heifers and average milk production traits (i.e. 305 days/kg milk production, 305 day percentage of fat, 305 day/kg fat production, 305 day percentage of protein, 305 day/kg protein, 305 days/kg FPCM) and functional traits (SCS of cell counts averaged between 5 and 350 days (SCS5_350), between 5 and 150 days (SCS5_150) and between 151 and 305 days (SCS151_305) and CI, in days) for eight pure-bred (100%) breeds on organic farms

FPCM = fat-protein corrected milk; SCS = somatic cell score; CI = calving interval; BS = Brown Swiss; DF = Dutch Friesian; FLV = Fleckvieh; GWH = Groningen White Headed; HF = Holstein Friesian; JER = Jersey; MON = Montbéliarde; MRY = Meuse Rhine Yssel.
HF was the most prominent breed, with 67.8% of the Holstein cows carrying at least 50% of Holstein genes. HF was the predominant breed on 57 farms, and MRY, JER, DF and GWH were the main breeds at two, three, one and two farms, respectively. BS, MON and FLV were mainly part of cross-breds.
Farms were divided in groups based on their farming system: (a) soil type of a farm (sand or no sand) and (b) the housing system of a farm (cubicle barn or not). In the data, 50 out of 113 farms farmed on sand, with in total 13 203 lactations. The soil type of the other 63 farms was anything other than sand, like peat, clay or loess. With regard to the housing system, 84 farms had cubicle barns, corresponding with 26 341 lactations. Differentiating only between cubicle and non-cubicle barns also implicated that the stanchion barns and deep litter barns were in the same group. This is not ideal as there are important differences between these two housing systems, but due to the size of the data set it was not possible to divide the data into more soil types and/or housing systems.
Data editing
Farms were organic at the beginning of the data collection period and produced on average 10.6 years under organic certification at the end of the period. Twelve per cent of the farms are certified Demeter (bio-dynamic farms with more strict regulations, www.demeter.com). Data were edited by selecting all cows with a calving date in this collection period (January 2003 to February 2009), with at least one lactation of a minimum length of 200 days. Mainly due to natural service by own farm bulls, part of the breed composition is unknown, but this was minimised by selecting animals with at least 87.5% of the breed composition to be known. This reduced the data set to 15 015 cows with 33 788 lactations from 113 farms, ranging from 7 to 611 unique cow IDs per farm during the whole collection period.
Production traits were based on accounted 305-day production per lactation: kg milk yield (KGMILK), kg fat (KGFAT), percentage of fat (%FAT), kg protein (KGPROT), percentage of protein (%PROT) and fat and protein-corrected milk yield (FPCM) defined as (Tyrell and Reid, Reference Tyrell and Reid1965):
 $$ {\rm{(0}}{\rm{.337}}\:{\rm{ + }}\:{\rm{0}}{\rm{.116}}\:\times \:{\rm{\% FAT}}\:{\rm{ + }}\:{\rm{0}}{\rm{.06}}\:\times \:{\rm{\% PROT)}}\:\times \:{\rm{KGMILK}} $$
Functional traits captured both udder health (SCC) and fertility (calving interval (CI) in days). SCCs were log transformed to somatic cell scores (SCS) to normalise the data. The same formulae for SCS was used as is used for the Dutch national data (NRS, 2011); that is, SCS = 1000 + (100 × (2 log(SCC)/1000)). These test-day SCS were then averaged for the whole lactation, 5 up to 350 days in lactation (SCS5_350) and separately averaged over the periods from 5 to 150 days (SCS5_150) and from 151 to 305 days in lactation (SCS151_305).
Statistical analyses
Heterosis and recombination effects were calculated for every individual cow based on the breed composition of the parents of this cow, and each breed contributed equally to the heterosis and recombination percentage. The degree of heterosis for a specific breed combination expressed in an animal is equal to the chance that the F1-animal, at a specific locus, has one allele from the involved breeds at each locus. This can also be called the breed heterozygosity (Sorensen et al., Reference Sorensen, Norberg, Pedersen and Christensen2008). Because of the structure of the data, with presence of different breeds on each farm, the chosen formula for heterosis could be
 $$ het\: = \:\mathop{\sum}\limits_{i\: = \:1} {\mathop{\sum}\limits_{j\: = \:1} {{{b}_{si}}\:\times } } \:{{b}_{dj}},\; \; i\: \ne \:j $$
where het = heterosis effect in the individual, bsi is the breed fraction of breed i of the sire (s), and bdj is the breed fraction of breed j of the dam (d), under the condition that i is not equal to j.
The formula for recombination is
 $$ rec\: = \:\mathop{\sum}\limits_{j\:{\rm{ = }}\:1} {{{b}_{si}}} \:\times \:{{b}_{sj}}\: + \:\mathop{\sum}\limits_{j\:{\rm{ = }}\:1} {{{b}_{di}}} \:\times \:{{b}_{dj}},\; \; i\: \ne \:j $$
where rec = recombination effect in the individual, bsi is the breed fraction of breed i of the sire (s), bsj is the breed fraction of breed j of the sire (s), bdi is the breed fraction of breed i of the dam (d) and bdj is the breed fraction of breed j of the dam (d), under the condition that i is not equal to j.
The data with all breeds and their crosses were analysed using ASREML (Gilmour et al., Reference Gilmour, Gogel, Cullis and Thompson2009), including a regression on all breed fractions and the expected heterosis and recombination effects, depending on, for example, whether it was a pure-bred, reverse cross or F1-animal that had a phenotype as described above. All these effects together lead to the following statistical model that was fitted to the complete data set and all traits (both milk production traits and functional traits):
 $${ Y\:{\rm{\sim }}\:\mu \:{\rm{ + }}\:{\rm{fixed}}\,{\rm{effects}}\:{\rm{ + }}\Sigma \:{{b}_i}\:\times \:{\rm{bree}}{{{\rm{d}}}_{\rm{i}}}\:{\rm{ + }}\:{{b}_2}\:\times \:{\rm{heterosis}}\:\cr\quad{\rm{ + }}\:{{b}_{\rm{3}}}\:\times \:{\rm{recombination}}\:{\rm{ + }}\:{\rm{herd}}\:{\rm{ + }}\:{\rm{animal}}\:{\rm{ + }}\:{\rm{error}} $$
In this model, Y = observation on the performance of a production or functional trait on a cow and μ = overall mean. Fixed effects included parity (with four classes, where the last class contains all parities ⩾4), year (with 7 classes), season (based on four seasons: January to March, April to June, July to September and October to December). Linear regressions were included for the breed proportions (bi, with i ranging from 1 to 24), for heterosis (b 2) and for recombination (b 3). A random effect was included for herd, animal, to account for multiple parities of a cow in the data set, and for the residual (error) term.
The interactions with management systems, based on soil types and housing systems, were fitted by including an interaction for these management factors (man.) with all regression coefficients in the model. Herd was still included as a random effect as well, to be able to capture the herd variance that was not captured by the soil type and housing system:
 $${ Y\:{\rm{\sim }}\:\mu \:{\rm{ + }}\:{\rm{fixed}}\,{\rm{effects}}\:{\rm{ + }}\:\Sigma \:{{b}_{{\rm{man}}{\rm{.,}}i}}\,\times \,{\rm{bree}}{{{\rm{d}}}_i}\:{\rm{ + }}\:{{b}_{{\rm{man}}{\rm{.,2}}}}\cr\quad\times \,{\rm{heterosis}}\:{\rm{ + }}\:{{b}_{{\rm{man}}{\rm{.,3}}}}\,\times \,{\rm{recombination}}\:{\rm{ + }}\:{\rm{herd}} \cr \quad{\rm{ + }}\:{\rm{animal}}\:{\rm{ + }}\:{\rm{error}} $$
Finally, the first model parameters were used to predict least square means for (1) animals of the seven most prominent breeds, (2) crosses of pure-bred parents with pure-bred HF (resulting in F1-offspring) and (3) crosses of pure-bred parents with an F1-offspring (reverse cross, R1 or R2). The second model was used to predict the performance of these crosses in the different management systems.
Results
Descriptive analysis
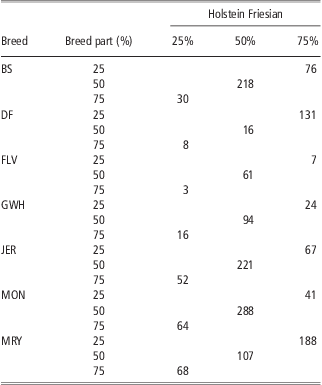
Cows of eight different breeds were present in the data set of which the breeds HF, MRY and DF were mostly represented, with 60.0%, 12.6% and 10.1% of all animals carrying the particular breed for at least 12.5%, respectively (Table 1). Aside from the pure-breds (45%), a fair number of cross-breds (55%) were included in the database (Table 2). For example, there was data available on 6044 pure-bred HF cows (with 100% HF genes) and 7535 cross-bred HF cows (with 12.5% to 87.5% HF genes).
Number of first crosses of pure-bred parents (F1, carrying 50% of both breeds), and number of reverse crosses of F1 with either pure-bred parent 1 or 2 (carrying 25% or 75% of a breed) of HF with seven breeds (BS, DF, FLV, GWH, JER, MON and MRY)
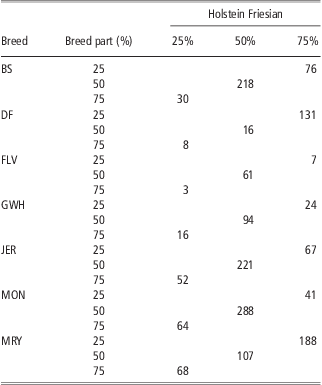
BS = Brown Swiss; DF = Dutch Friesian; FLV = Fleckvieh; GWH = Groningen White Headed; HF = Holstein Friesian; JER = Jersey; MON = Montbéliarde; MRY = Meuse Rhine Yssel.
Raw average milk production was 6858 kg in 305 days, and 294 kg fat (4.33%) and 235 kg protein (3.44%). The average of SCS5_350 is 1730, of SCS5_150 is 1694 and of SCS151_305 is 1728. CI was on average 411 days (Table 1).
Table 1 also shows the average raw milk production and milk contents for the eight most present pure-bred breeds (including HF). It is shown that BS and MON are second and third highest producers after HF. The percentage of heifers in the populations is high for DF and low for MON.
Milk production traits
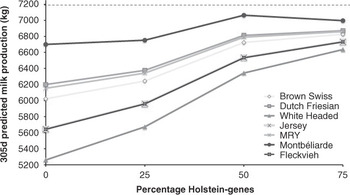
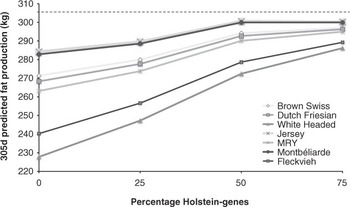
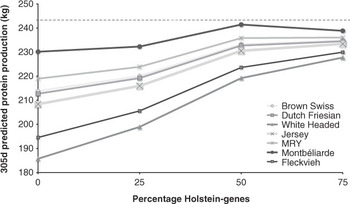
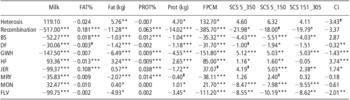
Predicted milk production, while correcting for effects of parity, herd and the interaction between year and season of calving, was highest for cows that carried 100% HF genes and lowest for cows that carried 100% GWH genes (Figure 1). The higher the proportion of Holstein genes, the higher the predicted milk production, as expected. Pure-bred Jerseys showed high-predicted milk contents (i.e. kg of fat and protein), and pure-bred HF cows showed low-predicted milk contents (Figures 2 and 3). The regression coefficients for fat percentage and protein percentage in Table 3 confirmed these results, showing positive regression coefficients for the milk contents for Jerseys, and negative regression coefficients for HF.
Predicted 305-day milk production (kg) for pure-bred parents, F1-crosses and reverse crosses of Brown Swiss, Dutch Friesian, (Groningen) White Headed, Jersey, Meuse Rhine Yssel (MRY), Montbéliarde and Fleckvieh with Holstein–Friesian, presented per percentage of Holstein genes. The dashed line indicates the predicted 305-day milk production of pure-bred Holstein–Friesian cows (7187 kg).

Predicted 305-day fat production (kg) for pure-bred parents, F1-crosses and reverse crosses of Brown Swiss, Dutch Friesian, (Groningen) White Headed, Jersey, Meuse Rhine Yssel (MRY), Montbéliarde and Fleckvieh with Holstein–Friesian, presented per percentage of Holstein genes. The dashed line indicates the predicted 305-day fat production of pure-bred Holstein–Friesian cows (305 kg).

Predicted 305-day protein production (kg) for pure-bred parents, F1-crosses and reverse crosses of Brown Swiss, Dutch Friesian, (Groningen) White Headed, Jersey, Meuse Rhine Yssel (MRY), Montbéliarde and Fleckvieh with Holstein–Friesian, presented per percentage of Holstein genes. The dashed line indicates the predicted 305-day protein production of pure-bred Holstein–Friesian cows (243 kg).

Regression coefficients of breed effects, heterosis and recombination effects on all milk production traits (305-day milk production, 305-day percentage of fat, 305-day kg fat production, 305-day percentage of protein, 305-day kg protein, 305-day FPCM) and functional traits (SCS of cell counts averaged between 5 and 350 days (SCS5_350), between 5 and 150 days (SCS5_150), and between 151 and 305 days (SCS151_305) and CI, in days)

FPCM = fat-protein corrected milk; SCS = somatic cell score; CI = calving interval; BS = Brown Swiss; DF = Dutch Friesian; GWH = Groningen White Headed; HF = Holstein Friesian; JER = Jersey; MRY = Meuse Rhine Yssel; MON = Montbéliarde; FLV = Fleckvieh.
***P-value < 0.001; **P-value < 0.01; *P-value < 0.05; ‡P-value < 0.10.
Heterosis had a significant effect (P < 0.05) on both the milk contents (kg fat and protein) and on FPCM in a favourable direction (i.e. more kg of fat, protein and FPCM produced; Table 3). The effect of recombination was unfavourable for all milk production traits (in kg) (P < 0.01). Regression coefficients differed per breed, that is, only the positive regression coefficients for milk were for HF and MON cows. This is also because the regression coefficients are expressed according to the mean in the data set, which is largely affected by HF. When milk was corrected for fat and protein content, Jerseys gave a positive regression as well.
Functional traits
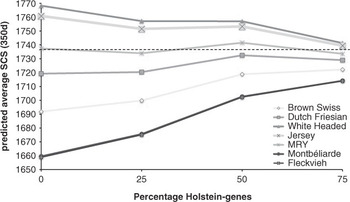
Predicted lactational average SCS (SCS3_350), while correcting for effects of parity, herd and the interaction between year and season of calving, was highest for cows that carried 100% GWH-genes and lowest for cows that carried 100% FLV or MON genes (Figure 4). This was also the case when cell scores were averaged over early (SCS5_150) or late (SCS151_305) lactation. In other words, the same trends were shown for all three udder health traits, that is, there is not a different direction of the regression when SCS in early lactation (SCS5_150) is compared with SCS in late lactation (SCS151_305), or to SCS over the first 350 days of lactation (SCS5_350). The effect of the proportion of Holstein genes differed per breed; in some breeds the SCS increased, whereas in other breeds it decreased. This is also confirmed by the regression coefficients for the cell count traits (SCS5_350, SCS5_150, SCS151_305) in Table 3. FLV and MON had the highest negative regression coefficients for the cell count traits, and GWH had most positive regression coefficients.
Predicted lactational average somatic cell score (d5-350) for pure-bred parents, F1-crosses and reverse crosses of Brown Swiss, Dutch Friesian, (Groningen) White Headed, Jersey, Meuse Rhine Yssel (MRY), Montbéliarde and Fleckvieh with Holstein–Friesian, presented per percentage of Holstein genes. The dashed line indicates the predicted lactational average somatic cell score of pure-bred Holstein–Friesian cows (1736).

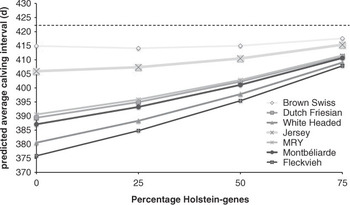
Predicted CI was highest for cows that carried 100% HF genes (422 days), and lowest for cows that carried 100% FLV genes (376 days; Figure 5). This is also confirmed by the regression coefficients for CI in Table 3. HF had the highest positive regression coefficient for CI and FLV the most negative regression coefficient. Regression coefficients for fertility (CI) were favourable for GWH and FLV and unfavourable for HF and BS.
Predicted calving interval for pure-bred parents, F1-crosses and reverse crosses of Brown Swiss, Dutch Friesian, (Groningen) White Headed, Jersey, Meuse Rhine Yssel (MRY), Montbéliarde and Fleckvieh with Holstein–Friesian, presented per percentage of Holstein genes. The dashed line indicates the predicted calving interval of pure-bred Holstein–Friesian cows (422 days).

Heterosis showed a trend (P < 0.10) on CI in a favourable direction (i.e. shorter CI), but affected all three udder health traits unfavourably (higher cell count). However, this effect was not significant (Table 3). Recombination was favourable for all fertility and udder health traits.
Farm systems
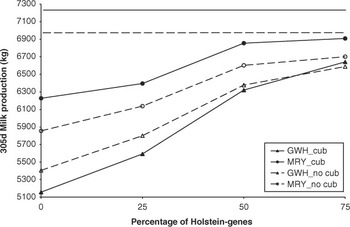
For HF cows, the predicted milk production and milk contents were higher on farms with cubicle housing systems than on farms with non-cubicle housing systems (7250 and 6980 kg, respectively). The effect of the housing system at the farm on the predicted milk production differed per breed. For most breeds (e.g. MRY in Figure 6), there was not much difference in the effect of decreasing percentage of HF genes on the milk production when cows kept in cubicle housings were compared with cows not kept in cubicle housings. However, for GWH cows a lower milk production was observed for cows kept in cubicle housings than for cows kept in non-cubicle housings (Figure 6). Similar effects were observed for the milk contents and for FPCM (results not shown).
Predicted milk production for pure-bred parents, F1-crosses and reverse crosses of Groningen White Headed (GWH) and Meuse Rhine Yssel (MRY) with Holstein–Friesian, presented per percentage of Holstein genes, separated out for the housing system of the farm (cubicles (cub) v. no cubicles (no_cub)). The solid line indicates the predicted milk production of pure-bred Holstein–Friesian cows on farms with cubicles (7255 kg), and the dashed line indicates the predicted milk production of pure-bred Holstein–Friesian cows on farms with no cubicles (6982 kg).

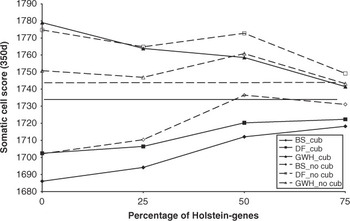
For HF cows, the lactational average cell score (SCS5_350) was lower in cubicle barns than in non-cubicle barns (1734 and 1743, respectively), and this was the case for most breeds (e.g. BS in Figure 7). However, for GWH cows SCS5_350 in cubicle barns was higher. For DF cows, a decrease in SCS3_350 was shown with decreasing HF genes in cubicle barns, whereas an increase was shown in non-cubicle barns (Figure 7).
Predicted lactational average somatic cell score (d5-350) for pure-bred parents, F1-crosses and reverse crosses of Brown Swiss (BS), Dutch Friesian (DF), and Groningen White Headed (GWH) with Holstein–Friesian, presented per percentage of Holstein genes, separated out for the housing system of the farm (cubicles (cub) v. no cubicles (no_cub)). The solid line indicates the predicted lactational average somatic cell score of pure-bred Holstein–Friesian cows on farms with cubicles (1734), and the dashed line indicates the predicted lactational average somatic cell score of pure-bred Holstein–Friesian cows on farms with no cubicles (1743).

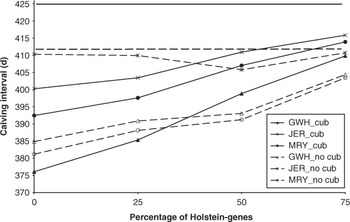
CI was longer in cubicle barns than in non-cubicle barns for HF cows (425 and 412 days, respectively). MRY cows showed similar trends, but GHW and JER cows have a shorter CI in cubicle housings than in non-cubicle housings (Figure 8).
Predicted calving interval (in days) for pure-bred parents, F1-crosses and reverse crosses of Groningen White Headed (GWH), Jersey (JER), and Meuse Rhine Yssel (MRY) with Holstein–Friesian, presented per percentage of Holstein genes, separated out for the housing system of the farm (cubicles (cub) v. no cubicles (no_cub)). The solid line indicates the predicted calving interval of pure-bred Holstein–Friesian cows on farms with cubicles (425 days), and the dashed line indicates the predicted calving interval of pure-bred Holstein–Friesian cows on farms with no cubicles (412 days).

The effect of the soil type on the predicted production traits was not as pronounced for HF cows. Differences between farms on sand and non-sand were small for milk production (7210 and 7160 kg, respectively), SCS5_350 (1737 and 1736, respectively) and CI (419 and 423 days, respectively). Effects of the different breeds were all in the same direction, with decreasing milk production with decreasing percentages of HF genes for all breeds on both soil types (results not shown). Fertility improved (i.e. shorter CI) with decreasing percentages of HF genes for all breeds on both soil types.
Discussion
The aim of this study was to give more insight in the performance of different breeds and cross-breds at different types of Dutch organic farms and to test the hypothesis that more robust breeds and heterosis are needed for a better performance of production, fertility and health in organic environments. A decrease in additive genetic merit for functional traits, particularly fertility and udder health, within the Holstein population did not only concern organic farmers but sparked global interest in cross-breeding dairy cattle (Hansen, Reference Hansen2006). Many studies on the effect of cross-breeding on conventional farms have been performed. However, so far, it was unknown whether the effect of cross-breeding was comparable or different on organic and conventional farms and our study has given some insight on the effects of cross-breeding in an organic system. Reasons why there could be differences are, first, because parity seems to have an influence on the expression of heterosis (Touchberry, Reference Touchberry1992). The average age of cows on organic farms is generally slightly higher (Valle et al., Reference Valle, Lien, Flaten, Koesling and Ebbesvik2007); that is, in the Netherlands 6 months older than conventional cows (Smolders et al., Reference Smolders, Van der Werf, Van de Mortel and Kijlstra2005), and therefore the effect of parity might be different on organic farms than on conventional farms. Second, the effect of heterosis is generally higher in a stressful environment compared with a supportive environment (Barlow, Reference Barlow1981). One stress component at organic farms is restricted energy intake. Although the cows produce milk in relation to their feed intake, also in organic production, the restricted energy intake can still be considered as a stressor in organic production. The HF cattle have a high genetic potential of milk production, and when energy intake is low they will first try to compensate that with their own body reserves. This creates the risk of negative energy balance and associated consequences for fertility and (udder) health (Butler and Smith, Reference Butler and Smith1989; Jorritsma et al., Reference Jorritsma, Wensing, Kruip, Vos and Noordhuizen2003). There is less flexibility to balance organic diets and high herd performance, and antibiotics are only administered in case of severe infections. Therefore, the cows have to take care of themselves much more than on conventional farms. On the other hand, organic cows are challenged less on high production and have, for example, lower incidences of ketosis (Zom and Smolders, Reference Zom and Smolders2009). Also in European research in organic dairy herds, incidences of metabolic disease are low (Ivemeijer et al., Reference Ivemeijer, Smolders, Gratzer, Winckler, Vaarst, March, Brinkmann, Whistance, Roderick, Mejdell, Hansen, Henriksen, Nicholas, Rogerson, Leeb, Huber, Stöger and Walkenhorst2012).
Robustness in this study is defined as being insensitive to changes in environment and having few udder health problems and a stable fertility status (Sorensen et al., Reference Sorensen, Norberg, Pedersen and Christensen2008). Changes in the environment can occur through changes in the diet. On most organic farms in the Netherlands, appropriate feeding is problematic because of inclusion of low value roughage from nature grassland and the high costs of organic concentrates. These specific farm circumstances determine whether the cows on that farm are robust or not, and that is not so much determined by the breed itself. Barth et al. (Reference Barth, Aulrich, Haufe, Müller, Schaub and Schulz2011) compared a high-yielding dairy breed and a dual-purpose breed kept under the same organic conditions. Their study showed that breeds with a higher genetic merit for milk yield suffer a higher metabolic load when the feeding management in the periparturient period is suboptimal. This has subsequent consequences for fertility and (udder) health. However, when the conditions are better fulfilling the demands of the high-yielding dairy breed, these differences could not be observed. Thus, they concluded that there is no need to prefer dual-purpose breeds in organic dairy farming as long as the management is appropriate for high-yielding cows. Other (within breed) studies suggest, however, no existence of these genotype by environment interactions, that is, highly selected animals do have a more negative energy balance, but there is little evidence that these animals are indeed especially at risk during low nutrient supply (Beerda et al., Reference Beerda, Ouweltjes, Sebeck, Windig and Veerkamp2007).
Impact of data structure on cross-breeding effects
Still 1/3 of the non-cubicle barns were stanchion barns. These were mainly used on the smaller farms, so total number of cows are low in the whole data set. The expected effect of this housing system on the performance of the animals, with regard to cross-breeding, is minimal for the analysed traits. Milk production does not differ in a loose housing systems compared with stanchion housing system (Heizer et al., Reference Heizer, Smith and Zehner1953; Bolinger et al., Reference Bolinger, Albright, Morrow-Tesch, Kenyon and Cunningham1997), and no effects were shown of locking up the cows on udder health (Bolinger et al., Reference Bolinger, Albright, Morrow-Tesch, Kenyon and Cunningham1997). The cows still exhibit oestrus symptoms such as hyperemia, swelling of vulva, discharge of cervical mucus and bellowing (Takagi et al., Reference Takagi, Yamagishi, Lee, Oboshi, Tsuno and Wijayagunawardane2005), and therefore, no effect on fertility is expected either.
When using practical data instead of a designed experiment with crosses and reciprocal crosses, a few small herds have entered the data set. However, by editing the data on presence of several breeds on each farm, the impact of these small herds on the cross-breeding effects in this study will be minimal.
Milk production traits
The introduction of Holstein genes has been identified as a contributor to the decline in reproductive and udder health performance (Evans et al., Reference Evans, Dillon, Buckley, Berry, Wallace, Ducrocq and Garrick2006; Hansen, Reference Hansen2006) and many problems occurred with pure-bred HF at organic farms. Because of the high genetic potential for production of HF cattle, they had difficulties coping with organic environments, and showed an increased risk of lower (udder) health and fertility status (Hardarson, Reference Hardarson2001; Nauta et al., Reference Nauta, Groen, Veerkamp, Roep and Baars2005). The exploitation of other breeds than HF, or crosses involving HF, might provide an alternative to overcome these declined performances. Interest in cross-breeding on Dutch organic farms is particularly driven by achieving more robust cows that fit in Dutch organic circumstances resulting in limited medical treatments and better animal welfare. On the Dutch organic farms, HF cows are, based on milk and protein yields (in kg produced in 305 days), superior to all of the other breeds. HF cows are also shown to be superior for milk and protein yields on conventional farms in Ireland (Begley et al., Reference Begley, Buckley, Pierce, Fahey and Mallard2009; Penasa et al., Reference Penasa, Lopez-Villalobos, Evans, Cromie, Dal Zotto and Cassandro2010) and in United States of America (Heins et al., Reference Heins, Hansen, Seykora, Johnson, Linn, Romano and Hazel2008). When analysing the fat production (in kg or as percentage of the milk contents), Jersey cows showed highest production levels on Dutch organic farms. Similar superiority effects of the Jersey breed were shown on conventional Irish farms (Heins et al., Reference Heins, Hansen, Seykora, Johnson, Linn, Romano and Hazel2008; Prendiville et al., Reference Prendiville, Pierce and Buckley2009; Vance et al., Reference Vance, Ferris, Eilliott, McGettrick and Kilpatrick2012).
Farmers try to use the benefit of heterosis in a harsher organic environment. In our data, we found that general heterosis effects for milk yield traits were all positive (favourable) and significantly different from zero (P < 0.05). Coefficients of regression indicated that first-generation crosses with HF produced 119 kg more milk, 5.8 kg more fat and 4.7 kg more protein compared with the average of the pure-bred parents. Several studies investigated cross-breeding effects between strains of Black and White cattle populations on conventional herds. Van der Werf and de Boer (Reference Van der Werf and De Boer1989) reported heterosis of 123 kg of milk, 6.0 kg of fat and 4.4 kg of protein in first-lactation cross-bred cows (DF × HF). Similar estimates were established by Boichard et al. (Reference Boichard, Bonaiti and Barbat1993) who found heterosis of 135 kg of milk, 5.6 kg of fat and 4.3 kg of protein in French Black and White × HF cattle using records from parities 1 to 3. Akbas et al. (Reference Akbas, Brotherstone and Hill1993) also reported similar values of 104 kg of milk, 4.3 kg of fat and 2.9 kg of protein in first-lactation HF and European Friesian cross-bred cows.
Functional traits
The breed effects for CI showed a significant longer CI for HF cows, and significant shorter CI for GWH and FLV cows. The general heterosis effect on CI was negative (favourable) and approached significance (P < 0.10), with an estimate of −3.4 days, indicating that first-generation crosses have a shorter CI than the average of the parental breeds. Similar results were published on conventional farms (Penasa et al., Reference Penasa, Lopez-Villalobos, Evans, Cromie, Dal Zotto and Cassandro2010).
The breed effects for udder health showed a significantly lower cell score for BS, FLV and MON, both when considering the period between 5 and 350 days in lactation (SCS5_350) or the first or latter half of the lactation (SCS5_150 and SCS151_305, respectively). Jersey cows showed a higher cell count than HF cows, which is in line with other studies by Berry et al. (Reference Berry, Lee, MacDonald, Stafford, Matthews and Roche2007) and Sewalem et al. (Reference Sewalem, Miglior, Kistemaker and Van Doormaal2006). This confirms that, also on organic farms, the Jersey breed is not renowned for superior udder health.
General heterosis was, although not significantly different from zero, positive (unfavourable) for all cell count traits, indicating that the udder health of first-generation crosses is worse than the average of both pure-bred parents. Van Raden and Sanders (Reference Van Raden and Sanders2003) also reported a small but unfavourable heterosis for SCS using several breeds (HF, JER and Guernsey) and their crosses. Although cross-breeding often leads to increased health, it could be that the increased production yields of cross-breds also may increase the stress on the udder and could be the cause of the small net increase in SCS.
The comparison of SCS in early and late lactation is made because several studies have shown that the frequency of cases of clinical mastitis is much greater in the first part of the lactation than in the second part (Emanuelson et al., Reference Emanuelson, Danell and Philipsson1988; Barkema et al., Reference Barkema, Schukken, Lam, Beiboer, Wilmink, Benedictus and Brand1998; Smolders, Reference Smolders2001). Also in the Dutch udder health index, SCS in early and in late lactation are, nowadays, included as two different traits (Eding et al., Reference Eding, De Haas and De Jong2009). The breed effects on SCS5_150 and SCS151_305 differ; for some breeds (BS, DF and FLV) cell counts are higher in late lactation, compared with cell count in early lactation. For other breeds (HF, JER, MON and MRY), the opposite holds. This might indicate that the breeds specialised more in dairy production are more sensitive for high cell counts in early lactation (when production is at its peak level). On the other hand, the dual-purpose breeds show higher cell counts in late lactation when production is low and there is evidence that cows with low milk volume have higher cell count levels because of a thickening effect (Koldeweij et al., Reference Koldeweij, Emanuelson and Janson1999). The common pattern during lactation is an increasing SCC towards the end of lactation, due to a higher risk of infections and a thickening effect (Smolders et al., Reference Smolders, Van der Werf, Van de Mortel and Kijlstra2005).
Farm systems and breeds
The soil type of the farm largely affects the diet fed to the cows. Generally, many organic herds feed a high percentage of forage in the total diet, even during the early-lactation period, and the quantity of concentrate feeds is restricted (EU, 1999; Marley et al., Reference Marley, Weller, Neale, Main, Roderick and Keatinge2010). On farms on a sandy soil, the forage has a higher proportion of maize, which allows a higher energy intake of the dairy cows (Nauta et al., Reference Nauta, Veerkamp, Brascamp and Bovenhuis2006). On the contrary, diets on farms with non-sandy soils consist mostly out of grass silage. These differences in farm environments due to soil type did not show any effect on general heterosis effects. This might indicate that, due to heterosis, animals in general were more robust and less sensitive to the environment. However, breed effects were observed for the milk production traits for some of the breeds, indicating that in the Netherlands some breeds fit better to organic diets than others. For example, JER and BS cattle showed much larger differences in milk production between farms on sandy and non-sandy soils than DF, GWH and MRY cattle (results not shown).
The majority of organic herds are housed in either cubicle housing or straw-bedded yards (Marley et al., Reference Marley, Weller, Neale, Main, Roderick and Keatinge2010). Straw-bedded yards provide a better environment for animal's welfare but a different environment for pathogens than the bedding of cubicles (Baars and Barkema, Reference Baars and Barkema1997). For example, if straw moisture content is too high, this can result in a rapid increase in the temperature of the bedding and an increased risk of Escherichia coli and Streptococcus uberis infections (Ward et al., Reference Ward, Hughes, Faull, Cripps, Sutherland and Sutherst2002). The risk of mastitis from environmental pathogens has been found to be higher in straw-bedded yards compared with cubicle housing (Krutzinna et al., Reference Krutzinna, Boehncke and Herrmann1996; Weller and Bowling, Reference Weller and Bowling2000) and average SCC is higher in non-cubicle barns (Baars and Smolders, Reference Baars and Smolders2004). The results in the current study also showed higher SCC in non-cubicle barns than in cubicle housings for most breeds, except for GWH and MRY.
Regression coefficients show that fertility of HF is worst in cubicle barns resulting in longer CI, which might be caused by lower claw health in cubicle housings (Somers et al., Reference Somers, Frankena, Noordhuizen-Stassen and Metz2003) and because cows show their heat less on a slippery floor.
Organic v. conventional farming
On the basis of cross-breeding effects on production and functional traits, no big differences are found between better suitability of cross-bred cows on organic farms or on conventional farms. The heterosis effects in our study were close to the heterosis effects of conventional herds, and this might be an indication that organic environments are not experienced as more stressful than conventional environments. Lund and Algers (Reference Lund and Algers2003) also concluded in their literature review that ‘health and welfare in organic herds are the same or better (and thus less stressful) than in conventional herds’. This is also confirmed by several other studies (Roesch et al., Reference Roesch, Doherr, Schaeren, Schaellibau and Blum2007; Valle et al., Reference Valle, Lien, Flaten, Koesling and Ebbesvik2007; Fall and Emanuelson, Reference Fall and Emanuelson2009; Garmo et al., Reference Garmo, Waage, Sviland, Henriksen, Osteras and Reksen2010). The current study has confirmed as well that the expressed heterosis is reasonably independent of the environment of the animal. Therefore, each dairy farmer could consider the economic advantages of cross-breeding, also on organic farms (Kargo et al., Reference Kargo, Madsen and Norberg2012).
Conclusions
Cross-breeding Holstein dairy cows with other breeds (BS, DF, FLV, GWH, JER, MON or MRY) decreased milk production (also when corrected for fat and protein content (FPCM)), although a clear heterosis effect was seen in the F1-crosses (50-50%). Cross-breeding also improved fertility but udder health was only improved in some crosses, and not when crossed with GWH or JER. Farm management systems (depending on soil type or housing system) affected the regression coefficients of production and functional traits on breed components significantly for some breeds. For example, the effect of Holstein on milk and CI was twice as large in cubicle housing as in other housing systems, and DF had an unfavourable effect on SCS in cubicles, but a favourable effect in other systems. Jersey had a negative effect on fertility only on farms on sandy soil. Hence, breed and cross-breeding effects differed across farming systems within the organic systems but heterosis was generally not affected by housing system and soil type.
Acknowledgements
Financial support of the Dutch Ministry of Economic Affairs, Agriculture and Innovation is greatly appreciated. The authors thank the farmers for being very helpful when collecting the data.