

1 Introduction
An important objective of financial reporting is to provide users with information to help them predict future cash flows (FASB, 1978; IASC, 1989). For many companies, an important cash flow item is defined benefit plan contributions. Financial statement users typically use pension footnote information based on accounting standards to compute plan funding ratios and estimate future cash flows (Ciesielski, Reference Ciesielski2004). However, the primary purpose of current accounting standards for pensions is to recognize a liability and an expense when employees provide service in exchange for future benefits rather than provide information to predict future contributions (FASB, 1985, 2003; IASB, 2004). A better source of information to predict these cash flows may be the asset valuations and pension obligations reported to pension regulators for monitoring of funding. We examine whether this source provides information that improves predictions of future contributions over financial statement information.
Our results are pertinent to standard-setters as they revise pension disclosure policies. Both the Financial Accounting Standards Board (FASB) and the International Accounting Standards Board (IASB) are reviewing pension standards as part of ongoing postretirement benefits projects and overall work toward standard convergence, which may result in changes to disclosure and/or measurements. One disclosure item previously suggested, but rejected by FASB, was the inclusion of the regulatory pension obligation because of its role in determining the plan's funding status (FASB, 2003: para. A21). FASB had two objections to this request.
First, FASB was concerned that the additional disclosure would increase complexity (FASB, 2003: para. A22). This objection loses some validity if the complexity is offset by added value. For instance, a proposed amendment to the Statement of Financial Accounting Standard, FAS 132 (FASB, 2006), Employers' Disclosures about Pensions and Other Postretirement Benefits, increases complexity by requiring information on defined benefit plan assets, specifically about asset categories, concentrations of risk, and fair value measurements (FASB, 2008a). The majority of the 45 comment letters supported these additional disclosures because of their perceived value (FASB, 2008b). In addition, the retrieval of all information, regardless of the level of complexity, will be easier once eXtensible business reporting language (XBRL)Footnote 1 is implemented. The Security and Exchange Commission's requirement for XBRL reporting will allow users to focus on the information they find useful and disregard the rest (SEC, 2008).
FASB's second objection was that the obligation measure would not be useful without additional information about complicated governmental funding rules and management's intentions regarding voluntary contributions (FASB, 2003: para. A22). Although this objection may be valid, it lacks the support of empirical evidence on whether the regulatory funding status is useful for predicting future pension contributions – with or without the additional information.
Thus, this study is an investigation of whether regulatory funding information, by itself, provides superior future contribution predictions as compared to predictions based on pension footnote funding information. Our study provides evidence relevant to the issue of whether to disclose the regulatory pension obligation in the financial statements as FASB and IASB continue their reconsideration of accounting for pensions and other postretirement benefits.
Our study investigates predictions of contributions for United States (US) pension plans. Regulatory funding information for these plans is reported on Internal Revenue Service (IRS) Form 5500, whereas pension footnote information is calculated according to US generally accepted accounting principles (GAAP). We evaluate the usefulness of the Form 5500 plan obligation by comparing plan contribution predictions using Form 5500 and GAAP funding ratios (plan assets/plan obligation). We begin by comparing funding ratios. Using 3,877 firm years from 1995 through 2002, we find that the funding ratio measurements differ by at least 5% for 2,839 firm years (73% of our sample) with the Form 5500 ratio being greater for 1,976 firm years (51%) and the GAAP ratio being greater for 863 (22%). These results indicate that Form 5500 information has the potential for improving contribution prediction because the differences do not follow a consistent pattern that would allow the Form 5500 ratio to be predicted from the GAAP ratio.
We then investigate the extent of improvement in prediction. Using regressions and out-of-sample prediction tests, we find that Form 5500 funding ratios significantly improve predictions of future plan contributions. The improvements in contribution predictions, although small in dollar amount, are reasonable in percentage reduction (9–27%) of forecast error.
Our results suggest that the Form 5500 funding information is useful for predicting future plan contributions. These findings are relevant to accounting standard setters as they reconsider pension accounting rules.
The remainder of the article is organized as follows. The next section provides background information and presents the research questions. The third section describes our variables and model. The fourth section contains the data analysis. The final section discusses our conclusions, the study's limitations, and future research.
2 Background
Many countries use two measures of plan assets and obligations: one for regulating plan funding and one for reporting financial information (Yermo, Reference Yermo2007). Either of these plan assets/obligation pairs can be used to compute a funding ratio. However, it is the regulatory plan assets and obligation that are directly linked to the funding requirements, which make them more relevant in assessing the amount and timing of cash flows for plan contributions.
Contributions to US plans are affected by the funding requirements of ERISAFootnote 2 based on plan assets and obligation from IRS Form 5500. Companies also report plan information in their pension footnote according to US GAAP (GAAP). We begin this section with a brief summary of US pension reporting. Then we discuss and illustrate Form 5500/GAAP funding ratio differences. The section ends with our two research questions.
2.1 Reporting pension funding
In the US prior to 1974, firms generally funded defined benefit plans on an ‘as needed’ basis that was partially driven by the firm's cash availability and need for tax deductions. In 1974, Congress passed ERISA to protect employees by establishing funding rules and mandatory pension plan insurance. Three agencies enforce ERISA provisions: the Department of Labor (DOL), Internal Revenue Service (IRS), and Pension Benefit Guaranty Corporation (PBGC).Footnote 3
The IRS, which has primary responsibility for plan funding, monitors companies' compliance via the Form 5500. For the years in our sample, the Form 5500 required a funding standard account, which summarized the costs and credits for the plan year. The minimum funding requirement, in part, was met if the account balance is a credit. But, more importantly, the minimum funding requirement also required, and continues to require, the computation of funding ratios (plan assets to plan liabilities). For the years in our sample, there were two separate liabilities. The accrued liability was defined as the present value of future benefits based upon the actuarial cost method and other assumptions used by the firm. On the other hand, the computation of the current liability required the use of mandated interest rates and mortality schedules. Using the greater of these two ratios, the plan may have been required to make additional contributions. If a required minimum contribution was not made, the firm was subject to penalties unless it obtained a funding waiver.
The accrued and current liabilities were also used to compute the maximum contribution allowed (full funding limitation). The maximum deduction was limited to the lesser of the unfunded liability amount determined using (1) the accrued liability compared to (2) a percentage of the current liability. Contributions greater than the maximum were not tax deductible and subject to an excise tax.
This is a simplified overview of the funding rules; for detailed examples, see Munnell and Soto (Reference Munnell and Soto2004) for rules effective for our sample and BNA (2009) for rules effective beginning in 2008. In spite of the law changes, the Form 5500 information continues to be used to monitor contributions and therefore should be useful in predicting contributions, an assertion that may not be applicable to GAAP pension disclosures.
Unfortunately, the Form 5500 plan obligation is not available on the same timely basis as the financial accounting information. GAAP plan assets and obligation for large corporations are reported within 60 days after the firm's year-end (within 75 or 90 days for others). In contrast, the Form 5500 due date is 210 days (285 days, if extended) after year-end.Footnote 4 Those involved in the process of generating the Form 5500 numbers do not feel that the timeframe can be shortened (GAO, 2005). They note the need for coordination among a number of parties, including insurance companies, financial institutions, actuaries, and auditors, is a major reason for the time delay. In addition, auditors tend to give the Form 5500 a low priority and such work is frequently delayed in favor of items with shorter timeframes (GAO, 2005: 26).
While Congress was passing ERISA in 1974, FASB was beginning to create a uniform set of rules for determining net periodic pension cost and providing related disclosures. FASB's goals were to provide a standardized method for measuring net periodic pension cost and disclosures for assessing the effect of pensions on the firm's financial position and results of operations (FASB, 1985).
Pension standards issued to date include FAS Nos. 36, 87, 132, 132(R), and 158 (FASB, 1980, 1985, 1998, 2003, 2006). During the revision of FAS 132, financial statement users pointed out that the current standard did not provide the information necessary to analyze and understand an entity's pension plan (FASB, 2003: para. A3). Using this information, FASB strived to improve disclosures about plan assets, benefit obligations, cash flows, and net benefit costs. Although users suggested disclosing the Form 5500 pension obligation because of its relation to funding requirements (FASB, 2003: para. A21), FASB declined.Footnote 5
Whether Form 5500 and GAAP funding ratios differ by enough to cause meaningful differences in predictions of future contributions is an empirical question. Next, we discuss whether Form 5500 and GAAP funding ratios are likely to differ.
2.2 Form 5500 vs. GAAP: differences in funding ratios
Plan assets and obligations included on Form 5500 and under GAAP can differ for two reasons. First, the two reports may provide information on different groups of plans. Second, plan assets and obligations can be measured differently in the two reports for the same plans. Our focus in this study is on the measurement differences.
Form 5500 and GAAP may cover different groups of plans because GAAP aggregates plan assets and obligations across US qualified, non-qualified, and foreign plans,Footnote 6 whereas each Form 5500 reports on a single US qualified plan.Footnote 7 The groups can also differ due to (1) the timing of mergers and acquisitions and (2) plans sponsored by a subsidiary included under GAAP but included under the subsidiary's employer identification number on Form 5500. This Form 5500/GAAP difference also causes Form 5500 and GAAP contributions to differ. We minimize these sources of Form 5500/GAAP differences through our sample selection.
Form 5500/GAAP differences in plan assets and obligations for the same plans are caused by differences in measurement methods and dates. However, for both Form 5500 and GAAP, plan assets are valued using a fair value measure, and pension obligations are calculated based on present values of future benefit payments.
For plan assets, although Form 5500 and GAPP can use different fair value methods and measurement dates,Footnote 8 there should be little difference between the two asset measurements (Klamm and Spindle, Reference Klamm and Spindle2006). But, for plan obligations, there are a variety of actuarial assumptions that may result in significant differences between the two measures.
Form 5500 and GAAP each report two obligations. Form 5500 reports the accrued liability and current liability, as discussed above. GAAP provides: (1) the projected benefit obligation and (2) the accumulated benefit obligation. These two measures represent the present value of accrued pension benefits, including plan amendments and actuarial gains/losses. The projected benefit obligation uses estimated future salaries to calculate future benefits, whereas the accumulated benefit obligation uses current salaries.
Differences between the Form 5500 and GAAP plan obligations are caused by differences in actuarial cost methods, discount rates, and assumptions regarding withdrawal from service and mortality (Yermo, Reference Yermo2007).Footnote 9 Other countries have similar issues. For instance, in Belgium for the 2002 plan year, regulators required the use of the attained age actuarial method and a 6% interest rate, while the accounting rules under IAS 19 used the projected unit credit actuarial method and an interest rate that could range from 5.25% to 5.75% (Hewitt, 2003).
The US differences occur, in part, because IRS and FASB guidance vary. For instance, Form 5500 obligation may be based on several different assumptions as to the timing of contributions into the plan, while GAAP allows only a benefits approach (FASB, 1985: para. 133). In contrast, the IRS tends to exert more control over such items as discount rates and mortality assumptions, whereas GAAP allows more flexibility in these choices (FASB, 1985: para. 133). During the years in our sample, the IRS required companies to use the 1983 Group Annuity Mortality Table (IRC para. 412I(l)(7)(C)), whereas the FASB made no such requirement. An important actuarial assumption used in pension obligation calculations that has different guidance from the IRS and FASB is the interest rate (Winklevoss, Reference Winklevoss1993; SEC, 2005) used to discount benefits.
Small changes in a discount rate can have a large impact on the obligation. For example, General Motors discloses in its Critical Accounting Estimates section of its 2005 Form 10-K that an increase (decrease) of 25 basis points would cause (1) the 2005 pretax pension expense to decrease by $160 million (increase by $150 million) and (2) the projected benefit obligation, estimated at $89 billion as of 31 December 2005, to decrease by $2.2 billion (increase by $2.3 billion) (GM, 2006: pp. II 40 – II 41).Footnote 10 While this disclosure pertains to financial reporting, the interest rate changes would cause similar effects on the Form 5500 pension obligation. And, small differences between GAAP and Form 5500 discount rates could cause large differences in the obligation measures.
We expect that Form 5500 and GAAP discount rates would differ because the underlying guidance for selecting the rates differs. For the years in our sample, IRS guidelines provide a Form 5500 rate that ranges from 90% to 120% of a four-year average of 30-year Treasury rates. In contrast, FAS 87 suggests that employers should ‘look to rates of return on high-quality fixed-income investments currently available whose cash flows match the timing and amount of expected benefit payments’ (FASB, 1985: para. 44).Footnote 11
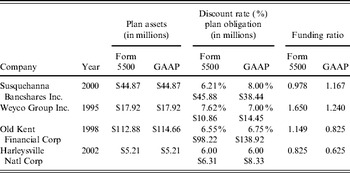
For comparison purposes, the annual average rate from 1995 to 2002 for 30-year Treasury bills was 6.06% compared to Moody's AAA corporate bonds of 7.125% (Federal Reserve Board, 2008). This rate difference would tend to lead to lower liabilities under GAAP than those reported on Form 5500 because discounting at higher rates leads to lower pension obligations. However, the effects of discount rate differences can be magnified or offset by other actuarial differences. Thus, the GAAP obligation will not always be smaller than the Form 5500 obligation even when the GAAP discount rate is larger, which is illustrated in Table 1 for four different US companies.Footnote 12
Example companies

The information on these four companies illustrates how the Form 5500 and GAAP funding ratios can differ, which makes it difficult to predict the Form 5500 funding ratio based on the GAAP ratio. For the companies Susquehanna and Weyco, the Form 5500 higher (lower) discount rate expectedly coincides with lower (higher) plan obligation, which in turn affects the funding ratio.
These differences in interest rates do not always cause predictable differences in obligation amounts. A review of Old Kent's financial statement footnote reveals that the GAAP obligation includes an unqualified plan, which explains, in part, why the GAAP obligation is larger than the Form 5500 obligation. Even when interest rates are the same, the obligations could differ. This holds true for Harleysville, which reports a 6.00% discount rate for both measures, but reports a larger GAAP obligation. A review of the financial statement footnote reveals that the $8.33 million does not include any unqualified or foreign plans; therefore, the difference should be due to differences in other actuarial assumptions.
In summary, the obligations reported on Form 5500 and under GAAP are likely to differ for numerous reasons, thus causing variation in the funding ratios. If the funding ratios differ, then their abilities to predict future plan contributions may also differ. If the Form 5500 is a better predictor of contributions, then its disclosure should be considered during the discussion of pension standard revision. Hence, we address two questions:
1 To what extent do Form 5500 and GAAP pension obligations and funding ratios differ?
2 Is the Form 5500 funding ratio useful for predicting future contributions?
3 Data and model specification
3.1 Data and sample
Data sources are the IRS Form 5500 (provided by the Department of Labor) and Standard and Poor's Research Insight.Footnote 13 To build a sample that allows us to compare and analyze the funding ratios, we start by coordinating the year-ends. The Form 5500 reports pension obligation and plan assets at the beginning of the plan year, whereas the pension footnote reports the information at of the end of the plan year. For example, General Mills Inc., which has a May year-end, uses its fiscal year-end as the measurement date for its pension plans (General Mills, 2002: 35). The May 2002 pension footnote reflects contributions, plan assets, and plan obligation at that date. The May 2002 Form 5500 reports contributions for that period, but reports the plan assets and obligation at May 2001. Therefore, we convert each Form 5500 plan year-end to a Research Insight year (e.g., May 2002 becomes 2001).Footnote 14 A Form 5500 is filed for each plan, so we combined all plans with the same plan sponsor employer identification number and Research Insight year.Footnote 15
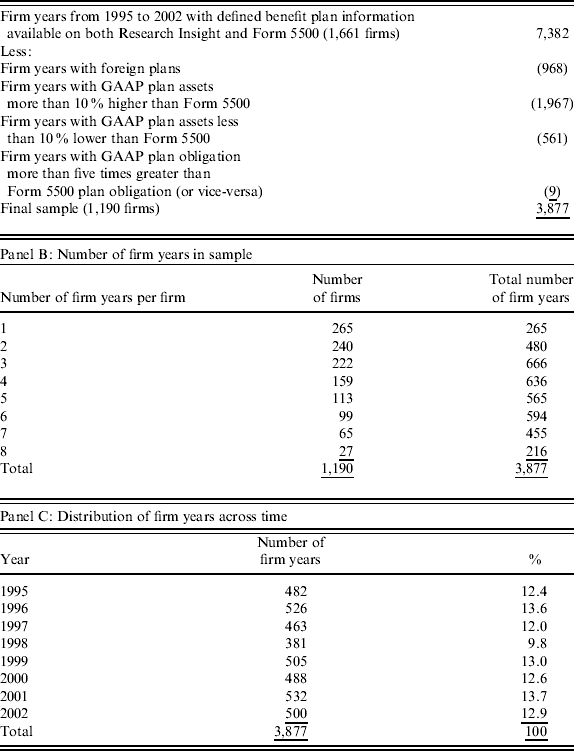
Next, we identify a sample of companies where the combined Form 5500s and the pension footnote cover the same plans. We exclude firm years with foreign plans (included in the financial statements but not Form 5500) and firm years where Form 5500 and GAAP plan assets differ by more than 10%. We also exclude firm years in which the Form 5500 plan obligation is more than five times the GAAP plan obligation (or vice-versa).Footnote 16 We remove these firm years because these criteria indicate that the group of plans covered by Form 5500 differs from the GAAP plans.Footnote 17
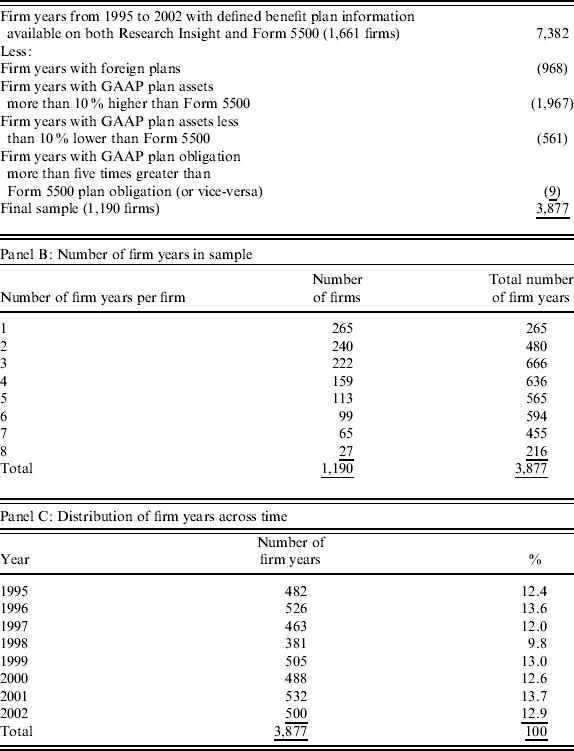
Table 2 provides information used to determine our test sample (Panel A) along with the number of firm years in the test sample by firm (Panel B) and by year (Panel C). We identify 7,382 firm years (1,661 firms) with both Form 5500 and Research Insight plan obligation data. We exclude 968 firm years with foreign plans, 1,967 (561) firm years with GAAP plan assets greater (less) than 10% higher (lower) than on Form 5500,Footnote 18 and nine firm years with the GAAP plan obligation more than five times the Form 5500 plan obligation (or vice-versa). This leaves a sample of 3,877 firm years. Panel B, shows that the sample has 1,190 different firms with one to eight firm years per firm; Panel C shows that the firm years in the sample are fairly equally distributed across the eight years.
Sample determination and number of firm years by firm and year
Panel A: Sample determination
3.2 Model specification
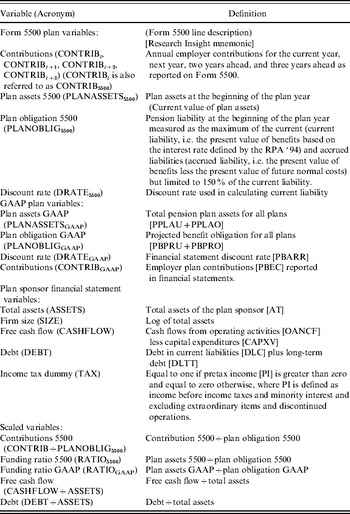
We predict Form 5500 contributions for next year (CONTRIBt+1) and the sum of contributions for two- and three-years ahead (CONTRIBt+2 plus CONTRIBt+3) using the following model. Table 3 contains the variable definitions along with Form 5500 line descriptions and Research Insight mnemonics.

We scale our contribution variables by the Form 5500 plan obligation (PLANOBLIG5500).
Variable definitions

Our GAAP funding ratio variable (RATIOGAAP) is plan assets (PLANASSETSGAAP) divided by the projected benefit obligation (PLANOBLIGGAAP). Our Form 5500 funding ratio variable (RATIO5500) is similarly defined as plan assets (PLANASSETS5500) divided by the plan obligation (PLANOBLIG5500). PLANOBLIG5500 is the maximum of the current and accrued liability (limited to 150% of the current liability) corresponding to calculations related to a plan's maximum contribution.Footnote 19 We expect the RATIOGAAP and RATIO5500 coefficients will be negative.
Following previous research, we include five control variables. We use the current year contribution (CONTRIBt) scaled by PLANOBLIG5500 as a control variable because we find that contributions are positively correlated across time. Ippolito (Reference Ippolito2001) and Ballester et al. (Reference Ballester, Fried and Livnat1998) find that contributions are positively related to free cash flow. Therefore, we include a free cash flow control variable (CASHFLOW) defined as cash flows from operating activities less capital expenditures and scaled by total assets (ASSETS).Footnote 20 We expect the CASHFLOW coefficient to be positive. Jin et al. (Reference Jin, Merton and Bodie2006) note that PBGC coverage of funding shortfalls for bankrupt firms’ pension plans creates an incentive for highly leveraged firms to underfund their plans (insurance effect). In addition, high debt firms may reduce pension contributions in order to meet debt obligations. Consequently, we include a debt variable (DEBT) defined as current and long-term debt scaled by total assets, and we expect the debt variable coefficient to be negative. Ballester et al. (Reference Ballester, Fried and Livnat1998) also find contributions are higher for companies with positive pretax income. Companies with positive taxable income benefit from a current tax deduction for their pension contribution, but companies with a loss do not. Therefore, we define an income tax dummy variable (TAX) as equal to one if pretax income is positive, but equal to zero otherwise. We expect the TAX coefficient to be positive. Finally, we include a control variable for size (SIZE) equal to the log of total assets to control for differences in contributions between different size companies. We do not have a prediction for the sign of the SIZE coefficient.
4 Results of analysis
4.1 Summary statistics
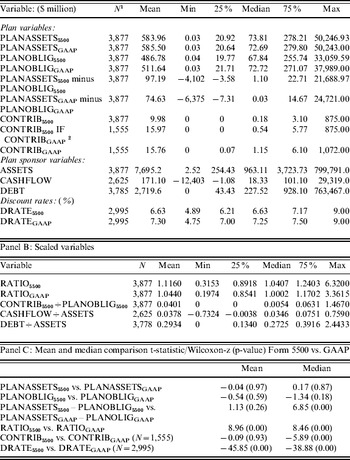
Table 4 provides summary statistics on Form 5500 and GAAP variables that illustrate the extent to which Form 5500 and GAAP measures differ; Panels A and B report on the unscaled and scaled variables, respectively. Panel C reports statistical tests of differences between GAAP and Form 5500 numbers. Panel A shows that mean and median plan assets are similar, which is expected because we limited the sample to years where differences were within +/− 10%. At the mean and median, plan obligations are somewhat smaller, and there is more apparent overfunding (plan assets minus obligation) per the Form 5500 than per GAAP (mean net funding: $97 million versus $75 million; median net funding: $1.10 million versus $0.03 million). However, with the exception of net funding at the median, none of these differences are significant (p>0.18).
Summary statistics
Panel A: Unscaled variables

Notes: See Table 3 for variable definitions.
1 Based on 1995 through 2002 sample of 3,877 firm years with both Form 5500 and GAAP funding status information. Sample sizes for other variables are smaller because of data availability.
2 CONTRIB5500 IF CONTRIBGAAP is the Form 5500 pension contribution for companies with a GAAP pension contribution available from Research Insight for the same period. The next row shows the time-matched contribution as reported in Research Insight.
The lower plan obligations and similar plan assets per the Form 5500 compared to GAAP causes higher RATIO5500 compared to RATIOGAAP values in Panel B (mean: 1.12 versus 1.04; median: 1.04 versus 1.00). Statistical comparisons (both t-statistic and Wilcoxon-z) in Panel C show that both the mean and median funding ratio differences are statistically significant (p<0.01).
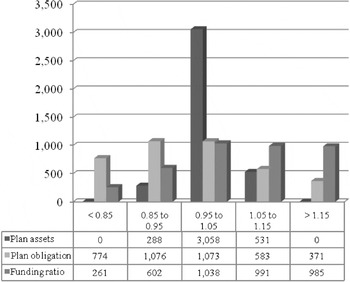
Figure 1 presents frequency information for Form 5500-to-GAAP ratios for plan assets, plan obligations, and funding ratios. The same figure provides additional information on the extent to which the two sources differ. While the sampling rule excludes all firm years where differences in plan assets were greater than +/− 10%, most firm years (3,058) have differences that are within +/− 5%. However, only 1,073 (28%) of the firm years have obligation differences that are within +/− 5%. Consistent with Table 4, many firm years have lower pension obligations reported on Form 5500. About 48% ((1,076+774)÷3,877) of the sample have Form 5500 obligations that are less than 95% of the GAAP measure. However, 25% ((583+371)÷3,877) of the sample report a Form 5500 obligation that is more than 5% larger than the related GAAP measure. This provides evidence that the Form 5500 obligation cannot be predicted easily from the GAAP measure. Lower pension obligations cause funding ratios to be higher. Figure 1 shows that about 51% ((991+985)÷3,877) of the sample have a Form 5500 funding ratio that is more than 5% larger than its GAAP counterpart.
Ratio of Form 5500 and GAAP variables

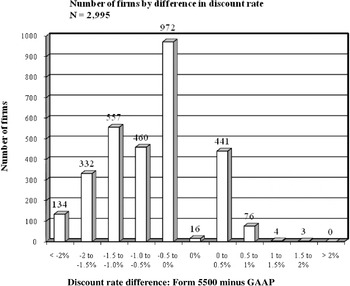
Differences between Form 5500 and GAAP plan obligations and funding ratios appear to be caused partially by differences in discount rates. Those firm years with discount rate data (the last two rows of Table 4, Panel A) show that the mean Form 5500 rate is lower (mean discount rate: 6.63% versus 7.30%). However, Form 5500 plan obligations are smaller at both the mean and median. Since this is counterintuitive, we look more closely at discount rates in Figure 2. The Figure 2 frequency distribution shows that 66% of the firms [(460+972+16+441+76)/2,995] use a Form 5500 discount rate that is within 1% of the GAAP rate. All but seven (4+3) of the remaining firms use a Form 5500 discount rate that is lower than the GAAP rate by more than 1%. Untabulated analysis for these 1,023 firms (134+332+557) shows that GAAP funding ratios are higher than Form 5500 ratios.Footnote 21 These differences once again illustrate the difficulties involved in trying to estimate Form 5500 data from GAAP numbers and suggest that Form 5500 disclosures may provide useful information.
Comparison of Form 5500 and GAAP discount rates

Our final statistics in Table 4 relate to actual contributions. Panel A shows the mean Form 5500 contribution (CONTRIB5500) is $9.98 million and the range is from $0 to $875 million. We match the 1,555 available firm years with GAAP contribution information (CONTRIBGAAP) with the related Form 5500 variable. We find mean contributions for the matched pairs are similar (p-value=0.93) between the Form 5500 ($15.97 million) and GAAP ($15.76 million) measures, but median contributions are statistically higher (p<0.01) for GAAP ($0.54 versus $1.15 million).Footnote 22 Form 5500 contributions are used exclusively in the rest of this paper because GAAP contributions were not reported for half of our sample period.
In summary, although Form 5500 pension obligations tend to be lower and funding ratios higher compared to their GAAP counterparts, a significant number of firms produce comparisons with the opposite results. Consequently, analysts cannot infer the Form 5500 ratio from the GAAP ratio.
4.2 Funding ratios and contributions
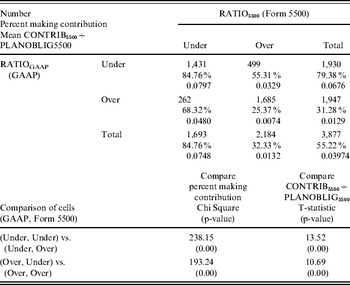
This section examines the consistency of Form 5500 and GAAP funding ratios and their relationship to contributions. Table 5 reports these differences and related contribution amounts. Using each funding measure, we categorize firm years as underfunded if total plan assets are less than the total plan obligation, and as overfunded if total plan assets are greater than the total plan obligation. As shown in Table 5, contribution frequencies and mean contributions to plan obligation are higher for underfunded companies than overfunded companies, regardless of the funding measure used. Using the GAAP measure, almost half of the firm years (1,930÷3,877=49.7%) are underfunded. For these underfunded firm years (per GAAP), contributions are made 79% of the time, and the average scaled contribution (average ratio of contribution to plan obligation) is 0.0676. In comparison, using the Form 5500 measure, 44% (1,693÷3,877) are considered underfunded. For these underfunded firm years (per Form 5500) contributions are made 85% of the time, and the average scaled contribution is 0.0748.
Contribution to plan obligation by funding status category

Notes: See Table 3 for variable definitions.
Additional variable definitions:
Under=total plan assets are less than the total plan obligation based on GAAP or Form 5500.
Over=total plan assets are greater than the total plan obligation based on GAAP or Form 5500.
We test whether the same firms are classified as underfunded by both measures. Table 5 shows that 1,431 of the 1,930 firm years (74%) classified as underfunded using the GAAP measure are also categorized as underfunded using the Form 5500 measure. However, 499 of the 1,930 firm years are categorized as overfunded using the Form 5500 measure. These 499 firm years have a significantly lower (p<0.01) contribution frequency and mean contribution to obligation when compared to the 1,431 firm years categorized as underfunded by both measures.
Table 5 also shows that, using the GAAP measure, approximately half (1,947÷3,877) are considered overfunded. There are contributions in 31% of these firm years. The average scaled contribution was 0.0129. Using the Form 5500 measure, 56% [(2,184÷3,877) are considered overfunded. There are contributions in 32% of these firm years. The average scaled contribution is 0.0132. Of the 1,947 firm years that are overfunded based on the GAAP measures, 1,685 are classified as overfunded, and 262 are categorized as underfunded using the Form 5500 measure. The 262 underfunded firm years using Form 5500 have a significantly higher (p<0.01) contribution frequency and mean scaled contribution when compared to the 1,685 firm years categorized as overfunded by both measures.
Table 5 differences suggest that Form 5500 funding ratios may provide useful information for predicting contributions beyond GAAP funding ratios. This is tested next.
4.3 Net funding as a predictor of future pension contributions
Our sample consists of active plans only; it does not include terminated plans. Thus, all contributions are either zero or positive, and no plan asset withdrawals or liquidations are included. Because of this lower limit on contributions, we use tobit regression models to investigate whether the Form 5500 funding ratio provides additional information for predicting future contributions beyond the GAAP funding ratio. We then compare out-of-sample contribution prediction errors to further investigate the additional information content of the Form 5500 funding ratio.
Correlations
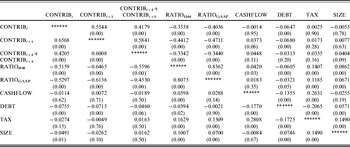
Table 6 presents correlations between scaled contributions, the funding status variables, and control variables used in the tobit models. To reduce the impact of outliers, we winsorize variables at the first and 99th percentiles.Footnote 23 Pearson coefficients are presented to the right of the main diagonal, whereas Spearman coefficients, based on ranks, are presented to the left of the main diagonal. We discuss Table 6 results based on the Pearson coefficients; all p-values are less than 0.01 unless otherwise noted.
Correlations

Notes: See Table 3 for variable definitions. Pearson correlations are right of the main diagonal and Spearman left with two-sided p-values. Correlations are based on 1995 through 2002 sample of 3,877 firm years for correlations with next-year's contributions and 1,730 firm years for correlations with two-years-ahead plus three-years-ahead contributions. The two contribution variables are winsorized at the 99th percentile. All other variables are winsorized at the first and 99th percentiles. Contributions are scaled by the Form 5500 plan obligation. CASHFLOW and DEBT are scaled by total assets.
Current year contributions are positively correlated with next year contributions (0.55) and the sum of two-years- and three-years-ahead contributions (0.42). This suggests that current year contributions are useful in predicting future year contributions. We observe negative correlations between future contributions and the funding variables (Form 5500:−0.44 to −0.33; GAAP −0.47 to −0.34). Also, the Form 5500 and GAAP funding variables are positively, but not perfectly, correlated (0.84). This leaves open the possibility that the Form 5500 funding could provide additional information for predicting future contributions.
The control variables generally exhibit low correlations with the other variables. With respect to the contribution variables, only DEBT and CONTRIBt and CONTRIBt+1 are significantly correlated at about −0.07. The correlations of the control variables with the two funding variables range from −0.06 to 0.14.
Regression results
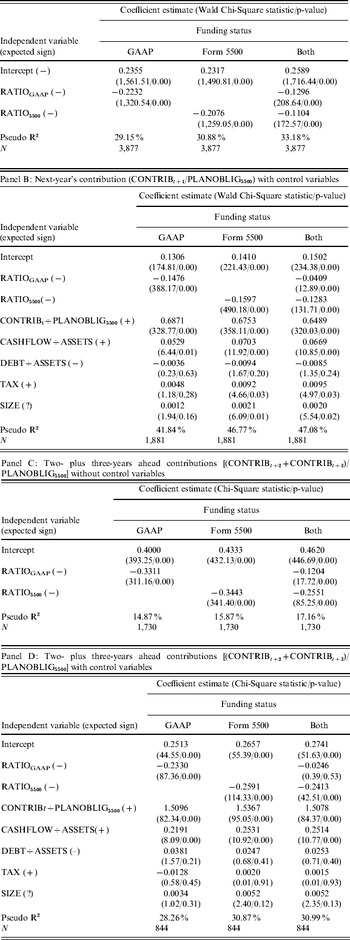
Table 7 presents the tobit regression results and provides additional evidence related to the information content of the Form 5500 funding ratio. Panel A presents the results for regressions that use only funding variables, whereas Panel B presents results for the full model, both for predicting next-year's contribution. The first two columns provide results using GAAP and Form 5500 funding information separately, while the third column combines both into one regression. The Panel B observations are substantially smaller because of missing Research Insight data.
Tobit regressions of contributions on funding status
Panel A: Next-year's contribution (CONTRIBt+1/PLANOBLIG5500) without control variables

Note: See Table 3 for variable definitions.
In both Panels A and B of Table 7 and in all three columns, the funding ratio coefficients are negative and significant (p<0.01), which is consistent with the correlations in Table 6. In Panel A, column 2, the estimated coefficient on the Form 5500 funding ratio is −0.2076. In the third column with both funding variables, the estimated coefficient for the Form 5500 funding ratio is −0.1104. The significance of the Form 5500 variable suggests that the Form 5500 funding ratio provides additional information beyond the GAAP funding ratio for predicting contributions.
Panels C and D estimate tobit regressions on the total contributions made in the second and third years following the funding status date. Panel C presents the results for regressions that use only funding variables, whereas Panel D presents results for regressions that include the control variables. Results in Panel C are similar to those found in Panel A. The funding ratio coefficients are all significant (p<0.01), with signs in the expected directions. In the third column with both funding variables, the estimated coefficient for the Form 5500 funding ratio is −0.2551. This again suggests that the Form 5500 funding status provides additional information beyond the GAAP funding status for predicting contributions.
When estimating contributions two and three years out the GAAP funding ratio variable is not significant (p=0.53) when the Form 5500 variables are included. This suggests that the GAAP funding ratio does not provide additional information beyond the Form 5500 ratio for predicting the sum of contributions for two- and three-years ahead.Footnote 24
Regression results in Panels B and D include control variables. Current year contributions are significantly and positively (p<0.01) associated with future contributions in all models, which is consistent with the correlations in Table 6. As expected, free cash flows are significantly and positively associated with future contributions in all models (p⩽0.01). Debt is insignificantly associated with future contributions in all models (p>0.21).The income tax dummy and size variables are positively and significantly (p<0.03) related to next year's contributions, but only in models that include the Form 5500 variable (Panel B). They are both insignificantly associated with two- and three-year-ahead future contributions (Panel D).
Prediction errors
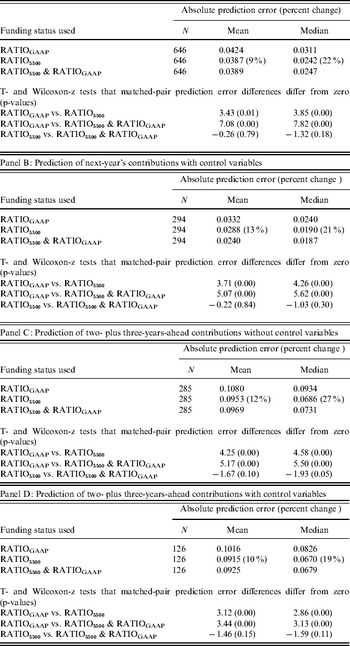
Table 8 compares errors from predicting next year's contributions (Panel A and B) and two- plus three-years-ahead contributions (Panel C and D) using the following comparisons:
• GAAP funding ratio versus Form 5500 funding ratio,
• GAAP funding ratio versus both GAAP and Form 5500 funding ratio, and
• Form 5500 funding ratio versus both GAAP and Form 5500 funding ratio.
As in Table 7, Panels A and C in Table 8 estimate without control variables; Panels B and D estimate errors by using the full model. Half of our sample (randomly selected) is used to estimate coefficients that are used with the remaining half of our sample to calculate predicted contributions and prediction errors.Footnote 25
Comparison of out-of-sample predictions
Panel A: Prediction of next-year's contributions without control variables

Notes: See Table 3 for variable definitions. Results are for the prediction error sample where the Form 5500 funding ratio is at least 15% different from the GAAP funding ratio. Half of our sample, randomly selected, is used to estimate coefficients.
We expect an improvement in contribution predictions when the GAAP and Form 5500 ratios are different. Therefore, we focus on firms where the Form 5500 ratio is at least 15% different than the GAAP ratio. We found this to occur for 32% of our sample based on Figure 1 ((261+985)/3,877). Therefore, sample sizes for the Table 8 panels are about 16% (50×32%) of the Table 7 panel sample sizes. We calculate matched-pair prediction error differences for each firm year and investigate whether these differences significantly differ from zero using t- and Wilcoxon-z tests. For example, the t-test for RATIOGAAP vs. RATIO5500 determines whether the mean prediction error difference (absolute prediction error using the GAAP ratio less absolute prediction error using the Form 5500 ratio) differs from zero.
All panels of Table 8 show that mean and median absolute prediction errors are lower when the Form 5500 variable or Form 5500 and GAAP funding variables are used to predict future contributions compared to just using the GAAP funding variable. These results are consistent for models with and without control variables. Furthermore, matched-pair prediction error differences are all significantly different from zero (using both t and Wilcoxon tests) at p<0.01. For example, in Panel B (predictions of next year's contribution with control variables), the median absolute prediction error of next year's contributions is 0.0240 using just the GAAP funding variable, but it is 0.0190 using just the Form 5500 funding variable and 0.0187 when both funding variables are used.
The significance tests on the matched-pair differences suggest that prediction errors are significantly higher (p<0.01) using the GAAP funding variable compared to using the Form 5500 ratio (or combing the two measures), but errors are not reduced by using both funding ratios compared to using just the Form 5500 ratio. These tests imply that predictions based on the Form 5500 funding variables are superior to predictions based on the GAAP funding variable and that adding the GAAP ratio to the Form 5500 ratio does not improve predictions.Footnote 26
The prediction error improvement from using the Form 5500 information is reasonably large as a percentage of GAAP prediction errors but translates into small dollar amounts when predicting next year's contribution. For example, in Panel B (predictions of next year's contribution with control variables) at the median, the difference between just using the GAAP funding variable and just using Form 5500 funding variable is 0.005 (0.0240–0.0190) or 21% (0.005/0.0240). This results in a prediction error improvement in dollars of $0.34 million for a company using the median plan obligation (0.005×$68 million from Table 4).
As the prediction time line increases, prediction errors increase. Therefore, the improvement in predictions with the Form 5500 measure translates into larger dollar amounts (although a similar percent change). In Panel D (predictions of two- plus three-years-ahead contributions with control variables), the prediction error improvement is 0.0156 (0.0826–0.0670) or 19% (0.0156/0.0826), resulting in a dollar difference of $1.06 million (0.0156×$68 million) – which is more than three times the dollar value of the next year's prediction error improvement.
In summary, the Form 5500 funding ratio provides additional information beyond the GAAP ratio for predicting future contributions. In tobit regressions on future contributions, the Form 5500 funding ratio coefficient is significantly and negatively (p<0.01) associated in all model formulations. In holdout sample results, predictions based on the Form 5500 funding variables are superior to predictions based on the GAAP funding variable, and adding the GAAP ratio with the Form 5500 ratio does not improve predictions.
4.4 Sensitivity tests
To test the robustness of our results, we use the Table 7 models to estimate tobit regressions in untabulated analysis using (1) all firm years (removing the plan asset restriction) and (2) the current sample along with companies sponsoring foreign plans. We add a foreign plan dummy variable equal to one if the company sponsors a foreign plan and equal to zero otherwise. For both estimates, results are similar to our original model. The foreign plan dummy variable is insignificant in most of the regressions. We also estimate tobit regressions for the sample of companies reporting accumulated benefit obligation in their financial statements (N=1,568). We find similar results to Table 7 when the GAAP funding ratio is calculated using the accumulated benefit obligation or when two GAAP funding ratios are included in the regression (one using projected benefit obligation and one using accumulated benefit obligation).
In an attempt to assess the information content of delayed Form 5500 data, we ran all models using the Form 5500 funding ratio and contribution from the prior year (full results not reported). When next year's contribution is the dependent variable, the results for the Form 5500 variables are similar to those reported in Table 7, Panels A and B, except the significance of the Form 5500 funding ratio is lower in the third column (p=0.02 and 0.08). However, when the dependent variable is two- plus three-years-ahead contributions, the funding ratio is insignificant with or without control variables (p=0.61 and 0.74). Thus, our results are mixed as to whether prior-year Form 5500 data provides additional information to the current year GAAP funding ratio for predicting future contributions.
While our 10% plan asset exclusion removes companies with funded foreign or non-qualified plans, it does not prevent our sample from including companies with non-funded foreign or non-qualified US plans. The Research Insight database does not distinguish companies with non-qualified plans, and based on a sub-sample review of footnotes it appears that Research Insight does not identify all sponsors of foreign plans. Our footnote review suggests these non-funded plans tend to be small in comparison to the US qualified plans.
For companies sponsoring non-funded plans, the GAAP contributions could include non-funded plan contributions for benefits paid. We do not expect the Form 5500 ratio to be a good predictor of these contributions. Consequently, we would not expect the Form 5500 ratio to be a good predictor of GAAP contributions if contributions to unfunded plans are a large part of GAAP contributions. Therefore, as a sensitivity test we recalculated Tables 7 and 8 using GAAP contributions (scaled by the PBO) as the contributions to be predicted rather than Form 5500 contributions. The sample sizes for these tests are lower than our primary tests ranging from 466 to 1,555 observations for Table 7 and from 56 to 227 observations for Table 8 because of the non-availability of GAAP contributions for half of our sample period.
Our untabulated recalculations of Tables 7 and 8 using GAAP contributions are similar to the Table 7 and 8 results using Form 5500 contributions. For each of the four panels of Table 7 we find that the Form 5500 funding ratio coefficient is negative and significant when both funding ratios are included. For each of the four panels of Table 8 the absolute prediction errors are lower when either the Form 5500 ratio or both ratios are used as compared to just using the GAAP ratio and the matched-pair prediction error difference tests show the differences are significant. This evidence suggests that the Form 5500 funding ratio is useful for predicting future GAAP contributions for our sample of firms likely because contributions to unfunded plans are a small part of GAAP contributions.
5 Conclusions, limitations, and future research
The funding status of defined benefit plans based on regulatory standards may differ from the funding status according to the accounting standards. During a previous period of pension accounting reform in the US, users requested footnote disclosure of Form 5500 funding status in the pension footnote. FASB resisted this request because of perceived increase in complexity and the additional disclosures needed to make the information useful. Missing in this discussion was empirical evidence on whether Form 5500 funding status provides useful information for predicting future pension contributions. We provide this evidence in our study and suggest that FASB consider our results during the current period of pension accounting reform.
We find that Form 5500 funding status is potentially informative because GAAP and Form 5500 funding ratios differ by more than 5% for 73% of our sample with neither ratio being consistently higher. In addition, we find that the Form 5500 funding ratio is useful for predicting future pension contributions beyond the predictive information in the GAAP ratio. In tobit regressions predicting next-year and two- plus three-years-ahead contributions, the parameter estimates on the Form 5500 funding ratio are significant and negative (p<0.01) in all models, including those that contained the GAAP funding ratio. Similarly in hold-out samples, we find prediction errors on future contribution forecasts are significantly lower when Form 5500 funding ratios are used in the forecast as compared to using only GAAP funding ratios. The differences in prediction errors appear small in dollars but reasonably large in percent improvement.
Whether or not these results are of sufficient magnitude to refute the FASB's position that adding Form 5500 information to the pension footnote increases complexity without adding substantial information should be debated. Another complication is the delay in Form 5500 reporting. Requiring companies to compute their Form(s) 5500 plan obligation(s) earlier for inclusion in financial statements may not be feasible. However, there are reporting alternatives. Companies could provide a current year estimate of the government regulated funding liability or report their prior year's Form 5500 plan obligation. At a minimum, the Form 5500 information could be reported in the first interim financial statement for which the information becomes available.
Although our results are based on data using US accounting standards and government regulations, they have implications to other countries that have multiple sets of pension rules defining the pension liability. The accounting standard setters in those countries may want to consider whether disclosure of regulatory funding status should be included with the financial reports to provide the users with more information on future cash flows. That may require an analysis similar to the current study, particularly in relation to the pension liabilities and funding ratios.
Additional future research relates to issues posed by Yermo (Reference Yermo2007). He suggests that accountants and regulators should work together to refine the assumptions used in measuring the pension obligation, which could reduce the issues addressed in this paper. He also asserts that between country differences may be as much of an issue as within country differences. These issues provide useful ideas for future research on both a national and an international basis.
There are several limitations inherent in our analysis, which are left to future research. Increases in predictability might result by including other Form 5500 and GAAP information in the model. Furthermore, data limitations did not allow us to include in our models any of the new disclosures required under SFAS No. 132 (FASB, 2003). Asset allocations and other information disclosed since 2004 might overshadow the benefit of including the Form 5500 funding ratio in the model. Finally, further research is needed to evaluate the information content of delayed Form 5500 data.
 , where λi=ϕ(x iβ/σ)/Φ(x iβ/σ), ϕ and Φ represent the normal probability density and cumulative distribution functions, σ is the standard deviation of the error term, and x iβ is the estimated latent variable.