1. Introduction
The phenomena of flow separation and the bluff body wake from a cylinder have, for many years, been studied in detail because of their fundamental significance in flow physics, and their practical importance in numerous applications. The generation and evolution of vortices in the wake region have a large effect on drag, flow-induced vibration and noise problems. Comprehensive reviews on this subject are available in the literature (Williamson Reference Williamson1996; Williamson & Govardhan Reference Williamson and Govardhan2004; Choi, Jeon & Kim Reference Choi, Jeon and Kim2008). For these reasons, many methods have been proposed to control the dynamics of wake vortices with the aim of reducing the fluctuating lift force and the magnitude of the mean drag force. Recently, Choi et al. (Reference Choi, Jeon and Kim2008) classified control methods for bluff body flows as boundary-layer controls and direct-wake modifications, depending on whether the control delays separation by modifying the boundary layer, or directly changes the wake characteristics. One approach in direct-wake control methods is to introduce some form of three-dimensional (3D) geometric disturbances to the base form of a nominally two-dimensional (2D) bluff body. Among the 3D geometric disturbances, the waviness of a cylinder with a sinusoidal variation in the cross-sectional area along the spanwise direction has been considered in order to investigate its effect on flow characteristics such as wake vortices and body forces.
Ahmed & Bays-Muchmore (Reference Ahmed and Bays-Muchmore1992) experimentally investigated the pressure field and flow patterns over a wavy cylinder. They obtained the pressure distributions on the surfaces of several wavy cylinders for different axial wavelengths at a Reynolds number (Re) of 20 000 based on the mean diameter. They found that the sectional drag coefficient at the node was greater than that at the saddle, and that significant spanwise pressure gradients resulted in 3D flow separation. Ahmed, Khan & Bays-Muchmore (Reference Ahmed, Khan and Bays-Muchmore1993) further experimentally investigated the turbulent wake behind a wavy cylinder. They described the topology of the boundary-layer separation lines and the subsequent 3D development of the turbulent structure of the wake. They pointed out that the formation of trailing streamwise vortices behind the nodal points of separation caused a locally narrower wake, a rapid wake-velocity recovery and suppression of turbulence development within the separated boundary layer. However, drag reduction and suppression of vibration were not discussed in their report.
Owen, Bearman & Szewczyk (Reference Owen, Bearman and Szewczyk2001) carried out experiments to measure the drag and vortex-induced vibration amplitudes of a circular cylinder, a circular cross-sectional body with a sinuous axis and a circular cylinder with hemispherical bumps attached. Suppression of vortex shedding and drag reductions of up to 47 % were observed for the body with a sinuous axis. Drag reductions of approximately 25 % and suppression of vortex shedding were recorded for the cylinder with bumps.
Lam et al. (Reference Lam, Wang, Li and So2004a
) and Lam, Wang & So (Reference Lam, Wang and So2004b
) performed experiments to examine drag reduction and the relevant flow-induced vibration for different wavy cylinders. Lam et al. (Reference Lam, Wang, Li and So2004a
) experimentally investigated the effects of the surface waviness of cylinders on the mean drag and fluctuating lift. They found that a drag reduction of up to 20 % in the range of
 $\mathit{Re}=20\,000{-}50\,000$
can be achieved in comparison with the smooth cylinder, depending on the degree of obliqueness,
 $a^{2}/({\it\lambda}D)$
, of the wavy cylinder, where
 $a$
,
 ${\it\lambda}$
and
 $D$
are the amplitude, the length of the wave and the cylinder diameter, respectively. Moreover, the Strouhal number in the range of
 $\mathit{Re}=10\,000{-}60\,000$
was around 0.2, which is equal to the value for the smooth cylinder.
Lam et al. (Reference Lam, Wang and So2004b
) investigated flow characteristics experimentally in the range of
 $\mathit{Re}=3000{-}9000$
. They concluded that the average vortex formation length (up to over one-half of a wavelength of the wavy cylinder) was longer than that of the smooth cylinder, resulting in drag reduction and suppression of vortex-induced vibration. These results of Lam et al. (Reference Lam, Wang and So2004b
) are also confirmed by Lee & Nguyen (Reference Lee and Nguyen2007) in the range of
 $\mathit{Re}=5000{-}20\,000$
. In addition, they observed that the shear layers shed from the points near the saddles extended along the spanwise direction, whereas the shear layers near the nodes contracted and accelerated. As a result, the wake showed the characteristics of incoherent turbulence due to enhanced turbulent mixing.
Zhang, Dai & Lee (Reference Zhang, Dai and Lee2005) experimentally investigated the 3D flow structures of the near wake behind a wavy cylinder at
 $\mathit{Re}=3000$
. They concluded that the presence of the waviness modified the near-wake structure and the streamwise vortices, and contributed to the pronounced spanwise periodicity of the flow structure in the near wake of the wavy cylinder.
Lam & Lin (Reference Lam and Lin2007, Reference Lam and Lin2008) carried out computational studies and characterized the detailed 3D vortex structures of wavy cylinders for laminar flow at a low
 $\mathit{Re}=100$
, and in turbulent flow at
 $\mathit{Re}=3000$
. The optimal values of the spanwise wavelength for drag reduction were obtained over a small range of wavelength variation. For turbulent flow, they confirmed their findings by using large eddy simulation (LES) for wavy cylinders with wavelength ratios of 1.14–3.33 at
 $\mathit{Re}=3000$
. The optimal value of the wavelength ratio for turbulent flow was
 ${\it\lambda}/D_{m}\simeq 1.9$
,
 $D_{m}$
is the mean diameter of the wavy cylinder. Subsequently, by considering a wide range of wavy conditions, Lam & Lin (Reference Lam and Lin2009) concluded that in the laminar flow regime (
 $60\leqslant \mathit{Re}\leqslant 150$
), the values of optimal wavelength are dependent on the Reynolds number.
Recently, Xu, Chen & Lu (Reference Xu, Chen and Lu2010) carried out a numerical investigation of the compressible flow past a wavy cylinder using LES for a Reynolds number based on a mean diameter of
 $\mathit{Re}=2\times 10^{5}$
. They confirmed the use of waviness as a passive control reduces the mean drag coefficient and fluctuating force coefficients for the compressible flow past a wavy cylinder, compared with a smooth cylinder. Moreover, they systematically studied various fundamental mechanisms that dictate intricate flow phenomena, including drag reduction, fluctuating force suppression, shock and shocklet elimination, 3D separation and separated shear layer instability.
Flow over a smooth cylinder with helical surface perturbations is the other relevant problem in the present study. According to Zdravkovich (Reference Zdravkovich1981), the use of helical strakes was reported to be an effective method of attenuating vortex shedding from a smooth cylinder when the flow is normal to the cylinder. Weaver’s experimental results (Reference Weaver1961) showed that three or four helical wires with diameters of approximately
 $0.1D$
are most effective, at a pitch between
 $10D$
and
 $14D$
, where
 $D$
is the diameter of the cylinder.
Nebres, Barill & Nelson (Reference Nebres, Barill and Nelson1993) considered surface pressure profiles, and the steady lift and normal drag, for stranded cable models. They showed that cables have significantly different shedding characteristics and near-wake shear layer structures when compared with a smooth cylinder. Smoke visualization showed that the cellular flow patterns indicate streamwise vortical structures emanating from the valleys of the helical strands of the cable. These vortical structures can result from roll-up of the separated flow over the strands, which is then directed toward the low-pressure region in the valleys.
Lee & Kim (Reference Lee and Kim1997) considered an experimental model similar to that of Nebres et al. (Reference Nebres, Barill and Nelson1993), except for the number of wires used for the surface protrusions, by using wind tunnel tests. The smooth cylinder was wrapped helically by three small wires and tested in
 $5000\leqslant \mathit{Re}\leqslant 50\,000$
. They showed that the surface protrusions cause the near wake to have a periodic structure along the spanwise direction and elongate the vortex formation region. The reduction of the vortex shedding frequency and the shrinkage of the wake width were obtained mainly by the suppression of large-scale vortices into a slender elliptic shape, which increases the velocity deficit in the near wake.
Chyu & Rockwell (Reference Chyu and Rockwell2002) investigated the characteristics of the near wake of a smooth cylinder with a helical wire pattern about its surface by using a high-image-density velocimetry technique. They demonstrated that the spanwise structure of the near wake, represented by patterns of velocity and transverse vorticity, shows spatially periodic wake-like regions that are formed at the crest of the helical perturbation and rapidly increase in width.
Recently, Yeo & Jones (Reference Yeo and Jones2011) computationally studied the flow around a yawed cylinder with various strake patterns at
 $\mathit{Re}=1.4\times 10^{5}$
. Their results demonstrate that strake patterns strongly influence the development of flow structures around a yawed cylinder, and therefore the associated forces on the cylinder.
In addition to a smooth cylinder with helical surface perturbations and a wavy cylinder, the elliptic cylinder, which is closely associated with the twisted cylinder, is also an important bluff object. For the elliptic cylinder, the aspect ratio and the angle of attack are the important parameters. As the aspect ratio increases, the elliptic cylinder tends to induce unfavourable wake. Moreover, the drag of an elliptic cylinder with a small angle of attack is much lower than that of a smooth cylinder. However, as the angle of attack increases, the drag of the elliptic cylinder significantly increases (Lugt & Haussling Reference Lugt and Haussling1974; Modi & Dikshii Reference Modi and Dikshii1975; Ota, Nishiyama & Taoka Reference Ota, Nishiyama and Taoka1984; Nair & Sengupta Reference Nair and Sengupta1997).
The aforementioned studies elucidated some prominent flow features past smooth cylinders with helical surface perturbations, a wavy cylinder and an elliptic cylinder. Moreover, as previously mentioned, the waviness and helical surface perturbations have been confirmed by numerous studies as effective passive controls with which to reduce drag and suppress fluctuating lift.
In the present study, we considered a twisted cylinder as the passive control. The twisted cylinder was designed by rotating the elliptic cross-section along the spanwise direction such that the cylinder’s surface had a twisted spiral pattern. To the best of our knowledge, there are few relevant studies that have dealt with flow around a twisted cylinder. Therefore, we investigated the characteristics of flow past a twisted cylinder in comparison with flow past a smooth and a wavy cylinder. The main emphasis of this study is to evaluate the effect of the twisted spiral pattern on the reduction of drag, and on the suppression of fluctuating lift as the passive control.
Initially, we considered the subcritical Reynolds number of 3000, wherein the wake is completely turbulent after flow separation. Moreover, in order to directly compare the wavy cylinder, we used the condition of Lam & Lin (Reference Lam and Lin2008), who computationally researched turbulent flow over wavy cylinders at
 $\mathit{Re}=3000$
. Therefore, an LES was employed, which is a useful tool for studying the dynamics of turbulent flows. We simulated flow past the cylinders at the subcritical Reynolds number of 3000, and carefully analysed instantaneous 3D vortex structures and flow variables such as the drag and lift coefficients, Strouhal number, pressure coefficient and 3D separation. In addition, we discussed the effects of the cross-sectional aspect ratio (
 $A/B$
) and the Reynolds number.
2. Mathematical formulation and numerical methodology
2.1. Mathematical formulation
The present study employs the well-established dynamic model to simulate flow past the cylinders. The grid-filtered Navier–Stokes and continuity equations are the governing equations for large eddy evolution under the present assumption of the incompressible constant property flow:
 $$\begin{eqnarray}\displaystyle & \displaystyle \frac{\partial \overline{u_{i}}}{\partial t}+\frac{\partial \overline{u_{i}}\overline{u_{j}}}{\partial x_{j}}=-\frac{\partial \overline{p}}{\partial x_{i}}+\frac{1}{\mathit{Re}}\frac{\partial ^{2}\overline{u_{i}}}{\partial x_{j}\partial x_{j}}-\frac{\partial {\it\tau}_{ij}}{\partial x_{j}}, & \displaystyle\end{eqnarray}$$
 $$\begin{eqnarray}\displaystyle & \displaystyle \frac{\partial \overline{u_{i}}}{\partial x_{i}}=0, & \displaystyle\end{eqnarray}$$
 $u_{i}$
are the velocity components along the Cartesian coordinates of
 $x_{i}$
,
 $t$
is the time,
 $p$
is the pressure, and the overbar denotes the large (or resolved) scale obtained from grid filtering. The subgrid-scale stress tensor (
 ${\it\tau}_{ij}$
) is defined as
 ${\it\tau}_{ij}=\overline{u_{i}u_{j}}-\overline{u_{i}}\overline{u_{i}}$
, and accounts for the influence of subgrid scales on the resolved scales. In order to obtain a closure for (2.1), it must be modelled in terms of the resolved scales. Commonly, the subgrid-scale model is based on the eddy-viscosity model, where the anisotropic part of the subgrid-scale stress tensor is assumed to take the following form:
 $$\begin{eqnarray}{\it\tau}_{ij}^{a}={\it\tau}_{ij}-{\textstyle \frac{1}{3}}{\it\tau}_{kk}{\it\delta}_{ij}=-2{\it\nu}_{T}\overline{S_{ij}}.\end{eqnarray}$$
The most commonly used eddy-viscosity model proposed by Smagorinsky (Reference Smagorinsky1963) is
 $$\begin{eqnarray}{\it\nu}_{T}=(C_{s}{\it\Delta})^{2}|\overline{S}|,\end{eqnarray}$$
where
 ${\it\Delta}=({\it\Delta}_{1},{\it\Delta}_{2},{\it\Delta}_{3})^{1/3}$
is the filter width (Deardoff Reference Deardoff1970), where
 ${\it\Delta}_{1}$
,
 ${\it\Delta}_{2}$
and
 ${\it\Delta}_{3}$
are the dimensions of the computational cell,
 $C_{s}$
is the Smagorinsky constant and
 $|\overline{S}|=(2\overline{S_{ij}}\,\overline{S_{ij}})^{1/2}$
, with
 $\overline{S_{ij}}=((\partial \overline{u}_{i}/\partial x_{j})+(\partial \overline{u}_{j}/\partial x_{i}))/2$
.
The present study employs the dynamic eddy-viscosity approach (see Germano et al. Reference Germano, Piomelli, Moin and Cabot1991; Lilly Reference Lilly1992). Here, a second filter (a test filter is denoted by the tilde symbol) is defined and applied to the large eddy equation (2.1). The subgrid-scale stress and the resolved turbulent stress in the new test filter are given by
 $$\begin{eqnarray}\displaystyle & T_{ij}=\overline{u_{i}u_{j}}-\tilde{\overline{u}}_{i}\tilde{\overline{u}}_{j}, & \displaystyle\end{eqnarray}$$
 $$\begin{eqnarray}\displaystyle & L_{ij}=\overline{u_{i}}\,\overline{u_{j}}-\tilde{\overline{u}}_{i}\tilde{\overline{u}}_{j}. & \displaystyle\end{eqnarray}$$
 $$\begin{eqnarray}L_{ij}^{a}=T_{ij}^{a}-\tilde{{\it\tau}}_{ij}^{a},\end{eqnarray}$$
where
 $$\begin{eqnarray}T_{ij}^{a}=-2(C_{s}\tilde{{\it\Delta}})^{2}|\tilde{\overline{S}}|\tilde{\overline{S}}_{ij}.\end{eqnarray}$$
Here,
 $\tilde{{\it\Delta}}$
is the characteristic filter width associated with the test filter. Eventually, a space- and time-dependent Smagorinsky coefficient can be obtained from the following equation:
 $$\begin{eqnarray}(C_{s}{\it\Delta})^{2}M_{ij}=L_{ij}^{a},\quad \text{where}\ M_{ij}=-2\left(\frac{\tilde{{\it\Delta}}}{{\it\Delta}}\right)^{2}\,|\tilde{\overline{S}}|\tilde{\overline{S}}+2|\overline{S}|\overline{S}_{ij}.\end{eqnarray}$$
Here,
 $\tilde{{\it\Delta}}$
is the characteristic filter width associated with the test filter. As is well known, in the dynamic eddy-viscosity model, the coefficient vanishes in laminar flow, where
 $L_{ij}$
is identically zero, which results in better prediction of the transition without ad hoc adjustments (Piomelli Reference Piomelli1999). However, such a procedure can be numerically ill conditioned as
 $M_{ij}$
approaches zero. Furthermore, the Smagorinsky coefficient can be locally negative, and this can give rise to serious numerical difficulties. To avoid this, an averaging of the model coefficient over statistically homogeneous directions or an ad hoc clipping procedure has been considered (Breuer Reference Breuer1998; Jordan & Ragab Reference Jordan and Ragab1998; Breuer Reference Breuer2000; Jordan Reference Jordan2002). However, these prescriptions would not work in flows that have no homogeneous directions. To overcome this problem, therefore, we simply average over the entire volume and consider the Smagorinsky coefficient to be a function of time, with no requirement for any ad hoc numerical stabilization or clipping operations. For this reason, this or a similar method has been widely adopted for solving various problems such as turbulent channel flow, flow around a cylinder and flow in an unbaffled stirred tank (Park et al.
Reference Park, Lee, Lee and Choi2006; You & Moin Reference You and Moin2007, Reference You and Moin2009; Yoon, Balachandar & Ha Reference Yoon, Balachandar and Ha2009; Singh & You Reference Singh and You2013). Eventually, by contracting (2.9) and an averaging procedure over the entire computational volume (denoted by
 $\langle \ \rangle$
), we obtain
 $$\begin{eqnarray}C_{s}^{2}=\frac{1}{{\it\Delta}^{2}}\frac{\langle L_{ij}^{a}M_{ij}\rangle }{\langle M_{ij}M_{ij}\rangle }.\end{eqnarray}$$
This averaging procedure was successfully used for the complex problem of a mixing tank with blades (Yoon et al. Reference Yoon, Balachandar and Ha2009). This complex problem has strong vortex dynamics associated with the flow separation and the shear layers, even the interior flow. The method of LES used in this paper is basically the same as that used in Yoon et al. (Reference Yoon, Balachandar and Ha2009) which can be referred to for some more details on the method.
2.2. Numerical methodology
A second-order central difference scheme based on the finite volume method was used for spatial discretization of the governing equations. A two-step time-split scheme was adopted in order to advance the flow field in time, and continuity was satisfied by the solution of Poisson’s equation. Further details of this scheme are given in Kim & Moin (Reference Kim and Moin1985) and Zang, Street & Koseff (Reference Zang, Street and Koseff1994). The nonlinear terms are treated explicitly using the second-order Adams–Bashforth scheme, and the diffusion terms are treated implicitly using the Crank–Nicolson scheme. We derived the governing equations on a generalized curvilinear coordinate system. Near the boundary, there is no additional treatment for the LES model.
2.3. Definition of the body geometries
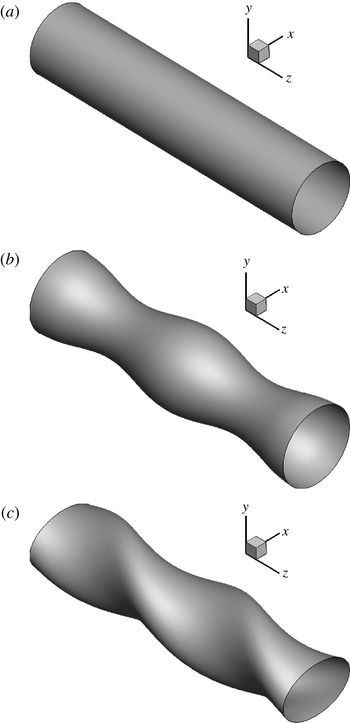
The three different cylindrical structures (smooth, wavy and twisted) are shown in figure 1. The geometry of the wavy cylinder is described by
 $$\begin{eqnarray}D_{z}=D_{m,W}+a\cos \left(\frac{2{\rm\pi}z}{{\it\lambda}}\right),\end{eqnarray}$$
where
 $D_{z}$
denotes the local diameter of the wavy cylinder and varies in the spanwise direction
 $z$
, and
 $a$
and
 ${\it\lambda}$
represent the amplitude and wavelength of the wavy surface, respectively. The mean diameter of the wavy cylinder
 $D_{m,W}$
is defined by
 $$\begin{eqnarray}D_{m,W}=\frac{D_{max}+D_{min}}{2},\end{eqnarray}$$
where
 $D_{max}$
and
 $D_{min}$
represent the maximum and minimum local diameters of the wavy cylinder. Moreover,
 $D_{max}$
,
 $D_{m,W}$
and
 $D_{min}$
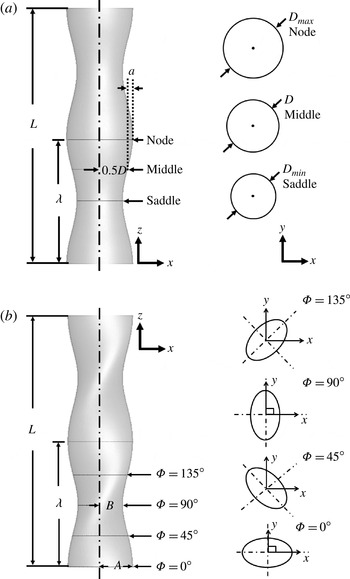
are called the ‘node’, ‘middle’ and ‘saddle’, respectively, as shown in figure 2(a).
The geometries of the cylinders: (a) smooth, (b) wavy and (c) twisted.

Definition of the geometries for (a) the wavy and (b) the twisted cylinders.

We designed the twisted cylinder by rotating the elliptic cross-section along the spanwise direction so that the cylinder surface had a twisted spiral pattern, as shown in figure 1(c). The cross-section definition and its parameters are shown in figure 2(b), where
 $A$
and
 $B$
are the major and minor diameters of the twisted cylinder, respectively. The mean diameter of the twisted cylinder,
 $D_{m,T}$
, is defined as
 $$\begin{eqnarray}D_{m,T}=\frac{A+B}{2}.\end{eqnarray}$$
It should be noted that the mean diameters of the wavy and the twisted cylinders are the same in the present study. Moreover, the major and minor diameters of the twisted cylinder are equal to the maximum and minimum local diameters of the wavy cylinder, respectively. The twisting phase angle (
 ${\it\Phi}$
) ranges from 0 to 360° and varies linearly along the spanwise coordinates of
 $z$
. The pitch of the twisted cylinder,
 $P_{t}$
, has a distance between turns (
 ${\it\Phi}=0{-}360^{\circ }$
) of an elliptic cross-section with twice the wavelength of the wavy cylinder (
 ${\it\lambda}$
). All types of cylinder have the same spanwise length,
 $L$
. The parameters used in this study were selected based on a typical experiment for flow over a wavy cylinder called ‘WY-A4’ (Lam et al.
Reference Lam, Wang, Li and So2004a
,Reference Lam, Wang and So
b
).
2.4. Computational domain and boundary conditions
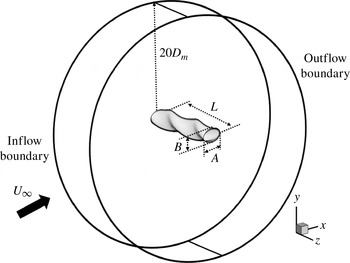
The computational domain and boundary conditions are shown in figure 3. The grids are of the O-type with a far-field boundary at a distance of
 $20D$
from the cylinder in the
 $x$
–
 $y$
plane. The spanwise extent of the domain was chosen to be
 $4.55D$
, which corresponds to the size used by Lam & Lin (Reference Lam and Lin2008), as shown in figure 3. The inflow and outflow boundary conditions were applied to the outer surface. A uniform velocity profile was used at the inlet boundary, and a convective boundary condition,
 $(\partial u_{i}/\partial t)+(c\partial u_{i}/\partial x)=0$
, was imposed on the outflow region, where
 $c$
is the space-averaged streamwise outlet velocity. The displacement effect from the body is negligible when the inflow boundary is far enough from the body, and thus the flow is very close to potential flow. On the surface of the body, no-slip and no-penetration conditions were adopted. A Neumann-type boundary condition was used for the pressure. A periodic boundary condition was adopted in the spanwise direction by considering an infinitely long cylindrical structure.
Schematic of the computational domain and boundary conditions.

2.5. Grid dependence test and validation
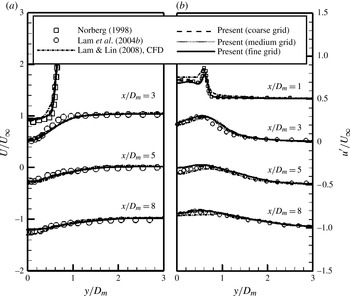
To validate the simulation, we first considered flow over a smooth cylinder and compared our numerical results and experimental data (Norberg Reference Norberg1987; Lam et al.
Reference Lam, Wang and So2004b
; Lam & Lin Reference Lam and Lin2008) in terms of the mean streamwise velocity
 $U/U_{\infty }$
and the root mean square (r.m.s.) velocity
 $u^{\prime }/U_{\infty }$
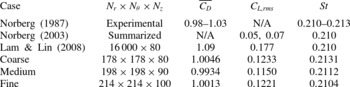
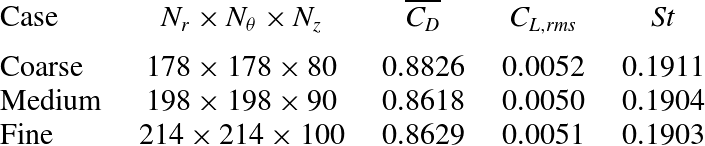
. Moreover, three different grid systems (coarse, medium and fine grids), as listed in table 1, were used to test the grid dependence of the solutions for the smooth cylinder.
Grid dependence test for a smooth cylinder at
 $\mathit{Re}=3000$
compared with experimental and LES results: Number of grids
 $N$
, mean drag coefficient
 $\overline{C_{D}}$
, r.m.s. lift coefficient
 $C_{L,rms}$
, Strouhal number
 $\mathit{St}$
.

Figure 4 shows distributions of
 $U/U_{\infty }$
and
 $u^{\prime }/U_{\infty }$
along the vertical line at different positions compared with the experimental results (Norberg Reference Norberg1987; Lam et al.
Reference Lam, Wang and So2004b
) and the LES results of Lam & Lin (Reference Lam and Lin2008) using the fine-grid model. Consequently, the present results for
 $U/U_{\infty }$
and
 $u^{\prime }/U_{\infty }$
agree well with the experimental and numerical results, regardless of the different grid systems, as shown in figure 4.
Mean streamwise velocity
 $U/U_{\infty }$
(
 $a$
) and r.m.s. streamwise velocity
 $u^{\prime }/U_{\infty }$
(
 $b$
) distributions of a smooth cylinder at different positions in the wake centreline compared with experimental and LES results at
 $\mathit{Re}=3000$
.

In order to quantitatively verify the present numerical method and grid systems, the present results for the time-averaged drag coefficient (
 $\overline{C_{D}}$
), the r.m.s. value of lift fluctuation (
 $C_{L,rms}$
) and the Strouhal number (
 $\mathit{St}$
) were compared with results from previous studies. In the present study, the drag coefficient (
 $C_{D}$
) and lift coefficient (
 $C_{L}$
) are defined by
 $$\begin{eqnarray}\displaystyle & \displaystyle C_{D}=\frac{2F_{D}}{{\it\rho}U_{\infty }^{2}D_{m}L}, & \displaystyle\end{eqnarray}$$
 $$\begin{eqnarray}\displaystyle & \displaystyle C_{L}=\frac{2F_{L}}{{\it\rho}U_{\infty }^{2}D_{m}L}, & \displaystyle\end{eqnarray}$$
 ${\it\rho}$
is the fluid density,
 $D_{m}$
is the mean diameter of each cylinder,
 $L$
is the spanwise length of the cylinder, and
 $F_{D}$
and
 $F_{L}$
are the total drag and lift forces, respectively. The Strouhal number is the non-dimensional vortex shedding frequency (
 $f_{s}$
) and is defined as
 $$\begin{eqnarray}\mathit{St}=\frac{f_{s}D_{m}}{U_{\infty }}.\end{eqnarray}$$
The frequency of vortex shedding,
 $f_{s}$
, is obtained by fast Fourier transform of the time history of the lift coefficient.
Table 1 compares the results with experimental data (Norberg Reference Norberg1987, Reference Norberg2003) and LES results (Lam & Lin Reference Lam and Lin2008). The results of our computations are found to be in fairly good agreement with the experimental data (Norberg Reference Norberg1987, Reference Norberg2003) and with the 3D simulation results obtained by Lam & Lin (Reference Lam and Lin2008).
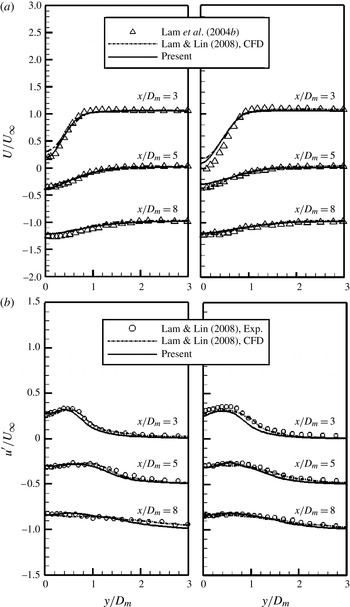
As mentioned previously, the wavy cylinder is considered to be another comparison case. Thus, our results for the wavy cylinder for
 $U/U_{\infty }$
and
 $u^{\prime }/U_{\infty }$
are compared with the experimental results (Lam et al.
Reference Lam, Wang and So2004b
) and LES results of Lam & Lin (Reference Lam and Lin2008), as shown in figure 5. There is excellent agreement between the present results and the experimental measurements. However, in the saddle planes at the position
 $x/D_{m}=3$
, a small discrepancy in the values of
 $U/U_{\infty }$
can be observed between our results and the experimental (Lam et al.
Reference Lam, Wang and So2004b
) and LES results (Lam & Lin Reference Lam and Lin2008). Lam et al. (Reference Lam, Wang and So2004b
) reported that the end point of the reverse flow position is near the position
 $x/D_{m}=3$
. Therefore,
 $x/D_{m}=3$
is a highly sensitive region for the streamwise velocity distributions at a similar subcritical Reynolds number (Lam & Lin Reference Lam and Lin2008). This gave rise to a small difference in the velocity profile between our results and the experimental results. In general, the present results for
 $U/U_{\infty }$
and
 $u^{\prime }/U_{\infty }$
agree reasonably well with previous experimental and computational results, thus confirming the validity of our computation.
Mean streamwise velocity
 $U/U_{\infty }$
(a: node) and r.m.s. streamwise velocity
 $u^{\prime }/U_{\infty }$
(b: saddle) distributions of a wavy cylinder at different positions in the wake centreline compared with experimental and LES results at
 $\mathit{Re}=3000$
.

For the twisted cylinder, a grid dependence test was performed, and the results are summarized in table 2. Even though experimental data on the flow over the twisted cylinder are not yet available, assessments of the effect of grid resolution on the calculated solutions were conducted. The numbers of coarse, medium and fine grids were 2.5, 3.5, and 4.5 million, respectively. A number of uniform layers from 80 to 100 was considered with increasing total grid numbers. Grid stretching was employed to increase the grid resolutions near the surface and in the wake region, ensuring that there were at least 40 nodes in the vorticity thickness over the surface in the attached boundary-layer region. Curve-fitting coordinates were used. The different grid systems passed the grid dependence tests for small variations in the values of
 $\overline{C_{D}}$
,
 $C_{L,rms}$
and
 $\mathit{St}$
. As a result, the grid dependence test for the twisted cylinder was satisfied, and the medium-grid system is employed to discuss the results.
Grid dependence test for a twisted cylinder at
 $\mathit{Re}=3000$
: mean drag coefficient
 $\overline{C_{D}}$
, r.m.s. lift coefficient
 $C_{L,rms}$
, Strouhal number
 $\mathit{St}$
.

3. Results and discussion
3.1. Drag, lift coefficients and the Strouhal number
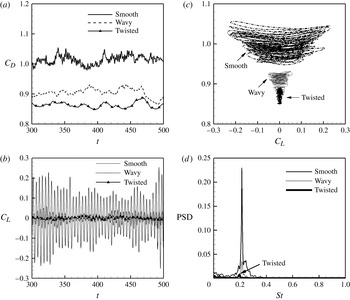
Figure 6 shows drag and lift coefficients (
 $C_{D}$
and
 $C_{L}$
) as a function of time for three different cylinders. The values of
 $C_{D}$
and
 $C_{L}$
for the wavy cylinder are much lower than those of the smooth cylinder over the whole computational time, which can be understood by observing the time histories of
 $C_{D}$
and
 $C_{L}$
as shown in figures 6(a) and (b), respectively. These results are consistent with the findings of Lam et al. (Reference Lam, Wang, Li and So2004a
,Reference Lam, Wang and So
b
), Lam & Lin (Reference Lam and Lin2007, Reference Lam and Lin2008), Lee & Nguyen (Reference Lee and Nguyen2007) and Xu et al. (Reference Xu, Chen and Lu2010), who confirmed that the wavy cylinder achieves a significant reduction of drag and lift in comparison with a smooth cylinder.
Time histories of (a) the drag coefficients and (b) the fluctuating lift coefficients; (c) phase-space plot of the force coefficients; (d) power spectral density (PSD) of the time-dependent lift coefficient for different cylinders at
 $\mathit{Re}=3000$
.

Furthermore, the twisted cylinder gives a greater reduction in
 $C_{D}$
and
 $C_{L}$
than the reduction due to the wavy cylinder, as compared with the smooth cylinder. In particular, the oscillating amplitude of the lift coefficient for the twisted cylinder is greatly decreased compared with the smooth and wavy cylinders, as shown in figure 6(b).
We considered the phase diagram plot of the time history of lift versus drag to clearly compare the time-dependent forces of the different types of cylinders, as shown in figure 6(c). Among the three types of cylinders, the twisted cylinder has the narrowest region wherein the time variation of the force coefficients is limited. In addition, this region has the smallest values, indicating force reduction and a considerable suppression of force fluctuation.
The power spectral densities of the time-dependent lift coefficients of different cylinders are plotted in figure 6(d) in order to identify the frequency of vortex shedding. The Strouhal number (
 $\mathit{St}$
) of the wavy cylinder is approximately 0.21, similar to that of the smooth cylinder at the same Reynolds number. However, the twisted cylinder has a smaller value of
 $\mathit{St}$
than the smooth and wavy cylinders (
 $\mathit{St}=0.190$
). This lower value of
 $\mathit{St}$
is associated with a much longer vortex formation length and the nearly suppressed oblique vortex shedding in the near wake behind the twisted cylinder. These wake structures will be discussed in §§ 3.2 and 3.3 in terms of the instantaneous vortical structures and vortex formation length. In addition, the spectral peaks for the twisted cylinder are relatively weak, indicating an almost complete suppression of flow unsteadiness.
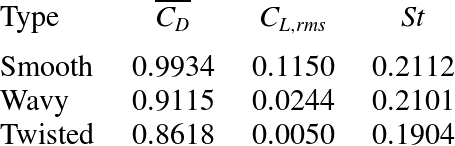
Table 3 summarizes the time-averaged drag coefficient (
 $\overline{C_{D}}$
), the r.m.s. value of the lift coefficient (
 $C_{L,rms}$
) and
 $\mathit{St}$
for the three types of cylinders. The
 $\overline{C_{D}}$
and
 $C_{L,rms}$
values of the wavy cylinder are less than those of the smooth cylinder, with reduction rates of approximately 8 and 78 %, respectively. For the conditions of waviness used in this study, the present reduction rate is quite consistent with that of Lam & Lin (Reference Lam and Lin2008). The twisted cylinder achieves approximately 13 and 5 % reductions in
 $\overline{C_{D}}$
compared with the smooth and wavy cylinders, respectively. Furthermore, the value of
 $C_{L,rms}$
for the twisted cylinder is much less than that for the smooth cylinder, with a reduction rate of up to 96 %. Compared with the values of
 $C_{L,rms}$
, we note that the fluctuating force on the twisted cylinder is significantly suppressed.
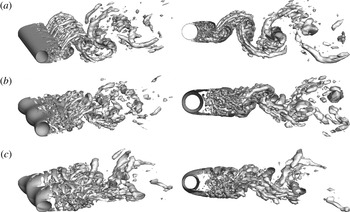
Perspective view (left column) and side view (right column) of the isosurface of swirl strength of (a) the smooth, (b) the wavy and (c) the twisted cylinder at
 $\mathit{Re}=3000$
.

Comparison of the force coefficients and Strouhal number for the three different cylindrical structures (smooth, wavy and twisted). These mean values are obtained from the medium-grid system at
 $\mathit{Re}=3000$
: mean drag coefficient
 $\overline{C_{D}}$
, r.m.s. lift coefficient
 $C_{L,rms}$
, Strouhal number
 $\mathit{St}$
.

3.2. Instantaneous vortical structures
Figure 7 shows the instantaneous vortical structures at a Reynolds number of 3000 for the twisted, smooth and wavy cylinders. In order to define these 3D vortical structures, we adopted the method given by Zhou et al. (Reference Zhou, Adrian, Balachandar and Kendall1999). They defined a vortical region as a region with negative
 ${\it\lambda}_{2}$
, the second largest eigenvalue of
 $\mathsf{S}_{ij}^{2}+{\it\Omega}_{ij}^{2}$
, where
 $\mathsf{S}_{ij}^{2}$
and
 ${\it\Omega}_{ij}^{2}$
are the strain rate tensor and rotation rate tensor, respectively.
Our smooth cylinder results clearly reveal that large-scale Kármán vortices are formed in the near-wake region, as shown in figure 7(a). However, the vortex roll-up of the separated shear layer from the wavy cylinder is delayed to a downstream position. Therefore, the vortex shedding nearly disappears in the near wake of the wavy cylinder and reappears weakly in the far wake, compared with the smooth cylinder, as shown in figure 7(b). This modification of the vortical structures due to waviness is consistent with the findings from other computational (Lam & Lin Reference Lam and Lin2008; Xu et al. Reference Xu, Chen and Lu2010) and experimental studies (Lam et al. Reference Lam, Wang and So2004b ; Zhang et al. Reference Zhang, Dai and Lee2005).
For the twisted cylinder, the shear layer is more elongated downstream, and the vortex is shed farther from the body than that of the wavy cylinder, as shown in figure 7(c). The region of non-existence of small-scale eddies in the near wake is much wider than that of the wavy cylinder in figure 7(b). Consequently, the initial formation of the vortical structure is delayed in the downstream direction, and the Kármán vortex rollers are significantly weakened farther downstream, as shown in figure 7(c). This elongation of the shear layer from the body, and the near disappearance of vortex shedding in the near wake with weak vortical strength, contribute directly to a reduction in drag and lift oscillation. Moreover, 3D forcing as the active control, as considered by Kim & Choi (Reference Kim and Choi2005), caused about the same modification of vortical structures in the wake of the smooth cylinder with shape modification as the wavy and twisted cylinders, thus leading to reductions in drag and lift oscillation.
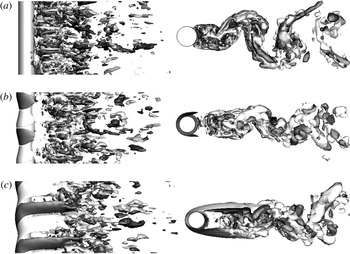
Elongation of the shear layer from the body and the near disappearance of vortex shedding in the near wake are also clearly identified by the vorticity components. Thus, representatively, we note that the transverse vorticity
 ${\it\omega}_{y}$
confirms the elongation of the shear layer from the body. It also confirms the near disappearance of vortex shedding in the near wake observed from the isosurface of swirling strength, as shown in figure 7.
Figure 8 shows the isosurfaces of the instantaneous transverse vorticities (
 ${\it\omega}_{y}=\pm 1.5$
) for the smooth, wavy and twisted cylinders. The isosurfaces of the instantaneous transverse vorticities immediately behind the wavy cylinder reveal regimes of zero vorticity centred adjacent to the saddle planes shown in figure 8(b), which can be clarified by comparison with the dense distribution of
 ${\it\omega}_{y}$
behind the smooth cylinder, as shown in figure 8(a). Regimes of zero vorticity (the recovery region) behind the wavy cylinder were also reported by Lam & Lin (Reference Lam and Lin2008). For the twisted cylinder, the patterns of near-wake transverse vorticity appear to be well organized and coherent with significantly elongated isosurfaces of
 ${\it\omega}_{y}$
, as distinctly seen in the top view of the isosurfaces of
 ${\it\omega}_{y}$
shown in figure 8(c). In particular, the twisted cylinder forms much wider regimes of zero vorticity than the wavy cylinder.
Top (left column) and side (right column) views of the isosurface of transverse vorticity for (a) the smooth, (b) the wavy and (c) the twisted cylinder at
 $\mathit{Re}=3000$
.

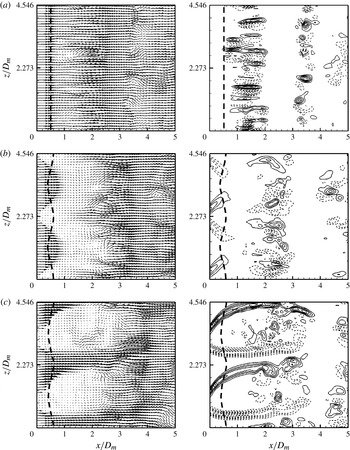
Figure 9 shows the instantaneous velocity vectors and transverse vorticity (
 ${\it\omega}_{y}$
) contours in the horizontal (
 $x$
–
 $z$
) plane near the cylinder’s surface
 $(\,y/D_{m}=-0.6)$
for the three different cylinders. Behind the smooth cylinder, the formation locations of the vorticities shown in figure 9(a) correspond to those of the isosurface of the swirl strength as shown in figure 7(a). Although positive and negative vorticities appear in the instantaneous velocity field of the smooth cylinder, they are distributed in a seemingly random manner, especially near the rear stagnation point (Lin, Towfighi & Rockwell Reference Lin, Towfighi and Rockwell1995; Zhang et al.
Reference Zhang, Dai and Lee2005) (not shown here for the sake of brevity). However, the positions of the vorticities are locked spatially in the streamwise direction as shown in figure 9(a). These results are in good agreement with those of Wu, Sheridan & Welsh (Reference Wu, Sheridan and Welsh1996) and Zhang et al. (Reference Zhang, Dai and Lee2005).
Instantaneous velocity vectors (left column) and transverse vorticity contours (right column) in the
 $x$
–
 $z$
plane at
 $y/D_{m}=-0.6$
for (a) the smooth, (b) the wavy and (c) the twisted cylinder at
 $\mathit{Re}=3000$
. Here, the same levels are used for the transverse vorticity contours in each figure.

For the wavy cylinder, the magnitude of the velocity vectors’ near wake is smaller than that of the smooth cylinder. Successively, the instantaneous transverse vorticity behind the wavy cylinder is distributed farther downstream at the approximate location of
 $x/D_{m}=2$
, as shown in figure 9(b). Thus, the existence of zero-vorticity regimes, as shown in figure 8(b) for the isosurfaces of
 ${\it\omega}_{y}$
, is confirmed by the velocity vectors and
 ${\it\omega}_{y}$
contours in this plane. In contrast to the smooth cylinder, due to the presence of waviness, the flow above the node has a low speed because the node of maximum diameter plays a blocking role with respect to the approaching flow. Therefore, the relatively low-speed flow above the node entrains into the high-speed flow above the saddle with the minimum diameter. Consequently, above the wavy cylinder, the transverse vorticity reveals a well-organized pattern that is not observed for the case of the smooth cylinder. This vorticity above the surface has large values at the locations above each nodal point of the wavy cylinder, and the incline toward the saddle. These results are consistent with the observations reported in Zhang et al. (Reference Zhang, Dai and Lee2005).
The twisted cylinder produces periodic distributions of instantaneous velocity vectors and transverse vorticity along the spanwise direction up to a location farther downstream, as shown in figure 9(c), compared with the wavy cylinder. The dependence of the flow field’s near wake on the twisted shape is similar to that of the wavy cylinder. Namely, the high-speed flow above the trough with the minor axis rushes downstream and the low-speed flow appears above the crest corresponding to the major axis. We note that a cylinder with a helical surface perturbation reveals a spatially periodic pattern of wake-like flows along the span of the cylinder (Chyu & Rockwell Reference Chyu and Rockwell2002). The present twisted cylinder also produces a spatially periodic sequence of wake-like patterns that have characteristics common to the very near wake of a 2D bluff body. The elongated vorticity layers bound a large defect in velocity and they fluctuate from their tails with small-scale vorticity concentrations.
Contours of the time-averaged spanwise vorticity in the
 $x$
–
 $y$
plane for three cylinders at
 $\mathit{Re}=3000$
. (a) Smooth cylinder and wavy cylinder: (b) node, (c) middle and (d) saddle. Twisted cylinder: (e)
 ${\it\Phi}=0^{\circ }$
, ( f)
 ${\it\Phi}=45^{\circ }$
, (g)
 ${\it\Phi}=90^{\circ }$
and (h)
 ${\it\Phi}=135^{\circ }$
.

These wake-like flows could also be interpreted as jet-like flows. It is known from hydrodynamic stability theory that a simple planar jet has two modes of instability: sinuous and varicose (Drazin & Reid Reference Drazin and Reid1981). As shown by the schematic in figure 9(c), the velocity vectors exhibit a series of vortex pairs along the oscillating jet centreline (high-speed flow) that are connected to the periodic (plus–minus) oscillation of the transverse velocity and the fluctuation in the longitudinal velocity. This results in jet-like flows in the near wake of the twisted cylinder. From the patterns behind the twisted cylinder, the separated free-shear layers are relatively more stable, and then roll up into vortices farther downstream, leading to a reduction of the suction near the base region of the twisted cylinder.
3.3. Vortex formation length, pressure coefficient and 3D separation
3.3.1. Vortex formation length
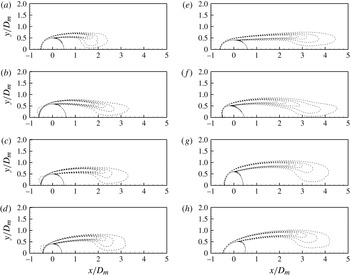
The vortex formation length behind the cylinder is the important quantity because it greatly affects the wake pressure and the force coefficients exerted on the cylinder. Elongation of the vortex formation length is achieved by the surface and shape modifications corresponding to the waviness and the twisted shape, respectively, which is observed in the instantaneous vortical structures shown in figures 7–9. Successively, the time-averaged flow fields in the near wakes of the wavy and twisted cylinders are characterized by vortex elongation. As shown in figure 10, the contours of the mean spanwise vorticity for various spanwise positions behind the wavy and twisted cylinders confirm vortex elongation in the near wake in comparison with the smooth cylinder. In particular, the spanwise vorticity length of the twisted cylinder is much longer than that of the wavy cylinder, regardless of the span. This is demonstrated by comparing the different span locations (node, middle, saddle) of the wavy cylinder and those of the twisted cylinder (
 ${\it\Phi}=0^{\circ }$
,
 ${\it\Phi}=45^{\circ }$
,
 ${\it\Phi}=90^{\circ }$
,
 ${\it\Phi}=135^{\circ }$
), as shown in figures 10(b–h), respectively.
Furthermore, the width of the spanwise vorticity increases and decreases alternately on increasing
 ${\it\Phi}$
from 0 to 180°. When the pitch angle changes from
 ${\it\Phi}=0$
to
 ${\it\Phi}=90^{\circ }$
, the aligned axis of the major axis changes from the
 $x$
-axis (streamwise) to the
 $y$
-axis (transverse). Therefore, we note that the body changes from a streamlined shape into a bluff shape on increasing
 ${\it\Phi}$
from 0 to 90°, as shown in figures 10(e–g). As a result, the width of the spanwise vorticity increases as
 ${\it\Phi}$
is increased from 0 to 90°. When the pitch angle changes from
 ${\it\Phi}=90$
to
 ${\it\Phi}=180^{\circ }$
(or 0°), the variation of the spanwise vorticity width is opposite to that in the range from
 $0^{\circ }\leqslant {\it\Phi}\leqslant 90^{\circ }$
, as shown in figures 10(g), (h) and (e), respectively.
Due to the 3D-dependent shape of the wavy and twisted cylinders, the elongation length of the vorticity, which is measured from the end of the cylinder, varies along the span of the cylinder. However, the definition of the vortex formation length is not universal; rather, it varies among researchers (Bloor Reference Bloor1964; Gerrard Reference Gerrard1978; Norberg Reference Norberg1998; Govardhan & Williamson Reference Govardhan and Williamson2001). Frequently, the location of the time-averaged closure point where the mean streamwise velocity on the wake centreline is zero (wake closure length,
 $L_{fc}$
) and the location along the wake centreline where the r.m.s. of the streamwise velocity reaches a maximum (
 $L_{fu}$
) have been used to measure the formation length. Thus, we considered both locations to define the vortex formation length.
Figure 11 shows the mean streamwise velocity (
 $U/U_{\infty }$
) and the r.m.s. of the streamwise velocity (
 $u^{\prime }/U_{\infty }$
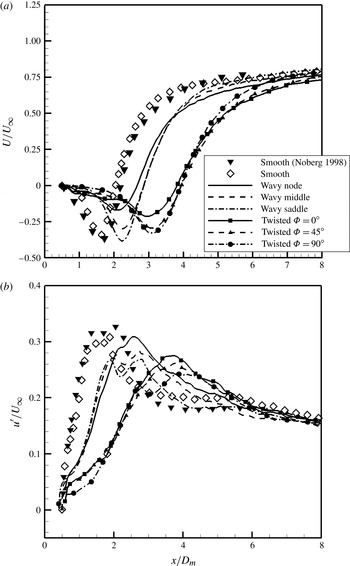
) along the centreline for different cylinders. The velocity recovery speed is related to the vortex formation length, defined as
 $L_{fc}$
(wake closure length). The variation of
 $U/U_{\infty }$
along the centreline is shown in figure 11(a). The position of
 $U/U_{\infty }(P_{U0})$
is strongly dependent on the shape of the cylinder. Thus, the
 $P_{U0}$
of the twisted cylinder is located farther downstream from the centre of the cylinder compared with the smooth and wavy cylinders, regardless of the span of the cylinder. Moreover, the position of the maximum value
 $u^{\prime }/U_{\infty }$
(
 $P_{Urms}$
) along the centreline reveals the same dependence on the cylinder shape as
 $P_{U0}$
. As a result, the
 $P_{Urms}$
of the twisted cylinder occurs farther downstream in comparison with the smooth and wavy cylinders, as shown in figure 11(b). In addition, the twisted cylinder presents a smaller maximum value of
 $u^{\prime }/U_{\infty }$
than the smooth and wavy cylinders, which is related to a weak wake, as previously described in relation to the vortical structures. Regardless of the cylinder shape, the maximum value of
 $u^{\prime }/U_{\infty }$
always occurs slightly upstream of the mean wake closure point, which is consistent with the findings reported in previous studies (Norberg Reference Norberg1998; Lam et al.
Reference Lam, Wang and So2004b
; Lam & Lin Reference Lam and Lin2008).
(a) Mean streamwise velocity (
 $U/U_{\infty }$
) and (b) r.m.s. of the streamwise velocity (
 $u^{\prime }/U_{\infty }$
) along the wake centreline for the three different cylindrical structures (smooth, wavy, and twisted) at
 $\mathit{Re}=3000$
.

The
 $P_{U0}$
and
 $P_{Urms}$
values are used to define the wake closure length (
 $L_{fc}$
) and the maximum turbulence intensity length (
 $L_{fu}$
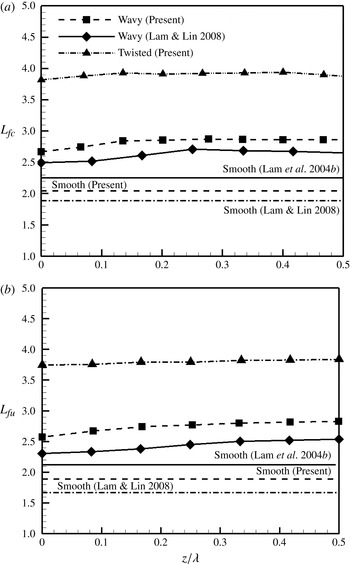
) in terms of the vortex formation length, as shown in figures 12(a) and (b), respectively. Along the spanwise direction of the wavy cylinder,
 $L_{fc}$
increases from the node to the middle, and then almost converges in the range from the middle to the saddle. This dependence of
 $L_{fc}$
on the spanwise direction is consistent with the results of Lam & Lin (Reference Lam and Lin2008), as shown in figure 12(a). The values of
 $L_{fc}$
at the node and the saddle of the wavy cylinder are approximately 30 and 40 % longer than those of the smooth cylinder, respectively. These increased rates according to the span of the wavy cylinder are similar to the results of Lam & Lin (Reference Lam and Lin2008), even though a comparison of the value of
 $L_{fc}$
reveals a discrepancy between the present study and that of Lam & Lin (Reference Lam and Lin2008). The twisted cylinder presents an increase of more than 86 % in the value of
 $L_{fc}$
in comparison with the smooth cylinder, regardless of the span. Compared with the wavy cylinder, the formation region of the twisted cylinder is much longer.
Two definitions of the vortex formation length, (a) the wake closure length (
 $L_{fc}$
) and (b) the maximum turbulence intensity length (
 $L_{fu}$
), for the three different cylindrical structures (smooth, wavy and twisted) at
 $\mathit{Re}=3000$
.

The value of
 $L_{fu}$
increases monotonically from the node to the saddle of the wavy cylinder with increasing rates of 40 and 45 % at the node and saddle, respectively, compared with the smooth cylinder, as shown in figure 12(b). The increase in the value of
 $L_{fu}$
is larger than that of
 $L_{fc}$
compared with the smooth cylinder. This pattern is also confirmed by the results of Lam et al. (Reference Lam, Wang and So2004b
) and Lam & Lin (Reference Lam and Lin2008). The twisted cylinder reveals a considerable increase of approximately 99 % in
 $L_{fu}$
compared with the smooth cylinder.
3.3.2. Pressure coefficient and 3D separation
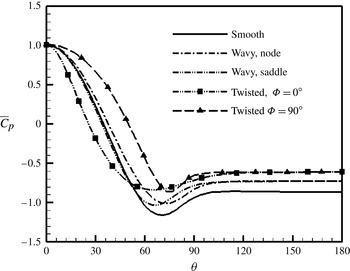
Drag reduction can be predicted by analysing the circumferential pressure distributions of different cylinders. As is well known, at the Reynolds numbers considered here, the pressure force plays a dominant role in the total forces acting on the cylinder. The mean pressure coefficients (
 $\overline{C}_{p}$
) along the circumferential direction (
 ${\it\theta}$
) are plotted in figure 13 for the different cylinders. In addition, the distributions of
 $\overline{C}_{p}$
at different spans of the wavy and twisted cylinders are shown in figure 13.
Mean circumferential pressure distributions for the wavy and twisted cylinders compared with that of the smooth cylinder at
 $\mathit{Re}=3000$
.

In the range of the cylinder base, the wavy cylinder reveals that the value of
 $\overline{C}_{p}$
is almost independent of the span, resulting in a collapse of the pressure distributions at different spans. This pattern of
 $\overline{C}_{p}$
for the wavy cylinder is similar to computational results obtained by Xu et al. (Reference Xu, Chen and Lu2010). Moreover, the twisted cylinder has about the same pattern of
 $\overline{C}_{p}$
as the wavy cylinder in the range of the cylinder base. Thus, the mean base pressure coefficients (
 $\overline{C}_{pb}$
) at different spans of the twisted cylinder have the nearly same value, which is apparently higher than those of the smooth and wavy cylinders, as shown in figure 13.
The length of the reversed flow region behind the bluff bodies has a strong relationship to the mean base pressure coefficient (
 $\overline{C}_{pb}$
). The formation length (
 $L_{f}$
) is approximately inversely proportional to the mean base pressure coefficient for a smooth cylinder (Bearman Reference Bearman1965); i.e.
 $L_{f}=C/(-\overline{C}_{pb})$
. The
 $C$
value is in the range of 1.6–1.8 in the Re range from 1000 to 9000. In addition, at the subcritical Reynolds number, the mean drag coefficient is proportional to
 $-\overline{C}_{pb}$
. Therefore, longer vortex formation regions can provide a greater reduction in the drag coefficient and an even greater suppression in the fluctuating lift coefficient.
In the present simulation, based on Bearman’s relation between the formation length and
 $-\overline{C}_{pb}$
(Bearman Reference Bearman1965), the values of
 $C$
for the smooth and wavy cylinders are about
 $C=1.78$
and
 $C=1.96$
at
 $\mathit{Re}=3000$
, respectively. Thus, the aforementioned relationship between the drag force and the formation length suggests a maximum drag force reduction of 9.7 %, which is in good agreement with our simulation results of a drag force reduction of up to 9 %, as shown in figure 6(a).
For the twisted cylinder, the values of
 $C$
are in the range of 2.35–2.37, resulting in a maximum drag force reduction of 33 %. This result is about twice that of our simulation results of a drag force reduction of up to 15 %, as shown in figure 6(a). Therefore, based on the present results, we cannot conclude that the average vortex formation lengths of twisted cylinders are also inversely proportional to the mean drag coefficient at the present subcritical Reynolds number of 3000. However, the twisted cylinder results suggest that a longer vortex formation region can provide greater reduction of the drag coefficient, and a much greater suppression of the lift fluctuation.
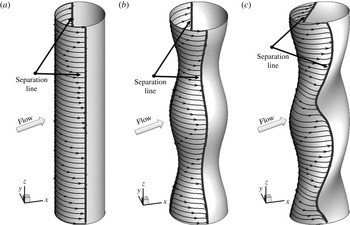
The lowest mean pressure coefficient point on the twisted and wavy cylinders varies over different cross-sections, as shown in figure 13. This means that the separation line of the twisted and wavy cylinders changes along the spanwise direction. In order to clarify the spanwise-dependent separation line of the twisted and wavy cylinders, the limiting streamlines (the skin friction lines) on the surface for the different cylinders are shown in figure 14. The limiting streamlines are obtained by calculating the streamlines of wall shear stress or skin friction, which is defined as the wall-normal derivative of the velocity vector at the wall.
Limiting streamlines (the skin friction lines) on the surface for (a) the smooth, (b) the wavy and (c) the twisted cylinder at
 $\mathit{Re}=3000$
.

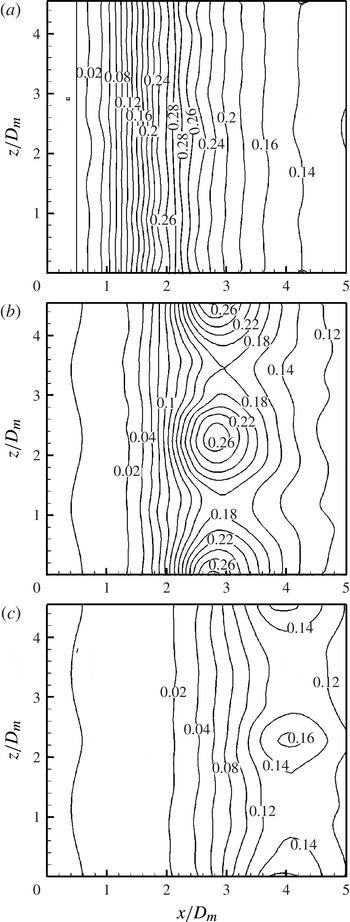
Contours of the TKE in the
 $x$
–
 $z$
plane for (a) the smooth, (b) the wavy and (c) the twisted cylinder at
 $\mathit{Re}=3000$
.

In contrast to the smooth cylinder, the wavy cylinder produces 3D separation. This wave-like 3D separation has an important effect on the stable development of the separated shear layers of the turbulent wake behind the wavy cylinder (Zhang et al. Reference Zhang, Dai and Lee2005; Xu et al. Reference Xu, Chen and Lu2010). In particular, the twisted cylinder significantly modifies the convergence line of the limiting streamlines, even compared with the wavy cylinder. Thus, we conclude that this stronger 3D separation contributes to a more stable development of the separated shear layers behind the twisted cylinder.
3.4. Turbulent kinetic energy
Turbulent fluctuations around a body are associated with the fluctuating forces exerted on it (Wu, Lu & Zhuang Reference Wu, Lu and Zhuang2007). The contours of the turbulent kinetic energy (TKE) in the
 $x$
–
 $z$
plane for different cylinders are plotted in figure 15. The wavy cylinder exhibits negligibly small TKE in the near wake (from cylinder base to
 $x/D_{m}\approx 1.4$
) in comparison with the smooth cylinder, which can be clarified by comparing the smooth and wavy cylinders shown in figures 15(a) and (b), respectively. The TKE distribution behind the wavy cylinder shows periodic variations along the spanwise direction and resembles the geometric shape of the cylinder, in contrast to the uniform distribution of the smooth cylinder. The maximum TKE in the nodal plane is higher than the TKE in the saddle and middle planes. Moreover, the positions of maximum TKE are farther from the back of the wavy cylinder than from the back of the smooth cylinder. These characteristics of the TKE distribution of the wavy cylinder are consistent with the findings of Zhang et al. (Reference Zhang, Dai and Lee2005) and Lam & Lin (Reference Lam and Lin2008).
In the near wake, the twisted cylinder forms a considerably wider wake region where negligible TKE is present, as shown in figure 15(c), compared with the smooth and wavy cylinders. The TKE distribution behind the twisted cylinder shows periodic variations along the spanwise direction; this is similar to the wavy cylinder. However, the position of the maximum TKE value is farther from the back of the twisted cylinder than from the backs of the smooth and wavy cylinders. The maximum TKE of the twisted cylinder occurs at approximately
 $x/D_{m}=4$
, and the maximum values of the TKE for the smooth and wavy cylinders appear at downstream locations of approximately
 $x/D_{m}=2$
and
 $x/D_{m}=2.7$
, respectively. The overall values of the TKE behind the twisted cylinder are smaller than those of the smooth and wavy cylinders at
 $\mathit{Re}=3000$
. These features are consistent with the elongation of the vortex formation length and the lower turbulence intensity shown in figures 11 and 12. Consequently, the significant reduction in TKE in the near wake of the twisted cylinder contributes to a reduction in the drag and fluctuating lift.
3.5. Effect of the cross-sectional aspect ratio on flow over the twisted cylinder
In this section, we simply discuss the effect and the optimal range of the aspect ratio for the range of
 $1.25\leqslant A/B\leqslant 2.25$
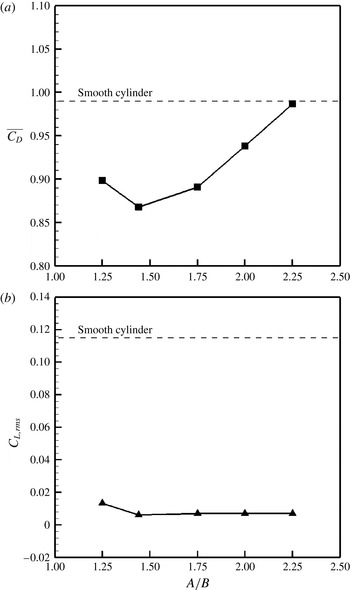
from the point of view of aerodynamic performance. Figure 16 shows the mean drag and fluctuating lift coefficients according to
 $A/B$
, which is defined as the ratio of cross-section height to width. Regardless of
 $A/B$
, all the values of the mean drag and r.m.s. lift coefficients are smaller than those of the smooth cylinder. The mean drag coefficient of the twisted cylinders drops to a minimum at a certain aspect ratio and increases again as
 $A/B$
increases, as shown in figure 16(a). A maximum drag reduction of up to 13 % is achieved for a value of
 $A/B=1.44$
, compared with the smooth cylinder. We conjecture that the optimal value of the aspect ratio will be around
 $A/B=1.44$
, indicating the minimum mean drag coefficient. In the case of the fluctuating lift coefficients, the values are almost constant, varying with
 $A/B$
except for
 $A/B=1.25$
, as shown in figure 16(b). A maximum reduction of the fluctuating lift coefficient of up to 96 % is obtained at a value of
 $A/B=1.44$
in comparison with the smooth cylinder.
(a) Mean drag and (b) r.m.s. lift coefficients, according to the aspect ratio of the twisted cylinder at
 $\mathit{Re}=3000$
.

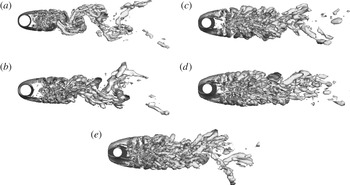
Figure 17 shows the instantaneous vortical structures according to
 $A/B$
. In the range of
 $1.25\leqslant A/B\leqslant 1.44$
, the positions of the small-scale eddies move rapidly farther away from the back of the twisted cylinder with increasing
 $A/B$
, as shown in figures 17(a,b). However, for the case in which
 $A/B$
is greater than 1.75, the positions of the small-scale eddies gradually approach the base of the cylinder with increasing Re, implying an augmentation of suction near the base region of the twisted cylinder, as shown in figures 17(c–e). Namely, these features are very closely associated with increasing the drag, which is confirmed by the results of the variation of the mean drag and r.m.s. lift coefficients with
 $A/B$
, as shown in figure 16. As a result, the aspect ratio of the twisted cylinder plays an important role in the control of the flow structures, affecting the mean drag and fluctuating lift forces.
Isosurface of swirl strength according to
 $A/B$
value for (a) 1.25, (b) 1.44, (c) 1.75, (d) 2.0 and (e) 2.25 at
 $\mathit{Re}=3000$
.

3.6. Effect of Reynolds number on flow over the twisted cylinder
In this section, we discuss the effect of the Reynolds number on flow around the twisted cylinder. For
 $\mathit{Re}=3000$
, our evaluation of aerodynamic characteristics for the twisted cylinder in the range
 $1.25\leqslant A/B\leqslant 2.25$
indicates that the best aerodynamic performance is obtained at
 $A/B=1.44$
. Thus, for
 $A/B=1.44$
, the effect of the Reynolds number on the aerodynamic characteristics was investigated for the range
 $3\times 10^{3}\leqslant \mathit{Re}\leqslant 1\times 10^{4}$
.
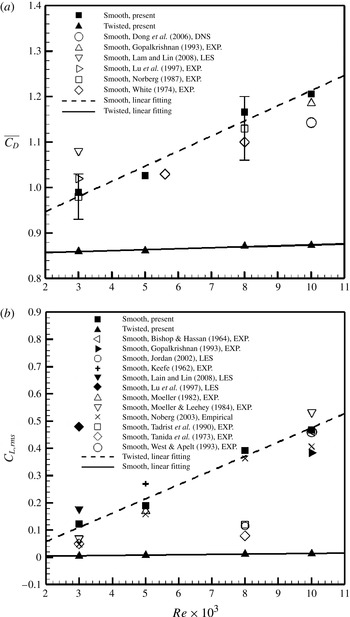
Figure 18 shows the variation of the mean drag and r.m.s. fluctuating lift coefficients as a function of Re for the smooth and twisted cylinders, compared with previous experimental and simulation results by various researchers (Keefe Reference Keefe1962; Bishop & Hassan Reference Bishop and Hassan1964; Tanida, Okajima & Watanabe Reference Tanida, Okajima and Watanabe1973; White Reference White1974; Moeller Reference Moeller1982; Moeller & Leehey Reference Moeller, Leehey, Paidoussis, Griffin and Sevik1984; Norberg Reference Norberg1987; Tadrist et al.
Reference Tadrist, Martin, Tadrist and Seguin1990; Gopalkrishnan Reference Gopalkrishnan1993; West & Apelt Reference West and Apelt1993; Lu, Dalton & Zhang Reference Lu, Dalton and Zhang1997; Jordan Reference Jordan2002; Norberg Reference Norberg2003; Dong et al.
Reference Dong, Karniadakis, Ekmekci and Rockwell2006; Lam & Lin Reference Lam and Lin2008). In the case of the smooth cylinder, the mean drag and r.m.s. lift coefficients rapidly increase with increasing Re. These features are consistent with experimental and simulation results, as previously mentioned, which indicates that the shear layer instability from the separation point of the body develops with increasing Re. Similarly to the characteristics of the statistical quantities for the smooth cylinder, the mean drag and r.m.s. fluctuation lift coefficients of the twisted cylinder also increase as Re increases. However, the maximum augmentation of the mean drag coefficient of the twisted cylinder is within 1 %, whereas a maximum augmentation of the mean drag coefficient of the smooth cylinder of up to 21 % is obtained with increasing Re, as shown in figure 18(a). Moreover, the increase in the r.m.s. lift coefficient of the twisted cylinder seems to be negligible in comparison with that of the smooth cylinder, as shown in figure 18(b). These trends suggest that regardless of increasing Re, the geometry of the twisted cylinder effectively controls the flow structures, which contributes directly to the reduction of the drag and the lift oscillation compared with the smooth cylinder. The increments of the mean drag and r.m.s. lift coefficients are governed by the linear function
 $f\approx a\cdot \mathit{Re}$
, where
 $f$
and
 $a$
are the variables of the force coefficient and slope, respectively. For the mean drag and r.m.s. lift coefficients, the slopes of the smooth cylinder are about one order of magnitude higher than those of the twisted cylinder.
(a) Mean drag and (b) r.m.s. lift coefficient as a function of Re for the smooth and twisted cylinders compared with experimental and simulation results.

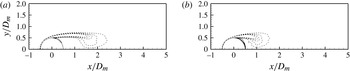
Figure 19 shows the normalized mean spanwise vorticity of the smooth cylinder at
 $\mathit{Re}=3000$
and
 $\mathit{Re}=10\,000$
. As Re increases, the spanwise vorticity length and width are smaller and thicker, respectively. These features are characterized by the location of the onset of transition, which moves upstream towards the separation point. Moreover, the large-scale Kármán vortices are formed closer to the base of the cylinder, which is consistent with the experimental and direct numerical simulation results of Dong et al. (Reference Dong, Karniadakis, Ekmekci and Rockwell2006) and other studies (Bloor Reference Bloor1964; Norberg Reference Norberg1987; Unal & Rockwell Reference Unal and Rockwell1988; Norberg Reference Norberg, Eckelmann, Graham, Huerre and Monkewitz1993, Reference Norberg1994; Lin et al.
Reference Lin, Towfighi and Rockwell1995; Norberg Reference Norberg1998).
Contours of mean spanwise vorticity in the
 $x$
–
 $y$
plane for smooth cylinders: (a)
 $\mathit{Re}=3000$
and (b)
 $\mathit{Re}=10\,000$
. Data for
 $\mathit{Re}=5000$
and 8000 have been intentionally omitted for clarity.

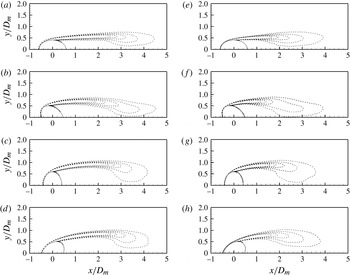
For the twisted cylinder, regardless of the pitch angle, shrinkages of the shear layer are observed, and the distributions near the tip of the vorticity layer tend to broaden with increasing Re, as shown in figure 20. Namely, in the subcritical regime, the overall patterns of the vorticity distributions of the twisted cylinder are similar to those of the smooth cylinder with increasing Re. However, the spanwise vorticity length of the twisted cylinder is much longer than that of the corresponding smooth cylinder, irrespective of any increase in Re.
Contours of mean spanwise vorticity in the
 $x$
–
 $y$
plane for twisted cylinders. Here,
 $\mathit{Re}=3000$
(a–d): (a)
 ${\it\Phi}=0^{\circ }$
, (b)
 ${\it\Phi}=45^{\circ }$
, (c)
 ${\it\Phi}=90^{\circ }$
and (d)
 ${\it\Phi}=135^{\circ }$
;
 $\mathit{Re}=10\,000$
(e–h): (e)
 ${\it\Phi}=0^{\circ }$
, ( f)
 ${\it\Phi}=45^{\circ }$
, (g)
 ${\it\Phi}=90^{\circ }$
and (h)
 ${\it\Phi}=135^{\circ }$
. Data for
 $\mathit{Re}=5000$
and 8000 have been intentionally omitted for clarity.

4. Conclusion
Flow over a twisted cylinder was investigated at a subcritical Reynolds number of 3000 using LES based on the finite volume method. For comparison, the flows past smooth and wavy cylinders were also calculated.
The forces exerted on a cylinder are important factors for the control of flow over a bluff body. As a result, the twisted cylinder achieved reductions in mean drag of approximately 13 and 5 % compared with the results for smooth and wavy cylinders, respectively. In particular, the r.m.s. value of the lift fluctuation of the twisted cylinder shows a tremendous decrease of approximately 96 % compared with the smooth cylinder. This result is confirmed by the results for the distribution of the mean pressure on the cylinder’s surface. The base pressure coefficient decreased due to the formation of a longer vortex formation length, which is the important quantity because it has a significant influence on the wake pressure, and hence the force coefficients exerted on the cylinder.
The vortex shedding of the twisted cylinder is considerably suppressed. Moreover, the twisted cylinder produces periodically elongated transverse vortices along the spanwise direction, and longer spanwise vortices farther downstream. From the patterns behind the twisted cylinder, the separated free-shear layers are relatively more stable, and then roll up into vortices farther downstream. As a result, the elongation of the shear layer from the body, and the near disappearance of vortex shedding in the near wake with weak vortical strength, contribute directly to the reduction of drag and lift oscillation.
The present twisted cylinder produced a spatially periodic sequence of wake-like patterns that have common characteristics very near the wake of a 2D bluff body. The velocity vectors exhibit a series of vortex pairs along the oscillating jet centreline connected to the periodic oscillation of the transverse velocity and the fluctuation in the longitudinal velocity, resulting in jet-like flows near the wake of the twisted cylinder. From the patterns behind the twisted cylinder, the separated free-shear layers are seen to be relatively more stable, and then roll up into vortices farther downstream. This leads to a reduction of suction near the base region of the twisted cylinder.
The twisted cylinder significantly modifies the convergence line of the limiting streamlines, even compared with the wavy cylinder. Thus, we conclude that this stronger 3D separation contributes to a more stable development of the separated shear layers behind the twisted cylinder. For the TKE distribution, the overall values of the TKE behind the twisted cylinder are smaller than those of the smooth and wavy cylinders at
 $\mathit{Re}=3000$
. These features are consistent with the elongation of the vortex formation length and the lower turbulence intensity. Consequently, the significant reduction of the TKE in the near wake of the twisted cylinder helps to reduce the drag and fluctuating lift.
Lastly, at
 $\mathit{Re}=3000$
, the effect of the cross-sectional aspect ratio (
 $A/B$
) was investigated from 1.25 to 2.25 to find an optimal value that can reduce the drag and lift forces. The result was that the best aerodynamic performance is achieved at around
 $A/B=1.44$
. Under the condition of
 $A/B=1.44$
, the effect of the Reynolds number on the aerodynamic characteristics was also investigated in the range
 $3\times 10^{3}\leqslant \mathit{Re}\leqslant 1\times 10^{4}$
. As Re increased, the mean drag and r.m.s. lift coefficients increased, and the vortex formation length decreased. However, the force coefficients exerted on the cylinder and the vortex formation length are still much smaller and longer than those of the smooth cylinder, respectively, irrespective of increase of Re.
Acknowledgements
This work was supported by a National Research Foundation of Korea (NRF) grant funded by the Korea government (MSIP) through GCRC-SOP (no. 2011-0030013 and no. 2010-0025618).