INTRODUCTION
The importance of maize (Zea mays L.) and its products in the human diet is recognized by the Food and Agriculture Organization of the United Nations (FAO 1992). However, in the European Union less than one-tenth of the maize produced is destined for human consumption as maize flour, cornstarches, breakfast cereals and other products (EUROSTAT 2005).
Little research has been carried out so far on the characteristics of maize cultivars to be used as human food. Therefore, it is appropriate to determine this in order to develop new maize varieties destined for human consumption with higher added value. Maize grain quality and technological characteristics are important for maize food industries. The quality of the grain depends on the type of maize, the environmental growing conditions and the post-harvest management (Audilakshmi & Aruna Reference Audilakshmi and Aruna2005). General aspects of quality and technology applied to maize for human diet have been described by Watson & Ramstad (Reference Watson and Ramstad1987) and Matz (Reference Matz1991).
Generally, corn flakes are made from hard endosperm maize with flint crown, yellow–orange colour and uniform size, because hard grains are required for producing larger particle size after milling. The production process of corn flakes has been detailed by Fast (Reference Fast, Fast and Caldwell1990). This type of maize has been called Plata maize, with reference to the Argentinean region where it comes from. The quality of this type of maize has been widely studied (Robutti et al. Reference Robutti, Borrás, Ferrer, Percibaldi and Knutson2000), but the genetics and breeding has been neglected. Particularly, no specific breeding programme for selecting hard-grain maize hybrids exists so far in Europe.
The grain hardness depends mainly on the relation between horny and floury endosperms and secondarily on the structure and compacting of cell components and thickness of the pericarp. The level of hardness is determined, in the cells of the endosperm, by the structure of the zeins and starches and by the bond between them (Chandrashekar & Mazhar Reference Chandrashekar and Mazhar1999). The hardness has shown a strong relationship with other quality traits, especially with grain density (Dorsey Redding et al. Reference Dorsey-Redding, Hurburgh, Johnson and Fox1991).
The main objective of the present work was to study the inheritance of the grain quality traits in hard endosperm maize preparotary to the development of new varieties with improved grain quality and agronomic value for human consumption.
MATERIALS AND METHODS
Genetic materials
The plant material used in the present study included six maize inbreds. Three had flint endosperm: EP39 is an inbred line developed from the southern Spanish population Fino of Plata type; EC13A is a first-cycle inbred line developed from the local landrace Pontedeume, Corunna, Spain; EA2024 was released from the population Colorado Klein, related to the Argentinean type of Plata maize. Three had dent endosperm: CM105 is related to the Iowa Stiff Stalk Synthetic population (BSSS); B93 was developed from the backcross population of (B70×H99)×H99 and so is related to Lancaster germplasm; EP29 was obtained from the Synthetic population AS-3(HT)C3 in the MBG, Pontevedra, Spain. Crosses among the inbreds were made in 1999, following a diallel mating system without reciprocal crosses. In 2000, the F2 and the backcross generations to each parent were obtained.
Field evaluation
The 66 genotypes derived from the six inbreds were classified into 15 groups, in such a way that each group included the related genotypes of the parental inbred combination P1 and P2 and their derived generations F1 and F2, and the two backcrosses (BC1 and BC2). All the genotypes were grown at two locations in Spain during 2001: Pontevedra (42°24′N, 8°38′W and 20 m asl) and Abegondo (43°14′N, 8°15′W and 97 m asl). The experiment was laid out as a split–plot design, with the groups assigned to all the plots and generations within each group to the subplots. Depending upon the heterogeneity of the segregating material, the subplots comprised different numbers of 40-plant rows viz. one row for the F1, two for the inbreds, and five each for the F2, BC1 and BC2. Distance between the plants was 0·2 m and between the rows was 0·8 m, giving a final density of 60 000 plants/ha. Five randomly selected plants from each row were self-pollinated and used for ear determinations. Two and three replications were available from the Corunna and Pontevedra trials, respectively.
Data were recorded for agronomic traits including anthesis and silking dates (days) and grain yield (t/ha) adjusted to moisture content of 155 g/kg. The selfpollinated ears were harvested and shelled and a representative sample of grain from each plot was saved. Data for grain weight and the flotation test (FT) were recorded at the Centro de Investigacións Agrarias de Mabegondo using the grain samples obtained in Mabegondo, whereas grain damage (GD), density and flour-milling test (FMT) were analysed at the Misión Biológica de Galicia (CSIC).
The FMT measures the proportion of flour passing through a sieve of 1 mm diameter netting after milling 50 g of grain samples with a grinder for a given time (15 s). A 1000-grain sample of the harvested grain was used for obtaining the grain weight, expressed in mg. True density was measured in a test tube as the ratio between 100 g of grain and the volume of ethanol displaced and converted into water displacement as a standard for specific gravity (g/cm3). The FT was determined by introducing 100 grains in a solution of sodium nitrate of density 1·25 g/cm3. After shaking for 5 min, floating and sunk grains were separated, dried and weighed. The flotation index was calculated as the proportion of floating grains in the whole sample.
Near infrared reflectance spectroscopy (NIRS) analysis of grain samples was carried out with a Perstop Analytical Nirsystem equipment. An equation was developed relating the flotation index to NIRS spectra. The equation estimated flotation indices that were obtained using the NIR ISI II software program (Infrasoft International, LLC, Silver Springs, Maryland, USA) for all the whole grain samples. The reflectance spectra were obtained (log1/R v. λ, where R is the reflectance and λ is the wave length) for the λ ranges 408–1092 and 1108–2493 nm. By using modified partial minimum squares, the calibration curves were developed for milling test, density and flotation. The equations were calibrated and validated with 116 and 45 samples, respectively, for flotation index and with 149 and 176 samples, respectively, for milling tests. The R 2 of calibration for FT and FMT were 0·82 and 0·68, respectively, with standard errors of 12·3 and 4·33, respectively; the R 2 for predictions were 0·87 and 0·77 with standard error of 10·7 and 3·39 for FT and FMT, respectively.
GD was estimated visually as follows: 50 g of whole grains were placed in a 1 g/litre volume solution of brilliant blue R-250 dye in distilled water for 30 s, removed, washed with tap water for 30 s, placed on paper towels and allowed to dry. The dye penetrates the grain fractures, while the undamaged grains lose all the blue colour when washed. Undamaged grains were then counted, following the method of Henry & Kettlewell (Reference Henry and Kettlewell1996). A weighted GD index was calculated as follows:

where s is the proportion of grains with severe damage, l is the proportion of grains with light damage and w is the proportion of grains without damage.
Genetic model
A modification of Moreno-González & Dudley's model (Reference Moreno-González and Dudley1981) was adopted for analysing the genetic information. This modification involved a change for overcoming the confounding effects of the Moreno-González & Dudley (Reference Moreno-González and Dudley1981) model for additive×additive epistasis, additive effects and overall mean, so that additive×additive epistasis of each cross (aa ij) was subdivided as follows:

where aa i and aa j are components of general additive×additive epistasis for inbreds i and j respectively and aa ij′ is the specific additive×additive epistasis for segregating populations derived from crossing i and j.
The additive×dominance and dominance×dominance epistasis of Moreno-González & Dudley (Reference Moreno-González and Dudley1981) model were not considered in this model. The coefficients of additive×additive effects were in accordance with the scale used in the model proposed by Xu & Zhu (Reference Xu and Zhu1999).
The resulting model for the six generations (P1, P2, F1, F2, BC1 and BC2) derived from i and j parent lines can be written as follows:


where y refers to phenotypic means; μ is the population mean; subscripts i, j, ij, iji and ijj refer to parents i and j, F1 or F2 of the cross i×j, and the backcrosses to parent i and j, respectively; a i and a j are additive effects of parents i and j, respectively; d ij is the dominance effect of the i×j cross; aa ij′ is specific additive×additive (aa) epistasis of the i×j cross; and aa i and aa j are the general aa epistasis of parents i and j, respectively.
Restrictions of the model were:

Dominance effects were further partitioned in a similar way as Eberhart & Gardner (Reference Eberhart and Gardner1966) did for heterosis:

where d ij is the dominance effect of the cross,  is the average dominance for the overall mean of F1 crosses, d i and d j are the general dominance for the crosses involving line i or j, respectively, and d ij is the specific dominance for i×j cross, with the following restrictions:

An important consideration in the genetic model is that dominance is related to heterosis but they are not synonyms since heterosis is a function of dominance and epistatic effects:

where h ij is the heterosis of the i×j cross relative to the mid-parent.
Statistical analysis
Several statistical analyses were performed with the SAS utilities (SAS Institute Inc 1999). A least squares analysis of variance (ANOVA) was carried out, taking genotype as fixed effect and environment and repetition as random effects. The analysis was carried out by sequential adjustment of data to sub-models, similar to Eberhart (Reference Eberhart1964) and Moreno-González & Dudley (Reference Moreno-González and Dudley1981) :


Genetic effects in the genetic model were estimated by using the mixed linear model (MLM):

where yij is a vector of observations of different generations, β the vector of fixed genetic effects, γ the vector of random effects, X the matrix that relates observations and fixed effects, Z the matrix that relates observations and random effects, and ε is the vector of residual random effects (error).
Three MLM analyses I, II and III were sequentially performed. In analysis I, the average dominance was assumed fixed and general additive effects were random. In analysis II, the average dominance was considered fixed and general additive and dominance effects were random. In analysis III, the average dominance was considered fixed, while the general additive, dominance and epistatic effects were random. Average dominance was considered fixed because a unique effect, which was assumed different from zero, was estimated for this parameter. Finally, the Pearson correlation coefficients among quality and agronomic traits were estimated.
RESULTS
In the combined ANOVA, the environmental variations and the genotype×environment interaction were significant for three out of six traits, specifically for grain yield, FMT and GD. Therefore, these were used as error terms for testing the significance of genotypes for these traits. A significant part of the variation, about 0·15 of total sum of squares for grain yield, were explained by the interaction of the different response of genotypes to environments for these three traits. Genotypes were significantly different for all agronomic and quality traits except for GD and density.
The proposed genetic model was significant for all traits except for GD (data not shown). The model explained more than 0·7 of the total genotype sum of squares for quality traits and up to 0·93 for grain yield. The genetic effects differed for each trait as follows:
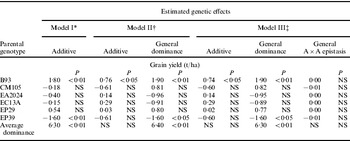
Grain yield: Mean squares due to dominance effects were several times larger than those due to additive and epistatic effects. A positive average dominance effect was the most important genetic effect controlling grain yield (Table 1). Positive significant additive and dominance effects were detected for inbred B93 and negative for inbred EP39. No significant epistatic effects for grain yield were detected when the two environments were considered, however, positive specific epistatic effects were found in seven out of 15 crosses in the Mabegondo environment (data not shown).
Predicted additive, dominance and epistatic effects for grain yield based on the three models for Abegondo and Pontevedra (Spain) in 2001

* Model I average dominance was fixed and general additive effects were random.
† Model II average dominance was fixed and general additive and dominance effects were random.
‡ Model III average dominance was fixed, and general additive, dominance and epistatic effects were random.
NS, not significant.
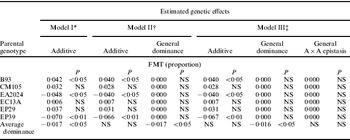
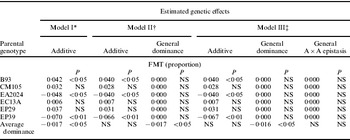
FMT: The mean squares of additive effects were the largest ones among the genetic effects for this trait. Variation of dominance effects was not significant when genotypes were tested in the two environments, probably due to the large genotype×environment interaction. Specific dominance was detected, while the additive×additive epistatic variation was not significant for the FMT. A positive effect of average dominance was found for the FMT (Table 2). Furthermore, negative additive effects were observed for the Plata inbreds, EA2024 and EP39, and positive for the soft endosperm inbreds, B93 and EP29.
Predicted additive, dominance and epistatic effects for flour-milling test based on the three models for Abegondo and Pontevedra (Spain) in 2001
* Model I average dominance was fixed and general additive effects were random.
† Model II average dominance was fixed and general additive and dominance effects were random.
‡ Model III average dominance was fixed, and general additive, dominance and epistatic effects were random.
NS, not significant.
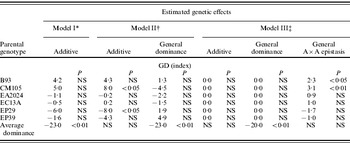
GD index: Genotypic variation for GD was not significant in the combined analysis (Table 3). If the experimental error was used as denominator in F-tests instead of the genotype×environment interaction mean squares, the genotypic variation would be significant, thus the different responses of genotypes to environments cancel out the importance of genotype variation per se for this trait. Dominance mean square was significant. When the dominance source of variation was partitioned into components, the mean squares of average dominance related to average heterosis was very large, suggesting a highly significant difference between inbreds and crosses for resistance to GD. Additive mean square was smaller than that due to dominance effects for these traits. No significant epistatic variation was found for GD.
Predicted additive, dominance and epistatic effects for grain damage based on the three models for Abegondo and Pontevedra (Spain) in 2001

* Model I average dominance was fixed and general additive effects were random.
† Model II average dominance was fixed and general additive and dominance effects were random.
‡ Model III average dominance was fixed, and general additive, dominance and epistatic effects were random.
NS, not significant.
Considering that negative effects involve a reduction in GD, the most important genetic effect for GD was a negative average dominance, which indicates that hybrids are less susceptible to post-harvest damage than inbreds. Additive effects were positive for inbred CM105 and negative for inbred EP29. However, positive additive×additive epistasis effect was detected for both inbreds B93 and CM105.
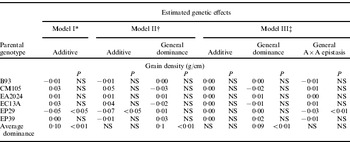
Grain density: The variation due to genotypes was not significant, however additive and dominance effects were significant, which indicates that these two types of effects are mainly governing the genetic behaviour of genotypes for grain density without significant influence of epistatic effects. The mean squares of additive effects were larger than those of dominance effects. When the dominance source of variation was partitioned into components, the average dominance component was found to be larger than any other, because hybrids had higher grain density compared with inbreds. Genotypes were not significantly different, although some of the genetic effects were significant for grain density.
Positive average dominance effects were detected for grain density. Significant negative additive and additive×additive effects were detected for inbred EP29 (Table 4).
Predicted additive, dominance and epistatic effects for grain density based on the three models for Abegondo and Pontevedra (Spain) in 2001

* Model I average dominance was fixed and general additive effects were random.
† Model II average dominance was fixed and general additive and dominance effects were random.
‡ Model III average dominance was fixed, and general additive, dominance and epistatic effects were random.
NS, not significant.
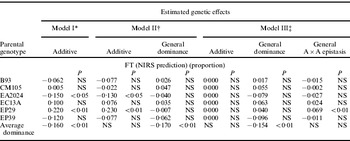
FT: The mean squares due to additive effects were several times larger than those due to dominance effects, indicating that the additive effects were the most important in the genetics of this trait. Partitioning of dominance variance resulted in significant mean squares for their three components. The average dominance mean squares were several times larger than the other dominance components, showing that hybrids had lower flotation than inbreds. No significant additive×additive epistatic variation was found.
A negative effect of average dominance was found for FT (NIRS estimates), as hybrids showed better quality endosperm characteristics than inbreds for being used in the maize processing industry (Table 5). A positive additive effect was detected for the soft endosperm inbred EP29 and a negative effect for the inbred EA2024 related to Plata maize. Also, a positive epistatic additive×additive effect was detected for the EP29, which reveals an additional positive genetic effect for the industrial use of this inbred for endosperm quality. It has to be kept in mind that negative effects imply reduction of floatability, which means higher quality.
Predicted additive, dominance and epistatic effects for flotation test based on the three models for Abegondo and Pontevedra (Spain) in 2001

* Model I average dominance was fixed and general additive effects were random.
† Model II average dominance was fixed and general additive and dominance effects were random.
‡ Model III average dominance was fixed, and general additive, dominance and epistatic effects were random.
NS, not significant.
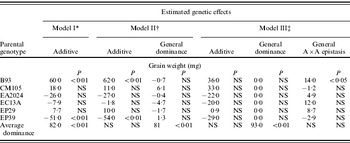
Grain weight: The additive mean squares of grain weight were larger than those of dominance and epistatic effects. Partitioning dominance variance into components, the average dominance was found to be the largest. Epistatic effects were significant but several times smaller than other effects. The signs of genetic effects of grain weight were similar to those of grain yield for inbreds which showed significant additive effect estimates in crosses with B93 and EP39 inbreds (Table 6).
Predicted additive, dominance and epistatic effects for grain weight based on the three models for Abegondo and Pontevedra (Spain) in 2001

* Model I average dominance was fixed and general additive effects were random.
† Model II average dominance was fixed and general additive and dominance effects were random.
‡ Model III average dominance was fixed, and general additive, dominance and epistatic effects were random.
NS, not significant.
Correlations
Grain density showed a negative correlation with flotation NIRS estimates (r=−0·41, P<0·01). Also, a significant correlation between FMT and flotation NIRS estimates (r=0·56, P<0·01) was detected. The positive significant correlation between grain weight and FMT (r=0·33, P<0·01) indicates that higher the grain yield the more flour can be produced after milling for a given time. The strong positive correlation between grain weight and grain yield (r=0·68, P<0·01) suggests that as the grain size increases the grain yield also rises.
DISCUSSION
The environment had insignificant effects on damage index and was the most important factor for the FMT, which indicates that environmental conditions may determine the state of the grain for ease of milling. This implies that GD and density may not clearly differ among these genotypes.
The genetic model proposed was sufficient for explaining the genetic effects in the behaviour of genotypes. However, the model was not sufficient for explaining the whole genotype variation for FT and for grain weight, probably because the error term does not include the genotype×environment interaction effects. The genotype×environment interaction is known to affect the yield and other agronomic traits, although not so much for quality-related traits (Medici et al. Reference Medici, Pereira, Lea and Azevedo2004). Partitioning of the variation of the model into genetic effects showed that the magnitude of effects was diverse for the different traits.
Grain yield: Dominance effects were larger than additive and epistatic effects. These results are in agreement with the findings of previous workers (Hallauer & Miranda Reference Hallauer and Miranda Filho1988). However, the relative importance of additive and dominance effects strongly depends on the genotypes; for example, Badu-Apraku et al. (Reference Badu-Apraku, Fakorede, Menkir, Kamara and Adam2004) and Medici et al. (Reference Medici, Pereira, Lea and Azevedo2004) found the additive effects to be the most important for yield in a tropical synthetic population. Partitioning of the dominance source of variation into components revealed that the average dominance mean square was several times larger than that due to general dominance, whereas the specific dominance mean square was not significant. Several studies on heterosis among maize populations reported that the average heterosis was the main component of variation due to heterosis for grain yield (Ordás Reference Ordás1991; Moreno-González et al. Reference Moreno-González, Ramos-Gourcy and Losada1997; Soengas et al. Reference Soengas, Ordás, Malvar, Revilla and Ordás2003). The average heterosis is even more important in the present study, because the parents of the diallel were inbreds.
The epistatic variation in the two environments was not significant, probably due to the large genotype×environment interaction. This corroborates the results of Darrah & Hallauer (Reference Darrah and Hallauer1972). Stuber & Moll (Reference Stuber and Moll1974) found that the importance of epistatic effects decreased with environmental×epistasis interactions. Moreno-Gonzalez & Dudley (Reference Moreno-González and Dudley1981) also indicated that part of the epistatic variation could have been removed with the additive and dominance variation because of the non-orthogonality of the parameters in sequential analyses. The difficulties in detecting epistasis were observed by Lamkey & Edwards (Reference Lamkey, Edwards, Coors and Pandey1999) indicating that an appropriated method for estimating epistasis with precision is still elusive (Hinze & Lamkey Reference Hinze and Lamkey2003).
A positive average dominance effect was the most important genetic effect for grain yield. Positive significant additive and dominance effects were detected for inbred B93 and negative effects for inbred EP39. No significant epistatic effects for grain yield were detected when the two environments were considered, however, positive specific epistatic effects were found in seven out of 15 crosses in the Mabegondo environment. The genetic×environment interaction diminished the importance of epistatic effects. Wolf & Hallauer (Reference Wolf and Hallauer1997) found significant epistatic effects for some inbreds and specific crosses in grain yield, although they were generally much less important than the other genetic effects. Furthermore, Hinze & Lamkey (Reference Hinze and Lamkey2003) found that epistasis was rarely significant for grain yield.
Therefore, breeding for high yield should involve hybridization, as expected based on previous knowledge and reports from other papers, while the improvement of yield expected from the contribution of additive or epistatic effects would result in smaller gains.
FMT: Additive effects were the largest among all genetic effects for this trait. The variation due to dominance effects was not significant when genotypes were tested in the two environments because of the large genotype×environment interaction. However, specific dominance was detected, suggesting that some specific crosses could show dominance effects. The additive×additive epistatic variation was not significant for the FMT.
For FMT, additive effects for the Plata inbreds EA2024 and EP39 and for the soft endosperm inbreds B93 and EP29 suggest that the inbreds related to Plata germplasm and their derived crosses are appropriate for breeding for hard endosperm since these lines produce larger particles after milling. In contrast to yield, breeding for FMT would be more efficient if based on additive effects.
GD index: Genotypic variation for GD was not significant in the combined ANOVA. If the experimental error was used as denominator in F-tests instead of the genotype×environment interaction mean squares, the genotypic variation would be significant, thus the different responses of genotypes to environments might have masked the importance of genotype variation per se for this trait. Dominance mean square was significant. When the dominance source of variation was partitioned into components, the mean squares of average dominance related to average heterosis was very large suggesting a high significant difference between inbreds and hybrids for resistance to GD. Additive mean square was smaller than that due to dominance effects for these traits.
For GD, average dominance indicates that hybrids are less susceptible to post-harvest damage than inbreds. The inbred CM105 showed positive while EP29 had negative additive effects, and both B93 and CM105 had positive epistasis effects. Therefore, based on the genetic regulation of this trait, the expected gains from breeding would be very low.
Grain density: The variation due to genotypes was not significant, however, additive and dominance effects were significant, which indicates that these two types of effects are mainly governing the genetic behaviour of genotypes for grain density without significant influence of epistatic effects. Additive effects were larger than dominance effects. Small improvements in grain density could be expected in a breeding programme based on either additive or dominance effects.
Finally, for FT and grain weight, additive effects were larger than dominance effects. Grain density, FT and FMT are related to each other. As grain density increases, the ease of milling and the flotation index of grains decrease. Medici et al. (Reference Medici, Pereira, Lea and Azevedo2004) also found that additive effects were more important than dominance effects for grain weight. These traits are directly related to grain size, for which Audilakshmi & Aruna (Reference Audilakshmi and Aruna2005) have found dominance and epistatic effects to be significant in sorghum. Monneveux et al. (Reference Monneveux, Sanchez and Tiessen2008) found a strong correlation between grain weight and yield, and Dorsey Redding et al. (Reference Dorsey-Redding, Hurburgh, Johnson and Fox1991) also found that the hardness was correlated with other quality factors like test weight (apparent density) and grain density. The higher the grain yield, the more flour produced after milling in a given time; as the grain size increases, the grain yield also rises. Therefore, flotation and grain weight can be improved through selection. Correlations among grain-quality traits and yield are neither consistent among genotypes nor across years (Badu-Apraku et al. Reference Badu-Apraku, Fakorede, Menkir, Kamara and Adam2004). Furthermore, correlations between yield and each quality trait changes among selection programmes, which implies the need for regularly checking the direct and correlated responses to selection (Monneveux et al. Reference Monneveux, Sanchez and Tiessen2008).
Considering all traits together, the hard endosperm quality traits showed mainly an additive genetic variation. On the contrary, dominance effects related to heterosis explained most of the variability for grain yield and GD. In general, additive×additive epistatic variation was not significant; this fact could be attributed to (i) part of the variation might have been removed by additive and dominance effects when performing the sequential ANOVA, and (ii) the relative importance of epistasis×environment interaction. The average dominance was the most important component of the dominance variance as compared with general and specific dominance. Average dominance is related to a heterosis of hybrids over inbreds, producing an increment of grain yield, size, hardness, density and resistance to damage. Flotation index was the trait that best characterized the hard endosperm quality since variation among genotypes was relatively large and an NIRS equation showing a good prediction was developed (R 2=0·87).
Some inbreds displayed sufficient potential to be used in hard-grain maize breeding programmes. Inbreds EA2024 and EP39 related to Plata maize showed significant favourable additive effects for traits related to hard endosperm. In addition, inbred B93 showed the highest additive and dominance effects for grain yield and moderate negative effects for the FT index. Results suggest that improvement for traits related to hard endosperm quality should be easily reached by hybrid breeding programmes, since average dominance was the most important effect for grain yield and traits related to hard endosperm. Other authors have also shown that local germplasm contributing high grain density frequently have lower yield than the modern hybrids (Krieger et al. Reference Krieger, Pollak, Brumm and White1998; Singh et al. Reference Singh, Johnson, Pollak and Hurburgh2001a, Reference Singh, Johnson, Pollak and Hurburghb). These high-quality accessions would be valuable for contributing favourable alleles for improving grain quality for milling, but the improvement of yield should rely on elite inbreds. The combination of the Spanish inbreds evaluated here with some appropriate elite inbreds for improving yield would result in correlated gains for milling test and grain weight, but would also involve a reduction in grain density.
This research was supported by the European Commission and the Ministry of Science and Technology of Spain) (Project code 1FD1997-2352-C02-01) and the INIA (Project code RF2007-00007-C05).