1. Introduction
Variability in active galactic nuclei (AGNs) is extensively explored across a wide range of timescales, from hours to
 $>\mathcal{O}(10^4)$
years (see e.g. Caplar et al. 2017). Due to versatility of physical processes, variability patterns represent modulation in AGN luminosity during the active growth phases of supermassive black hole (SMBH) residing at its core (Schawinski et al. 2015). Extracting SMBH related physical parameters from large, irregularly sampled, sparse cadenced time-domain data (Bianco et al. 2022) obtained by large-scale surveys such as the Vera C. Rubin Observatory’s Legacy Survey of Space and Time (LSST, Ivezić et al. 2019) in the artificial intelligence era, demands models capable of generalizing across not only diverse observational conditions, but also source population characteristics. Metalearning, or “learning to learn,” is a type of artificial intelligence suited for this challenge, enabling probabilistic models to infer functional distributions and physical parameters from sparse, noisy observations [Finn and Levine, 2018, Kovačević et al. 2023; Čvorović-Hajdinjak 2024). We report on testing Attentive Latent Neural Processes (see Raju et al. 2025) and their quantum hybrid variant, a class of metalearning models, which integrate probabilistic reasoning with neural attention mechanisms.
2. Basic principles of ALNP and the prototype of quantum-hybrid extension
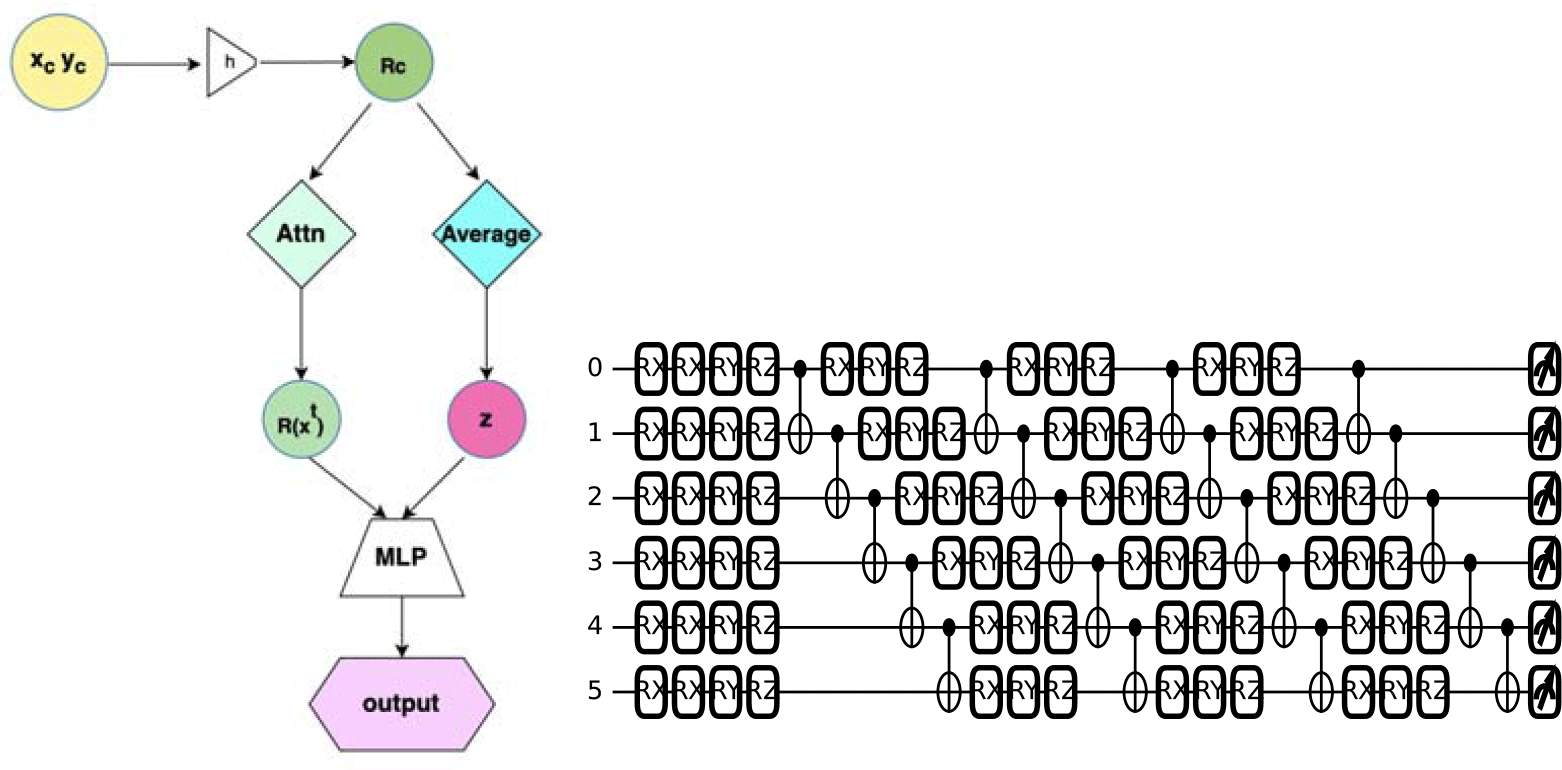
An ALNP (Kim et al. 2019; Raju et al. 2025) consists of three core components (Figure 1): (i) an encoder h that maps context pairs
 $(x_c, y_c)$
to representations
 $R_c$
, (ii) a dual-path aggregator comprising an attention mechanism to produce context-aware representations
 $R(x_t)$
and a pooling operation to compute global statistics used to parameterize a latent variable
 $z \sim \mathcal{N}(\mu_z, \sigma_z)$
, and (iii) a decoder g that takes both
 $R(x_t)$
and z to generate predictive distributions
 $(\mu_{y_t}, \sigma_{y_t})$
at target inputs
 $x_t$
. In contrast to variational autoencoders (VAEs), where latent variables are tied to fixed-size input vectors, ALNPs infer distributions conditioned on arbitrary sets of context points, allowing flexible handling of irregular, sparse, and permutation-invariant data. Quantum computing has advanced remarkably, with systems featuring hundreds of qubits now accessible via cloud platforms like Google Quantum AI [Arute∼et∼al., 2019] and IBM’s quantum servicesFootnote
1
. Although there are still challenges in quantum computing [?, see e.g.,]and references therein]renaud2024quantumradio, it is essential to evaluate how quantum computing can be effectively integrated into scientific pipelines and the potential benefits it may offer [Herrmann∼et∼al., 2023]. In Google Quantum AI we combined parameterized quantum circuits (PQCs) as latent encoders with classical neural networks as decoders. In our PQC (Fig 1, right panel), 6 qubits form a 6D quantum register, encoding input data into a 32-dimensional latent space. Each layer of RX, RY, and RZ
 $(Ri(\theta)=e^{-j \frac{\theta}{2} i, i\in{X,Y,Z}})$
gates applies rotations to individual qubits around X,Y,Z axes of the Bloch sphere, while CNOT gates entangle them, capturing complex dependencies across the 6 dimensions.
 $\theta$
is the rotation angle, which is the trainable parameter, typically initialized randomly or based on a specific distribution (e.g., uniform). The encoded latent space is then processed by a classical neural decoder, composed of fully connected layers with Rectified Linear Unit (ReLU) activations, which decodes the quantum representations into signal predictions. The architecture is trained using the Adam optimizer.
Architecture of the ALNP (left) and prototype of quantum hybrid variant (right). Left: Context data
 $(x_c, y_c)$
are encoded into representations
 $R_c$
via encoder h.
 $R_c$
are aggregated via two paths: attention and averaging to produce a local representation
 $R(x_t)$
and a global latent variable z. These are passed to a decoder (multi layer perceptron, MLP) to predict target outputs. Right: The PQC consists of 6 input qubits and 4 layers. A small MLP compresses context points mean and standard deviation into per-qubit angles that seed a data-driven RX,RY,RZ layer that is followed by nearest-neighbor CNOT entanglers. After the final block we measure on each qubit and take the first 6 components as the latent vector r for the classical neural decoder.

3. Testing ALNP and quantum hybrid prototype
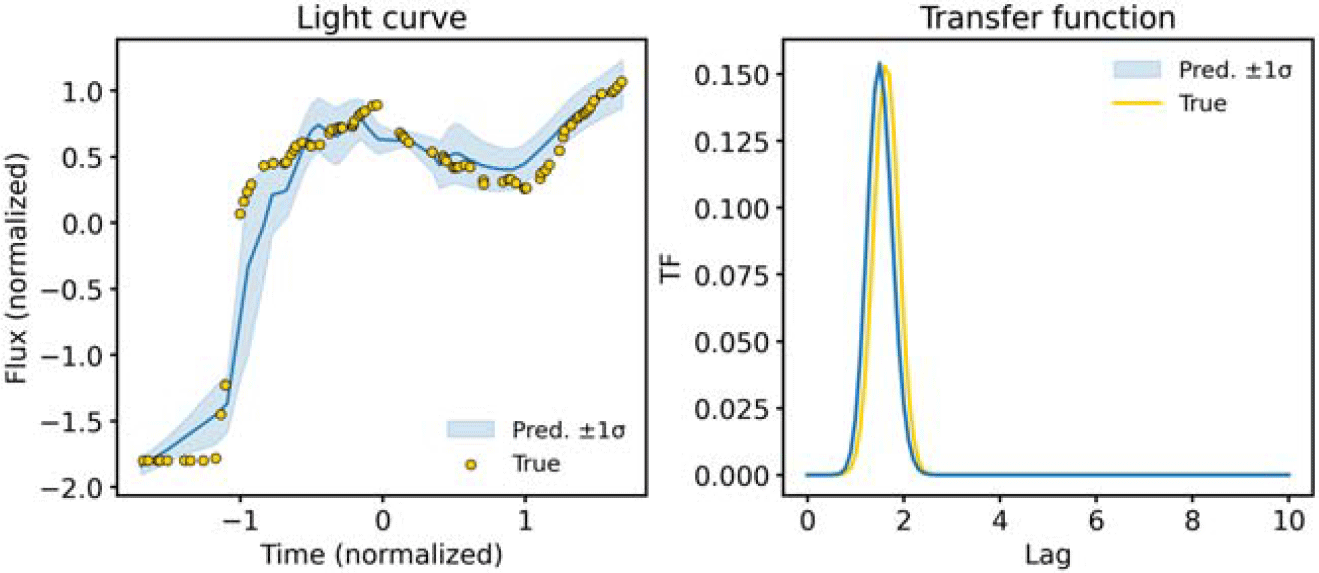
For showcasing ALNP capabilities we used the training set consisting of 200 simulated light curves based on prescription by by Kovačević et al. (2021). The validation set contained 50 held-out examples, drawn from the same distribution as the training set. The light curves were sampled at irregular times, with long gaps, to simulate LSST-like observations (Kovačević et al. 2021). Figure 2 shows the reconstruction for a representative validation light curve. The model successfully captures the overall variability and lag structure, but gaps in the input sampling lead to larger predictive uncertainties and small mismatches in the recovered transfer function peak. The right panel compares the true transfer function (orange) with the model prediction (blue), demonstrating that the network internalizes the lag distribution encoded in the training data.
Testing ALNP on a simulated light curve for a validation AGN. Left Light-curve and transfer function inference for a single simulated AGN. Left: Predicted light curve (blue line) with
 $\pm 1\sigma$
posterior uncertainty (shaded band), compared to the ground-truth fluxes (yellow points). Right: Predicted mean transfer function (blue), compared to the true transfer function (yellow). Lag is given in days. The model is evaluated on jittered realizations of the input light curve, emulating observational noise.

Figure 3 presents the inferred posterior distributions for a subset of the target quantities. ALNP recovers the true values within the 2-3
 $\sigma$
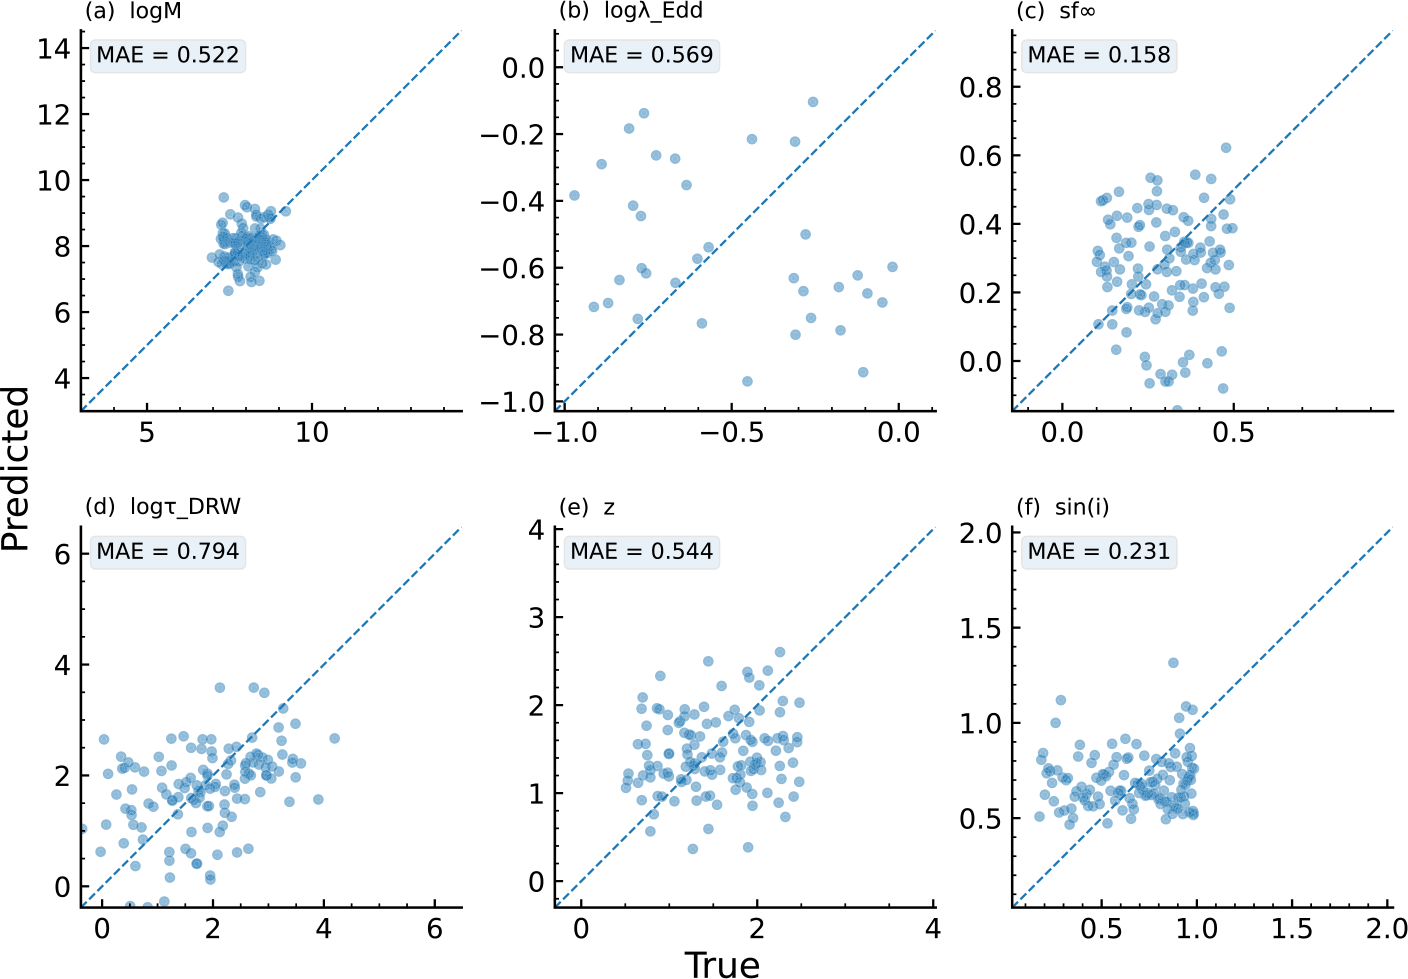
range, although missing points in the input light curve (Figure 2, left panel) broaden the posterior contours and can push the inferred values outside the nominal confidence intervals. This suggests that the reconstruction losses for light curves and transfer functions compete with the inference losses for SMBH and accretion flow parameters. In Figure 4, we show the ALNP prediction compared to the true value for each parameter across the test set of 50 simulated light curves, demonstrating the ability of our model to predict each parameter.
Posterior distributions of SMBH and variability parameters for the same AGN as in Figure 2. Corner plots inference for six parameters: black hole mass
 $\log_{10} M_{\mathrm{BH}}$
, Eddington ratio
 $\log_{10}\lambda_{\mathrm{Edd}}$
, long-term variability amplitude
 $SF_\infty$
, damping timescale
 $\log_{10}\tau_{\mathrm{DRW}}$
, redshift z, and inclination i (here stored as
 $\sin i$
). Blue contours denote 1-3
 $\sigma$
confidence levels. Vertical and horizontal yellow lines mark the ground-truth values from the simulated dataset.

ALNP predicted vs true values for SMBH parameters:
 $\log M_\mathrm{BH}[M_{\odot}]$
(a),
 $\log \lambda_{\mathrm{Edd}}$
(b),
 $SF_\infty$
(c),
 $\log \tau_{\mathrm{DRW}}$
(d), z (e), and
 $\sin i$
(f) obtained from a validation set of 50 synthetic light curves. Dashed line is perfect correlartion, with the mean absolute error (MAE).

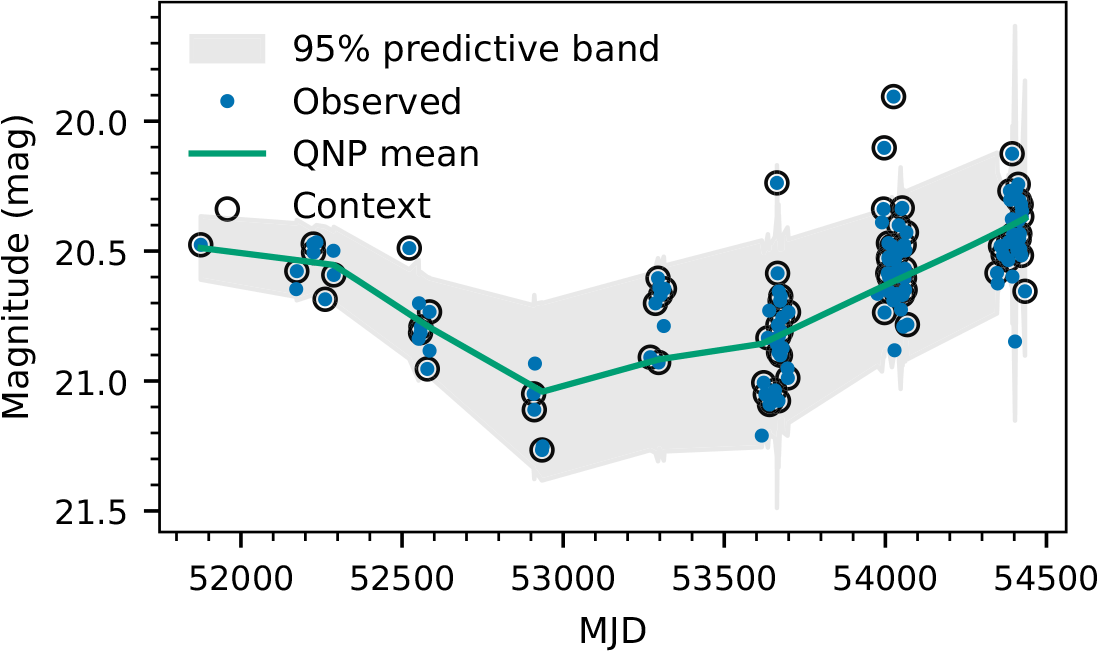
Figure 5 illustrates the performance of our Quantum Neural Process in reconstructing a representative AGN light curve from Kovačević et al. (2023). The mean prediction (green line) follows the observed variability, with deviations remaining within the 95% predictive band (gray shaded area). Context points (black circles) anchor the model, while the remaining observations serve as targets for validation. We used six qubits and a circuit depth of four as a balance between expressivity and efficiency. Six qubits provide enough capacity to represent a four-dimensional latent space with some redundancy, while depth four is sufficient to capture nonlinear correlations without making training unstable or overly costly. Early stopping mechanism at epoch 1904 prevented overfitting and stabilized convergence around the best solution. We will report ALNP results in greater detail in Raju et al. (2025).
Testing PCQ on representative AGN. Quantum Neural Process reconstruction (green) of the observed AGN light curve (blue), with context points (black) and 95% predictive band (gray).

Acknowledgements.
A.B.K., D.I., L.Č.P. acknowledge funding provided by the University of Belgrade - Faculty of Mathematics (the contract 451-03-136/2025-03/200104), Astronomical Observatory Belgrade (the contract 451-03-136/2025-03/200002). A.B.K and D.I acknowledge IAU travel grants.
 (xc,yc)
 Rc
 Rc
 R(xt)
 ±1σ

 log10MBH
 log10λEdd
 SF∞
 log10τDRW
 sini
 σ
 logMBH[M⊙]
 logλEdd
 SF∞
 logτDRW
 sini