Introduction
Contemporary glaciers in the Arctic islands and low- and mid-latitude mountain systems of Eurasia cover more than 200 000 km2. Evidence from moraine studies and glacier mass-balance measurements (Dyurgerov, 1995) shows that, within Eurasia, glaciers have been retreating during the last 100 years since the end of the Little Ice Age. This has resulted in a glacierized area reduced by 10–30%, depending on the mountain region. The rate decreases from west to east, with relaxation of the influence of western atmospheric circulation (Krenke, 1982). The altitude, orientation and geography of the ranges influences how different mountain systems react to climate change. Glaciers with different sizes, shape, orientation and altitude have different response rates. The rate of reduction in glacier water resources has increased measurably because of natural and man-made climate changes during the past century (Dowdeswell, 1995); up to 1 % per year in the mountains of Central Asia (Dyurgerov, 1996). Glacier mass-balance and ice-core investigations allow us to identify the climate that has influenced glaciers during the last 100 years.
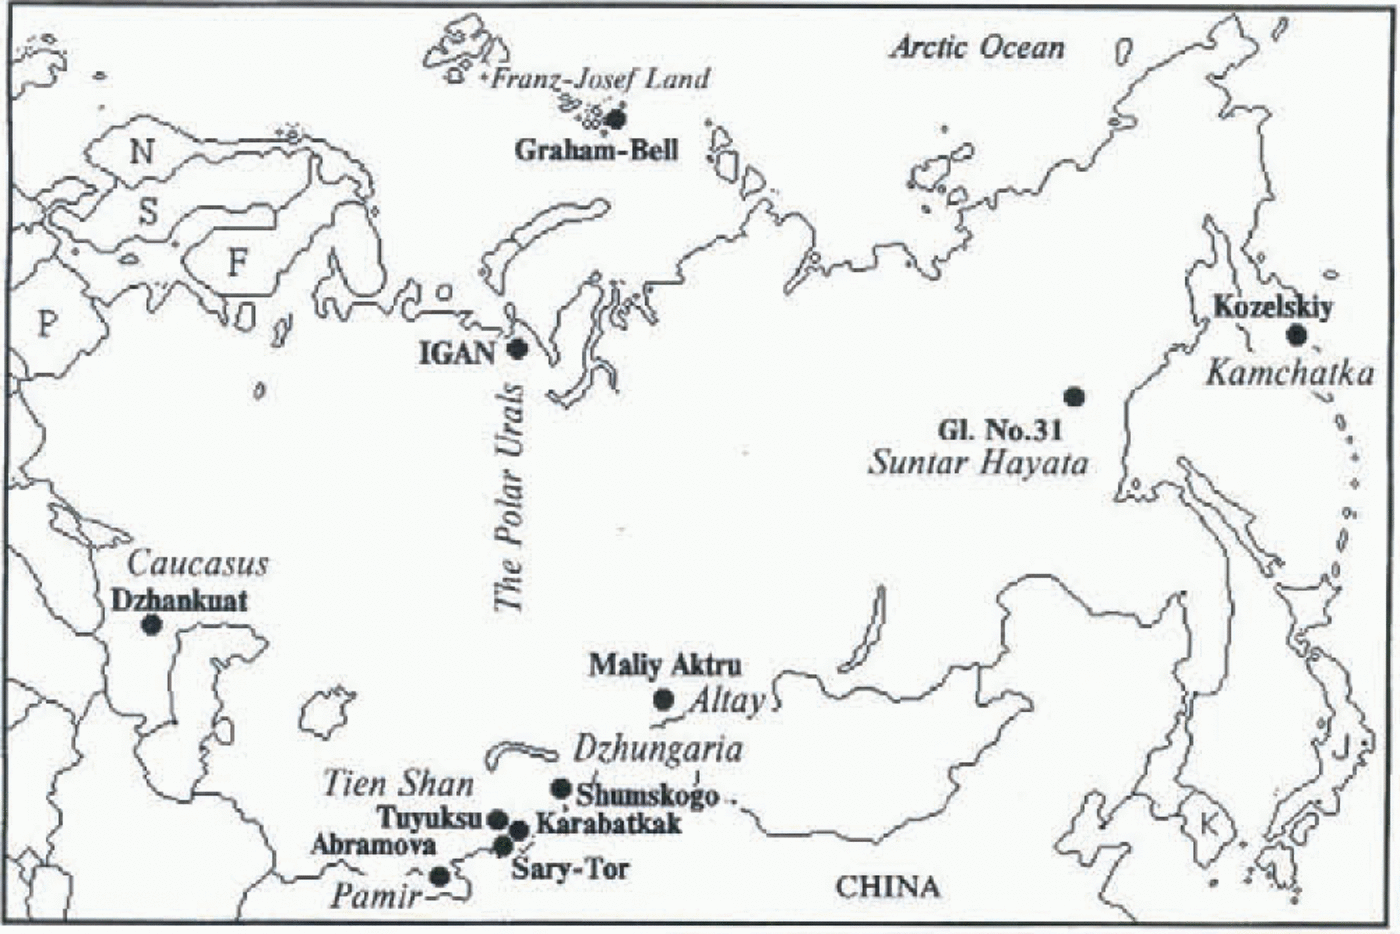
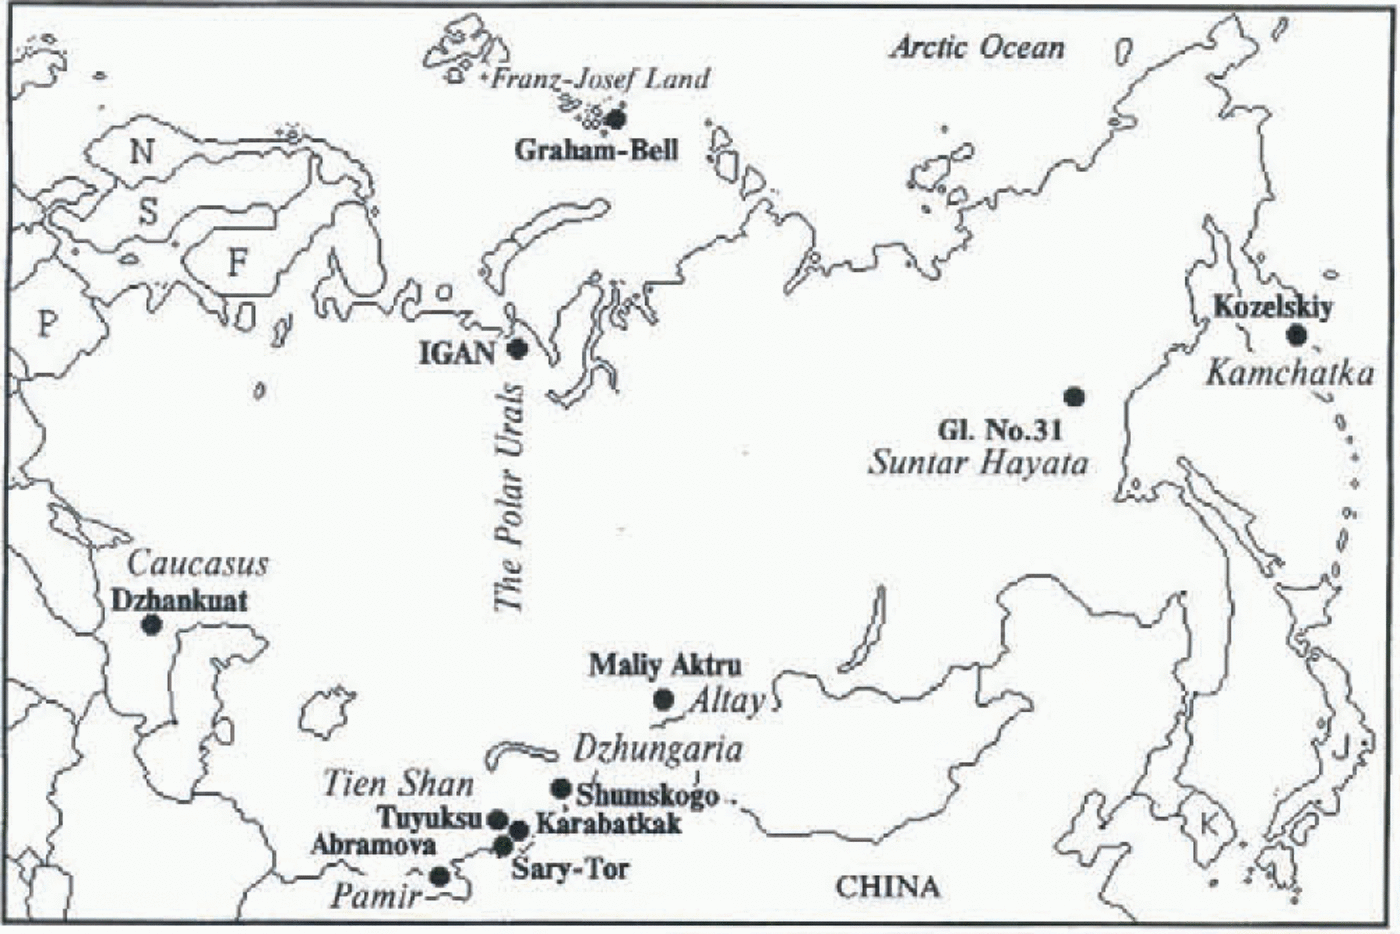
Fig. 1. Location of investigated glaciers.
Data Base
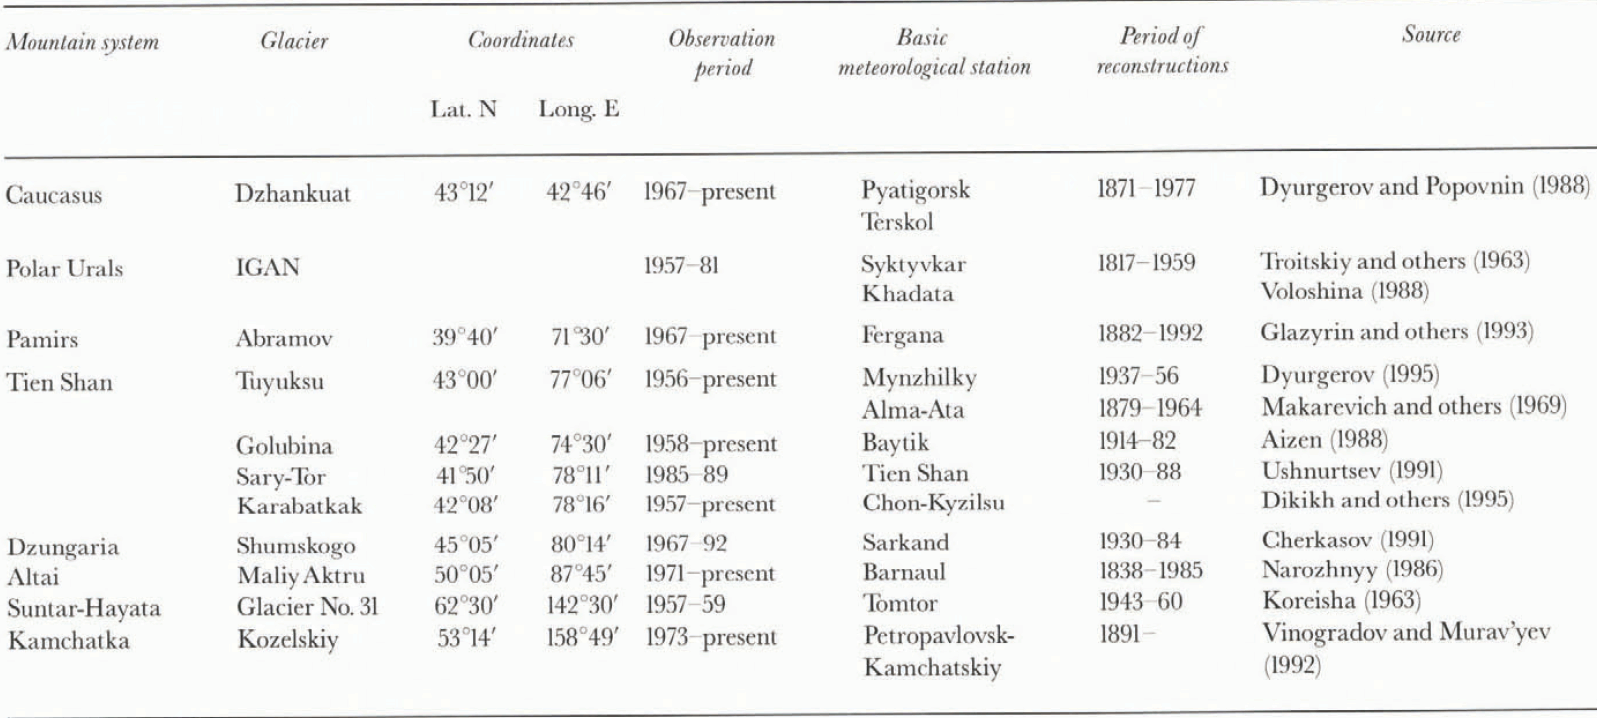
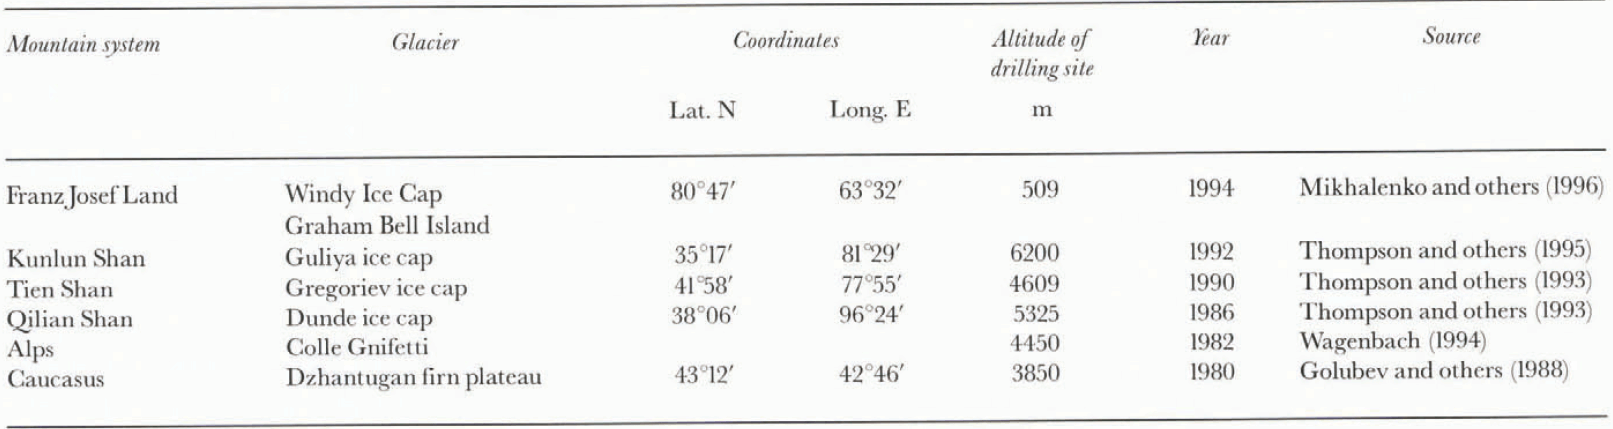
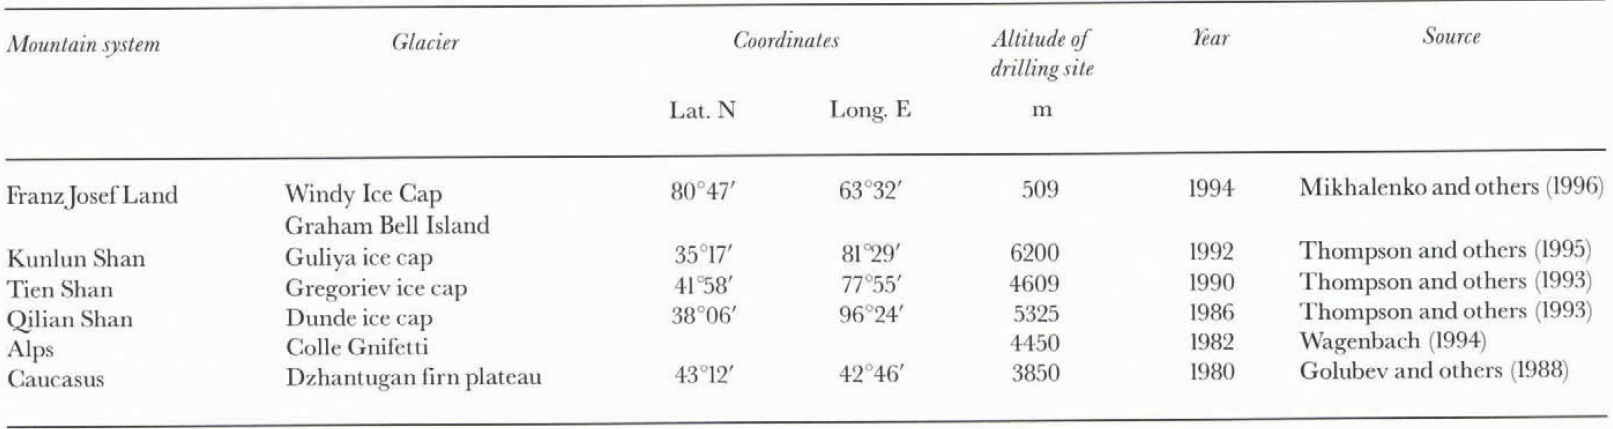
A long-term series of observed, and reconstructed, glacier mass balance and observations of glacier retreat, from the mid-19th century to the present, are used to investigate glacier behavior over the past century (sec Fig. 1; Table 1). The method of glacier mass-balance reconstruction is provided by Mikhalenko and Solomina (1996). The results of deep ice-core drilling at the Eurasian glaciers were also used in the analysis (table 2). Isotopic composition, ice-crystal distribution and borehole temperatures were studied first. Isotopic composition reflects condensation temperatures during the formation of solid precipitation. Changes in crystal size indicate fluctuations of climate conditions during ice Formation, Repeated measurements of ice temperature in boreholes provide information about changes in the thermal regime of the glaciers.
Results
Glacier mass-balance evidence
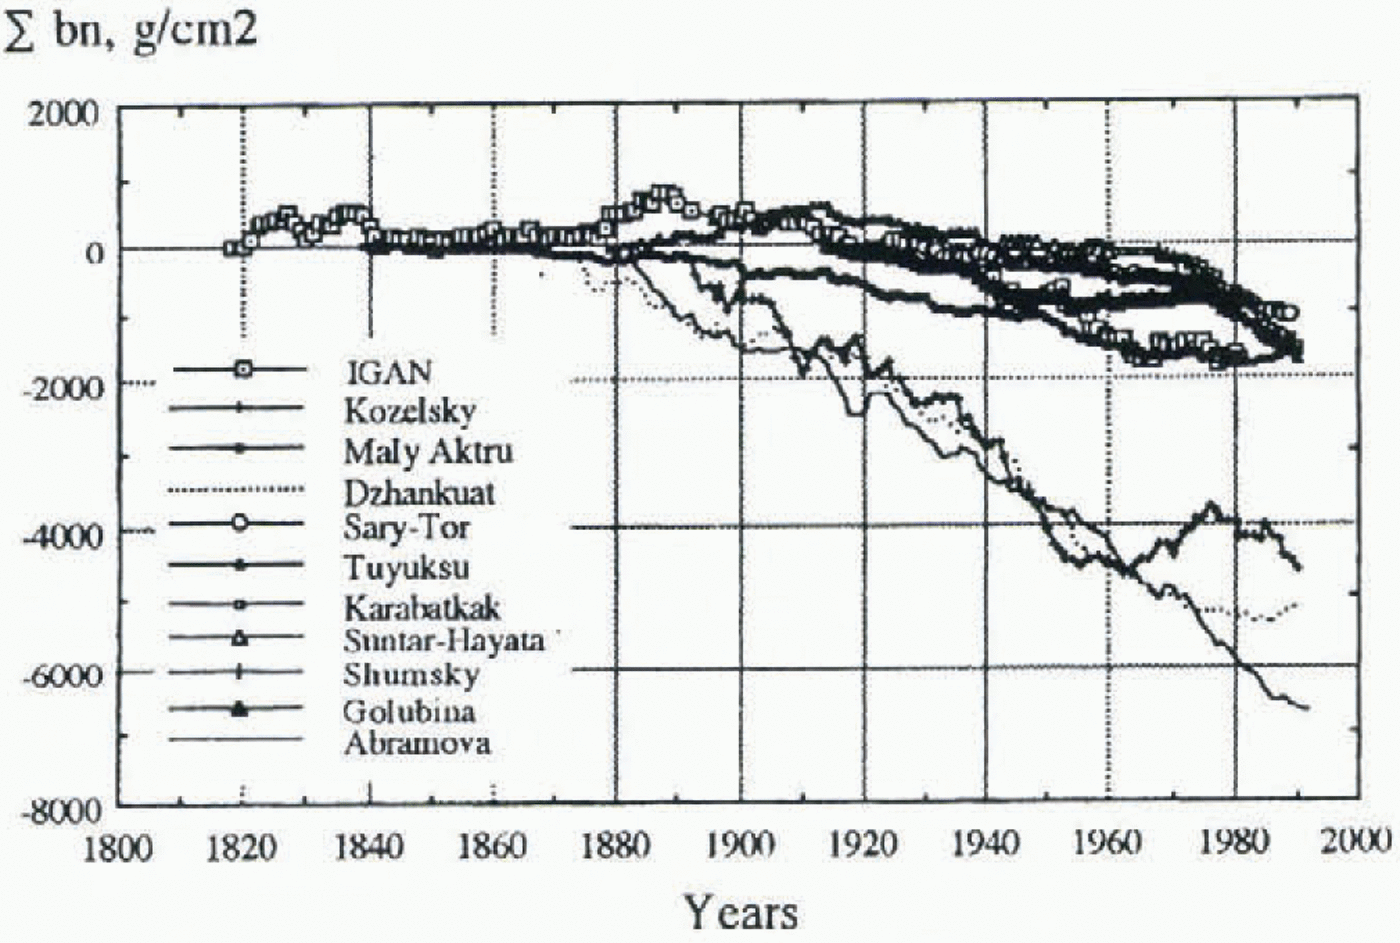
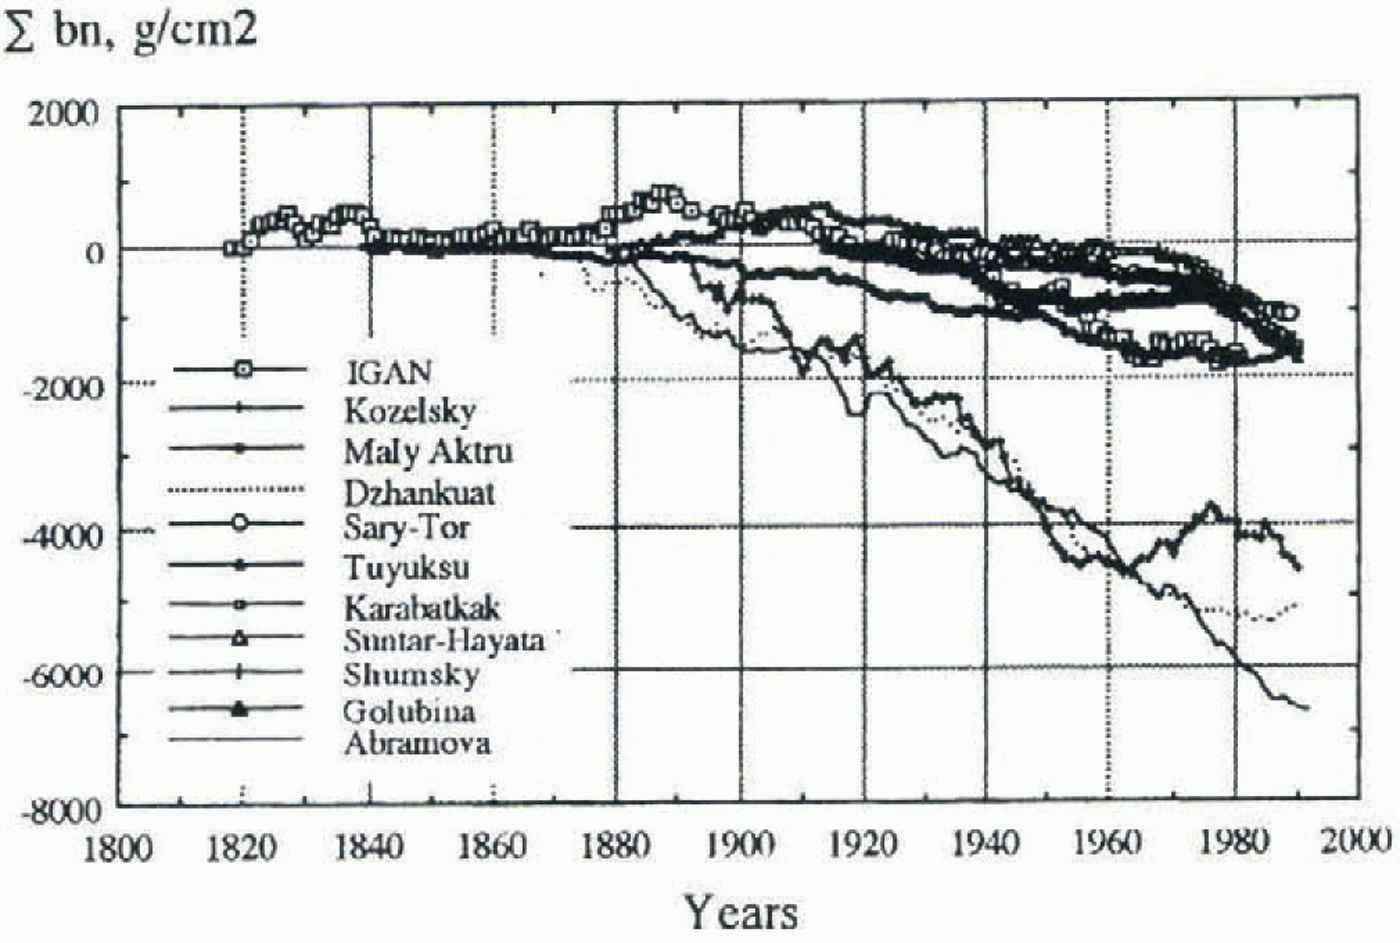
The measured and reconstructed mass-balance series show there were no major changes in glacier volume and extent during the 19th century (Fig. 2). Until 1880, the cumulative mass-balance curves are parallel and close to zero. Glacier mass balance was influenced by negligible oscillations without any considerable trend. Glacier front positions in most mountain systems were stable.
Since 1880, there are two types of mass-balance curve (Fig. 2). The first reflects changes for the glaciers in regions
Table 1. Glacier reconstructions
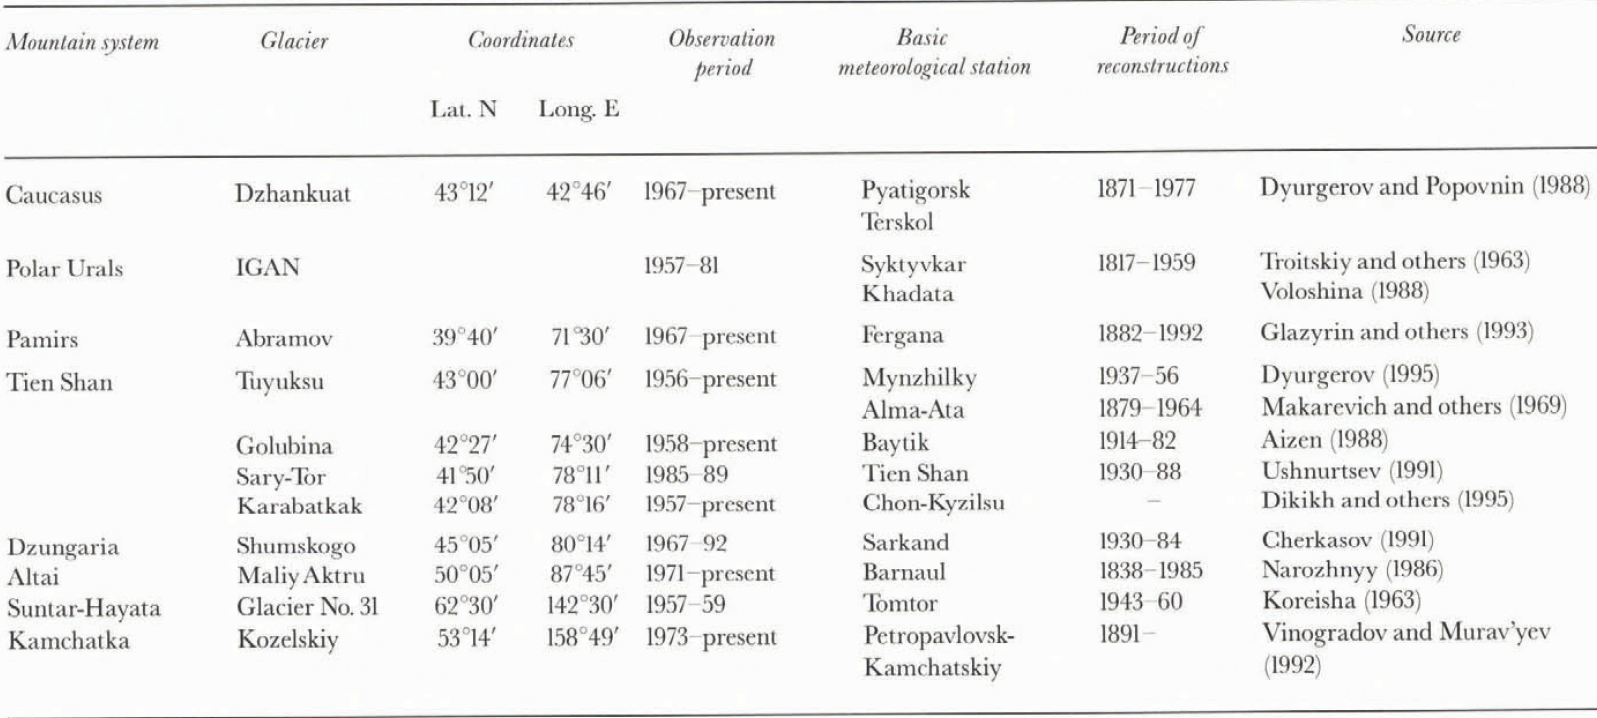
Table 2. Ice-core drilling sites
with a high intensity of mass exchange (modulus sum of accumulation and ablation) such as the Dzhankuat, Abramova and Kozelskiy glaciers. For such glaciers the average mass balance for the last 110 years is −480 mm a−1. Another group of glaciers, within the Tien Shan, the Altai, the Polar Urals, the mountains of northwestern Siberia and Dzungaria, is characterized by less negative mass-balance values (−140 mm a−1) for the same period (Fig. 2). Glacier fronts retreated several kilometers in the first group, but only hundreds of meters in the second. Changes in the altitudes of glacier tongues in the maritime regions (Caucasus and Kamchatka) were much more considerable compared with those in more continental areas.
Cumulative curves of glacier mass balance.
Because of these mass-balance changes, Caucasus glaciers retreated from 700–750 m up to 3 km during the last 100 years. Glacier fronts receded to elevations 150–170 m higher. The Dzhankuat glacier retreated 800 m in length and 25 m in elevation (Solomina, in press). The effect on Pamir glaciers is more because of their greater size (values of retreat for the big western Pamir glaciers are up to 4000 m). On the other hand, glaciers in the interior retreated much less than on the periphery, in both the Pamirs and Tien Shan.
According to estimates of glacier front positions after the end of the Little Ice Age (Solomina, in press), the height of glacier fronts in the north and east of the Tien Shan has risen 300–400 m. In the interior Tien Shan this value is less (0–70 m). Retreat in the Altai is also less (200–2300 m; mean value 600 m; altitude changes 90 m). In the Polar Urals and northeastern mountains of Siberia, glacier reduction is much less (200 m length and some meters elevation). Finally, in Kamchatka, glacier fronts are now located 50–60 m higher than their Little Ice Age moraines.
Ice-core evidence
Ice cores from glaciers provide information about crystal size, microparticle concentration, isotopic composition and temperature in boreholes. These data may indicate trends in global climate. From 1980 to 1985, ice coring was carried out at the Dzhantugan firn plateau, part of the accumulation area of Dzhankuat glacier. One of the objectives was to determine the characteristics of the firn–ice layer under conditions of infiltration–recrystallization ice formation (Golubev and others, 1988).
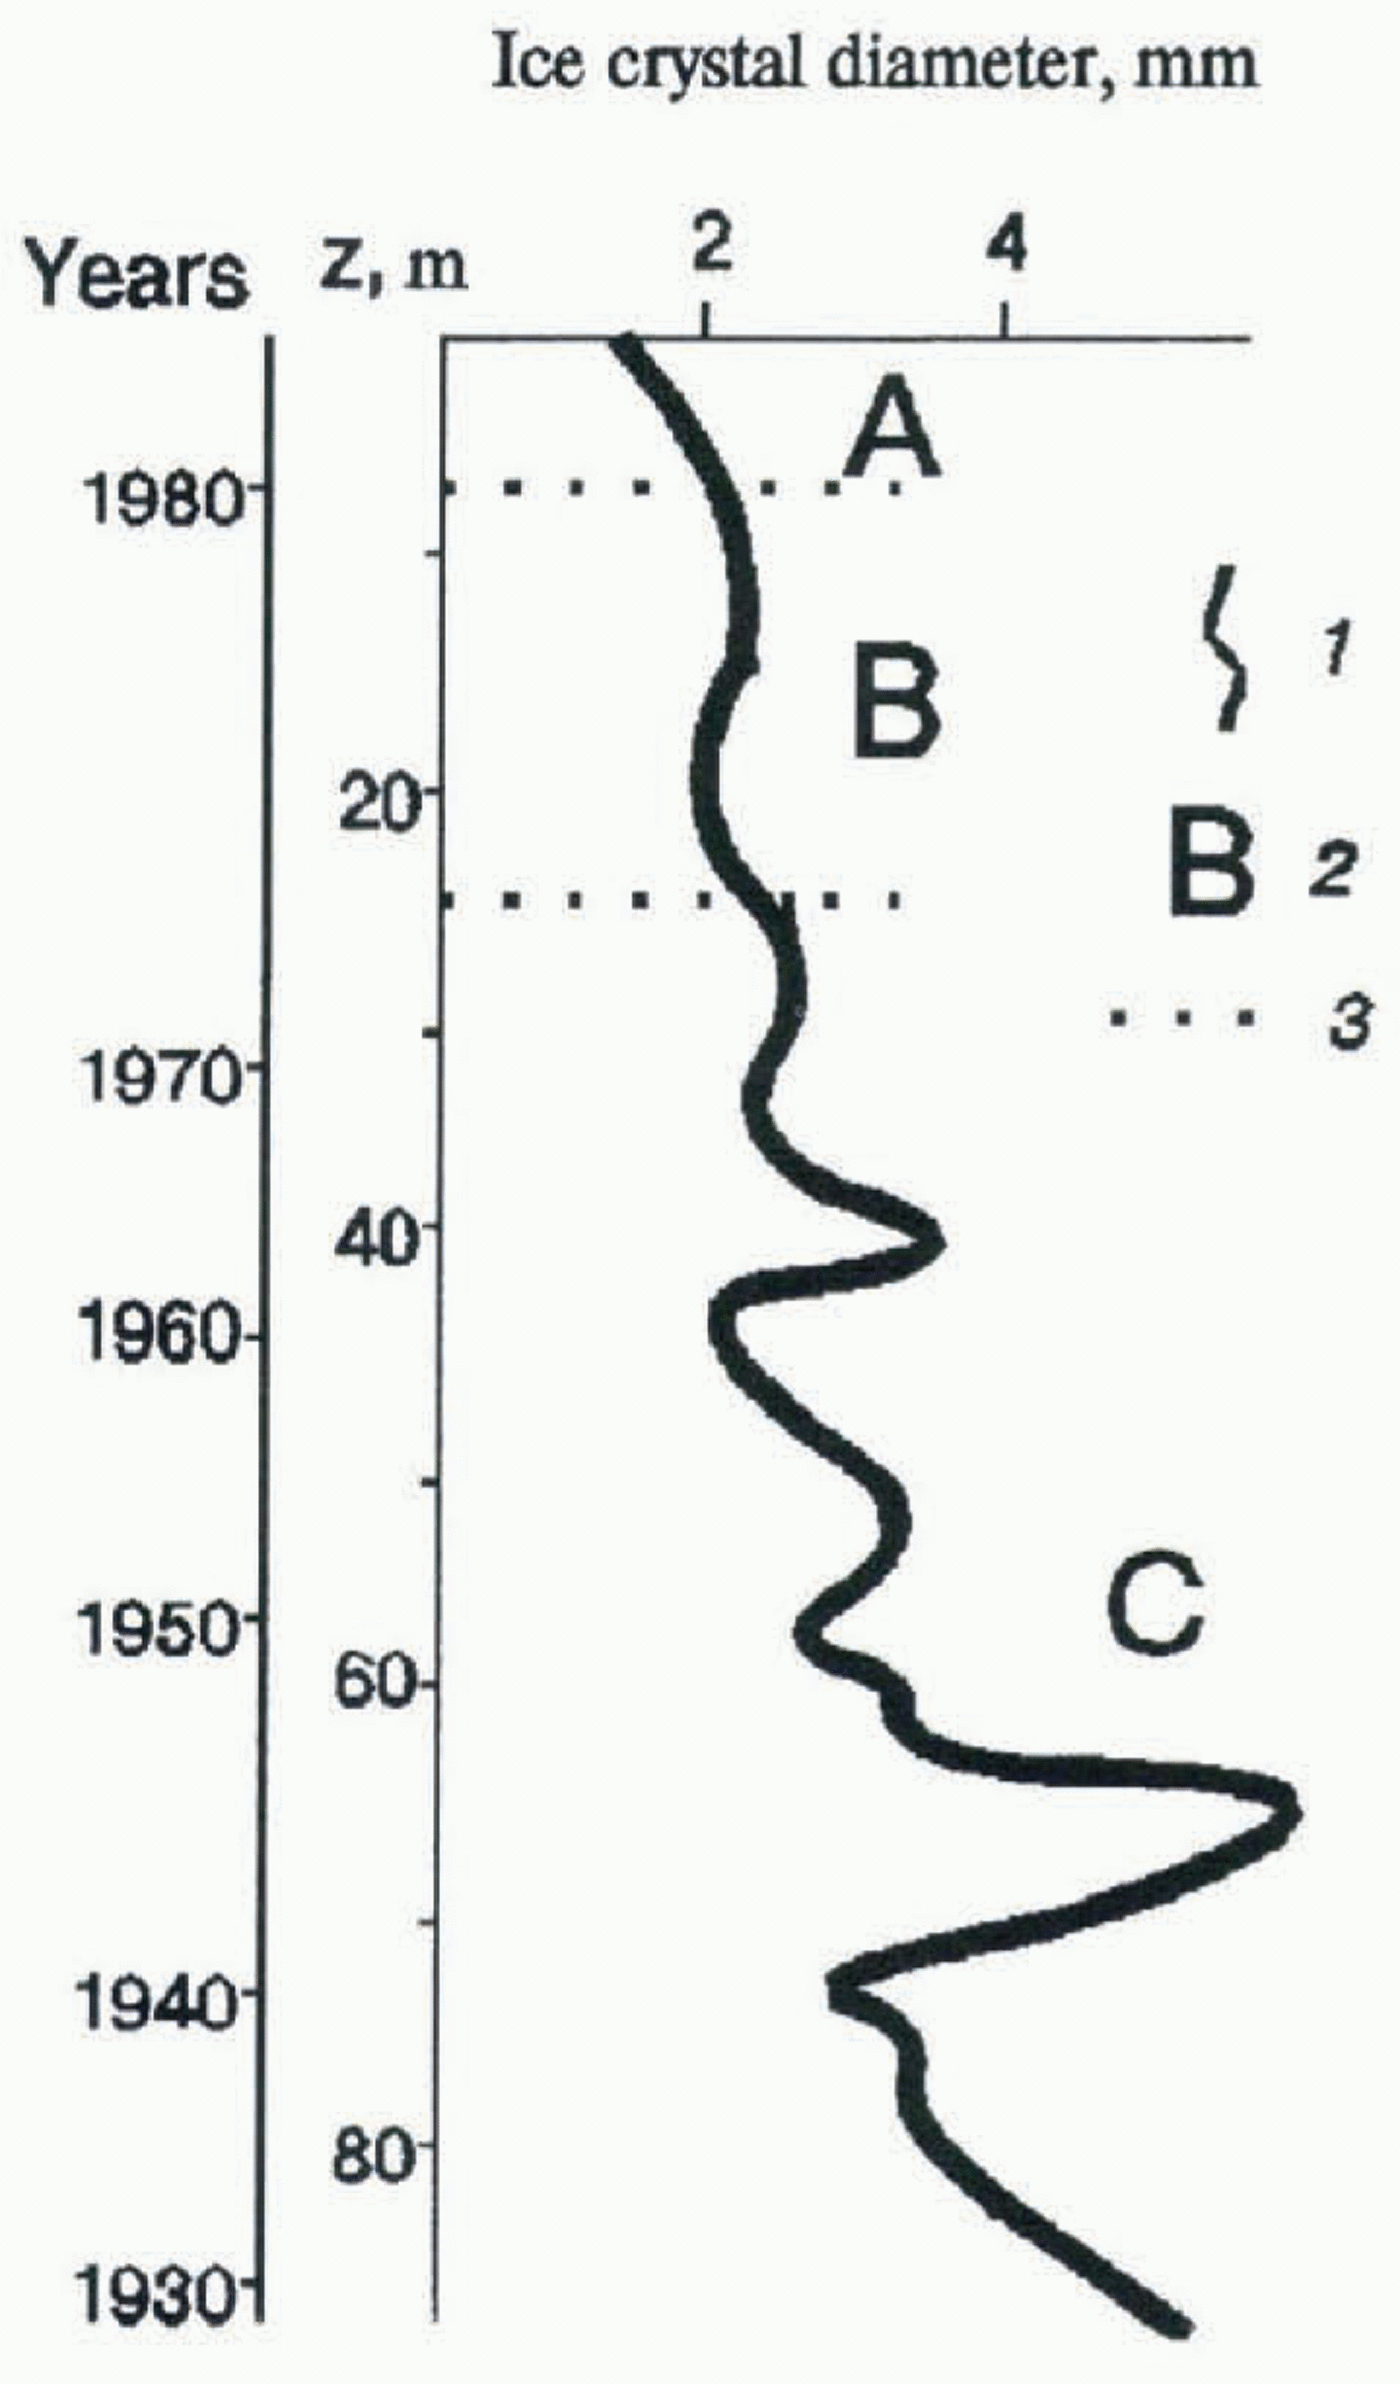
The rate of crystal growth within all types of ice layers is practically the same. So the considerable variations of mean crystal sizes shown in Figure 3 may only be caused by climate changes, while the ice layer lies within the zone of active ice formation (upper 5–10 m with an age of 2–4 years). Structural and stratigraphic features of the snow–firn layers formed within this zone remain stable under recrystallization. However, crystal size is influenced by slight oscillaitons caused by air bubbles and mineral particle content (Alley and others, 1986).
From a comparison of crystal-size changes with precipitation and average winter air-temperature data, from the nearest weather station at Mestia, we can conclude that in cooling and drying periods the average crystal size
Variation in grain-size with depth (1); the main zones (A, B, C) of the growth of crystals in the snow–firn sequence of the Dzhantugan firn plateau (2); and the boundaries of zones (3) (after Golubev and others, 1988).
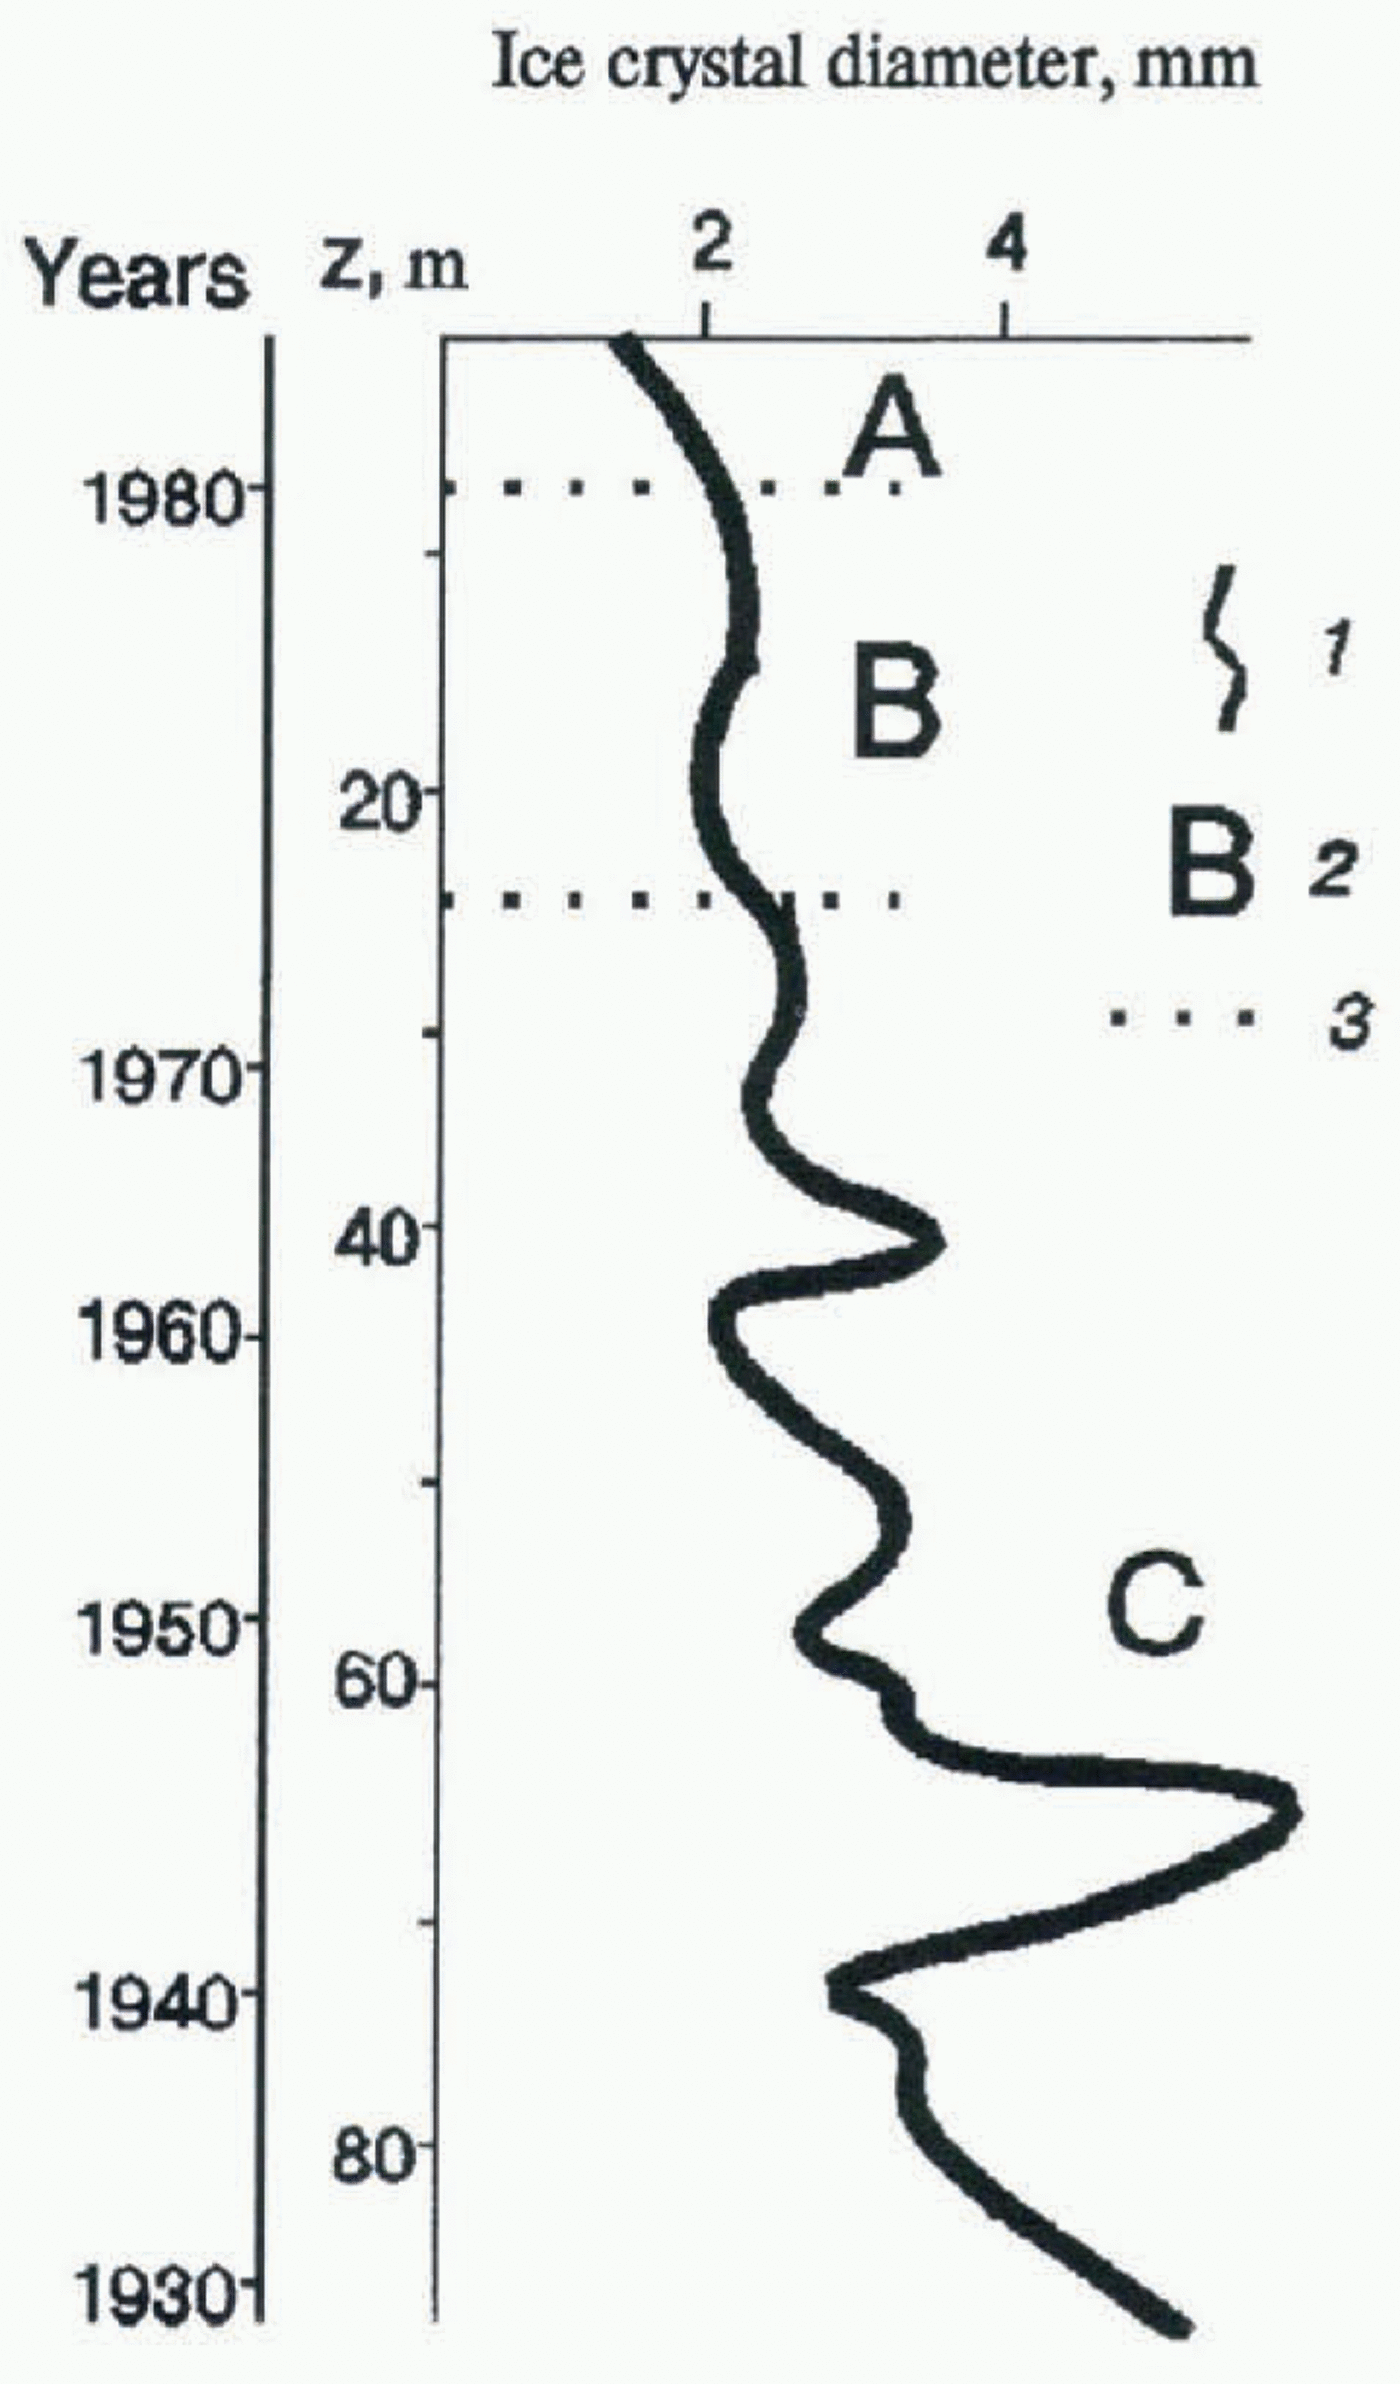
Changes in crystal size, shown in Figure 3, can be divided into three parts. The upper part presents the whole snow layer (3–5 m) in zone A, where the snow structure transforms due to winter diffusion, mass transfer and infiltration, and freezing of melting water in summer. The average rate of crystal growth in this zone is 0.2–0.3 mm a−1. At 5–30 m (zone B in Fig. 3) the structure of ice transforms mainly due to the influence of infiltrating meltwater. The rate of crystal growth here is 0.05–0.1 mm a−1. A third region is the zone below the boundary between firn and ice (zone C) where the structure transforms due to all recrystallization processes. The rate of crystal growth here depends on the temperature of the layer slightly changing in time and depth, and the values of tensions which generally increase with depth. The rate of crystal change in this zone, within ice layers of different types, is equal on average to 2 × 10⁻² mm a−1.
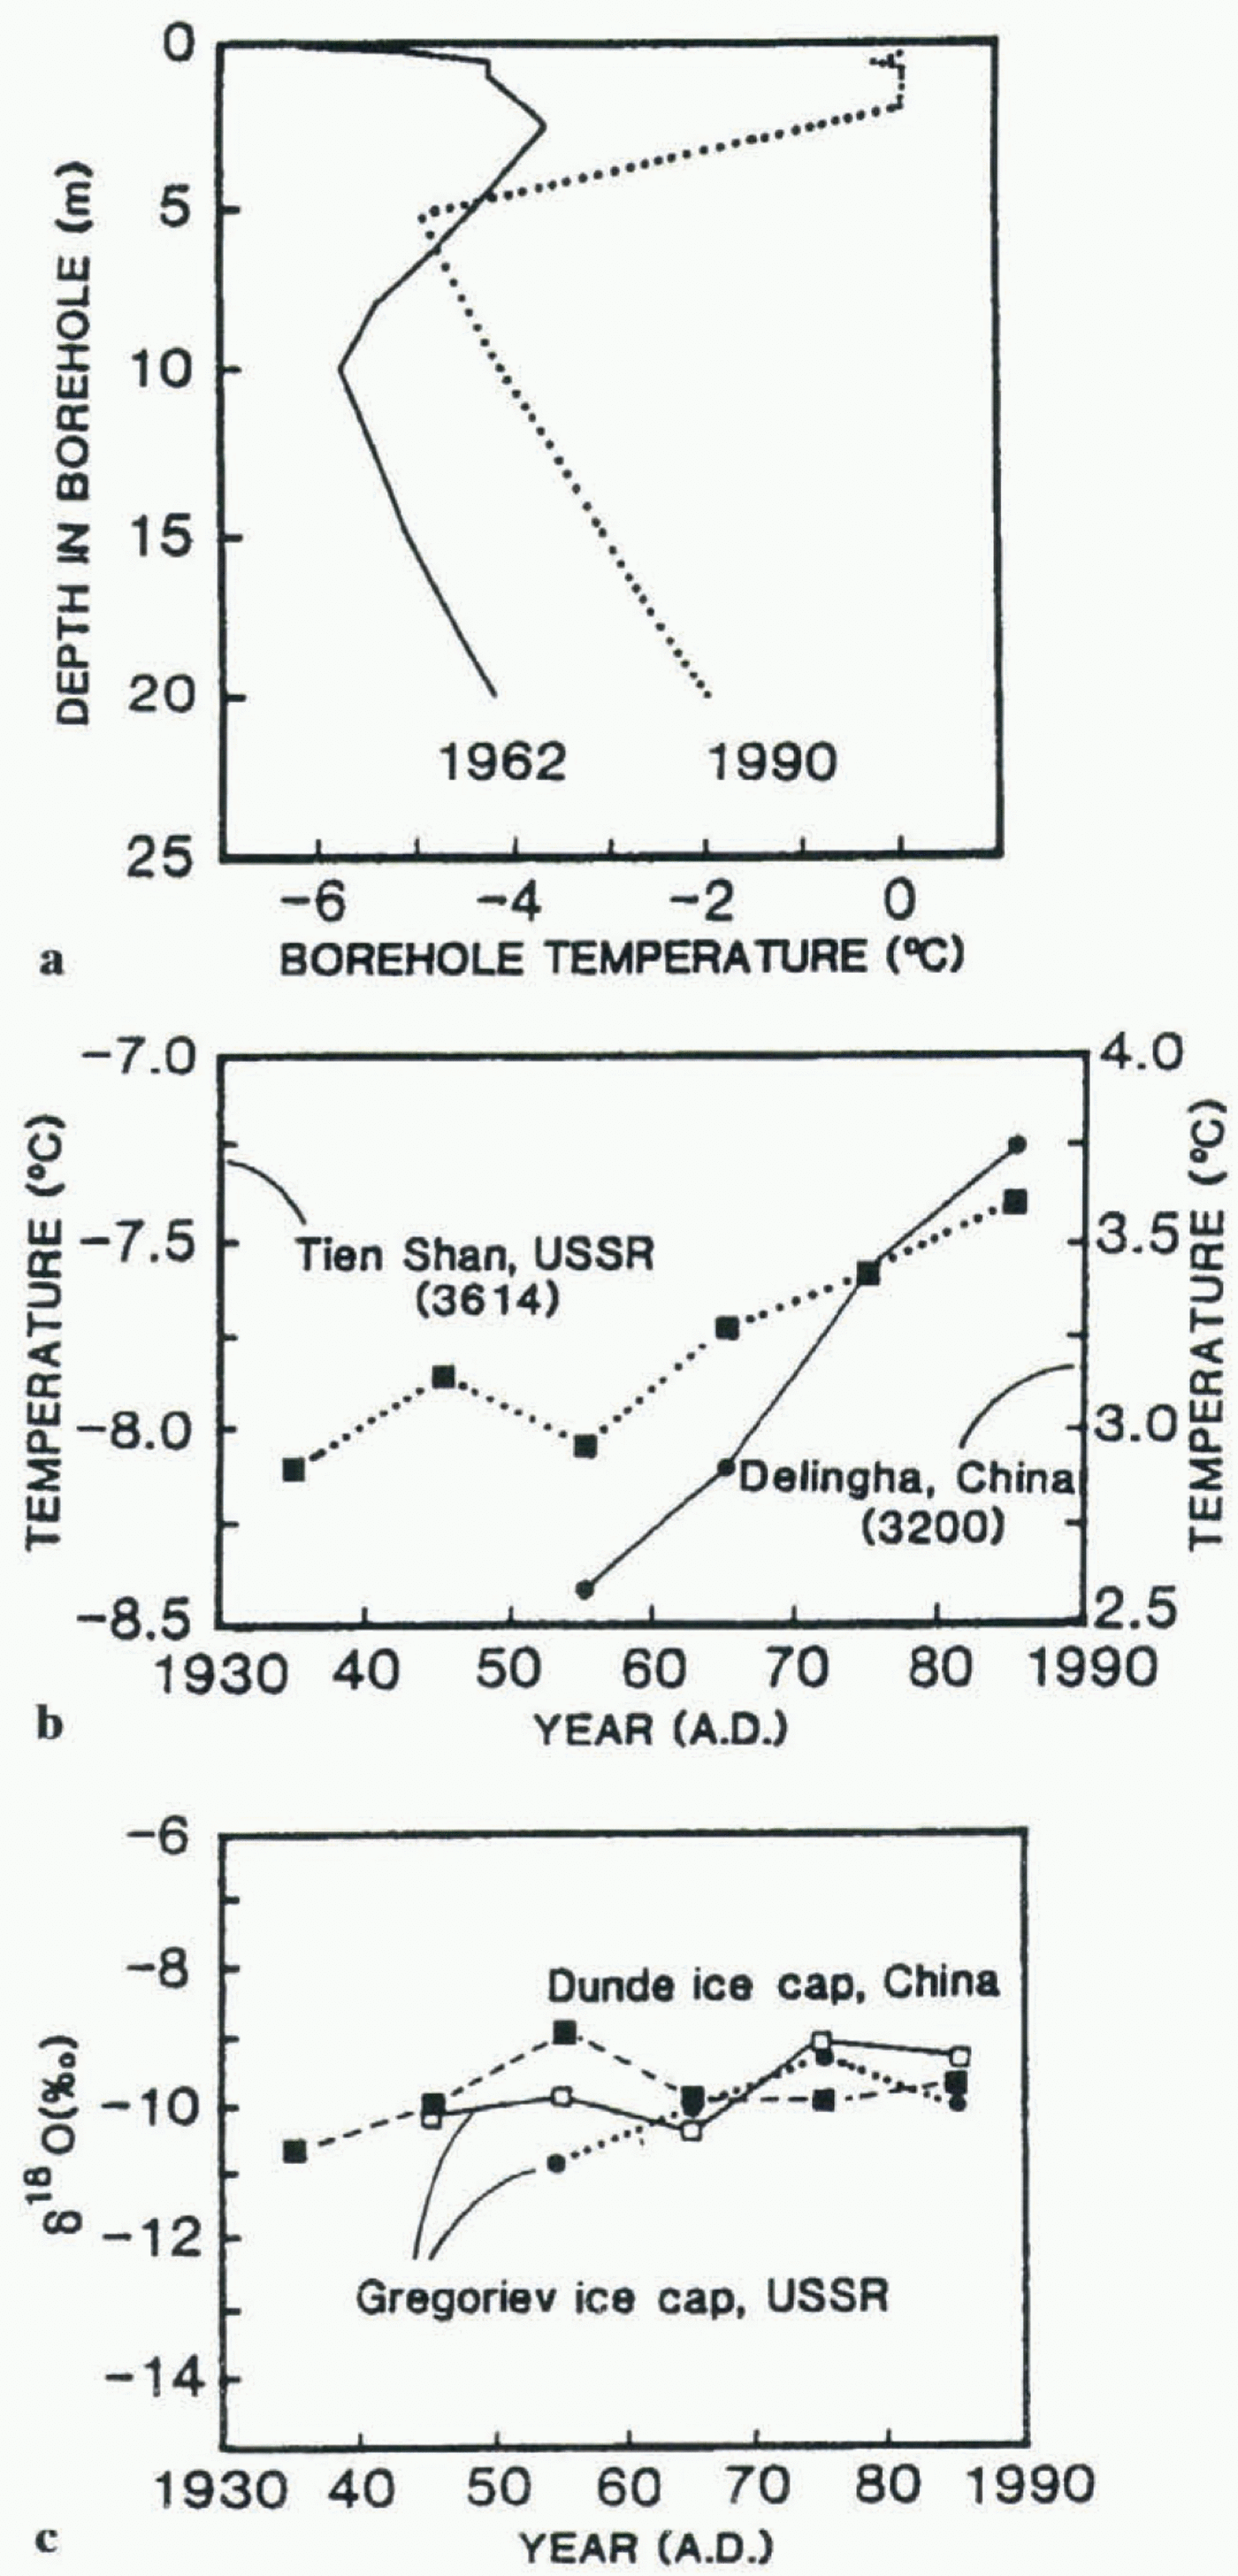
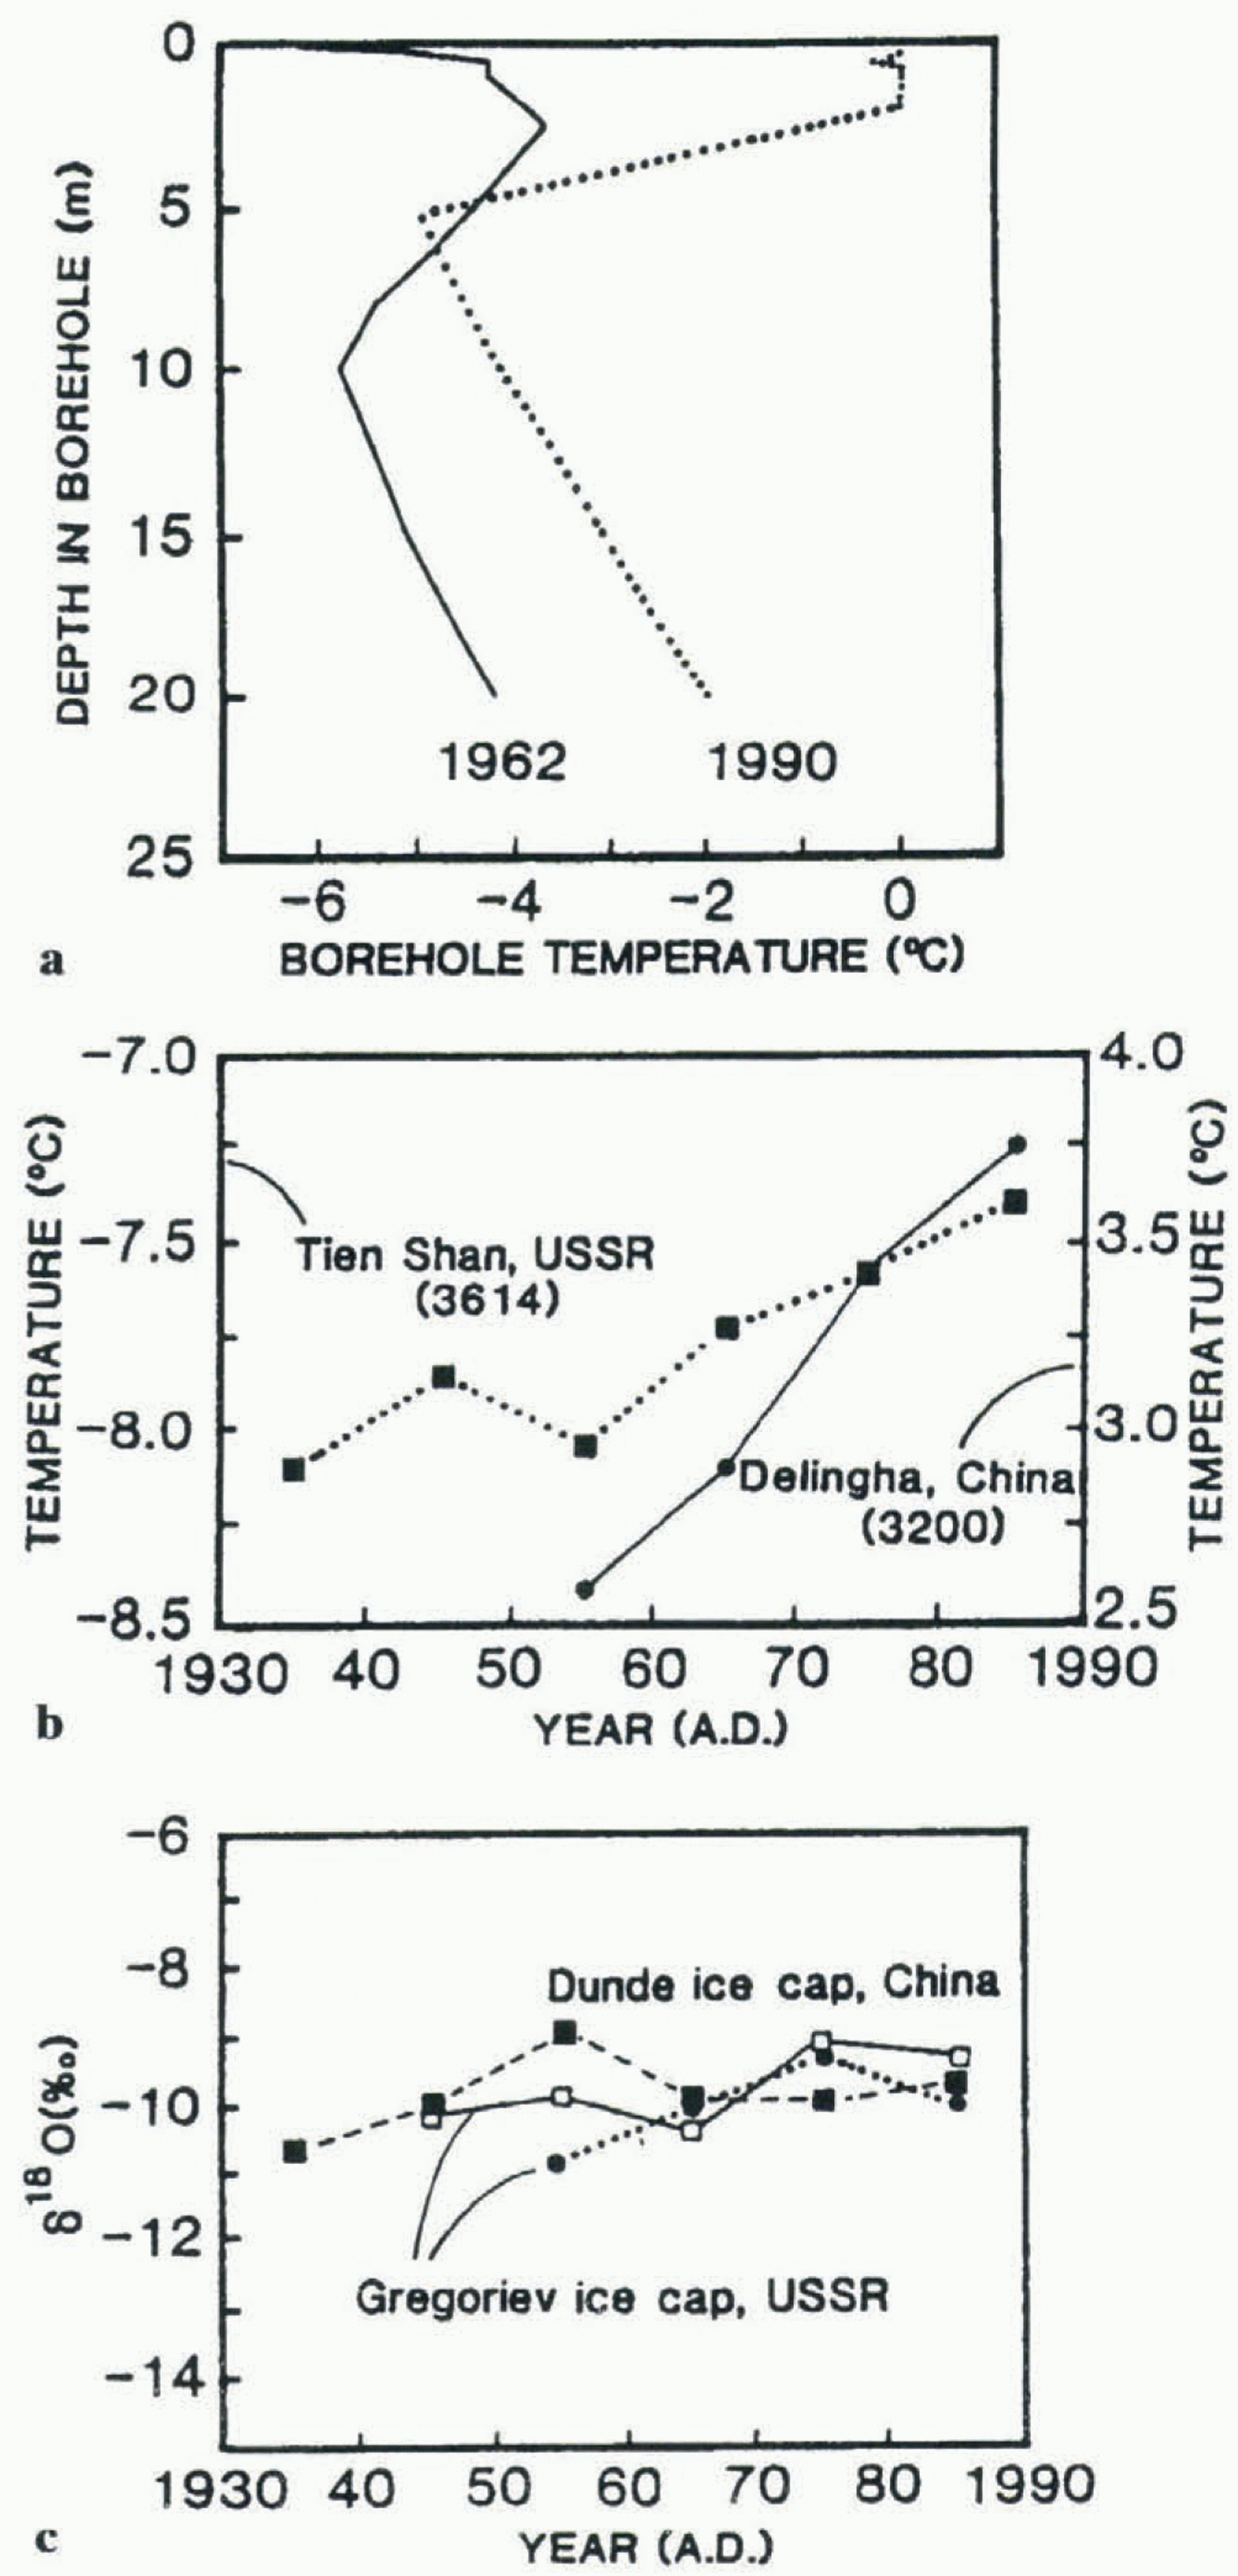
Borehole temperatures from Gregoriev ice cap; (b) Decadal averages of surface temperatures at the Tien Shan and Delingha meteorological stations; (c) Decadal averages of δ18Ovalues in two summit cores from the Gregoriev and Dunde ice caps.
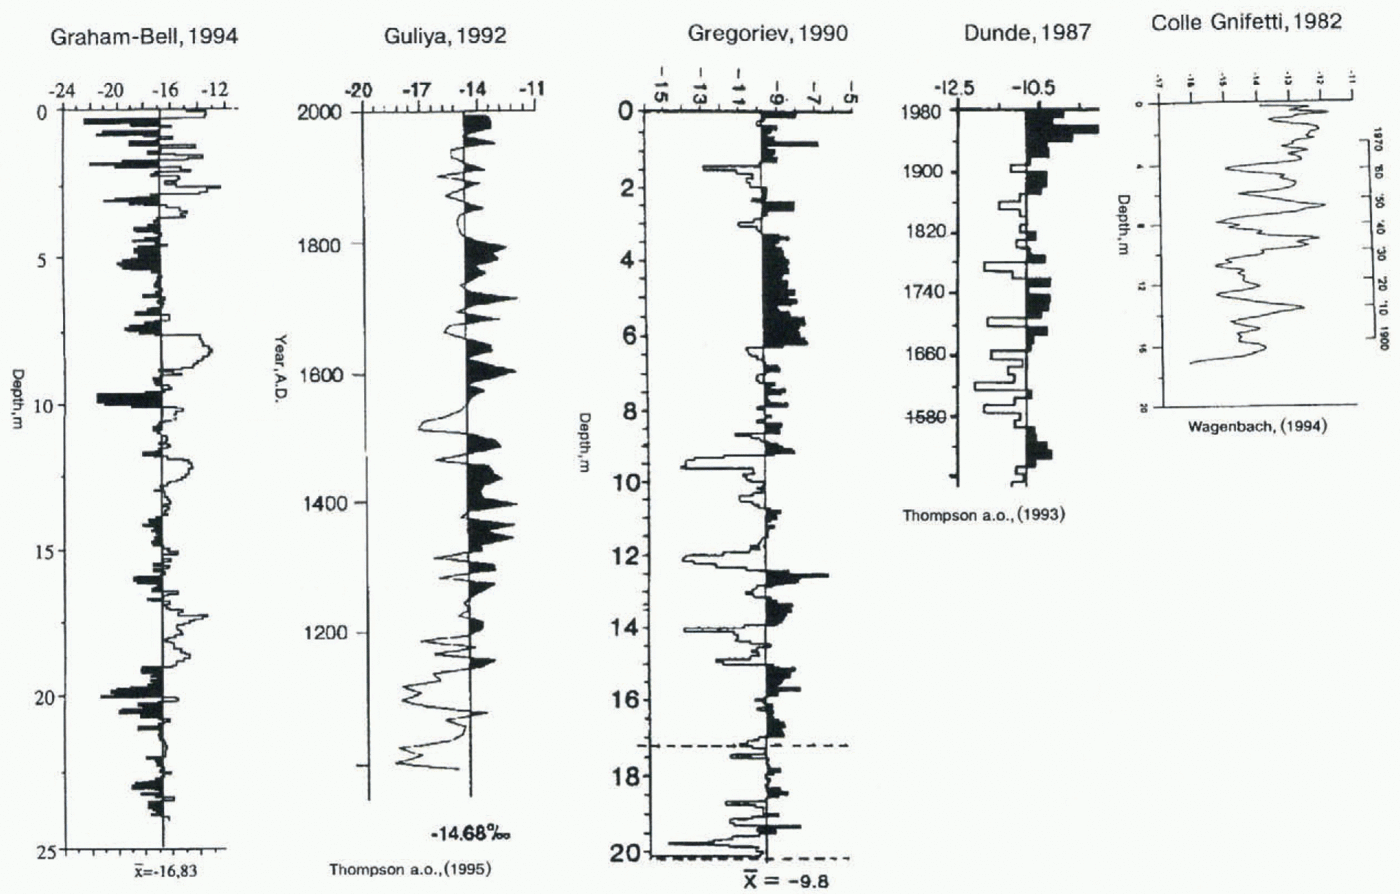
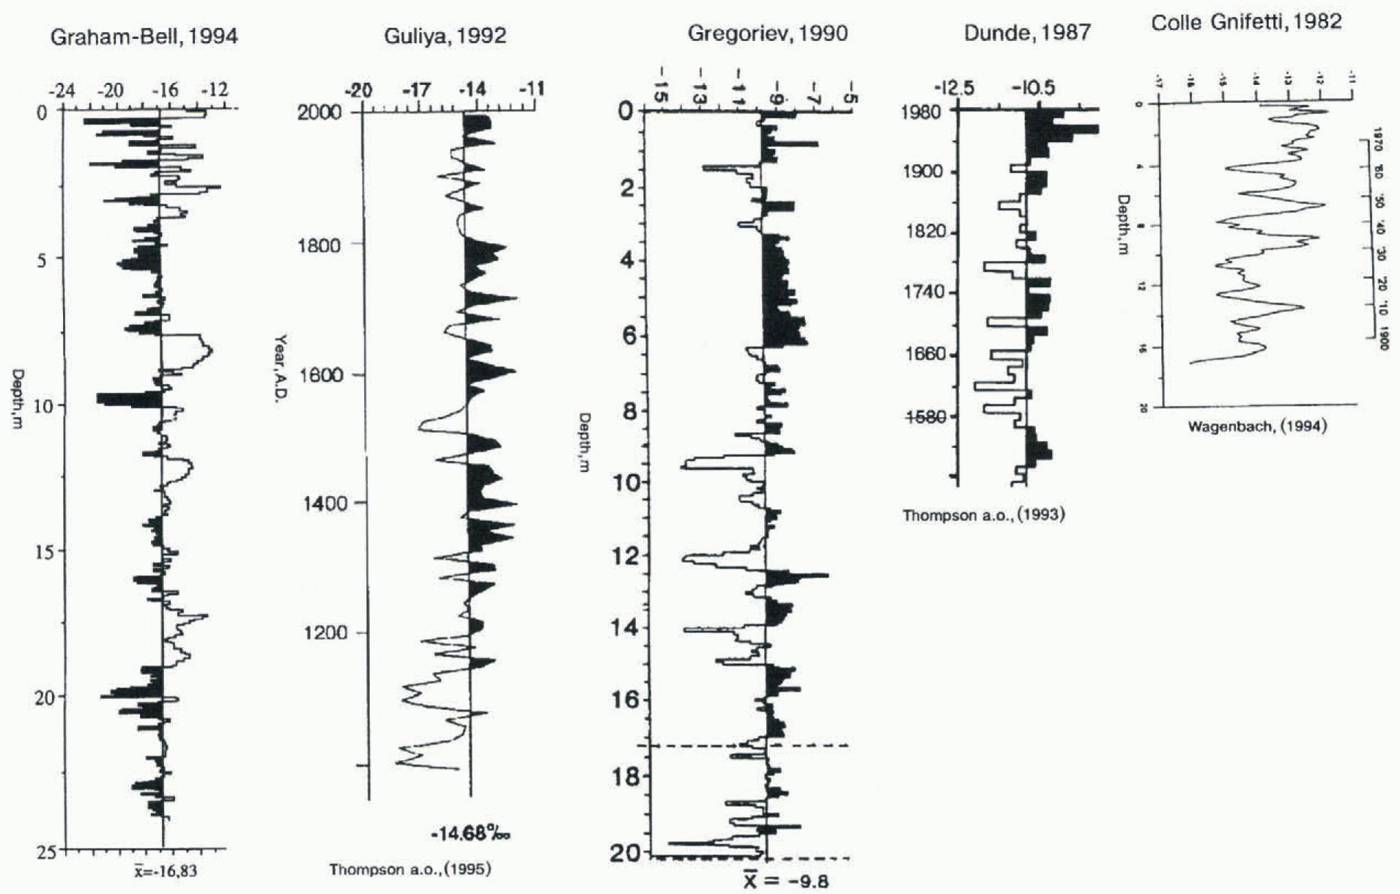
Oxygen isotope ratios from Franz Josef Land (Windy dome, Graham Bell Island), the western Kunlun (Guliya ice cap), the Tien Shan (Gregoriev ice cap), the Qilian Shan (Dunde ice cap) and the Alps (Colle Gnifetti).
increases and in warming periods it decreases. The range of precipitation change at the plateau during the last 60 years is about ± 20%, and that of the average winter air temperature is ± 30%, from the mean annual value. If the lowering of precipitation and temperature is synchronous, the temperature gradients in the active layer of the snow–firn horizon can increase by up to 35–40%, compared with periods of simultaneous warming and greater precipitation. Thus the average grain-sizes grow in periods of low winter temperatures and precipitation, compared with the warmer and higher-snowfall periods. Moreover, in these periods, ice formation occurred close to the percolation zone (Paterson, 1994), and many layers of infiltration ice were formed which also affected the growth of the average crystal size in the horizon. So, cool periods with low precipitation correspond with growth of the average crystal size, and a relative decrease in average crystal size indicates periods when ice formation occurs close to the wet-snow zone.
Repeated measurements of ice temperatures in boreholes also may show changes in the thermal regime of a glacier layer. In 1990, two boreholes were drilled in the Gregoriev ice cap, Tien Shan, to depths of 16 and 20 m (see Table 2). The temperature profiles (Fig. 4a measured indicated a temperature increase of 2.2°C compared with the temperature profile measured in 1962. These data support evidence of a recent warming in the Tien Shan.
Further evidence of recent warming in this region comes from near-surface temperature observations at the Tien Shan meteorological station (3614 m a.s.l.; 6 km from the Gregoriev ice cap) and from the weather station at Delingha (3200 m a.s.l.; 100 km from the Dunde ice cap; see Table 2). figure 4b shows a warming of 0.5°C during the past 60 years at the Tien Shan station and of 1°C at Delingha. figure 4c reflects the decadal averages of δ 18O from both the Gregoriev and Dunde ice caps which demonstrate that over the last 40 years 18O becomes isotopically enriched by approximately 1‰ (Thompson and others, in press).
Isotope ratios from ice cores in different parts of Eurasia show considerable enrichment in 18O in the 20th century. Oxygen isotopic ratio curves from Franz Josef Land (Windy Ice Cap, Graham Bell Island), western Kunlun Shan (Guliya ice cap), Tien Shan (Gregoriev ice cap), Qilian Shan (Dunde ice cap) and the Alps (Colle Gnifetti) (see Table 2) are shown in Figure 5. Enrichment by 18O is observed at all cores, This isotopic enrichment is evidence that condensation temperatures increase considerably with the formation of solid precipitation. Such similarity in changes of isotopic composition at glaciers situated thousands of kilometers from each other suggests that this recent, continuing warming in Central Asia, the Arctic and the Alps may be a large-scale feature of the current climatic regime.
Discussion
The analyses of measured and reconstructed glacier mass balances, crystal-size distribution, oxygen-isotope ratios and ice temperatures measured in boreholes provide evidence of climate warming in the 20th century in Eurasia. While the glacicrized area has been reduced in total, the glaciers situated in maritime climatic zones retreated much more quickly than in continental regions. However, since the 1970s, glaciers on the Pacific coast (Kozelskiy glacier) have begun to advance because of increasing accumulation.
Ice cores also contain information about global warming. In particular, ice crystals in the central Caucasus grow in cool, dry periods and decrease in warm periods. This characteristic feature is more stable than the isotopic geo-chemical composition which, in warm conditions, changes considerably due to percolation of meltwater.
The similarity of isotopic enrichment on the Gregoriev and Dunde ice caps, 1700 km apart, coupled with both the local meteorological observations and the 2.2°C increase in borehole temperatures on Gregoriev, strongly indicate recent warming in this part of Central Asia.
Considerable enrichment by 18O in the upper parts of ice cores indicates recent, continuing warming in Eurasia during the past century.
Conclusions
(1) Measured and reconstructed glacier mass balances prove the considerable reduction in glacierized area from the 1880s. The rate of glacier degradation in marine climates was three times that of glaciers in continental conditions (−480 and −140 mm a−1, respectively).
(2) The average crystal sizes reflect the climatic conditions in which the snow–firn layer was formed. In cool, dry periods crystal sizes increase and in warm, wet periods they decrease. During the last 60 years in the central Caucasus, a stable warming trend is reflected in average crystal sizes.
(3) Oxygen isotopic ratios from the Gregoriev ice cap, coupled with the 2.2°C increase of borehole temperatures over the last 28 years, and an increase in surface temperatures in the central Tien Shan of 0.5°C over the last 60 years, provide strong evidence for a recent warming in this area.
(4) Enrichment of 18O provides evidence of a considerable increase of condensation temperatures over the past century.
(5) Different data on glaciers’ changes, their mass balance, crystal sizes, temperatures and isotopic composition support a conclusion that climate warming is continuing during the 20th century. Moreover, the wide distribution of glaciers investigated in this study implies and confirms the global scale of the global-warming phenomenon.
Acknowledgements
The author would like to thank G. Young, J. Moore and especially an anonymous reviewer for their constructive reviews of the manuscript.