

1 Introduction

The quote above from Leo Tolstoy (Reference Tolstoy1998), which roughly translates to ‘All happy families resemble each other, but each unhappy one is unhappy in its own way’, was used by Iserles (Reference Iserles2009, Section 8.1) to point out that the numerical approximation of partial differential equations substantially differs from that of ordinary differential equations. The same quote was used in the preface of Holden and Risebro (Reference Holden and Risebro2015) to say that the theory for nonlinear equations is very different to that for linear problems, and that each nonlinearity needs to be treated in its own way. For these reasons we feel compelled to begin our discussion with the same quote, since we have chosen the unhappiest of all possible families for numerical approximation: fully nonlinear equations.
The goal of this paper is to summarize recent advances and trends in the numerical approximation and theory of strongly second-order nonlinear PDEs with an emphasis on fully nonlinear convex and non-convex PDEs. Such PDEs appear in diverse applications such as weather and climate modelling, stochastic optimal control, determining the initial shape of the universe, optimal reflector design, differential geometry, optimal transport, mathematical finance, image processing and mesh generation. Despite their importance in these application areas, and in contrast to the PDE and solution theory, the study of numerical methods for fully nonlinear problems is still an emerging field in numerical analysis. The reasons for the delayed development are plentiful. As well as the strong nonlinearity, the fundamental difficulties in computing solutions of fully nonlinear problems are the lack of regularity of solutions, the conditional uniqueness of solutions and, most importantly, the notion of viscosity solutions. Similar to weak solutions for PDEs in divergence form, the viscosity solution concept relaxes the pointwise meaning of the PDE, and while doing so, broadens the class of admissible functions in which to seek a solution. However, unlike the weak solution framework, the definition of viscosity solutions is not based on variational principles, but rather comparison principles. While viscosity solution theory and the PDE theory of fully nonlinear problems have made incredible progress during the last 25 years, numerical results for such problems have been slow to catch up due to the pointwise nature and non-variational structure found in the theory.
A breakthrough occurred in Barles and Souganidis (Reference Barles and Souganidis1991), which, roughly speaking, asserts that a consistent, stable and monotone numerical method (or general approximation scheme) converges to the viscosity solution as the discretization or regularization parameter tends to zero. The first two conditions in this framework – consistency and stability – are expected; they are the cornerstone of any convergence theory of numerical PDEs and are recognized as the basis of the Lax–Richtmyer equivalence theorem. While arguably less well known, monotonicity of numerical methods is also a long-established area of study; for example, its importance in the context of linear finite difference schemes was realized (at least) 80 years ago (see e.g. Gerschgorin Reference Gerschgorin1930, Motzkin and Wasow Reference Motzkin and Wasow1953). On the other hand, the construction of numerical methods that satisfy all three criteria, at least for fully nonlinear problems, is not immediately obvious.
Around the same time, and complementary to the Barles–Souganidis framework, Kuo and Trudinger (Reference Kuo and Trudinger1990, Reference Kuo and Trudinger1992) gave a methodology to construct consistent, stable and monotone finite difference schemes for uniformly elliptic fully nonlinear operators. In addition, they showed that such discrete schemes satisfy properties found in viscosity solution theory, including Alexandrov–Bakelman–Pucci (ABP) maximum principles, Harnack inequalities and Hölder estimates. While these results provided a fairly practical guide to computing viscosity solutions, and the theory paved the way for future advances, the fundamental issue of convergence rates was explicitly stated as an open and elusive problem.
For the next 15 years, progress in numerical fully nonlinear second-order PDEs was relatively limited and mostly constrained to the theory and convergence rates for convex PDEs, in particular the Hamilton–Jacobi–Bellman equation. In this direction, Krylov (Reference Krylov1997) introduced the groundbreaking idea of ‘shaking the coefficients’ to obtain sufficiently smooth subsolutions, which, along with comparison principles, yield rates of convergence even for degenerate problems. These techniques were later refined under various scenarios and assumptions of the problem and discretization (e.g. Barles and Jakobsen Reference Barles and Jakobsen2005, Barles and Jakobsen Reference Barles and Jakobsen2002, Krylov Reference Krylov2000), although convexity of the equation always played an essential role in the analysis.
The last ten years have seen an explosion of results for numerical nonlinear PDEs, including a variety of discretization types and convergence results. These include the construction of relatively simple and practical wide-stencil finite difference schemes tailored to specific PDEs (Oberman Reference Oberman2008, Froese and Oberman Reference Froese and Oberman2011, Benamou, Froese and Oberman Reference Benamou, Froese and Oberman2014, Froese Reference Froese2016), and the emergence of Galerkin methods for fully nonlinear problems (Feng and Neilan Reference Feng and Neilan2011, Reference Feng and Neilan2009, Feng and Lewis Reference Feng and Lewis2014, Dean and Glowinski Reference Dean and Glowinski2006a ,Reference Dean and Glowinski b ). With regard to rates of convergence, Caffarelli and Souganidis (Reference Caffarelli and Souganidis2008), using intricate regularity results, derived algebraic rates of convergence for finite difference approximations for non-convex PDEs with constant coefficients, and these results were quickly extended by Krylov (Reference Krylov2015) and Turanova (Reference Turanova2015) to problems with variable coefficients and lower-order terms. On the Galerkin front, Nochetto and Zhang (Reference Nochetto and Zhang2017a ) extended the Kuo–Trudinger theory to finite element methods and derived ABP maximum principles for linear elliptic problems. These results were soon extended in several directions, including rates of convergence for a discrete Monge–Ampère equation (Nochetto and Zhang Reference Nochetto and Zhang2017b ) and wide-stencil finite difference schemes (Nochetto, Ntogakas and Zhang Reference Nochetto, Ntogakas and Zhang2017) and the construction and analysis of finite element methods for non-convex fully nonlinear problems (Salgado and Zhang Reference Salgado and Zhang2016).
The intention of this survey is to summarize the 25 years of development of fully nonlinear numerical PDEs. Let us describe the organization and the problems we consider in the paper. After setting the notation and stating some instances of fully nonlinear problems, we review some of the basic theory and analysis of elliptic PDEs in Section 2. Here different notions of solutions are introduced and the underlying properties of the solutions and operators are discussed. Besides being of independent interest, these fundamental results motivate both the construction and analysis of the numerical methods. We develop a general framework to compute second-order elliptic problems in Section 3. Basic properties of numerical methods are given, namely consistency, stability and monotonicity, which will lay the groundwork for future developments in the paper. Special attention will be on discrete ABP maximum principles in both the finite difference and finite element setting. Section 4 concerns finite element approximations for linear problems in non-divergence form and with non-smooth coefficients. In Section 5 we combine the ideas of the previous sections and consider finite element and finite difference approximations for fully nonlinear convex PDEs. Alongside the construction and convergence of the schemes, this section will focus on the rates of convergence and the techniques to obtain these results. In Section 6 these results are extended to a particular convex PDE, the Monge–Ampère equation. In Section 7 we discuss recent results of the numerical approximations for fully nonlinear non-convex PDEs. Finally, in Section 8, we give our concluding remarks and state some open problems.
Before starting our discussion let us first briefly outline the derivation of some fully nonlinear PDEs that we focus on in the paper and illustrate their connection with some applications and other areas of mathematics.
1.1 Convex PDEs
This section obtains an instance of the Hamilton–Jacobi–Bellman (HJB) equation, a prototypical fully nonlinear second-order convex PDE, and shows how such problems arise in stochastic optimal control problems. In addition, we show below that every uniformly elliptic, convex operator with bounded gradient is an implicit HJB problem.
Following Øksendal (Reference Øksendal2003, Chapter 11) and Fleming and Soner (Reference Fleming and Soner2006), we consider a stochastic process
 $X_{\unicode[STIX]{x1D70F}}$
governed by the differential equation
 $$\begin{eqnarray}\left\{\begin{array}{@{}l@{}}\text{d}X_{\unicode[STIX]{x1D70F}}=\ell (X_{\unicode[STIX]{x1D70F}},\unicode[STIX]{x1D70F},\unicode[STIX]{x1D6FC}_{\unicode[STIX]{x1D70F}})\text{d}\unicode[STIX]{x1D70F}+\unicode[STIX]{x1D70E}(X_{\unicode[STIX]{x1D70F}},\unicode[STIX]{x1D70F},\unicode[STIX]{x1D6FC}_{\unicode[STIX]{x1D70F}})\text{d}W_{\unicode[STIX]{x1D70F}}\quad \unicode[STIX]{x1D70F}>0,\quad \\ X_{0}=x_{0}\in \mathbb{R}^{d}.\quad \end{array}\right.\end{eqnarray}$$
Here,
 $W_{\unicode[STIX]{x1D70F}}$
is a Brownian motion of dimension
 $d$
,
 $\unicode[STIX]{x1D70E}$
is a
 $d\times d$
matrix-valued function,
 $\unicode[STIX]{x1D6FC}_{\unicode[STIX]{x1D70F}}\in {\mathcal{A}}$
is a (Markov) control and
 ${\mathcal{A}}$
is the control space. Problem (1.1) describes a dynamical system driven by additive white noise with diffusion coefficient (or volatility)
 $\unicode[STIX]{x1D70E}$
and non-stochastic drift
 $\ell$
. Under appropriate smoothness and growth conditions on
 $\ell$
and
 $\unicode[STIX]{x1D70E}$
, and for a fixed
 $\unicode[STIX]{x1D6FC}(\cdot )\in {\mathcal{A}}$
, there is a path-wise unique solution to (1.1). Associated with problem (1.1) is the family of stochastic processes that satisfy (1.1) but with initial time
 $t\geq 0$
:
 $$\begin{eqnarray}\left\{\begin{array}{@{}l@{}}\text{d}X_{\unicode[STIX]{x1D70F}}^{x,t}=\ell (X_{\unicode[STIX]{x1D70F}}^{x,t},\unicode[STIX]{x1D70F},\unicode[STIX]{x1D6FC}_{\unicode[STIX]{x1D70F}})\text{d}\unicode[STIX]{x1D70F}+\unicode[STIX]{x1D70E}(X_{\unicode[STIX]{x1D70F}}^{x,t},\unicode[STIX]{x1D70F},\unicode[STIX]{x1D6FC}_{\unicode[STIX]{x1D70F}})\text{d}W_{\unicode[STIX]{x1D70F}}\quad \unicode[STIX]{x1D70F}>t,\quad \\ X_{t}^{x,t}=x\in \mathbb{R}^{d}.\quad \end{array}\right.\end{eqnarray}$$
Now let
 $\unicode[STIX]{x1D6FA}\subset \mathbb{R}^{d}$
be an open bounded domain, and set
 $Q=\unicode[STIX]{x1D6FA}\times (0,T)$
for some
 $T\in (0,\infty ]$
. Let
 $\widehat{T}$
denote the first exit time for the process
 $X_{\unicode[STIX]{x1D70F}}^{x,t}$
satisfying (1.2), that is,
 $$\begin{eqnarray}\widehat{T}=\widehat{T}^{x,t}=\inf \{\unicode[STIX]{x1D70F}>t;(X_{\unicode[STIX]{x1D70F}}^{x,t},\unicode[STIX]{x1D70F})\not \in Q\}.\end{eqnarray}$$
We then define the performance function (or cost functional)
 $$\begin{eqnarray}J(x,t,\unicode[STIX]{x1D6FC})=\mathbb{E}_{x,t}\biggl\{\int _{t}^{\widehat{T}}f(X_{\unicode[STIX]{x1D70F}}^{x,t},\unicode[STIX]{x1D70F},\unicode[STIX]{x1D6FC}_{\unicode[STIX]{x1D70F}})\text{d}\unicode[STIX]{x1D70F}+\unicode[STIX]{x1D712}_{\widehat{T}<\infty }\unicode[STIX]{x1D713}(X_{\widehat{T}}^{x,t},\widehat{T})\biggr\}\end{eqnarray}$$
over all
 $\unicode[STIX]{x1D6FC}\in {\mathcal{A}}$
under the constraint (1.2). Here,
 $f:\mathbb{R}^{d}\times \mathbb{R}\times {\mathcal{A}}\rightarrow \mathbb{R}$
is the profit rate function,
 $\unicode[STIX]{x1D713}:\mathbb{R}^{d}\times \mathbb{R}\rightarrow \mathbb{R}$
is the bequest function,
 $\unicode[STIX]{x1D712}_{\widehat{T}<\infty }$
is the indicator function, which equals one if
 $\widehat{T}<\infty$
and zero otherwise, and
 $\mathbb{E}_{x,t}$
represents the expectation conditional on
 $X_{t}^{x,t}=x$
. We then consider the problem of finding the value function
 $u:\bar{Q}\rightarrow \mathbb{R}$
and optimal control
 $\unicode[STIX]{x1D6FC}^{\ast }\in {\mathcal{A}}$
such that
 $$\begin{eqnarray}u(x,t)=\sup _{\unicode[STIX]{x1D6FC}\in {\mathcal{A}}}J(x,t,\unicode[STIX]{x1D6FC})=J(x,t,\unicode[STIX]{x1D6FC}^{\ast }).\end{eqnarray}$$
Let us now give a heuristic derivation of the Hamilton–Jacobi–Bellman equation based on Bellman’s principle of optimality and Itô’s lemma. First, Bellman’s principle of optimality states that Bellman (Reference Bellman2010):
Whatever the initial state
 $\{X_{s}^{x,t}\}_{s<\unicode[STIX]{x1D70F}}$
and initial decision
 $\{\unicode[STIX]{x1D6FC}_{s}\}_{s<\unicode[STIX]{x1D70F}}$
are, the remaining controls
 $\{\unicode[STIX]{x1D6FC}_{s}\}_{s>\unicode[STIX]{x1D70F}}$
must constitute an optimal policy with regard to the state
 $X_{\unicode[STIX]{x1D70F}}^{x,t}$
resulting from the initial decision.
More precisely, this principle equates to
 $$\begin{eqnarray}u(x,t)=\sup _{\unicode[STIX]{x1D6FC}\in {\mathcal{A}}}\mathbb{E}_{x,t}\biggl\{u(X_{t+\unicode[STIX]{x1D6FF}t}^{x,t},t+\unicode[STIX]{x1D6FF}t)+\int _{t}^{t+\unicode[STIX]{x1D6FF}t}f(X_{\unicode[STIX]{x1D70F}}^{x,t},\unicode[STIX]{x1D70F},\unicode[STIX]{x1D6FC}_{\unicode[STIX]{x1D70F}})\text{d}\unicode[STIX]{x1D70F}\biggr\}.\end{eqnarray}$$
Next, recalling that
 $X_{t}^{x,t}=x$
, by Itô’s lemma we obtain
 $$\begin{eqnarray}\displaystyle u(X_{t+\unicode[STIX]{x1D6FF}t}^{x,t},t+\unicode[STIX]{x1D6FF}t) & = & \displaystyle u(x,t)+\int _{t}^{t+\unicode[STIX]{x1D6FF}t}\displaystyle \frac{\unicode[STIX]{x2202}u}{\unicode[STIX]{x2202}t}\text{d}\unicode[STIX]{x1D70F}+\int _{t}^{t+\unicode[STIX]{x1D6FF}t}Du\cdot \text{d}X_{\unicode[STIX]{x1D70F}}^{x,t}\nonumber\\ \displaystyle & & \displaystyle \qquad +\,\displaystyle \frac{1}{2}\int _{t}^{t+\unicode[STIX]{x1D6FF}t}\text{d}X_{\unicode[STIX]{x1D70F}}^{x,t}\cdot D^{2}u\text{d}X_{\unicode[STIX]{x1D70F}}^{x,t}.\nonumber\end{eqnarray}$$
Since the state variable
 $X_{\unicode[STIX]{x1D70F}}^{x,t}$
is governed by the stochastic equation (1.2), and by using the identity
 $\text{d}W_{\unicode[STIX]{x1D70F}}\otimes \text{d}W_{\unicode[STIX]{x1D70F}}=I\text{d}\unicode[STIX]{x1D70F}$
, we obtain
 $$\begin{eqnarray}\displaystyle & & \displaystyle u(X_{t+\unicode[STIX]{x1D6FF}t}^{x,t},t+\unicode[STIX]{x1D6FF}t)-u(x,t)\nonumber\\ \displaystyle & & \displaystyle \qquad =\int _{t}^{t+\unicode[STIX]{x1D6FF}t}\biggl(\displaystyle \frac{\unicode[STIX]{x2202}u}{\unicode[STIX]{x2202}t}+Du\cdot \ell +\displaystyle \frac{1}{2}(\unicode[STIX]{x1D70E}\unicode[STIX]{x1D70E}^{\intercal }):D^{2}u\biggr)\text{d}\unicode[STIX]{x1D70F}+\int _{t}^{t+\unicode[STIX]{x1D6FF}t}(\unicode[STIX]{x1D70E}^{\intercal }Du)\cdot \text{d}W_{\unicode[STIX]{x1D70F}}.\nonumber\end{eqnarray}$$
Therefore, from principle of optimality (1.3),
 $$\begin{eqnarray}\sup _{\unicode[STIX]{x1D6FC}\in {\mathcal{A}}}\mathbb{E}_{x,t}\biggl\{u(X_{t+\unicode[STIX]{x1D6FF}t}^{x,t},t+\unicode[STIX]{x1D6FF}t)-u(x,t)+\int _{t}^{t+\unicode[STIX]{x1D6FF}t}f(X_{\unicode[STIX]{x1D70F}}^{x,t},\unicode[STIX]{x1D70F},\unicode[STIX]{x1D6FC})\text{d}\unicode[STIX]{x1D70F}\biggr\}=0,\end{eqnarray}$$
and Itô’s formula above, we obtain
 $$\begin{eqnarray}\sup _{\unicode[STIX]{x1D6FC}\in {\mathcal{A}}}\mathbb{E}_{x,t}\biggl\{\int _{t}^{t+\unicode[STIX]{x1D6FF}t}\biggl(\displaystyle \frac{\unicode[STIX]{x2202}u}{\unicode[STIX]{x2202}t}+Du\cdot \ell +\displaystyle \frac{1}{2}(\unicode[STIX]{x1D70E}\unicode[STIX]{x1D70E}^{\intercal }):D^{2}u+f\biggr)\text{d}\unicode[STIX]{x1D70F}\biggr\}=0,\end{eqnarray}$$
where we used that
 $$\begin{eqnarray}\mathbb{E}_{x,t}\biggl\{\int _{t}^{t+\unicode[STIX]{x1D6FF}t}(\unicode[STIX]{x1D70E}^{\intercal }Du)\cdot \text{d}W_{\unicode[STIX]{x1D70F}}\biggr\}=0.\end{eqnarray}$$
Dividing by
 $\unicode[STIX]{x1D6FF}t$
and formally taking the limit
 $\unicode[STIX]{x1D6FF}t\rightarrow 0$
, we then obtain a deterministic equation, namely the Hamilton–Jacobi–Bellman equation
 $$\begin{eqnarray}\displaystyle \frac{\unicode[STIX]{x2202}u}{\unicode[STIX]{x2202}t}(x,t)+\sup _{\unicode[STIX]{x1D6FC}\in {\mathcal{A}}}({\mathcal{L}}^{\unicode[STIX]{x1D6FC}}u(x,t)+f(x,t,\unicode[STIX]{x1D6FC}))=0,\end{eqnarray}$$
where
 $$\begin{eqnarray}{\mathcal{L}}^{\unicode[STIX]{x1D6FC}}u(x,t)=Du(x,t)\cdot \ell (x,t,\unicode[STIX]{x1D6FC})+\displaystyle \frac{1}{2}\unicode[STIX]{x1D70E}(x,t,\unicode[STIX]{x1D6FC})\unicode[STIX]{x1D70E}(x,t,\unicode[STIX]{x1D6FC})^{\intercal }:D^{2}u(x,t).\end{eqnarray}$$
To derive the equation, we assumed that the value function
 $u(x,t)$
has continuous second-order derivatives. However, the PDE theory reveals that the solution of the HJB equation in general does not satisfy this regularity assumption. To justify the derivation above, the concept of viscosity solutions was introduced in Crandall and Lions (Reference Crandall and Lions1983) for first-order Hamilton–Jacobi equations and later generalized to second-order Hamilton–Jacobi–Bellman equations (Lions Reference Lions1982, Reference Lions1983). Viscosity solutions – an essential concept in the PDE theory – will also play an important role in this paper.
1.2 Non-convex PDEs
The Isaacs equation, a prototypical non-convex PDE, describes zero sum stochastic games with two players. Each player has one control and they have opposite objectives. The first player chooses a control to maximize the expected payoff, whereas the second player chooses a control to minimize it. Stochastic game theory has wide applications in engineering and mathematical finance. Here, we follow the ideas in Fleming and Souganidis (Reference Fleming and Souganidis1989) to derive the equation.
The dynamics of the stochastic differential game we investigate are given by the controlled stochastic differential equation
 $$\begin{eqnarray}\left\{\begin{array}{@{}l@{}}\text{d}X_{\unicode[STIX]{x1D70F}}^{x,t}=\ell (X_{\unicode[STIX]{x1D70F}}^{x,t},\unicode[STIX]{x1D70F},\unicode[STIX]{x1D6FC}_{\unicode[STIX]{x1D70F}},\unicode[STIX]{x1D6FD}_{\unicode[STIX]{x1D70F}})\text{d}\unicode[STIX]{x1D70F}+\unicode[STIX]{x1D70E}(X_{\unicode[STIX]{x1D70F}}^{x,t},\unicode[STIX]{x1D70F},\unicode[STIX]{x1D6FC}_{\unicode[STIX]{x1D70F}},\unicode[STIX]{x1D6FD}_{\unicode[STIX]{x1D70F}})\text{d}W_{\unicode[STIX]{x1D70F}}\quad \unicode[STIX]{x1D70F}>t,\quad \\ X_{t}^{x,t}=x\in \mathbb{R}^{d},\quad \end{array}\right.\end{eqnarray}$$
and the expected payoff is
 $$\begin{eqnarray}J(x,t,\unicode[STIX]{x1D6FC},\unicode[STIX]{x1D6FD})=\mathbb{E}_{x,t}\biggl\{\int _{t}^{\widehat{T}}f(X_{\unicode[STIX]{x1D70F}}^{x,t},\unicode[STIX]{x1D70F},\unicode[STIX]{x1D6FC}_{\unicode[STIX]{x1D70F}},\unicode[STIX]{x1D6FD}_{\unicode[STIX]{x1D70F}})\text{d}\unicode[STIX]{x1D70F}+\unicode[STIX]{x1D712}_{\widehat{T}<\infty }\unicode[STIX]{x1D713}(X_{\widehat{T}}^{x,t},\widehat{T})\biggr\},\end{eqnarray}$$
where
 $X_{\unicode[STIX]{x1D70F}}^{x,t}$
satisfies the differential equation (1.4) for
 $\unicode[STIX]{x1D70F}>t$
and has initial condition
 $X_{t}^{x,t}=x$
.
The Isaacs equation can be derived in a similar fashion to the HJB equation. If, at time
 $t$
, the first player chooses a control
 $\unicode[STIX]{x1D6FC}$
to maximize the expected payoff
 $J$
, and the second player, based on the decision of the first player, chooses the control
 $\unicode[STIX]{x1D6FD}$
to minimize it, then we set
 $$\begin{eqnarray}u^{+}(x,t)=\inf _{\unicode[STIX]{x1D6FD}\in {\mathcal{B}}}\sup _{\unicode[STIX]{x1D6FC}\in {\mathcal{A}}}\mathbb{E}_{x,t}\{J(x,t,\unicode[STIX]{x1D6FC},\unicode[STIX]{x1D6FD})\}\end{eqnarray}$$
and call this the upper value function. On the other hand, if the second player makes the decision first and the first player reacts accordingly, then we set the lower value function as
 $$\begin{eqnarray}u^{-}(x,t)=\sup _{\unicode[STIX]{x1D6FC}\in {\mathcal{A}}}\inf _{\unicode[STIX]{x1D6FD}\in {\mathcal{B}}}\mathbb{E}_{x,t}\{J(x,t,\unicode[STIX]{x1D6FC},\unicode[STIX]{x1D6FD})\}.\end{eqnarray}$$
By the principle of optimality we have
 $$\begin{eqnarray}u^{+}(x,t)=\inf _{\unicode[STIX]{x1D6FD}\in {\mathcal{B}}}\sup _{\unicode[STIX]{x1D6FC}\in {\mathcal{A}}}\mathbb{E}_{x,t}\biggl\{u^{+}(X_{t+\unicode[STIX]{x1D6FF}t}^{x,t},t+\unicode[STIX]{x1D6FF}t)+\int _{t}^{t+\unicode[STIX]{x1D6FF}t}f(X_{\unicode[STIX]{x1D70F}}^{x,t},\unicode[STIX]{x1D70F},\unicode[STIX]{x1D6FC},\unicode[STIX]{x1D6FD})\text{d}\unicode[STIX]{x1D70F}\biggr\}.\end{eqnarray}$$
Using a derivation similar to the HJB equation, we obtain that for all
 $(x,t)\in Q$
the upper value function must satisfy
 $$\begin{eqnarray}\displaystyle \frac{\unicode[STIX]{x2202}u^{+}}{\unicode[STIX]{x2202}t}(x,t)+H^{+}(x,t,Du^{+},D^{2}u^{+})=0,\end{eqnarray}$$
where
 $$\begin{eqnarray}H^{+}(x,t,\mathbf{p},M)=\inf _{\unicode[STIX]{x1D6FD}\in {\mathcal{B}}}\sup _{\unicode[STIX]{x1D6FC}\in {\mathcal{A}}}\biggl\{\displaystyle \frac{1}{2}\unicode[STIX]{x1D70E}\unicode[STIX]{x1D70E}^{\intercal }:M+\ell (x,t,\unicode[STIX]{x1D6FC},\unicode[STIX]{x1D6FD})\cdot \mathbf{p}+f(x,t,\unicode[STIX]{x1D6FC},\unicode[STIX]{x1D6FD})\biggr\}.\end{eqnarray}$$
Similarly we obtain, for
 $(x,t)\in Q$
,
 $$\begin{eqnarray}\displaystyle \frac{\unicode[STIX]{x2202}u^{-}}{\unicode[STIX]{x2202}t}(x,t)+H^{-}(x,t,Du^{-},D^{2}u^{-})=0,\end{eqnarray}$$
with
 $$\begin{eqnarray}H^{-}(x,t,\mathbf{p},M)=\sup _{\unicode[STIX]{x1D6FC}\in {\mathcal{A}}}\inf _{\unicode[STIX]{x1D6FD}\in {\mathcal{B}}}\biggl\{\displaystyle \frac{1}{2}\unicode[STIX]{x1D70E}\unicode[STIX]{x1D70E}^{\intercal }:M+\ell (x,t,\unicode[STIX]{x1D6FC},\unicode[STIX]{x1D6FD})\cdot \mathbf{p}+f(x,t,\unicode[STIX]{x1D6FC},\unicode[STIX]{x1D6FD})\biggr\}.\end{eqnarray}$$
We finally comment that if the Isaacs’ condition holds, that is, we have that for all
 $x,t,\mathbf{p},M$
,
 $$\begin{eqnarray}H^{+}(x,t,\mathbf{p},M)=H^{-}(x,t,\mathbf{p},M),\end{eqnarray}$$
then we can conclude that
 $u^{+}(x,t)=u^{-}(x,t)$
for all
 $(x,t)\in Q$
. In this case, we say that an optimal policy exists.
1.3 Characterizations of elliptic PDEs
Let us show that there is no loss in generality in confining our considerations to these two equations by following the construction proposed by Evans (Reference Evans1980, Lemma 2.2). Let
 $\unicode[STIX]{x1D6FA}\subset \mathbb{R}^{d}$
be a bounded domain and let
 $F:\unicode[STIX]{x1D6FA}\times \mathbb{S}^{d}\rightarrow \mathbb{R}$
be continuously differentiable, non-decreasing with respect to its second argument and with bounded gradient. Here,
 $\mathbb{S}^{d}$
denotes the space of symmetric
 $d\times d$
matrices. We comment that, as we will see below (see Definition 2.10), these conditions guarantee that the operator
 $F$
is elliptic. We have the following representation: for every
 $x\in \unicode[STIX]{x1D6FA}$
and
 $M\in \mathbb{S}^{d}$
, we have
 $$\begin{eqnarray}F(x,M)=\inf _{\unicode[STIX]{x1D6FD}\in \mathbb{S}^{d}}\sup _{\unicode[STIX]{x1D6FC}\in \mathbb{S}^{d}}\biggl[\int _{0}^{1}\displaystyle \frac{\unicode[STIX]{x2202}F}{\unicode[STIX]{x2202}M}(x,(1-t)\unicode[STIX]{x1D6FD}+t\unicode[STIX]{x1D6FC}):(M-\unicode[STIX]{x1D6FD})+F(x,\unicode[STIX]{x1D6FD})\biggr].\end{eqnarray}$$
To see this, let
 $\mathit{IS}$
denote the right-hand side of (1.5), and note that by setting
 $\unicode[STIX]{x1D6FD}=M$
we obtain
 $$\begin{eqnarray}\displaystyle \mathit{IS} & \leq & \displaystyle \sup _{\unicode[STIX]{x1D6FC}\in \mathbb{S}^{d}}\biggl[\int _{0}^{1}\displaystyle \frac{\unicode[STIX]{x2202}F}{\unicode[STIX]{x2202}M}(x,(1-t)M+t\unicode[STIX]{x1D6FC}):(M-M)+F(x,M)\biggr]\nonumber\\ \displaystyle & = & \displaystyle F(x,M).\nonumber\end{eqnarray}$$
On the other hand, setting
 $\unicode[STIX]{x1D6FC}=M$
we obtain that
 $$\begin{eqnarray}\displaystyle & & \displaystyle \int _{0}^{1}\displaystyle \frac{\unicode[STIX]{x2202}F}{\unicode[STIX]{x2202}M}(x,(1-t)\unicode[STIX]{x1D6FD}+tM):(M-\unicode[STIX]{x1D6FD})+F(x,\unicode[STIX]{x1D6FD})\nonumber\\ \displaystyle & & \displaystyle \qquad \leq \,\sup _{\unicode[STIX]{x1D6FC}\in \mathbb{S}^{d}}\biggl[\int _{0}^{1}\displaystyle \frac{\unicode[STIX]{x2202}F}{\unicode[STIX]{x2202}M}(x,(1-t)\unicode[STIX]{x1D6FD}+t\unicode[STIX]{x1D6FC}):(M-\unicode[STIX]{x1D6FD})+F(x,\unicode[STIX]{x1D6FD})\biggr].\nonumber\end{eqnarray}$$
Under the given assumptions on
 $F$
, the left-hand side of this inequality can be rewritten as
 $$\begin{eqnarray}\displaystyle & & \displaystyle \int _{0}^{1}\displaystyle \frac{\unicode[STIX]{x2202}F}{\unicode[STIX]{x2202}M}(x,(1-t)\unicode[STIX]{x1D6FD}+tM):(M-\unicode[STIX]{x1D6FD})+F(x,\unicode[STIX]{x1D6FD})\nonumber\\ \displaystyle & & \displaystyle \quad =\int _{0}^{1}\displaystyle \frac{\text{d}}{\text{d}t}F(x,(1-t)\unicode[STIX]{x1D6FD}+tM)+F(x,\unicode[STIX]{x1D6FD})=F(x,M)-F(x,\unicode[STIX]{x1D6FD})+F(x,\unicode[STIX]{x1D6FD}),\nonumber\end{eqnarray}$$
and consequently
 $$\begin{eqnarray}F(x,M)\leq \sup _{\unicode[STIX]{x1D6FC}\in \mathbb{S}^{d}}\biggl[\int _{0}^{1}\displaystyle \frac{\unicode[STIX]{x2202}F}{\unicode[STIX]{x2202}M}(x,(1-t)\unicode[STIX]{x1D6FD}+t\unicode[STIX]{x1D6FC}):(M-\unicode[STIX]{x1D6FD})+F(x,\unicode[STIX]{x1D6FD})\biggr],\end{eqnarray}$$
or
 $F(x,M)\leq \mathit{IS}$
.
With representation (1.5) at hand we define
 $$\begin{eqnarray}\displaystyle A^{\unicode[STIX]{x1D6FC},\unicode[STIX]{x1D6FD}}(x) & = & \displaystyle \int _{0}^{1}\displaystyle \frac{\unicode[STIX]{x2202}F}{\unicode[STIX]{x2202}M}(x,(1-t)\unicode[STIX]{x1D6FD}+t\unicode[STIX]{x1D6FC}),\nonumber\\ \displaystyle f^{\unicode[STIX]{x1D6FC},\unicode[STIX]{x1D6FD}}(x) & = & \displaystyle A^{\unicode[STIX]{x1D6FC},\unicode[STIX]{x1D6FD}}(x):\unicode[STIX]{x1D6FD}-F(x,\unicode[STIX]{x1D6FD}),\nonumber\\ \displaystyle {\mathcal{A}} & = & \displaystyle {\mathcal{B}}=\mathbb{S}^{d},\nonumber\end{eqnarray}$$
and note that, since
 $F(x,\cdot )$
is non-decreasing,
 $A^{\unicode[STIX]{x1D6FC},\unicode[STIX]{x1D6FD}}(x)\geq 0$
for all
 $\unicode[STIX]{x1D6FC}\in {\mathcal{A}}$
,
 $\unicode[STIX]{x1D6FD}\in {\mathcal{B}}$
and
 $x\in \unicode[STIX]{x1D6FA}$
. In conclusion,
 $F(x,\cdot )$
can be represented as the inf-sup of a family of affine maps, that is,
 $$\begin{eqnarray}F(x,M)=\inf _{\unicode[STIX]{x1D6FD}\in {\mathcal{B}}}\sup _{\unicode[STIX]{x1D6FC}\in {\mathcal{A}}}[A^{\unicode[STIX]{x1D6FC},\unicode[STIX]{x1D6FD}}(x):M-f^{\unicode[STIX]{x1D6FC},\unicode[STIX]{x1D6FD}}(x)].\end{eqnarray}$$
If we assume in addition that
 $F$
is convex in its second argument, then we have
 $$\begin{eqnarray}F(x,M)-F(x,\unicode[STIX]{x1D6FC})\geq \displaystyle \frac{\unicode[STIX]{x2202}F}{\unicode[STIX]{x2202}M}(x,\unicode[STIX]{x1D6FC}):(M-\unicode[STIX]{x1D6FC}),\quad \text{for all}~\unicode[STIX]{x1D6FC}\in \mathbb{S}^{d}.\end{eqnarray}$$
Setting
 $\unicode[STIX]{x1D6FD}=\unicode[STIX]{x1D6FC}$
in (1.5) yields
 $$\begin{eqnarray}F(x,M)\leq \sup _{\unicode[STIX]{x1D6FC}\in \mathbb{S}^{d}}\biggl[\displaystyle \frac{\unicode[STIX]{x2202}F}{\unicode[STIX]{x2202}M}(x,\unicode[STIX]{x1D6FC}):(M-\unicode[STIX]{x1D6FC})+F(x,\unicode[STIX]{x1D6FC})\biggr],\end{eqnarray}$$
so that
 $$\begin{eqnarray}F(x,M)=\sup _{\unicode[STIX]{x1D6FC}\in {\mathcal{A}}}[A^{\unicode[STIX]{x1D6FC}}(x):M-f^{\unicode[STIX]{x1D6FC}}(x)],\end{eqnarray}$$
with
 ${\mathcal{A}}=\mathbb{S}^{d}$
and
 $$\begin{eqnarray}A^{\unicode[STIX]{x1D6FC}}(x)=\displaystyle \frac{\unicode[STIX]{x2202}F}{\unicode[STIX]{x2202}M}(x,\unicode[STIX]{x1D6FC})\geq 0,\quad f^{\unicode[STIX]{x1D6FC}}(x)=\displaystyle \frac{\unicode[STIX]{x2202}F}{\unicode[STIX]{x2202}M}(x,\unicode[STIX]{x1D6FC}):\unicode[STIX]{x1D6FC}-F(x,\unicode[STIX]{x1D6FC}).\end{eqnarray}$$
We conclude by remarking that more general types of dependence can also be reduced to a similar inf-sup form; see, for instance, Kuo and Trudinger (Reference Kuo and Trudinger1992, Section 2.1), Katsoulakis (Reference Katsoulakis1995) and Koike and Świech (Reference Koike and Świech2013).
Nomenclature

2 Elements of the theory of strongly nonlinear elliptic PDEs
In order to get an idea of how to discretize strongly nonlinear partial differential equations, we must first understand their underlying structure and the main ideas that are at the basis of their theory and analysis. In this introductory section we collect all the relevant information that will later serve as a guide in the construction and analysis of numerical schemes. We will describe the fundamental properties that define an elliptic equation, even in the case of strong nonlinearities, and thereby define various suitable notions of solutions and their properties. We will provide existence and non-existence results, as well as a review of the available regularity results. While it is not our intention to provide a thorough exposition of the theory, which can be found in textbooks such as those of Evans (Reference Evans2010), Han and Lin (Reference Han and Lin2011), Gilbarg and Trudinger (Reference Gilbarg and Trudinger2001), Krylov (Reference Krylov1996, Reference Krylov2008) and Maugeri, Palagachev and Softova (Reference Maugeri, Palagachev and Softova2000), we believe it is fundamental to understand this if one wishes to provide a rigorous analysis of approximation schemes.
2.1 Two defining consequences of ellipticity
We begin our description by providing two fundamental properties that lie at the heart of much of the theory for elliptic PDEs, namely energy considerations and comparison principles. We will see how these give rise to various concepts of solutions and how much of the existence and regularity theory stems from these two simple ideas.
To make matters precise, we set
 $\unicode[STIX]{x1D6FA}\subset \mathbb{R}^{d}$
with
 $d\geq 1$
to be a bounded domain with Lipschitz boundary. If further smoothness of the domain becomes necessary we will specify this at every stage. For simplicity, and because these ideas are better motivated in this case, let us consider the Laplacian which, for a function
 $u\in C^{2}(\unicode[STIX]{x1D6FA})$
, is defined by
 $$\begin{eqnarray}\unicode[STIX]{x1D6E5}u=\mathop{\sum }_{i=1}^{d}\displaystyle \frac{\unicode[STIX]{x2202}^{2}u}{\unicode[STIX]{x2202}x_{i}^{2}}.\end{eqnarray}$$
The first fundamental property that can be observed for this operator is a maximum principle.
Theorem 2.1 (maximum principle).
Let
 $u\in C^{2}(\unicode[STIX]{x1D6FA})\cap C(\bar{\unicode[STIX]{x1D6FA}})$
be such that
 $\unicode[STIX]{x1D6E5}u\geq 0$
. Then
 $$\begin{eqnarray}\sup _{x\in \bar{\unicode[STIX]{x1D6FA}}}u(x)=\sup _{x\in \unicode[STIX]{x2202}\unicode[STIX]{x1D6FA}}u(x).\end{eqnarray}$$
While we will not provide a detailed proof here, we wish to provide some intuition into this fact. Namely, if we assume that a strict global maximum is attained at an interior point
 $z\in \unicode[STIX]{x1D6FA}$
, then elementary considerations from calculus will give us that
 $$\begin{eqnarray}Du(z)=0,\quad D^{2}u(z)<0,\end{eqnarray}$$
where
 $Du$
denotes the gradient and
 $D^{2}u$
the Hessian of
 $u$
, respectively. Since it can be easily seen that
 $\unicode[STIX]{x1D6E5}u=\operatorname{tr}D^{2}u$
, a contradiction ensues.
An important consequence of this result is the following comparison principle.
Corollary 2.2 (comparison principle).
Let
 $u,v\in C^{2}(\unicode[STIX]{x1D6FA})\cap C(\bar{\unicode[STIX]{x1D6FA}})$
be such that
 $u\leq v$
in
 $\unicode[STIX]{x2202}\unicode[STIX]{x1D6FA}$
and
 $\unicode[STIX]{x1D6E5}u\geq \unicode[STIX]{x1D6E5}v$
in
 $\unicode[STIX]{x1D6FA}$
. Then
 $u\leq v$
in
 $\unicode[STIX]{x1D6FA}$
.
This result easily follows by setting
 $w=u-v$
and observing that
 $w\leq 0$
on
 $\unicode[STIX]{x2202}\unicode[STIX]{x1D6FA}$
and
 $\unicode[STIX]{x1D6E5}w\geq 0$
in
 $\unicode[STIX]{x1D6FA}$
. An application of the maximum principle then allows us to conclude the result.
The comparison principle is one of the fundamental properties of an elliptic operator, namely that an ordering on the boundary and a (reverse) ordering of the operators implies an order of the underlying functions. Throughout this survey the application of a similar principle will be a recurring feature.
Having understood comparison principles we now proceed to describe energy considerations. Consider the equation
 $$\begin{eqnarray}\unicode[STIX]{x1D6E5}u=f\end{eqnarray}$$
in
 $\unicode[STIX]{x1D6FA}$
and multiply it by a sufficiently smooth function
 $\unicode[STIX]{x1D711}$
that vanishes on
 $\unicode[STIX]{x2202}\unicode[STIX]{x1D6FA}$
. An application of Green’s identity reveals that
 $$\begin{eqnarray}\int _{\unicode[STIX]{x1D6FA}}Du\cdot D\unicode[STIX]{x1D711}=-\int _{\unicode[STIX]{x1D6FA}}f\unicode[STIX]{x1D711},\end{eqnarray}$$
which we immediately recognize as the Euler–Lagrange equation for the minimization of the energy functional
 $$\begin{eqnarray}J(v)=\int _{\unicode[STIX]{x1D6FA}}\biggl(\displaystyle \frac{1}{2}|Dv|^{2}+fv\biggr)\end{eqnarray}$$
subject to the condition
 $v=u$
on
 $\unicode[STIX]{x2202}\unicode[STIX]{x1D6FA}$
.
It is important to notice that, as opposed to (2.1), identity (2.2) only requires the existence of square-integrable first derivatives. Note also that the second variation of
 $J$
is non-negative:
 $$\begin{eqnarray}\unicode[STIX]{x2202}^{2}J(v)[w_{1},w_{2}]=\int _{\unicode[STIX]{x1D6FA}}Dw_{1}\cdot Dw_{2},\quad \unicode[STIX]{x2202}^{2}J(v)[w,w]=\int _{\unicode[STIX]{x1D6FA}}|Dw|^{2}\geq 0,\end{eqnarray}$$
which shows its positivity in a certain sense.
On the basis of this observation, we now introduce our first definition of ellipticity Gilbarg and Trudinger (Reference Gilbarg and Trudinger2001, Chapter 3). In order to do so, in what follows we let
 $\mathbb{S}^{d}$
denote the space of symmetric
 $d\times d$
matrices. We endow
 $\mathbb{S}^{d}$
with the usual partial order
 $$\begin{eqnarray}M,N\in \mathbb{S}^{d}:\quad M\leq N\quad \Longleftrightarrow \quad \unicode[STIX]{x1D743}\cdot M\unicode[STIX]{x1D743}\leq \unicode[STIX]{x1D743}\cdot N\unicode[STIX]{x1D743},\quad \text{for all}~\unicode[STIX]{x1D743}\in \mathbb{R}^{d}.\end{eqnarray}$$
We denote the identity matrix by
 $I\in \mathbb{S}^{d}$
.
Definition 2.3 (elliptic operator in divergence form).
Let
 $A:\unicode[STIX]{x1D6FA}\rightarrow \mathbb{S}^{d}$
. We say that the operator
 $$\begin{eqnarray}Lu(x)=-D\cdot (A(x)Du(x))\end{eqnarray}$$
is elliptic at
 $x\in \unicode[STIX]{x1D6FA}$
if
 $0<\unicode[STIX]{x1D706}(x)I\leq A(x)\leq \unicode[STIX]{x1D6EC}(x)I$
, strictly elliptic if
 $\unicode[STIX]{x1D706}(x)\geq \unicode[STIX]{x1D706}_{0}>0$
for all
 $x\in \unicode[STIX]{x1D6FA}$
, and uniformly elliptic if
 $\unicode[STIX]{x1D6EC}(x)/\unicode[STIX]{x1D706}(x)$
is bounded in
 $\unicode[STIX]{x1D6FA}$
.
Example 2.4 (lower-order terms).
The concept of elliptic operators in divergence form can be extended to operators having lower-order terms. For instance, consider the operator
 $$\begin{eqnarray}\tilde{L}u(x)=-D\cdot (A(x)Du(x)+\mathbf{b}(x)u(x))+\mathbf{c}(x)\cdot Du(x)+e(x)u(x),\end{eqnarray}$$
where
 $A$
is as in Definition 2.3, and the functions
 $\mathbf{b},\mathbf{c}:\unicode[STIX]{x1D6FA}\rightarrow \mathbb{R}^{d}$
and
 $e:\unicode[STIX]{x1D6FA}\rightarrow \mathbb{R}$
are assumed to be measurable.
Example 2.5 (quasi-linear operators).
Given a differentiable vector-valued function
 $\unicode[STIX]{x1D6FA}\times \mathbb{R}\times \mathbb{R}^{d}\ni (x,z,\mathbf{p})\mapsto \mathbf{a}(x,z,\mathbf{p})\in \mathbb{R}^{d}$
and a scalar function
 $\unicode[STIX]{x1D6FA}\times \mathbb{R}\times \mathbb{R}^{d}\ni (x,z,\mathbf{p})\mapsto b(x,z,\mathbf{p})\in \mathbb{R}$
, we consider the quasi-linear operator
 $$\begin{eqnarray}Qu(x)=-D\cdot \mathbf{a}(x,u,Du)+b(x,u,Du)\end{eqnarray}$$
defined for
 $u\in C^{2}(\unicode[STIX]{x1D6FA})$
. We say that this operator is variational if it is the Euler–Lagrange operator of the energy functional
 $$\begin{eqnarray}\int _{\unicode[STIX]{x1D6FA}}E(x,u,Du),\end{eqnarray}$$
that is,
 $\mathbf{a}(x,z,\mathbf{p})=D_{\mathbf{p}}E(x,z,\mathbf{p})$
and
 $b(x,z,\mathbf{p})=D_{z}E(x,z,\mathbf{p})$
. Following Definition 2.3 we realize that the ellipticity of
 $Q$
is equivalent to the strict convexity of
 $E$
with respect to the
 $\mathbf{p}$
variables. This immediately hints at the fact that tools from calculus of variations will be essential in the study of equations with this type of operator. Examples of quasi-linear operators can be given by choosing appropriate energies
 $E$
. For instance, setting
 $$\begin{eqnarray}E=E(\mathbf{p})=(1+|\mathbf{p}|^{2})^{s/2}\end{eqnarray}$$
Gilbarg and Trudinger (Reference Gilbarg and Trudinger2001, Chapter 10) for
 $s>1$
, we obtain a family of uniformly elliptic quasi-linear operators.
On the other hand, many problems cannot be cast in this form. The prototypical example is that given by the operator
 $$\begin{eqnarray}{\mathcal{L}}u(x)=A(x):D^{2}u(x),\end{eqnarray}$$
where, for
 $M,N\in \mathbb{S}^{d}$
,
 $M:N$
denotes the Fröbenius inner product:
 $$\begin{eqnarray}M:N=\mathop{\sum }_{i,j=1}^{d}M_{i,j}N_{i,j}.\end{eqnarray}$$
The Fröbenius norm of a matrix
 $M$
will be denoted by
 $|M|:=\sqrt{M:M}$
.
If
 $A$
is sufficiently smooth, the operator (2.5) can be recast in divergence form and
 $-{\mathcal{L}}$
can be understood as an elliptic operator in the sense of Definition 2.3. However, this is not always possible, and consequently we must extend the notion of ellipticity to non-divergence-form operators Gilbarg and Trudinger (Reference Gilbarg and Trudinger2001, Chapter 3).
Definition 2.6 (non-divergence elliptic operator).
We say that the operator (2.5) is elliptic at
 $x\in \unicode[STIX]{x1D6FA}$
if
 $0<\unicode[STIX]{x1D706}(x)I\leq A(x)\leq \unicode[STIX]{x1D6EC}(x)I$
, strictly elliptic if
 $\unicode[STIX]{x1D706}(x)\geq \unicode[STIX]{x1D706}_{0}>0$
for all
 $x\in \unicode[STIX]{x1D6FA}$
, and uniformly elliptic if
 $\unicode[STIX]{x1D6EC}(x)/\unicode[STIX]{x1D706}(x)$
is bounded in
 $\unicode[STIX]{x1D6FA}$
.
The reader is encouraged to verify that, for an operator that is strictly elliptic in the sense of Definition 2.6, variants of Theorem 2.1 and Corollary 2.2 hold.
Example 2.7 (lower-order terms).
As in the divergence-form case, the notion of elliptic operators extend to those with lower-order terms, for example,
 $$\begin{eqnarray}\tilde{{\mathcal{L}}}u(x)=A(x):D^{2}u(x)+\mathbf{b}(x)\cdot Du(x)+c(x)u(x),\end{eqnarray}$$
where
 $A$
is as in Definition 2.6, and the lower-order coefficients
 $\mathbf{b}$
and
 $c$
are (vector- and scalar-valued) functions defined on
 $\unicode[STIX]{x1D6FA}$
.
Example 2.8 (linear operators in divergence form).
Consider the operator
 $L$
of Definition 2.3 and assume that the coefficient matrix
 $A$
is differentiable. One can then rewrite
 $Lu(x)$
as
 $$\begin{eqnarray}Lu(x)=-A(x):D^{2}u(x)-(D\cdot A(x))\cdot Du(x),\end{eqnarray}$$
where the divergence operator acts on
 $A$
column-wise. Consequently, the operator
 $-L$
is of the form
 $\tilde{{\mathcal{L}}}$
of Example 2.7.
Example 2.9 (quasi-linear operators in non-divergence form).
For a function
 $u\in C^{2}(\unicode[STIX]{x1D6FA})$
we define the quasi-linear operator
 $$\begin{eqnarray}{\mathcal{Q}}u(x)=A(x,u,Du):D^{2}u(x)+b(x,u,Du)\end{eqnarray}$$
where
 $\unicode[STIX]{x1D6FA}\times \mathbb{R}\times \mathbb{R}^{d}\ni (x,z,\mathbf{p})\mapsto A(x,z,\mathbf{p})\in \mathbb{S}^{d}$
and
 $\unicode[STIX]{x1D6FA}\times \mathbb{R}\times \mathbb{R}^{d}\ni (x,z,\mathbf{p})\mapsto b(x,z,\mathbf{p})\in \mathbb{R}$
. We say that
 ${\mathcal{Q}}$
is elliptic at the function
 $u$
if
 $A(x,u,Du)$
satisfies the positivity conditions of Definition 2.6.
The previous definitions and examples entailed linear and quasi-linear operators. While, by linearization, one could extend Definitions 2.3 and 2.6 to more general nonlinear problems, we shall instead give a general definition of ellipticity, one that preserves the fundamental concept of comparison Crandall, Ishii and Lions (Reference Crandall, Ishii and Lions1992), Caffarelli and Cabré (Reference Caffarelli and Cabré1995).
Definition 2.10 (elliptic operator).
Let
 $F\in C(\unicode[STIX]{x1D6FA}\times \mathbb{R}\times \mathbb{R}^{d}\times \mathbb{S}^{d})$
. We say that
 $F$
is elliptic in
 $\unicode[STIX]{x1D6FA}$
if
 $F$
satisfies the following monotonicity condition. If
 $r,s\in \mathbb{R}$
and
 $M,N\in \mathbb{S}^{d}$
with
 $r\geq s$
and
 $M\leq N$
then
 $$\begin{eqnarray}F(x,r,\mathbf{p},M)\leq F(x,s,\mathbf{p},N).\end{eqnarray}$$
We will say, moreover, that
 $F$
is uniformly elliptic if there are constants
 $0<\unicode[STIX]{x1D706}\leq \unicode[STIX]{x1D6EC}$
such that for all
 $M\in \mathbb{S}^{d}$
and
 $r\geq s$
we have
 $$\begin{eqnarray}\unicode[STIX]{x1D706}|N|\leq F(x,r,\mathbf{p},M+N)-F(x,s,\mathbf{p},M)\leq \unicode[STIX]{x1D6EC}|N|,\quad \text{for all}~N\geq 0.\end{eqnarray}$$
Example 2.11 (linear and quasi-linear equations).
As a first example, let us show that the linear operator in non-divergence form
 ${\mathcal{L}}$
of (2.5) is elliptic in the sense of Definition 2.10. By doing so and following the considerations of the examples previously given, we see that all the other cases also fit into this framework. Define
 $$\begin{eqnarray}F(x,r,\mathbf{p},M)=\operatorname{tr}(A(x)M).\end{eqnarray}$$
Since, for symmetric matrices,
 $A:B=\operatorname{tr}(AB)$
, we see that
 ${\mathcal{L}}u(x)=F(x,u(x),Du(x),D^{2}u(x))$
. Moreover, the positivity of
 $A$
implies the monotonicity of
 $F$
.
We now present several examples of fully nonlinear equations that fit into Definition 2.10.
Example 2.12 (Hamilton–Jacobi–Bellman operator).
Let
 ${\mathcal{A}}$
be any compact set and assume that for every
 $\unicode[STIX]{x1D6FC}\in {\mathcal{A}}$
we are given a uniformly elliptic linear operator
 $$\begin{eqnarray}{\mathcal{L}}^{\unicode[STIX]{x1D6FC}}u(x)=A^{\unicode[STIX]{x1D6FC}}(x):D^{2}u(x)\end{eqnarray}$$
and a function
 $f^{\unicode[STIX]{x1D6FC}}\in C(\unicode[STIX]{x1D6FA})$
. Define
 $$\begin{eqnarray}F(x,r,\mathbf{p},M)=\sup _{\unicode[STIX]{x1D6FC}\in {\mathcal{A}}}[\operatorname{tr}(A^{\unicode[STIX]{x1D6FC}}(x)M)-f^{\unicode[STIX]{x1D6FC}}(x)].\end{eqnarray}$$
Note immediately that
 $$\begin{eqnarray}F(x,u(x),Du(x),D^{2}u(x))=\sup _{\unicode[STIX]{x1D6FC}\in {\mathcal{A}}}[{\mathcal{L}}^{\unicode[STIX]{x1D6FC}}u(x)-f^{\unicode[STIX]{x1D6FC}}(x)].\end{eqnarray}$$
Moreover, since for every
 $\unicode[STIX]{x1D6FC}\in {\mathcal{A}}$
,
 $x\in \unicode[STIX]{x1D6FA}$
and
 $M,N\in \mathbb{S}^{d}$
we have that
 $A^{\unicode[STIX]{x1D6FC}}(x)M\leq A^{\unicode[STIX]{x1D6FC}}(x)N$
whenever
 $M\leq N$
, we immediately conclude that the operator
 $F$
is monotone and thus elliptic in the sense of Definition 2.10. A similar argument shows that
 $F$
is uniformly elliptic whenever the family of linear operators
 $\{{\mathcal{L}}^{\unicode[STIX]{x1D6FC}}\}_{\unicode[STIX]{x1D6FC}\in {\mathcal{A}}}$
is uniformly elliptic. More importantly, we note that the function
 $F$
is convex with respect to
 $M$
.
Example 2.13 (Isaacs operator).
The previous example can be generalized as follows. Assume now that we have two index sets
 ${\mathcal{A}}$
and
 ${\mathcal{B}}$
and, for each
 $(\unicode[STIX]{x1D6FC},\unicode[STIX]{x1D6FD})\in {\mathcal{A}}\times {\mathcal{B}}$
, we have a uniformly elliptic linear operator
 $$\begin{eqnarray}{\mathcal{L}}^{\unicode[STIX]{x1D6FC},\unicode[STIX]{x1D6FD}}u(x)=A^{\unicode[STIX]{x1D6FC},\unicode[STIX]{x1D6FD}}(x):D^{2}u(x).\end{eqnarray}$$
Define
 $$\begin{eqnarray}F(x,r,\mathbf{p},M)=\inf _{\unicode[STIX]{x1D6FD}\in {\mathcal{B}}}\sup _{\unicode[STIX]{x1D6FC}\in {\mathcal{A}}}[\operatorname{tr}(A^{\unicode[STIX]{x1D6FC},\unicode[STIX]{x1D6FD}}(x)M)-f^{\unicode[STIX]{x1D6FC},\unicode[STIX]{x1D6FD}}(x)],\end{eqnarray}$$
and note that
 $$\begin{eqnarray}F(x,u(x),Du(x),D^{2}u(x))=\inf _{\unicode[STIX]{x1D6FD}\in {\mathcal{B}}}\sup _{\unicode[STIX]{x1D6FC}\in {\mathcal{A}}}[{\mathcal{L}}^{\unicode[STIX]{x1D6FC},\unicode[STIX]{x1D6FD}}u(x)-f^{\unicode[STIX]{x1D6FC},\unicode[STIX]{x1D6FD}}(x)].\end{eqnarray}$$
One more time, the uniform ellipticity of the operators
 ${\mathcal{L}}^{\unicode[STIX]{x1D6FC},\unicode[STIX]{x1D6FD}}$
yields the uniform ellipticity of
 $F$
. Note that
 $F$
is neither convex nor concave with respect to
 $M$
.
Example 2.14 (Monge–Ampère operator).
As a final example, consider the operator
 $$\begin{eqnarray}F(x,r,\mathbf{p},M)=\det M-f(x).\end{eqnarray}$$
Note that, in general, this operator does not satisfy the monotonicity condition of Definition 2.10. However, if we restrict it to positive definite matrices, then this operator is elliptic. Consequently, for a positive
 $f$
and a strictly convex function
 $u\in C^{2}(\unicode[STIX]{x1D6FA})$
, we define the Monge–Ampère operator as
 $$\begin{eqnarray}F(x,u(x),Du(x),D^{2}u(x))=\det D^{2}u(x)-f(x).\end{eqnarray}$$
With Definition 2.10 at hand, we turn our attention to boundary value problems for elliptic operators. In other words, for an elliptic operator
 $F$
we consider the following problem: find
 $u:\bar{\unicode[STIX]{x1D6FA}}\rightarrow \mathbb{R}$
such that
 $$\begin{eqnarray}F(x,u,Du,D^{2}u)=0\quad \text{in }\unicode[STIX]{x1D6FA},\quad u=g\quad \text{on }\unicode[STIX]{x2202}\unicode[STIX]{x1D6FA}.\end{eqnarray}$$
The sense in which (2.6) is satisfied will give rise to the various existing concepts of solutions.
2.2 Classical solutions
The first, and obvious, notion of solution is when identity (2.6) is understood in a pointwise sense. This gives rise to so-called classical solutions.
Definition 2.15 (classical solution).
Let
 $F\in C(\unicode[STIX]{x1D6FA}\times \mathbb{R}\times \mathbb{R}^{d}\times \mathbb{S}^{d})$
. Then the function
 $u\in C^{2}(\unicode[STIX]{x1D6FA})\cap C(\bar{\unicode[STIX]{x1D6FA}})$
is said to be a classical solution of (2.6) if this identity holds for every
 $x\in \bar{\unicode[STIX]{x1D6FA}}$
.
An immediate consequence of ellipticity is that classical solutions are unique.
Theorem 2.16 (uniqueness).
Let
 $F$
be elliptic in the sense of Definition 2.10. If
 $F$
is strictly decreasing in the
 $r$
variable or uniformly elliptic, then problem (2.6) cannot have more than one classical solution.
Proof. Let us prove this result under the assumption that the map
 $F$
is strictly decreasing in the
 $r$
variable. The remaining case can be found, for instance, in Gilbarg and Trudinger (Reference Gilbarg and Trudinger2001, Corollary 17.2). Assume that
 $u$
and
 $v$
are classical solutions to (2.6) and set
 $w=u-v$
. Note that
 $w=0$
on
 $\unicode[STIX]{x2202}\unicode[STIX]{x1D6FA}$
, and that if
 $w$
attains a (positive) maximum at
 $x_{0}\in \unicode[STIX]{x1D6FA}$
, then
 $Dw(x_{0})=0$
and
 $D^{2}w(x_{0})\leq 0$
. Therefore, if
 $u(x_{0})>v(x_{0})$
, ellipticity and the fact that the map is strictly decreasing imply
 $$\begin{eqnarray}0=F(x_{0},u(x_{0}),Du(x_{0}),D^{2}u(x_{0}))<F(x_{0},v(x_{0}),Dv(x_{0}),D^{2}v(x_{0})),\end{eqnarray}$$
which is a contradiction. Similarly, the function
 $w$
cannot attain a negative minimum in
 $\unicode[STIX]{x1D6FA}$
, and consequently
 $w\equiv 0$
.
As an example, we mention that Theorem 2.16 holds for the operator
 $\tilde{{\mathcal{L}}}$
of Example 2.7 whenever the zero order coefficient
 $c\leq 0$
.
In the linear case of Example 2.11, the Dirichlet problem (2.6) reads as follows: find
 $u\in C^{2}(\unicode[STIX]{x1D6FA})\cap C(\bar{\unicode[STIX]{x1D6FA}})$
such that
 $$\begin{eqnarray}{\mathcal{L}}u=f\quad \text{in }\unicode[STIX]{x1D6FA},\quad u=g\quad \text{on }\unicode[STIX]{x2202}\unicode[STIX]{x1D6FA}.\end{eqnarray}$$
In this case, the existence of classical solutions is guaranteed by what is known as Schauder estimates which, simply put, boil down to freezing the coefficients and a continuity argument; see Gilbarg and Trudinger (Reference Gilbarg and Trudinger2001, Theorems 6.13–6.14).
Theorem 2.17 (existence).
Let
 $\unicode[STIX]{x1D6FA}$
satisfy an exterior sphere condition at every boundary point. Assume the operator (2.5) is strictly elliptic in the sense of Definition 2.6. If
 $g\in C(\unicode[STIX]{x2202}\unicode[STIX]{x1D6FA})$
and, for some
 $\unicode[STIX]{x1D6FC}\in (0,1)$
,
 $f$
and the coefficients of
 ${\mathcal{L}}$
are bounded and belong to
 $C^{\unicode[STIX]{x1D6FC}}(\unicode[STIX]{x1D6FA})$
, then the Dirichlet problem (2.7) has a unique classical solution
 $u\in C^{2,\unicode[STIX]{x1D6FC}}(\unicode[STIX]{x1D6FA})\cap C(\bar{\unicode[STIX]{x1D6FA}})$
. If, in addition, we assume that
 $\unicode[STIX]{x2202}\unicode[STIX]{x1D6FA}\in C^{2,\unicode[STIX]{x1D6FC}}$
, that
 $f$
and the coefficients of
 ${\mathcal{L}}$
belong to
 $C^{\unicode[STIX]{x1D6FC}}(\bar{\unicode[STIX]{x1D6FA}})$
; and
 $g\in C^{2,\unicode[STIX]{x1D6FC}}(\bar{\unicode[STIX]{x1D6FA}})$
, then
 $u\in C^{2,\unicode[STIX]{x1D6FC}}(\bar{\unicode[STIX]{x1D6FA}})$
and
 $$\begin{eqnarray}\Vert u\Vert _{C^{2,\unicode[STIX]{x1D6FC}}(\bar{\unicode[STIX]{x1D6FA}})}\leq C(\Vert f\Vert _{C^{\unicode[STIX]{x1D6FC}}(\bar{\unicode[STIX]{x1D6FA}})}+\Vert g\Vert _{C^{2,\unicode[STIX]{x1D6FC}}(\bar{\unicode[STIX]{x1D6FA}})}),\end{eqnarray}$$
where the constant
 $C$
is independent of
 $u$
,
 $f$
and
 $g$
.
At this point, the reader may wonder if Hölder continuity is indeed necessary for these results. Example 2.23 below will show us that this is the case.
If more regularity is assumed on the domain and problem data, it can be shown that the (unique) classical solution is also more regular Gilbarg and Trudinger (Reference Gilbarg and Trudinger2001, Theorem 6.19).
Theorem 2.18 (regularity).
In the setting of Theorem 2.17, assume additionally that, for some
 $k\geq 0$
we have
 $\unicode[STIX]{x2202}\unicode[STIX]{x1D6FA}\in C^{k+2,\unicode[STIX]{x1D6FC}}$
,
 $g\in C^{k+2,\unicode[STIX]{x1D6FC}}(\bar{\unicode[STIX]{x1D6FA}})$
and that
 $f$
and the coefficients of
 ${\mathcal{L}}$
belong to
 $C^{k,\unicode[STIX]{x1D6FC}}(\bar{\unicode[STIX]{x1D6FA}})$
. Then
 $u\in C^{k+2,\unicode[STIX]{x1D6FC}}(\bar{\unicode[STIX]{x1D6FA}})$
.
While Theorems 2.17 and 2.18 provide a satisfactory and conclusive answer for a linear operator with smooth coefficients, it does not cover rough coefficients or nonlinear problems, in which a classical solution may not exist. This is why we must depart from classical solutions and consider weakened or generalized concepts of solutions.
2.3 Weak (variational) solutions
We now turn our attention to the case of divergence-form operators as in Definition 2.3 and consider, for this particular operator, the Dirichlet problem (2.6). The natural solution concept in this case is called weak solution, and follows from an integration-by-parts argument, and an integral identity similar to (2.2).
Definition 2.19 (weak solutions of linear equations).
A function
 $u\in H^{1}(\unicode[STIX]{x1D6FA})$
is said to be a weak solution of the Dirichlet problem
 $$\begin{eqnarray}Lu=f\quad \text{in }\unicode[STIX]{x1D6FA},\quad u=g\quad \text{on }\unicode[STIX]{x2202}\unicode[STIX]{x1D6FA}\end{eqnarray}$$
if
 $u-g\in H_{0}^{1}(\unicode[STIX]{x1D6FA})$
and, for every
 $\unicode[STIX]{x1D711}\in H_{0}^{1}(\unicode[STIX]{x1D6FA})$
, we have
 $$\begin{eqnarray}\int _{\unicode[STIX]{x1D6FA}}(ADu)\cdot D\unicode[STIX]{x1D711}=\int _{\unicode[STIX]{x1D6FA}}f\unicode[STIX]{x1D711}.\end{eqnarray}$$
Existence and uniqueness follow from the classical Lax–Milgram lemma or, more generally, from so-called inf-sup conditions.
Theorem 2.20 (existence and uniqueness).
Let
 $\unicode[STIX]{x1D6FA}$
be bounded, and let
 $L$
be uniformly elliptic in the sense of Definition 2.3 and such that its coefficients belong to
 $L^{\infty }(\unicode[STIX]{x1D6FA})$
. If
 $f\in H^{-1}(\unicode[STIX]{x1D6FA})$
and
 $g\in H^{1}(\unicode[STIX]{x1D6FA})$
, then problem (2.8) has a unique weak solution
 $u\in H^{1}(\unicode[STIX]{x1D6FA})$
.
Again, under additional smoothness assumptions on the domain and problem data, one can assert further differentiability of the solution. This is the content of the following result Gilbarg and Trudinger (Reference Gilbarg and Trudinger2001), Grisvard (Reference Grisvard2011).
Theorem 2.21 (regularity).
Assume, in addition to the conditions of Theorem 2.20, that
 $\unicode[STIX]{x2202}\unicode[STIX]{x1D6FA}\in C^{2}$
or that
 $\unicode[STIX]{x1D6FA}$
is convex. If
 $A\in C^{0,1}(\bar{\unicode[STIX]{x1D6FA}},\mathbb{S}^{d})$
,
 $f\in L^{2}(\unicode[STIX]{x1D6FA})$
and
 $g\in H^{2}(\unicode[STIX]{x1D6FA})$
, then we have
 $u\in H^{2}(\unicode[STIX]{x1D6FA})\cap H^{1}(\unicode[STIX]{x1D6FA})$
and
 $$\begin{eqnarray}\Vert u\Vert _{H^{2}(\unicode[STIX]{x1D6FA})}\leq C(\Vert u\Vert _{L^{2}(\unicode[STIX]{x1D6FA})}+\Vert f\Vert _{L^{2}(\unicode[STIX]{x1D6FA})}+\Vert g\Vert _{H^{2}(\unicode[STIX]{x1D6FA})}),\end{eqnarray}$$
where the constant
 $C$
is independent of
 $u$
,
 $f$
and
 $g$
.
We also wish to mention the remarkable result by E. De Giorgi concerning the Hölder regularity of weak solutions.
Theorem 2.22 (De Giorgi I).
Let
 $u\in H^{1}(\unicode[STIX]{x1D6FA})$
be a weak solution to (2.9) with
 $g=0$
,
 $f\in L^{q}(\unicode[STIX]{x1D6FA})$
with
 $q>d/2$
. Then there exists
 $\unicode[STIX]{x1D6FC}\in (0,1)$
for which
 $u\in C_{\text{loc}}^{\unicode[STIX]{x1D6FC}}(\unicode[STIX]{x1D6FA})$
. If, in addition,
 $q>d$
and
 $A\in C^{\unicode[STIX]{x1D6FD}}(\bar{\unicode[STIX]{x1D6FA}},\mathbb{S}^{d})$
, with
 $\unicode[STIX]{x1D6FD}=1-d/q$
, then
 $u\in C_{\text{loc}}^{1,\unicode[STIX]{x1D6FD}}(\unicode[STIX]{x1D6FA})$
.
In light of the second part of the previous result, it is natural to ask whether
 $f\in L^{\infty }(\unicode[STIX]{x1D6FA})$
with appropriate assumptions on the boundary data
 $g$
and the coefficients of
 $L$
would yield that
 $Du\in C_{\text{loc}}^{1}(\unicode[STIX]{x1D6FA})$
. The following example shows that this is generally false Han and Lin (Reference Han and Lin2011, Section 3.4).
Example 2.23 (second derivatives are not continuous).
For
 $R<1$
let
 $\unicode[STIX]{x1D6FA}=\{x\in \mathbb{R}^{d}:|x|<R\}$
and consider
 $$\begin{eqnarray}f(x)=\left\{\begin{array}{@{}ll@{}}0\quad & x=0,\\ \displaystyle \frac{x_{2}^{2}-x_{1}^{2}}{2|x|^{2}}\biggl(\displaystyle \frac{d+2}{\sqrt{-\ln |x|}}+\displaystyle \frac{1}{2(-\ln |x|)^{3/2}}\biggr)\quad & x\neq 0.\end{array}\right.\end{eqnarray}$$
Note that
 $f\in C(\bar{\unicode[STIX]{x1D6FA}})$
and that the function
 $$\begin{eqnarray}u(x)=(x_{1}^{2}-x_{2}^{2})\sqrt{-\ln |x|}\in C(\bar{\unicode[STIX]{x1D6FA}})\cap C^{\infty }(\bar{\unicode[STIX]{x1D6FA}}\setminus \{0\})\end{eqnarray}$$
satisfies
 $\unicode[STIX]{x1D6E5}u=f$
with boundary conditions
 $$\begin{eqnarray}g=\sqrt{-\ln R}(x_{1}^{2}-x_{2}^{2}).\end{eqnarray}$$
However, this function cannot be a classical solution since
 $$\begin{eqnarray}\lim _{|x|\rightarrow 0}\displaystyle \frac{\unicode[STIX]{x2202}^{2}u(x)}{\unicode[STIX]{x2202}x_{1}^{2}}=\infty\end{eqnarray}$$
so that
 $u\not \in C^{2}(\unicode[STIX]{x1D6FA})$
. In fact, although the problem has a weak solution, it does not have a classical one. This example also shows that, in the classical solution theory given in Theorem 2.17, mere continuity of the data is not sufficient, thus justifying the need for Hölder continuity.
Let us now focus our attention on the quasi-linear operator
 $Q$
of Example 2.5 and consider the Dirichlet problem
 $$\begin{eqnarray}Qu=f\quad \text{in }\unicode[STIX]{x1D6FA},\quad u=g\quad \text{on }\unicode[STIX]{x2202}\unicode[STIX]{x1D6FA}.\end{eqnarray}$$
The definition of weak solution is as follows.
Definition 2.24 (weak solutions of quasi-linear equations).
A function
 $u\in W^{1,p}(\unicode[STIX]{x1D6FA})$
(
 $1<p<\infty$
) is called a weak solution of (2.10) if
 $u-g\in W_{0}^{1,p}(\unicode[STIX]{x1D6FA})$
and
 $$\begin{eqnarray}\int _{\unicode[STIX]{x1D6FA}}(\mathbf{a}(x,u,Du)\cdot Dv+b(x,u,Du)v)=\int _{\unicode[STIX]{x1D6FA}}fv\end{eqnarray}$$
for all
 $v\in W_{0}^{1,p}(\unicode[STIX]{x1D6FA})$
.
Note that the equation that defines weak solutions to (2.10) are the Euler–Lagrange equations of the functional
 $$\begin{eqnarray}I(u)=\int _{\unicode[STIX]{x1D6FA}}(E(x,u,Du)-fu)\end{eqnarray}$$
over the set of functions
 $v\in W^{1,p}(\unicode[STIX]{x1D6FA})$
such that
 $u-g\in W_{0}^{1,p}(\unicode[STIX]{x1D6FA})$
. Consequently, the existence of weak solutions is tightly bound with the calculus of variations.
Theorem 2.25 (existence and uniqueness).
Assume that there is a
 $p\in (1,\infty )$
for which the function
 $E$
satisfies the coercivity condition: there are constants
 $C_{1}>0$
,
 $C_{2}\geq 0$
such that, for every
 $x\in \unicode[STIX]{x1D6FA}$
,
 $z\in \mathbb{R}$
and
 $\mathbf{p}\in \mathbb{R}^{d}$
, we have
 $$\begin{eqnarray}E(x,z,\mathbf{p})\geq C_{1}|\mathbf{p}|^{p}-C_{2}.\end{eqnarray}$$
Assume, in addition, that
 $E$
is convex in the
 $\mathbf{p}$
variable. Then, for
 $f\in L^{p^{\prime }}(\unicode[STIX]{x1D6FA})$
, the functional
 $I$
has a minimizer
 $u\in W^{1,p}(\unicode[STIX]{x1D6FA})$
such that
 $u-g\in W_{0}^{1,p}(\unicode[STIX]{x1D6FA})$
. Finally, if
 $E$
does not depend on
 $z$
and is uniformly convex, then this minimizer is unique.
With this theorem at hand it can be readily shown that, in this setting, the (unique) minimizer
 $u$
of
 $I$
is a weak solution of (2.10) in the sense of Definition 2.24.
We can also establish, under additional assumptions on
 $E$
, further differentiability of minimizers. To shorten the exposition we confine ourselves to the case where
 $E$
is independent of
 $x$
and
 $z$
, it is coercive with
 $p=2$
, satisfies the growth condition
 $$\begin{eqnarray}|D_{\mathbf{p}}E(\mathbf{p})|\leq C(|\mathbf{p}|+1),\quad \text{for all}~\mathbf{p}\in \mathbb{R}^{d},\end{eqnarray}$$
and
 $$\begin{eqnarray}|D^{2}E(\mathbf{p})|\leq C,\quad \text{for all}~\mathbf{p}\in \mathbb{R}^{d}.\end{eqnarray}$$
With these additional assumptions we have the following regularity result Evans (Reference Evans2010, Theorem 8.3.1).
Theorem 2.26 (regularity).
In the setting of Theorem 2.25 assume, in addition, that
 $E$
depends only on
 $\mathbf{p}$
and satisfies (2.11) and (2.12). If
 $g=0$
,
 $f\in L^{2}(\unicode[STIX]{x1D6FA})$
and
 $\unicode[STIX]{x2202}\unicode[STIX]{x1D6FA}\in C^{2}$
, we have that
 $u\in H^{2}(\unicode[STIX]{x1D6FA})$
with the estimate
 $$\begin{eqnarray}\Vert u\Vert _{H^{2}(\unicode[STIX]{x1D6FA})}\leq C\Vert f\Vert _{L^{2}(\unicode[STIX]{x1D6FA})}.\end{eqnarray}$$
What is more interesting and remarkable is that the results of De Giorgi presented in Theorem 2.22 can be extended to this case as well.
Theorem 2.27 (De Giorgi II).
Let
 $u\in W^{1,p}(\unicode[STIX]{x1D6FA})$
be a minimizer of
 $I$
. If
 $E$
satisfies the growth and monotonicity conditions
 $$\begin{eqnarray}|D_{\mathbf{p}}E(x,z,\mathbf{p})|\leq C_{1}(1+|\mathbf{p}|^{p-1}),\quad D_{\boldsymbol{ p}}E(x,z,\mathbf{p}).\mathbf{p}\geq C_{2}|\mathbf{p}|^{p}-C_{3},\end{eqnarray}$$
then there exists
 $\unicode[STIX]{x1D6FC}\in (0,1)$
for which
 $u\in C_{\text{loc}}^{\unicode[STIX]{x1D6FC}}(\unicode[STIX]{x1D6FA})$
.
Under suitable assumptions, local Hölder continuity of the gradients of the minimizers can also be established. For further regularity results for quasi-linear problems the reader is referred, for instance, to Mingione (Reference Mingione2006).
While, in this setting, we have a sufficiently rich theory, it only applies to divergence-form operators. Below, in Section 2.5, we will describe the right generalization of the notion of solutions for more general problems.
2.4 Strong solutions
We now describe a solution concept that, in a sense, lies in between classical and weak solutions, and that can also be applied to non-divergence-form operators such as (2.5) and that of Example 2.9. These solutions are called strong.
Definition 2.28 (strong solutions).
The function
 $u\in W^{2,p}(\unicode[STIX]{x1D6FA})$
(
 $1<p<\infty$
) is a strong solution of the boundary value problem (2.6) if the equation and boundary conditions hold almost everywhere in
 $\unicode[STIX]{x1D6FA}$
and
 $\unicode[STIX]{x2202}\unicode[STIX]{x1D6FA}$
, respectively.
We immediately remark that every classical solution is a strong solution. Moreover, an integration-by-parts and density argument shows that a sufficiently regular weak solution (see Theorems 2.21 and 2.26) is also a strong solution. Therefore, strong solutions for the divergence-form equations (2.8) and (2.10) can be obtained from regularity considerations.
Let us now turn our attention to the non-divergence-form problem (2.7) and study the existence of strong solutions. In this case we have the following result.
Theorem 2.29 (existence).
Let
 $\unicode[STIX]{x1D6FA}$
be a
 $C^{1,1}$
domain and the coefficients of the operator
 $L$
belong to
 $C(\bar{\unicode[STIX]{x1D6FA}})$
. If
 $f\in L^{p}(\unicode[STIX]{x1D6FA})$
and
 $g\in W^{2,p}(\unicode[STIX]{x1D6FA})$
(
 $1<p<\infty$
), then the Dirichlet problem (2.7) has a unique strong solution
 $u\in W^{2,p}(\unicode[STIX]{x1D6FA})$
, and moreover
 $$\begin{eqnarray}\Vert u\Vert _{W^{2,p}(\unicode[STIX]{x1D6FA})}\leq C(\Vert f\Vert _{L^{p}(\unicode[STIX]{x1D6FA})}+\Vert g\Vert _{W^{2,p}(\unicode[STIX]{x1D6FA})}),\end{eqnarray}$$
where
 $C$
is independent of
 $u$
,
 $f$
and
 $g$
but depends on
 $\Vert A\Vert _{C(\bar{\unicode[STIX]{x1D6FA}},\mathbb{S}^{d})}$
, the dimension
 $d$
and the exponent
 $p$
.
We must comment on the technique of proof for this result. First, for
 $A=I$
and
 $p=2$
, this follows from the regularity result of Theorem 2.21. An interpolation result, in conjunction with the celebrated Calderón–Zygmund decomposition technique Calderón and Zygmund (Reference Calderón and Zygmund1952), yields the result for any
 $p$
. Using the continuity of
 $A$
, the result can be extended to a general
 ${\mathcal{L}}$
.
Remark 2.30 (Hölder regularity).
Let us briefly describe the results of Krylov and Safonov; see Gilbarg and Trudinger (Reference Gilbarg and Trudinger2001, Section 9.8) and Theorem 2.65 below. To do so, we assume that
 $f\in L^{d}(\unicode[STIX]{x1D6FA})$
,
 $g\in C^{\unicode[STIX]{x1D6FD}}(\bar{\unicode[STIX]{x1D6FA}})$
for some
 $\unicode[STIX]{x1D6FD}\in (0,1)$
and
 $\unicode[STIX]{x2202}\unicode[STIX]{x1D6FA}$
satisfies a uniform exterior cone condition. Then, given
 $\unicode[STIX]{x1D714}\Subset \unicode[STIX]{x1D6FA}$
, there is a constant
 $\unicode[STIX]{x1D6FC}\in (0,1)$
such that
 $$\begin{eqnarray}|u|_{C^{\unicode[STIX]{x1D6FC}}(\unicode[STIX]{x1D714})}\leq C.\end{eqnarray}$$
The constants
 $\unicode[STIX]{x1D6FC}$
and
 $C$
depend, in particular, on the dimension
 $d$
and the ratio
 $\unicode[STIX]{x1D6EC}/\unicode[STIX]{x1D706}$
that defines the ellipticity of
 ${\mathcal{L}}$
. A natural question to ask is whether a similar estimate for the gradient
 $Du$
(possibly under stricter smoothness assumptions) is possible. A result by Nirenberg (see Theorem 2.57) showed that this is the case for
 $d=2$
. For higher dimensions, however, this turns out to be false. Safonov (Reference Safonov1987) showed that in
 $B_{1}\subset \mathbb{R}^{3}$
, the unit ball, for every
 $\unicode[STIX]{x1D6FC}\in (0,1]$
there are:
-
∙ a bounded function
 $v\in C^{\infty }(\mathbb{R}^{3}\setminus \{0\})$
,
-
∙ a constant
$\unicode[STIX]{x1D708}\in (0,1)$
, -
∙ a family
$\{A_{\unicode[STIX]{x1D700}}\}_{\unicode[STIX]{x1D700}>0}\subset C^{\infty }(\bar{B}_{1},\mathbb{S}^{d})$
such that the associated non-divergence operators
${\mathcal{L}}_{\unicode[STIX]{x1D700}}$
are uniformly elliptic with
$\unicode[STIX]{x1D6EC}/\unicode[STIX]{x1D706}=1/\unicode[STIX]{x1D708}^{2}$
.





With these objects at hand, he showed that the solution to the problem
 $$\begin{eqnarray}{\mathcal{L}}_{\unicode[STIX]{x1D700}}u_{\unicode[STIX]{x1D700}}=0\quad \text{in }B_{1},\quad u_{\unicode[STIX]{x1D700}}=v\quad \text{on }\unicode[STIX]{x2202}B_{1},\end{eqnarray}$$
satisfies
 $u_{\unicode[STIX]{x1D700}}\in C^{\infty }(\bar{B}_{1})$
,
 $\Vert u_{\unicode[STIX]{x1D700}}\Vert _{L^{\infty }(B_{1})}=1$
but
 $$\begin{eqnarray}\lim _{\unicode[STIX]{x1D700}\downarrow 0}|u_{\unicode[STIX]{x1D700}}|_{C^{\unicode[STIX]{x1D6FC}}(B_{1/2})}=\infty .\end{eqnarray}$$
From this it immediately follows that Hölder estimates on the derivatives are not possible.
Let us point out now that, in Theorem 2.29, the assumption that
 $A\in C(\bar{\unicode[STIX]{x1D6FA}},\mathbb{S}^{d})$
cannot generally be weakened. The following example is due to Pucci.
Example 2.31 (non-uniqueness).
Let us show, following Maugeri et al. (Reference Maugeri, Palagachev and Softova2000, Section 1.1), that for
 $d\geq 3$
there is a bounded measurable matrix
 $A$
such that problem (2.7) with
 $f=0$
and
 $g=0$
has more than one strong solution in
 $H^{2}(\unicode[STIX]{x1D6FA})\cap H_{0}^{1}(\unicode[STIX]{x1D6FA})$
. Let
 $\unicode[STIX]{x1D6FA}$
be the unit ball of
 $\mathbb{R}^{d}$
, and define
 $$\begin{eqnarray}A(x)=I+b\displaystyle \frac{xx^{\intercal }}{|x|^{2}},\quad b=\displaystyle \frac{d-2+\unicode[STIX]{x1D706}}{1-\unicode[STIX]{x1D706}},\quad \max \{2-d/2,0\}<\unicode[STIX]{x1D706}<1.\end{eqnarray}$$
Obviously
 $$\begin{eqnarray}|\unicode[STIX]{x1D743}|^{2}\leq \unicode[STIX]{x1D743}\cdot A\unicode[STIX]{x1D743}\leq (1+b)|\unicode[STIX]{x1D743}|^{2},\end{eqnarray}$$
so that
 $A$
is bounded and the associated operators
 ${\mathcal{L}}$
are uniformly elliptic. Define
 $u(x)=|x|^{\unicode[STIX]{x1D706}}-1$
and note that
 $$\begin{eqnarray}D^{2}u(x)=\unicode[STIX]{x1D706}(\unicode[STIX]{x1D706}-2)|x|^{\unicode[STIX]{x1D706}-4}xx^{\intercal }+\unicode[STIX]{x1D706}|x|^{\unicode[STIX]{x1D706}-2}I,\end{eqnarray}$$
which, since
 $\unicode[STIX]{x1D706}>2-d/2$
, shows that
 $u\in H^{2}(\unicode[STIX]{x1D6FA})\cap H_{0}^{1}(\unicode[STIX]{x1D6FA})$
. Moreover, due to the choice of
 $b$
, we have
 $$\begin{eqnarray}{\mathcal{L}}u(x)=A:D^{2}u(x)=\unicode[STIX]{x1D706}|x|^{\unicode[STIX]{x1D706}-2}[(1+b)\unicode[STIX]{x1D706}+d-b-2]=0.\end{eqnarray}$$
Since this will be important in subsequent developments, we now focus on conditions weaker than continuity that allow for the existence and uniqueness of a strong solution for (2.7).
2.4.1 The Cordes condition
Since, as Example 2.31 shows, mere boundedness of the coefficients in the operator of (2.7) does not suffice to ensure uniqueness of strong solutions, here we study the so-called Cordes condition for linear operators in non-divergence form. The idea behind it and the theory that follows is to reformulate the operator in such a way that the result is ‘close’ to one in divergence form, in particular, the Poisson equation. This reformulation allows us to apply classical tools in functional analysis to study the existence, uniqueness and a priori estimates for problem (2.5).
To motivate and derive this condition, consider the following problem: given
 $x\in \unicode[STIX]{x1D6FA}$
, find
 $\unicode[STIX]{x1D6FE}(x)\in \mathbb{R}$
that minimizes the quadratic function
 $$\begin{eqnarray}\unicode[STIX]{x1D70F}\mapsto |\unicode[STIX]{x1D70F}A(x)-I|^{2}.\end{eqnarray}$$
Simple arguments show that the minimum is attained at
 $$\begin{eqnarray}\unicode[STIX]{x1D6FE}(x)=\displaystyle \frac{\operatorname{tr}A(x)}{|A(x)|^{2}}\quad \text{and}\quad |\unicode[STIX]{x1D6FE}(x)A(x)-I|^{2}=d-\displaystyle \frac{(\operatorname{tr}A(x))^{2}}{|A(x)|^{2}}.\end{eqnarray}$$
In particular, this simple calculation shows that
 $$\begin{eqnarray}\displaystyle |\unicode[STIX]{x1D6FE}(x){\mathcal{L}}v(x)-\unicode[STIX]{x1D6E5}v(x)|^{2} & = & \displaystyle |(\unicode[STIX]{x1D6FE}(x)A(x)-I):D^{2}v(x)|^{2}\nonumber\\ \displaystyle & \leq & \displaystyle \biggl(d-\displaystyle \frac{\operatorname{tr}A(x)^{2}}{|A(x)|^{2}}\biggr)|D^{2}v(x)|^{2}.\end{eqnarray}$$
The Cordes condition ensures that the multiplicative constant on the right-hand side of (2.14) is less than one.
Definition 2.32 (Cordes condition).
A positive definite matrix
 $A\in L^{\infty }(\unicode[STIX]{x1D6FA},\mathbb{S}^{d})$
satisfies the Cordes condition provided that there exists an
 $\unicode[STIX]{x1D716}\in (0,1]$
such that
 $$\begin{eqnarray}\displaystyle \frac{|A|^{2}}{(\operatorname{tr}A)^{2}}\leq \displaystyle \frac{1}{d-1+\unicode[STIX]{x1D716}}\quad \text{a.e.}~\unicode[STIX]{x1D6FA}.\end{eqnarray}$$
Note that the Cordes condition ensures that there exists
 $\unicode[STIX]{x1D6FE}>0$
such that, for all
 $v\in H^{2}(\unicode[STIX]{x1D6FA})$
, we have
 $$\begin{eqnarray}\Vert \unicode[STIX]{x1D6FE}{\mathcal{L}}v-\unicode[STIX]{x1D6E5}v\Vert _{L^{2}(\unicode[STIX]{x1D6FA})}\leq \sqrt{1-\unicode[STIX]{x1D716}}\Vert D^{2}v\Vert _{L^{2}(\unicode[STIX]{x1D6FA})}.\end{eqnarray}$$
Remark 2.33 (the Cordes condition in spectral terms).
Since, by assumption, for
 $\text{a.e.}~x\in \unicode[STIX]{x1D6FA}$
we have that
 $A(x)\in \mathbb{S}^{d}$
and that it is positive definite, it is diagonalizable and all its eigenvalues
 $\{\unicode[STIX]{x1D706}_{i}\}_{i=1}^{d}=\{\unicode[STIX]{x1D706}_{i}(x)\}_{i=1}^{d}$
are positive. Using the well-known identities
 $$\begin{eqnarray}|A|^{2}=\mathop{\sum }_{i=1}^{d}\unicode[STIX]{x1D706}_{i}^{2},\quad \operatorname{tr}A=\mathop{\sum }_{i=1}^{d}\unicode[STIX]{x1D706}_{i}\quad \text{and}\quad \biggl(\mathop{\sum }_{i=1}^{d}\unicode[STIX]{x1D706}_{i}\biggr)^{2}\leq d\mathop{\sum }_{i=1}^{d}\unicode[STIX]{x1D706}_{i}^{2},\end{eqnarray}$$
condition (2.15) can be recast in terms of the eigenvalues of
 $A$
as follows:
 $$\begin{eqnarray}\displaystyle \frac{1}{d}\leq \displaystyle \frac{\mathop{\sum }_{i=1}^{d}\unicode[STIX]{x1D706}_{i}^{2}}{(\mathop{\sum }_{i=1}^{d}\unicode[STIX]{x1D706}_{i})^{2}}\leq \displaystyle \frac{1}{d-1+\unicode[STIX]{x1D716}}\quad \text{a.e.}~\unicode[STIX]{x1D6FA}.\end{eqnarray}$$
In other words, (2.15) is an anisotropy condition on
 $A$
that becomes more stringent in higher dimensions.
The considerations in Remark 2.33 show that the Cordes condition is always satisfied in two dimensions with
 $\unicode[STIX]{x1D716}=\inf _{x\in \unicode[STIX]{x1D6FA}}2\unicode[STIX]{x1D706}_{1}\unicode[STIX]{x1D706}_{2}/(\unicode[STIX]{x1D706}_{1}^{2}+\unicode[STIX]{x1D706}_{2}^{2})\in (0,1]$
. On the other hand, there exist symmetric positive definite matrices in three dimensions (and higher) that do not satisfy (2.15).
Example 2.34 (three dimensions).
Consider the matrix
 $$\begin{eqnarray}A=\left(\begin{array}{@{}ccc@{}}1 & 0 & c\\ 0 & 1 & b\\ c & b & 4\end{array}\right)\end{eqnarray}$$
with
 $b^{2}+c^{2}<4$
so that
 $\det (A)=4-(b^{2}+c^{2})>0$
. Sylvester’s criterion ensures that the matrix is positive definite, and a straightforward calculation shows that
 $$\begin{eqnarray}\displaystyle \frac{|A|^{2}}{(\operatorname{tr}A)^{2}}=\displaystyle \frac{18+2(b^{2}+c^{2})}{6^{2}}\geq \displaystyle \frac{1}{2}.\end{eqnarray}$$
Thus
 $A$
does not satisfy the Cordes condition.
Example 2.35 (the example of Pucci).
As another example consider the matrix of Example 2.31 for
 $d=3$
. Note first of all that in this case we have
 $$\begin{eqnarray}\displaystyle \frac{1}{2}<\unicode[STIX]{x1D706}<1,\quad b=\displaystyle \frac{3-2+\unicode[STIX]{x1D706}}{1-\unicode[STIX]{x1D706}}>3.\end{eqnarray}$$
Simple calculations then yield
 $$\begin{eqnarray}\displaystyle |A|^{2} & = & \displaystyle d+2b+b^{2},\nonumber\\ \displaystyle (\operatorname{tr}A)^{2} & = & \displaystyle (d+b)^{2},\nonumber\end{eqnarray}$$
and therefore
 $$\begin{eqnarray}|A|^{2}-\displaystyle \frac{1}{d-1}(\operatorname{tr}A)^{2}=d+2b+b^{2}-\displaystyle \frac{(d+b)^{2}}{d-1}>0\end{eqnarray}$$
Thus one concludes that
 $A$
does not satisfy the Cordes condition.
The Cordes condition is a key assumption to establish the well-posedness of the elliptic problem (2.5) with discontinuous coefficients. Another crucial ingredient is the Miranda–Talenti estimate, which is summarized in the next lemma.
Lemma 2.36 (Miranda–Talenti estimate).
Let
 $\unicode[STIX]{x1D6FA}\subset \mathbb{R}^{d}$
be a bounded convex domain. Then, for any
 $v\in H^{2}(\unicode[STIX]{x1D6FA})\cap H_{0}^{1}(\unicode[STIX]{x1D6FA})$
,
 $$\begin{eqnarray}|v|_{H^{2}(\unicode[STIX]{x1D6FA})}\leq \Vert \unicode[STIX]{x1D6E5}v\Vert _{L^{2}(\unicode[STIX]{x1D6FA})}.\end{eqnarray}$$
While this result can be understood as a regularity estimate in the spirit of Theorem 2.21, we remark that it can be obtained without appealing to this theory; we refer the reader to Maugeri et al. (Reference Maugeri, Palagachev and Softova2000, Lemma 1.2.2) for a proof. Moreover, while the aforementioned regularity results yield that, for functions in
 $H^{2}(\unicode[STIX]{x1D6FA})\cap H_{0}^{1}(\unicode[STIX]{x1D6FA})$
, the norm
 $v\mapsto \Vert \unicode[STIX]{x1D6E5}v\Vert _{L^{2}(\unicode[STIX]{x1D6FA})}$
is equivalent to the
 $H^{2}(\unicode[STIX]{x1D6FA})$
-norm, the important feature of estimate (2.17) is that the equivalence constant is exactly one on convex domains.
Remark 2.37 (polygonal domains).
In two dimensions the Miranda–Talenti estimate (2.17) holds for a polygonal domain
 $\unicode[STIX]{x1D6FA}$
without the convexity assumption. Indeed, assuming that
 $u\in C^{\infty }(\bar{\unicode[STIX]{x1D6FA}})$
, we have
 $$\begin{eqnarray}|D^{2}u|^{2}=|\unicode[STIX]{x1D6E5}u|^{2}+2(|\unicode[STIX]{x2202}_{12}u|^{2}-\unicode[STIX]{x2202}_{11}u\unicode[STIX]{x2202}_{22}u),\end{eqnarray}$$
where we explicitly used that we are in two dimensions. In addition, integration by parts and some algebraic manipulations show that
 $$\begin{eqnarray}\int _{\unicode[STIX]{x1D6FA}}(|\unicode[STIX]{x2202}_{12}u|^{2}-\unicode[STIX]{x2202}_{11}u\unicode[STIX]{x2202}_{22}u)=\int _{\unicode[STIX]{x2202}\unicode[STIX]{x1D6FA}}(-\unicode[STIX]{x2202}_{\unicode[STIX]{x1D70F}\unicode[STIX]{x1D70F}}u\unicode[STIX]{x2202}_{n}u+\unicode[STIX]{x2202}_{n\unicode[STIX]{x1D70F}}u\unicode[STIX]{x2202}_{\unicode[STIX]{x1D70F}}u)\end{eqnarray}$$
(see Ciarlet Reference Ciarlet2002, equation (1.2.9)), where
 $\unicode[STIX]{x1D749}$
is the unit tangential vector along the boundary
 $\unicode[STIX]{x2202}\unicode[STIX]{x1D6FA}$
,
 $\unicode[STIX]{x2202}_{\unicode[STIX]{x1D70F}}$
is the derivative in its direction and
 $\unicode[STIX]{x2202}_{n}$
denotes the normal derivative. Now, if
 $u=0$
on
 $\unicode[STIX]{x2202}\unicode[STIX]{x1D6FA}$
then we have that
 $\unicode[STIX]{x2202}_{\unicode[STIX]{x1D70F}}u=0$
, so that the second term on the right-hand side of this expression vanishes. If, in addition,
 $\unicode[STIX]{x2202}\unicode[STIX]{x1D6FA}$
is polygonal, this also implies that
 $\unicode[STIX]{x2202}_{\unicode[STIX]{x1D70F}\unicode[STIX]{x1D70F}}u=0$
, which allows us to obtain (2.17). By density, the same result holds for every
 $u\in H^{2}(\unicode[STIX]{x1D6FA})\cap H_{0}^{1}(\unicode[STIX]{x1D6FA})$
.
Identities (2.13) and (2.17) motivate the introduction of the bilinear form
 $$\begin{eqnarray}a(\cdot ,\cdot ):(H^{2}(\unicode[STIX]{x1D6FA})\cap H_{0}^{1}(\unicode[STIX]{x1D6FA}))^{2}\ni (v,w)\mapsto a(v,w)=\int _{\unicode[STIX]{x1D6FA}}\unicode[STIX]{x1D6FE}{\mathcal{L}}v\unicode[STIX]{x1D6E5}w\in \mathbb{R}.\end{eqnarray}$$
The properties of
 $a$
are as follows.
Lemma 2.38 (properties of
$a$
).

Assume that the coefficient
 $A$
of the operator
 ${\mathcal{L}}$
satisfies the Cordes condition (2.15). If
 $\unicode[STIX]{x1D6FA}$
is convex, then the bilinear form
 $a$
is bounded and coercive on
 $H^{2}(\unicode[STIX]{x1D6FA})\cap H_{0}^{1}(\unicode[STIX]{x1D6FA})$
.
Proof. Since
 $\unicode[STIX]{x1D6FE}$
is bounded, the continuity immediately follows.
If the Cordes condition (2.15) is satisfied and
 $\unicode[STIX]{x1D6FA}$
is convex, then from the Miranda–Talenti estimate (2.17) and the Cauchy–Schwarz inequality we obtain
 $$\begin{eqnarray}\displaystyle a(v,v) & = & \displaystyle \Vert \unicode[STIX]{x1D6E5}v\Vert _{L^{2}(\unicode[STIX]{x1D6FA})}^{2}+\int _{\unicode[STIX]{x1D6FA}}(\unicode[STIX]{x1D6FE}{\mathcal{L}}v-\unicode[STIX]{x1D6E5}v)\unicode[STIX]{x1D6E5}v\nonumber\\ \displaystyle & \geq & \displaystyle \Vert \unicode[STIX]{x1D6E5}v\Vert _{L^{2}(\unicode[STIX]{x1D6FA})}^{2}-\sqrt{1-\unicode[STIX]{x1D716}}|v|_{H^{2}(\unicode[STIX]{x1D6FA})}\Vert \unicode[STIX]{x1D6E5}v\Vert _{L^{2}(\unicode[STIX]{x1D6FA})}\nonumber\\ \displaystyle & \geq & \displaystyle (1-\sqrt{1-\unicode[STIX]{x1D716}})\Vert \unicode[STIX]{x1D6E5}v\Vert _{L^{2}(\unicode[STIX]{x1D6FA})}^{2}.\end{eqnarray}$$
In conclusion,
 $a$
is coercive on
 $H^{2}(\unicode[STIX]{x1D6FA})\cap H_{0}^{1}(\unicode[STIX]{x1D6FA})$
.
The coercivity estimate of Lemma 2.38 allows us to show the existence and uniqueness of strong solutions under the Cordes condition.
Theorem 2.39 (existence and uniqueness).
Assume that the coefficient
 $A$
of the operator
 ${\mathcal{L}}$
satisfies the Cordes condition (2.15). If
 $\unicode[STIX]{x1D6FA}$
is convex, then the Dirichlet problem (2.7) with
 $f\in L^{2}(\unicode[STIX]{x1D6FA})$
and
 $g=0$
has a unique strong solution
 $u\in H^{2}(\unicode[STIX]{x1D6FA})\cap H_{0}^{1}(\unicode[STIX]{x1D6FA})$
. Moreover, we have
 $$\begin{eqnarray}\Vert u\Vert _{H^{2}(\unicode[STIX]{x1D6FA})}\leq C\displaystyle \frac{\Vert \unicode[STIX]{x1D6FE}\Vert _{L^{\infty }(\unicode[STIX]{x1D6FA})}}{1-\sqrt{1-\unicode[STIX]{x1D716}}}\Vert f\Vert _{L^{2}(\unicode[STIX]{x1D6FA})},\end{eqnarray}$$
where the constant
 $C$
is independent of
 $u$
and
 $f$
.
Proof. From Lemma 2.38 and the Lax–Milgram lemma, there exists a unique
 $u\in H^{2}(\unicode[STIX]{x1D6FA})\cap H_{0}^{1}(\unicode[STIX]{x1D6FA})$
satisfying
 $$\begin{eqnarray}a(u,v)=\int _{\unicode[STIX]{x1D6FA}}\unicode[STIX]{x1D6FE}f\unicode[STIX]{x1D6E5}v,\quad \text{for all}~v\in H^{2}(\unicode[STIX]{x1D6FA})\cap H_{0}^{1}(\unicode[STIX]{x1D6FA}).\end{eqnarray}$$
Since
 $u\in H^{2}(\unicode[STIX]{x1D6FA})$
and the Laplace operator
 $\unicode[STIX]{x1D6E5}:H^{2}(\unicode[STIX]{x1D6FA})\cap H_{0}^{1}(\unicode[STIX]{x1D6FA})\rightarrow L^{2}(\unicode[STIX]{x1D6FA})$
is surjective on convex domains, standard arguments show that
 $u$
satisfies
 ${\mathcal{L}}u=f$
almost everywhere, that is, it is a strong solution to the elliptic problem (2.7). The coercivity condition (2.18) also implies the a priori estimate
 $$\begin{eqnarray}\Vert u\Vert _{H^{2}(\unicode[STIX]{x1D6FA})}\leq C\Vert \unicode[STIX]{x1D6E5}u\Vert _{L^{2}(\unicode[STIX]{x1D6FA})}\leq C\displaystyle \frac{\Vert \unicode[STIX]{x1D6FE}\Vert _{L^{\infty }(\unicode[STIX]{x1D6FA})}}{1-\sqrt{1-\unicode[STIX]{x1D716}}}\Vert f\Vert _{L^{2}(\unicode[STIX]{x1D6FA})}.\end{eqnarray}$$
Remark 2.40 (inf-sup conditions).
Since the Laplace operator is surjective from
 $H^{2}(\unicode[STIX]{x1D6FA})\cap H_{0}^{1}(\unicode[STIX]{x1D6FA})$
to
 $L^{2}(\unicode[STIX]{x1D6FA})$
on convex domains, the above arguments show that the inf-sup condition
 $$\begin{eqnarray}\sup _{w\in L^{2}(\unicode[STIX]{x1D6FA})\setminus \{0\}}\displaystyle \frac{\int _{\unicode[STIX]{x1D6FA}}\unicode[STIX]{x1D6FE}{\mathcal{L}}vw}{\Vert w\Vert _{L^{2}(\unicode[STIX]{x1D6FA})}}\geq (1-\sqrt{1-\unicode[STIX]{x1D716}})\Vert \unicode[STIX]{x1D6E5}v\Vert _{L^{2}(\unicode[STIX]{x1D6FA})},\quad \text{for all}~v\in H^{2}(\unicode[STIX]{x1D6FA})\cap H_{0}^{1}(\unicode[STIX]{x1D6FA})\end{eqnarray}$$
is satisfied. One can then appeal to the Babuška–Brezzi theorem to deduce the existence of strong solutions to (2.5). To our knowledge the use of this inf-sup condition for the numerical approximation has yet to be investigated.
Remark 2.41 (the case
$p\neq 2$
).

It is possible to show Maugeri et al. (Reference Maugeri, Palagachev and Softova2000, Theorem 1.2.3) that, if
 $\unicode[STIX]{x1D6FA}$
is convex and
 $A$
satisfies the Cordes condition, there are
 $1<p_{l}<2<p_{r}<\infty$
such that if
 $p\in (p_{l},p_{r})$
,
 $f\in L^{p}(\unicode[STIX]{x1D6FA})$
and
 $g=0$
, then problem (2.7) has a unique strong solution
 $u\in W^{2,p}(\unicode[STIX]{x1D6FA})\cap W_{0}^{1,p}(\unicode[STIX]{x1D6FA})$
. We also have an a priori estimate in which the constant now depends on
 $p$
.
Remark 2.42 (strong solutions under other conditions).
It is possible to obtain the existence and uniqueness of strong solutions for problem (2.7) under other assumptions. Let us discuss two of them.
-
∙ Assuming that
$A\in W^{1,d}(\unicode[STIX]{x1D6FA},\mathbb{S}^{d})$
one can write the operator
$L$
in non-divergence form and extend the theory of weak solutions, described in Section 2.3, to coefficients in this class. What is remarkable is that, in Example 2.31, for every
$\unicode[STIX]{x1D700}>0$
the parameter
$\unicode[STIX]{x1D706}$
can be chosen so that
$A\in W^{1,d-\unicode[STIX]{x1D700}}(\unicode[STIX]{x1D6FA},\mathbb{S}^{d})$
, thus showing that
$A\in W^{1,d-\unicode[STIX]{x1D700}}(\unicode[STIX]{x1D6FA},\mathbb{S}^{d})$
is not sufficient for uniqueness. On the other hand, if
$A\in W^{1,d+\unicode[STIX]{x1D700}}(\unicode[STIX]{x1D6FA},\mathbb{S}^{d})$
, for some
$\unicode[STIX]{x1D700}>0$
, then
$A\in C^{0,\unicode[STIX]{x1D6FC}}(\bar{\unicode[STIX]{x1D6FA}},\mathbb{S}^{d})$
and, consequently, the classical Schauder theory applies (see Theorem 2.17). -
∙ In essence, the case of uniformly continuous coefficients boils down to realizing that, locally, their oscillation in the
$L^{\infty }(\unicode[STIX]{x1D6FA})$
-norm is small, and so they can be considered a constant. These ideas have been extended (see Maugeri et al. Reference Maugeri, Palagachev and Softova2000, Chapter 2) to the case of a coefficient
$A\in \mathit{VMO}(\unicode[STIX]{x1D6FA},\mathbb{S}^{d})$
, thus showing that this is a sufficient condition to obtain strong solutions. Since
$W^{1,d}(\unicode[STIX]{x1D6FA})$
is a proper subset of
$\mathit{VMO}(\unicode[STIX]{x1D6FA})$
this result truly extends the case of Sobolev coefficients detailed above.












2.5 Viscosity solutions
At this point we wish to introduce one final notion of solution, the one that will be suited to the study of fully nonlinear equations. This is that of a viscosity solution. The reader may recall that the notion of weak solutions, introduced in Section 2.3, was based on an integration-by-parts argument (2.2) and the positivity (2.3) of the resulting operators. While this proved sufficient for linear and quasi-linear operators in divergence form, different arguments are necessary for fully nonlinear operators such as those of Examples 2.12–2.14. The fundamental property that will be used to define solutions in this case, as in Corollary 2.2, will be a comparison principle.
2.5.1 Definition and first properties
Let us begin by motivating the definition following Katzourakis (Reference Katzourakis2015). Let
 $F$
be an elliptic operator in the sense of Definition 2.10 and let
 $u\in C^{2}(\unicode[STIX]{x1D6FA})$
be a classical solution to
 $$\begin{eqnarray}F(x,u,Du,D^{2}u)=0\quad \text{in }\unicode[STIX]{x1D6FA}.\end{eqnarray}$$
Let
 $x_{0}\in \unicode[STIX]{x1D6FA}$
and assume that there is a smooth function
 $\unicode[STIX]{x1D711}\in C^{2}(\unicode[STIX]{x1D6FA})$
that can touch from above the graph of
 $u$
at
 $x_{0}$
. More precisely, we assume that
 $$\begin{eqnarray}u(x)\leq \unicode[STIX]{x1D711}(x)\quad \text{for all}~x\in \unicode[STIX]{x1D6FA},\quad u(x_{0})=\unicode[STIX]{x1D711}(x_{0}).\end{eqnarray}$$
These conditions imply that the function
 $u-\unicode[STIX]{x1D711}$
has a local maximum at
 $x_{0}$
and, consequently,
 $$\begin{eqnarray}D(u-\unicode[STIX]{x1D711})(x_{0})=0,\quad D^{2}(u-\unicode[STIX]{x1D711})(x_{0})\leq 0.\end{eqnarray}$$
Since the operator
 $F$
is assumed to be elliptic we obtain
 $$\begin{eqnarray}\displaystyle 0 & = & \displaystyle F(x_{0},u(x_{0}),Du(x_{0}),D^{2}u(x_{0}))=F(x_{0},\unicode[STIX]{x1D711}(x_{0}),D\unicode[STIX]{x1D711}(x_{0}),D^{2}u(x_{0}))\nonumber\\ \displaystyle & \leq & \displaystyle F(x_{0},\unicode[STIX]{x1D711}(x_{0}),D\unicode[STIX]{x1D711}(x_{0}),D^{2}\unicode[STIX]{x1D711}(x_{0})).\nonumber\end{eqnarray}$$
Similar considerations will give us that if
 $\unicode[STIX]{x1D713}\in C^{2}(\unicode[STIX]{x1D6FA})$
touches from below the graph of
 $u$
at
 $x_{0}$
, we would obtain
 $$\begin{eqnarray}F(x_{0},\unicode[STIX]{x1D713}(x_{0}),D\unicode[STIX]{x1D713}(x_{0}),D^{2}\unicode[STIX]{x1D713}(x_{0}))\leq 0.\end{eqnarray}$$
Finally we note that it is possible to reach the same conclusions if we replace the equality in (2.19) with a corresponding inequality. These considerations motivate the following definition.
Definition 2.43 (viscosity solution).
Let
 $F$
be elliptic in the sense of Definition 2.10. We say that the function
 $u\in C(\unicode[STIX]{x1D6FA})$
is:
-
(a) a viscosity subsolution of (2.19) if, whenever
$x_{0}\in \unicode[STIX]{x1D6FA}$
,
$\unicode[STIX]{x1D711}\in C^{2}(\unicode[STIX]{x1D6FA})$
and
$u-\unicode[STIX]{x1D711}$
has a local maximum at
$x_{0}$
we have that
$$\begin{eqnarray}F(x_{0},\unicode[STIX]{x1D711}(x_{0}),D\unicode[STIX]{x1D711}(x_{0}),D^{2}\unicode[STIX]{x1D711}(x_{0}))\geq 0,\end{eqnarray}$$
-
(b) a viscosity supersolution of (2.19) if, whenever
$x_{0}\in \unicode[STIX]{x1D6FA}$
,
$\unicode[STIX]{x1D711}\in C^{2}(\unicode[STIX]{x1D6FA})$
and
$u-\unicode[STIX]{x1D711}$
has a local minimum at
$x_{0}$
we have that
$$\begin{eqnarray}F(x_{0},\unicode[STIX]{x1D711}(x_{0}),D\unicode[STIX]{x1D711}(x_{0}),D^{2}\unicode[STIX]{x1D711}(x_{0}))\leq 0,\end{eqnarray}$$
-
(c) a viscosity solution if it is a sub- and supersolution.


Remark 2.44 (viscosity solutions).
Several remarks must immediately be made about Definition 2.43.
-
∙ While the motivation provided assumed that the function
$u$
is smooth, the definition only requires its continuity. -
∙ By approximation and continuity of
$F$
, it is sufficient to verify the condition for quadratic polynomials
$\unicode[STIX]{x1D711}\in \mathbb{P}_{2}$
; see Caffarelli and Cabré (Reference Caffarelli and Cabré1995, Proposition 2.4). -
∙ If
$u\in C^{2}(\unicode[STIX]{x1D6FA})$
is a classical solution then it is a viscosity solution. This follows from the ellipticity of
$F$
. Moreover, sufficiently smooth viscosity solutions are also classical; see Caffarelli and Cabré (Reference Caffarelli and Cabré1995, Lemma 2.5) and Katzourakis (Reference Katzourakis2015, Theorem 2.11). -
∙ This definition talks only about solutions to equation (2.19), not the boundary value problem (2.6). More details on this issue will be provided below; see Definition 2.48 and Section 2.5.3.
-
∙ The definition assumes that the candidate solution can be touched from above (below). At points where this is not possible there is nothing to verify, and the function automatically satisfies the equation at these points.
-
∙ For the divergence-form operators
$L$
and
$\tilde{L}$
of Definition 2.3 and Example 2.4, respectively, it is known Ishii (Reference Ishii1995) that the concepts of weak solution, in the sense of Definition 2.19, and viscosity solutions coincide. -
∙ We will not provide a historical account of the origin and development of this definition. The interested reader can consult the classical reference by Crandall et al. (Reference Crandall, Ishii and Lions1992).


A remarkable property of viscosity solutions is their stability, which is detailed in the following two results. For a proof of the first one we refer to Caffarelli and Cabré (Reference Caffarelli and Cabré1995, Proposition 2.8), Katzourakis (Reference Katzourakis2015, Theorem 3.2) or Crandall et al. (Reference Crandall, Ishii and Lions1992, Section 6). For the second one, we refer to Caffarelli and Cabré (Reference Caffarelli and Cabré1995, Proposition 2.7) or Katzourakis (Reference Katzourakis2015, Theorem 3.12).
Theorem 2.45 (limits and viscosity solutions).
Let
 $\{F_{k}\}_{k\in \mathbb{N}}$
be a sequence of uniformly elliptic operators in the sense of Definition 2.10, and let
 $\{u_{k}\}_{k\in \mathbb{N}}\subset C(\unicode[STIX]{x1D6FA})$
, for each
 $k$
, be viscosity subsolutions to the equations
 $$\begin{eqnarray}F_{k}(x,u_{k},Du_{k},D^{2}u_{k})=0.\end{eqnarray}$$
If, as
 $k\rightarrow \infty$
,
 $F_{k}\rightarrow F$
uniformly on compact subsets of
 $\unicode[STIX]{x1D6FA}\times \mathbb{R}\times \mathbb{R}^{d}\times \mathbb{S}^{d}$
and
 $u_{k}\rightarrow u$
uniformly in compact subsets of
 $\unicode[STIX]{x1D6FA}$
, then
 $u$
is a viscosity subsolution of
 $$\begin{eqnarray}F(x,u,Du,D^{2}u)=0.\end{eqnarray}$$
Theorem 2.46 (suprema of subsolutions).
Let
 ${\mathcal{U}}\subset C(\unicode[STIX]{x1D6FA})$
be a set of viscosity subsolutions of (2.19). For
 $x\in \unicode[STIX]{x1D6FA}$
define
 $$\begin{eqnarray}\bar{u}(x)=\sup \{u(x):u\in {\mathcal{U}}\}.\end{eqnarray}$$
Suppose that
 $\bar{u}\in C(\unicode[STIX]{x1D6FA})$
and is bounded. Then
 $\bar{u}$
is a viscosity subsolution of (2.19).
2.5.2 Existence and uniqueness
Let us now turn our attention to the existence and uniqueness of viscosity solutions to (2.6). To do so we must specify in which sense the boundary conditions are being understood. We begin by introducing the notion of semi-continuity.
Definition 2.47 (semi-continuity).
We say the function
 $u\in \mathit{LSC}(\unicode[STIX]{x1D6FA})$
(is lower semi-continuous) if, for all
 $x\in \unicode[STIX]{x1D6FA}$
,
 $$\begin{eqnarray}u(x)\leq \liminf _{y\rightarrow x}u(y).\end{eqnarray}$$
On the other hand, we say
 $u\in \mathit{USC}(\unicode[STIX]{x1D6FA})$
(is upper semi-continuous) if
 $-u\in \mathit{LSC}(\unicode[STIX]{x1D6FA})$
.
Note that, in Definition 2.43 and the discussion that followed, nothing would have changed if we had only required subsolutions and supersolutions to be upper and lower semi-continuous, respectively. With this definition at hand, we may define viscosity solutions to the Dirichlet problem.
Definition 2.48 (solution to the Dirichlet problem).
Let
 $F$
be elliptic in the sense of Definition 2.10 and
 $g\in C(\unicode[STIX]{x2202}\unicode[STIX]{x1D6FA})$
.
-
(a) The function
$u_{\star }\in \mathit{USC}(\bar{\unicode[STIX]{x1D6FA}})$
is a viscosity subsolution to (2.6) if it is a viscosity subsolution to the equation (2.19) and
$u_{\star }(x)\leq g(x)$
for all
$x\in \unicode[STIX]{x2202}\unicode[STIX]{x1D6FA}$
. -
(b) The function
$u^{\star }\in \mathit{LSC}(\bar{\unicode[STIX]{x1D6FA}})$
is a viscosity supersolution to (2.6) if it is a viscosity supersolution to (2.19) and
$u^{\star }(x)\geq g(x)$
for all
$x\in \unicode[STIX]{x2202}\unicode[STIX]{x1D6FA}$
. -
(c) The function
$u\in C(\bar{\unicode[STIX]{x1D6FA}})$
is a viscosity solution to (2.6) if it is a sub- and supersolution.


Note that this definition requires the boundary values to be attained in the classical sense. Different boundary conditions might require a different interpretation, and we will briefly comment on this below.
We now turn our attention to the existence of solutions and the so-called Perron’s method. Simply put, this method provides existence under the assumption that the problem cannot have more than one solution. While uniqueness of classical solutions is immediate, as shown in Theorem 2.16, in this more general setting we need one additional condition.
Definition 2.49 (comparison).
We say that the Dirichlet problem (2.6) satisfies a comparison principle if, whenever
 $u_{\star }\in \mathit{USC}(\unicode[STIX]{x1D6FA})$
and
 $u^{\star }\in \mathit{LSC}(\unicode[STIX]{x1D6FA})$
are sub- and supersolutions, respectively, we have
 $$\begin{eqnarray}u_{\star }\leq u^{\star }\quad \text{in }\unicode[STIX]{x1D6FA}.\end{eqnarray}$$
Note that from Definition 2.49, it immediately follows that (2.6) cannot have more than one solution. Indeed, if
 $u$
and
 $v$
are two viscosity solutions, then, in particular,
 $u$
is a subsolution and
 $v$
a supersolution; consequently,
 $u\leq v$
. An analogous reasoning yields the reverse inequality.
With these two conditions at hand, we proceed to show existence of solutions. For a proof, we refer the reader, for instance, to Crandall et al. (Reference Crandall, Ishii and Lions1992, Theorem 4.1) and Katzourakis (Reference Katzourakis2015, Theorem 5.3).
Theorem 2.50 (Perron’s method).
Let
 $F$
be elliptic in the sense of Definition 2.10 and
 $g\in C(\unicode[STIX]{x2202}\unicode[STIX]{x1D6FA})$
. Assume that the Dirichlet problem (2.6) satisfies a comparison principle in the sense of Definition 2.49. If there exist a subsolution
 $u_{\star }$
and a supersolution
 $u^{\star }$
to (2.6) that satisfy the boundary condition, then
 $$\begin{eqnarray}u(x)=\sup \{v(x):u_{\star }\leq v\leq u^{\star }~\text{and }v\text{ is a subsolution}\}\end{eqnarray}$$
defines a viscosity solution to (2.6).
Note that, while Theorem 2.50 provides a somewhat explicit construction of the unique solution to (2.6), one still needs to verify the existence of sub- and supersolutions that satisfy the boundary condition in a classical sense. This must be done on a case-by-case basis, and we refer the reader to Crandall et al. (Reference Crandall, Ishii and Lions1992, Example 4.6) and Katzourakis (Reference Katzourakis2015, Application 5.9) for two examples where these are constructed.
It remains to understand which operators satisfy the comparison principle of Definition 2.49. Loosely speaking, similar ideas to those presented in Theorem 2.16 should yield uniqueness of viscosity solutions. However, the arguments presented there cannot be applied directly since we are dealing with functions that are merely continuous, and additional structural conditions must be imposed. This is due to the subtle fact – which may have escaped the reader – that Definition 2.10 is too general. By this we mean that, for instance, first-order and parabolic equations fit into this definition. For this reason, many authors say that an operator is degenerate elliptic if it only satisfies the monotonicity condition with respect to the
 $M$
variable. This is in contrast with uniform ellipticity, which precludes these two degenerate cases.
For the sake of illustration, let us concentrate our efforts on finding a comparison principle for uniformly elliptic equations. We begin by showing, following Kawohl and Kutev (Reference Kawohl and Kutev2007, Example 1), that uniform ellipticity is not enough to ensure a comparison principle.
Example 2.51 (lack of comparison).
Consider the Dirichlet problem
 $$\begin{eqnarray}u^{\prime \prime }+18x(u^{\prime })^{4}=0\quad \text{in }(-1,1),\quad u(-1)=-b,~u(1)=b,\end{eqnarray}$$
with
 $b>1$
. Clearly, the equation is uniformly elliptic. It is easy to check that the functions
 $$\begin{eqnarray}u_{\star }(x)=\left\{\begin{array}{@{}ll@{}}\sqrt[3]{x}-1+b\quad & x\in [0,1],\\ \sqrt[3]{x}+1-b\quad & x\in [-1,0),\end{array}\right.\quad u^{\star }(x)=\left\{\begin{array}{@{}ll@{}}\sqrt[3]{x}-1+b\quad & x\in (0,1],\\ \sqrt[3]{x}+1-b\quad & x\in [-1,0],\end{array}\right.\end{eqnarray}$$
which differ only at the origin, are viscosity sub- and supersolutions, respectively, and that they satisfy the boundary values. Note, however, that
 $$\begin{eqnarray}\max _{x\in (-1,1)}\{u_{\star }(x)-u^{\star }(x)\}=u_{\star }(0)-u^{\star }(0)=2b-2>0.\end{eqnarray}$$
While, to our knowledge, necessary and sufficient conditions for the existence of a comparison principle for a general elliptic operator are not known, there are several sufficient conditions. We collect these in the following result.
Theorem 2.52 (existence of comparison principle).
If the Dirichlet problem (2.6) satisfies any of the structural conditions given below, then it satisfies a comparison principle in the sense of Definition 2.49.
-
(a) Katzourakis (Reference Katzourakis2015, Theorem 6.1) The dependence with respect to
$x$
is decoupled, that is, the equation reads with
$$\begin{eqnarray}F(u,Du,D^{2}u)=f,\end{eqnarray}$$
$F\in C(\mathbb{R},\mathbb{R}^{d},\mathbb{S}^{d})$
,
$f\in C(\bar{\unicode[STIX]{x1D6FA}})$
. The operator
$F$
is elliptic, and satisfies, for some
$\unicode[STIX]{x1D6FE}>0$
,
$$\begin{eqnarray}F(r,\mathbf{p},M)\geq F(s,\mathbf{p},M)+\unicode[STIX]{x1D6FE}(s-r),\quad \text{for all}~r\leq s.\end{eqnarray}$$
-
(b) The operator
$F$
is elliptic, independent of the
$r$
and
$\mathbf{p}$
variables, and satisfies, for some
$\unicode[STIX]{x1D706}>0$
,
$$\begin{eqnarray}F(x,M+tI)\geq F(x,M)+\unicode[STIX]{x1D706}t,\quad \text{for all}~t\geq 0.\end{eqnarray}$$
-
(c) Trudinger (Reference Trudinger1988) The operator
$F$
is uniformly elliptic, Lipschitz-continuous in
$\mathbf{p}$
and the following continuity assumption holds: for all
$$\begin{eqnarray}|F(x,r,\mathbf{p},M)-F(y,r,\mathbf{p},M)|\leq \unicode[STIX]{x1D707}_{2}|x-y|^{1/2}|M|+\unicode[STIX]{x1D714}(|x-y|),\end{eqnarray}$$
$x,y\in \unicode[STIX]{x1D6FA}$
,
$r$
and
$\mathbf{p}$
in a suitable ball and
$\unicode[STIX]{x1D714}(a)\rightarrow 0$
as
$a\downarrow 0$
. Additionally, one must assume that sub- and supersolutions belong to
$C^{0,1}(\unicode[STIX]{x1D6FA})$
.
-
(d) Koike (Reference Koike2004) The dependence with respect to the
$r$
variable is decoupled, that is, the equation reads with either
$$\begin{eqnarray}\unicode[STIX]{x1D708}u+F(x,Du,D^{2}u)=0,\end{eqnarray}$$
$\unicode[STIX]{x1D708}<0$
and
$F$
elliptic, or
$\unicode[STIX]{x1D708}\leq 0$
,
$F$
uniformly elliptic and Lipschitz in the
$\mathbf{p}$
variable, for
$\mathbf{p}\in \mathbb{R}^{d}$
.
-
(e) Silvestre (Reference Silvestre2015) The operator
$F$
is independent of
$x$
and
$\mathbf{p}$
and is strictly decreasing in
$r$
, that is, whenever
$r>s$
,
$$\begin{eqnarray}F(r,M)<F(s,M),\quad \text{for all}~M\in \mathbb{S}^{d}.\end{eqnarray}$$


Other conditions can be found in the literature.
2.5.3 Other boundary conditions
So far, for all notions of solutions, we have only discussed the Dirichlet problem (see the second equation in (2.6)). Moreover, for viscosity solutions we have assumed that the boundary conditions are attained in a classical sense. Let us here consider other types of boundary conditions as well as generalized notions for them. Consider
 $$\begin{eqnarray}F(x,u,Du,D^{2}u)=0\quad \text{in }\unicode[STIX]{x1D6FA},\quad B(x,u,Du)=0\quad \text{on }\unicode[STIX]{x2202}\unicode[STIX]{x1D6FA},\end{eqnarray}$$
where, as before, the map
 $F$
is elliptic, but its domain of definition on the
 $x$
variable is now
 $\bar{\unicode[STIX]{x1D6FA}}$
. The function
 $B:\unicode[STIX]{x2202}\unicode[STIX]{x1D6FA}\times \mathbb{R}\times \mathbb{R}^{d}$
is assumed to be non-increasing in its second argument, that is,
 $$\begin{eqnarray}r\geq s\Rightarrow B(x,r,\mathbf{p})\leq B(x,s,\mathbf{p}),\quad \text{for all}~x\in \unicode[STIX]{x2202}\unicode[STIX]{x1D6FA},~\mathbf{p}\in \mathbb{R}^{d}.\end{eqnarray}$$
The Dirichlet problem obviously falls into this description with
 $B(x,r,\mathbf{p})=g(x)-r$
, but others are also admissible. For instance, let
 $\mathbf{n}(x)$
denote the outer normal to
 $\unicode[STIX]{x2202}\unicode[STIX]{x1D6FA}$
at
 $x$
and let
 $\unicode[STIX]{x1D742}:\unicode[STIX]{x2202}\unicode[STIX]{x1D6FA}\rightarrow \mathbb{R}^{d}$
be such that, for all
 $x\in \unicode[STIX]{x2202}\unicode[STIX]{x1D6FA}$
, we have
 $\unicode[STIX]{x1D742}(x)\cdot \mathbf{n}(x)>0$
. The boundary condition
 $$\begin{eqnarray}B(x,\mathbf{p})=\unicode[STIX]{x1D742}(x)\cdot \mathbf{p}-g(x)\end{eqnarray}$$
gives rise to the so-called oblique derivative problem; if
 $\unicode[STIX]{x1D742}=\mathbf{n}$
, this is the Neumann problem. A nonlinear example is the capillarity condition
 $$\begin{eqnarray}B(x,r,\mathbf{p})=\mathbf{n}\cdot \mathbf{p}-g(x,r)\sqrt{1+|\mathbf{p}|^{2}}.\end{eqnarray}$$
At the beginning of Section 2.5.1 the introduction of viscosity solution was motivated by the assumption that the function
 $u-\unicode[STIX]{x1D711}$
had a local maximum (minimum) at
 $x_{0}\in \unicode[STIX]{x1D6FA}$
. When dealing with boundary conditions, we must now allow for
 $x\in \unicode[STIX]{x2202}\unicode[STIX]{x1D6FA}$
. At these points the relations that led to the definition of viscosity solution no longer hold, and a modification is necessary. It turns out that the correct notion is as follows.
Definition 2.53 (viscosity subsolution).
With the functions
 $F$
and
 $B$
as above, we say that
 $u\in \mathit{USC}(\bar{\unicode[STIX]{x1D6FA}})$
is a viscosity subsolution to (2.20) if it is a viscosity subsolution to (2.19) and, whenever there is a
 $\unicode[STIX]{x1D711}\in C^{2}(\mathbb{R}^{d})$
that touches the graph of
 $u$
from above at
 $x_{0}\in \unicode[STIX]{x2202}\unicode[STIX]{x1D6FA}$
, then either
 $$\begin{eqnarray}B(x_{0},\unicode[STIX]{x1D711}(x_{0}),D\unicode[STIX]{x1D711}(x_{0}))\geq 0\quad \text{or}\quad F(x_{0},\unicode[STIX]{x1D711}(x_{0}),D\unicode[STIX]{x1D711}(x_{0}),D^{2}\unicode[STIX]{x1D711}(x_{0}))\geq 0.\end{eqnarray}$$
In an analogous manner we can consider supersolutions and, as before, a solution to (2.20) is a function
 $u\in C(\bar{\unicode[STIX]{x1D6FA}})$
that is both a sub- and supersolution.
It is important to realize that boundary conditions in the viscosity sense, in general, are not equivalent to those in the classical sense. The reason for this, once more, is that Definition 2.10 is rather general and, for instance, allows us to consider first-order equations for which Dirichlet conditions cannot be imposed on the whole boundary. It is therefore natural to ask when a boundary condition in the viscosity sense is attained classically. Let us briefly elaborate on this issue for the Dirichlet problem (2.6). We begin with the definition of a barrier.
Definition 2.54 (barrier).
We say that (2.6) has barriers at
 $x_{0}\in \unicode[STIX]{x2202}\unicode[STIX]{x1D6FA}$
if there exist two continuous functions
 $\bar{u}$
,
 $\text{}\underline{u}$
that are super- and subsolutions to (2.6), respectively, and that satisfy
 $\bar{u}(x_{0})=\text{}\underline{u}(x_{0})=g(x_{0})$
.
Proposition 2.55 (viscosity versus classical).
Let
 $u$
be a viscosity solution to (2.6) in the sense of Definition 2.53. If barriers exist at
 $x_{0}\in \unicode[STIX]{x2202}\unicode[STIX]{x1D6FA}$
, then
 $u(x_{0})=g(x_{0})$
.
In other words, classical and viscosity conditions coincide at points where it is possible to construct a barrier. We conclude this discussion by providing a sufficient condition for the existence of barriers.
Proposition 2.56 (existence of barriers).
Let
 $\unicode[STIX]{x1D6FA}$
be such that it has a tangent ball from outside at every point of
 $\unicode[STIX]{x2202}\unicode[STIX]{x1D6FA}$
. If
 $F$
is uniformly elliptic, Lipschitz with respect to all its variables and, for every
 $x\in \bar{\unicode[STIX]{x1D6FA}}$
, we have
 $F(x,0,\mathbf{0},0)=0$
, then barriers exist at every point
 $x_{0}\in \unicode[STIX]{x2202}\unicode[STIX]{x1D6FA}$
.
2.5.4 Regularity
To finalize the presentation on viscosity solutions, we elaborate on their regularity. This is important not only because these results will serve as a guide to establishing rates of convergence for numerical schemes, but also many of the ideas and techniques that we present here have a discrete analogue that will be detailed in subsequent sections.
We begin with a result by Nirenberg (Reference Nirenberg1953) that shows that in two dimensions, essentially, all solutions to elliptic equations are locally
 $C^{2,\unicode[STIX]{x1D6FC}}$
.
Theorem 2.57 (regularity in two dimensions).
Let
 $d=2$
. Assume that
 $F$
is uniformly elliptic in the sense of Definition 2.10 and that it has bounded first derivatives with respect to all its arguments. If
 $u$
is a solution to (2.19), then for every
 $\unicode[STIX]{x1D714}\Subset \unicode[STIX]{x1D6FA}$
there are
 $C>0$
,
 $\unicode[STIX]{x1D6FC}\in (0,1)$
that depend only on the ellipticity constants of
 $F$
, the bounds on its first derivatives and the distance between
 $\unicode[STIX]{x1D714}$
and
 $\unicode[STIX]{x2202}\unicode[STIX]{x1D6FA}$
, for which
 $$\begin{eqnarray}\Vert u\Vert _{C^{2,\unicode[STIX]{x1D6FC}}(\unicode[STIX]{x1D714})}\leq C\Vert u\Vert _{L^{\infty }(\unicode[STIX]{x1D6FA})}.\end{eqnarray}$$
It is remarkable that this result was obtained long before the development of the theory of viscosity solutions.
To obtain global regularity or results in more dimensions we begin by introducing several notions of a more or less geometric nature. Recall that a function
 $u:\unicode[STIX]{x1D6FA}\rightarrow \mathbb{R}$
is convex if
 $$\begin{eqnarray}u(\unicode[STIX]{x1D6FC}x+(1-\unicode[STIX]{x1D6FC})y)\leq \unicode[STIX]{x1D6FC}u(x)+(1-\unicode[STIX]{x1D6FC})u(y),\quad \text{for all}~x,y\in \unicode[STIX]{x1D6FA},~\unicode[STIX]{x1D6FC}\in [0,1].\end{eqnarray}$$
For a convex function we define its subdifferential as follows.
Definition 2.58 (subdifferential).
Let
 $u\in C(\unicode[STIX]{x1D6FA})$
. The subdifferential of
 $u$
at the point
 $x\in \unicode[STIX]{x1D6FA}$
is
 $$\begin{eqnarray}\unicode[STIX]{x2202}u(x)=\{\mathbf{p}\in \mathbb{R}^{d}:u(y)-u(x)\geq \mathbf{p}\cdot (y-x)~\forall y\in \unicode[STIX]{x1D6FA}\}.\end{eqnarray}$$
It is well known Ekeland and Témam (Reference Ekeland and Témam1999) that if
 $u$
is convex then
 $\unicode[STIX]{x2202}u(x)\neq \emptyset$
, and that if
 $u$
is differentiable at
 $x$
then
 $\unicode[STIX]{x2202}u(x)=\{Du(x)\}$
. Given a function
 $u$
, we can always construct the largest convex function lying below
 $u$
. This gives rise to the convex envelope. In what follows we will only need this concept for the negative part of a function, so we define the convex envelope in this restricted setting.
Definition 2.59 (convex envelope and contact set).
Let
 $B_{r}$
be a ball such that
 $\unicode[STIX]{x1D6FA}\subset B_{r}$
, and let
 $v\in C(\unicode[STIX]{x1D6FA})$
with
 $v\geq 0$
on
 $\unicode[STIX]{x2202}\unicode[STIX]{x1D6FA}$
. Extend
 $v^{-}$
by zero to
 $B_{r}\setminus \unicode[STIX]{x1D6FA}$
. The convex envelope of
 $v$
is defined, for
 $x\in B_{r}$
, by
 $$\begin{eqnarray}\unicode[STIX]{x1D6E4}(v)(x)=\sup \{L(x):L(z)\leq -v^{-}(z)~\forall z\in B_{r},~L\in \mathbb{P}_{1}\}.\end{eqnarray}$$
The points at which these two functions coincide are called contact points:
 $$\begin{eqnarray}{\mathcal{C}}^{-}(v)=\{x\in B_{r}:v(x)=\unicode[STIX]{x1D6E4}(v)(x)\}.\end{eqnarray}$$
Convex envelope (dotted red) and contact set (dashed blue).

An illustration of the convex envelope of a function and its contact set is given in Figure 2.1. From the figure it is intuitively clear that, for fixed values of
 $v$
on the boundary, how deep the graph of
 $v$
can go depends only on the values of
 $v$
at
 ${\mathcal{C}}^{-}(v)$
. The formalization of this observation is the so-called Alexandrov estimate.
Theorem 2.60 (Alexandrov estimate).
Let
 $v\in C(\bar{B}_{r})$
with
 $v\geq 0$
on
 $\unicode[STIX]{x2202}B_{r}$
. If
 $\unicode[STIX]{x1D6E4}(v)\in C^{1,1}(B_{r})$
, then
 $$\begin{eqnarray}\sup _{B_{r}}v^{-}\leq Cr|\unicode[STIX]{x2202}\unicode[STIX]{x1D6E4}(v)({\mathcal{C}}^{-}(v))|^{1/d}.\end{eqnarray}$$
In other words, there is a set
 $A\subset B_{r}$
that satisfies
 $|B_{r}\setminus A|=0$
and for which we have
 $$\begin{eqnarray}\sup _{B_{r}}v^{-}\leq Cr\biggl(\int _{A\cap {\mathcal{C}}^{-}(v)}\det D^{2}\unicode[STIX]{x1D6E4}(v)\biggr)^{1/d},\end{eqnarray}$$
where the constant
 $C$
depends only on
 $d$
.
Proof. For completeness, we sketch the proof for
 $v\in C^{2}(B_{r})$
, since in this case
 $\unicode[STIX]{x2202}\unicode[STIX]{x1D6E4}(v)$
is single-valued on
 ${\mathcal{C}}^{-}(v)$
.
Let
 $M=\sup _{B_{r}}v^{-}/2r$
and assume that
 $B_{M}\subset \unicode[STIX]{x2202}\unicode[STIX]{x1D6E4}(v)({\mathcal{C}}^{-}(v))$
. If that is the case,
 $$\begin{eqnarray}M^{d}\leq C|\unicode[STIX]{x2202}\unicode[STIX]{x1D6E4}(v)({\mathcal{C}}^{-}(v))|,\end{eqnarray}$$
for a constant that depends only on the dimension
 $d$
. This shows the first estimate. On the other hand, a simple change of variables yields
 $$\begin{eqnarray}|\unicode[STIX]{x2202}\unicode[STIX]{x1D6E4}(v)({\mathcal{C}}^{-}(v))|=\int _{\unicode[STIX]{x2202}\unicode[STIX]{x1D6E4}(v)({\mathcal{C}}^{-}(v))}=\int _{{\mathcal{C}}^{-}(v)}\det D^{2}\unicode[STIX]{x1D6E4}(v),\end{eqnarray}$$
so that the second statement follows from the first one.
We now show the inclusion
 $B_{M}\subset \unicode[STIX]{x2202}\unicode[STIX]{x1D6E4}(v)({\mathcal{C}}^{-}(v))$
. Let
 $z\in B_{r}$
be a point where
 $\sup _{B_{r}}v^{-}$
is attained. For
 $\mathbf{a}\in B_{M}$
, define the affine function
 $$\begin{eqnarray}L(x)=-\sup _{B_{r}}v^{-}+\mathbf{a}\cdot (x-z)\end{eqnarray}$$
and note that
 $L(z)=-\sup _{B_{r}}v^{-}$
and, for all
 $x\in B_{r}$
,
 $$\begin{eqnarray}L(x)\leq -\sup _{B_{r}}v^{-}+|\mathbf{a}|\,|x-z|<-\sup _{B_{r}}v^{-}+2Mr=0.\end{eqnarray}$$
Since
 $Dv(z)=0$
there is a
 $x_{1}\in B_{r}$
such that
 $v(x_{1})<L(x_{1})<0$
. In addition, we have that
 $v(x)\geq 0>L(x)$
for
 $x\in \unicode[STIX]{x2202}B_{r}$
. This shows that, if
 $\bar{x}\in B_{r}$
is a point where
 $v-L$
attains its minimum, then
 $v(\bar{x})<L(\bar{x})\leq 0$
and
 $Dv(\bar{x})=DL(\bar{x})=\mathbf{a}$
.
Define
 $\tilde{L}(x)=L(x)+v(\bar{x})-L(\bar{x})$
and note that
 $v(\bar{x})=\tilde{L}(\bar{x})$
,
 $Dv(\bar{x})=D\tilde{L}(\bar{x})=\mathbf{a}$
and, for every
 $x\in B_{r}$
 $v(x)\geq \tilde{L}(x)$
. In other words,
 $\tilde{L}$
is a supporting hyperplane for
 $v$
. This shows that
 $\bar{x}\in {\mathcal{C}}^{-}(v)$
and that
 $\mathbf{a}\in \unicode[STIX]{x2202}\unicode[STIX]{x1D6E4}(v)(\bar{x})$
, that is,
 $B_{M}\subset \unicode[STIX]{x2202}\unicode[STIX]{x1D6E4}(v)({\mathcal{C}}^{-}(v))$
.
Note that in Theorem 2.60 only the contact set is relevant. This is due to the fact that if for
 $x_{0}\in B_{r}$
we have
 $\unicode[STIX]{x1D6E4}(v)(x_{0})<v(x_{0})$
, then locally
 $\unicode[STIX]{x1D6E4}(v)$
is affine, and thus
 $D^{2}\unicode[STIX]{x1D6E4}(v)=0$
.
With this estimate at hand we proceed to obtain the fundamental a priori estimate for viscosity solutions, the so-called Alexandrov–Bakelman–Pucci estimate. We begin by providing some motivation for this result. To do so, assume that
 $u\in C^{2}(\bar{B}_{r})$
with
 $u\geq 0$
on
 $\unicode[STIX]{x2202}B_{r}$
satisfies
 ${\mathcal{L}}u\leq f$
in
 $B_{r}$
. In this setting we have that, for
 $x\in {\mathcal{C}}^{-}(u)$
,
 $D^{2}u(x)\geq 0$
, and consequently
 $A(x):D^{2}u(x)\geq 0$
as well. This, in particular, implies that
 $f(x)\geq 0$
. Let
 $D=\inf _{x\in \bar{B}_{r}}\det A(x)>0$
and observe that
 $$\begin{eqnarray}\det A(x)D^{2}u(x)=\det A(x)\det D^{2}u(x)\geq D\det D^{2}u(x)\geq 0.\end{eqnarray}$$
Let
 $\unicode[STIX]{x1D70E}(A(x)D^{2}u(x))=\{\unicode[STIX]{x1D707}_{i}(x)\}_{i=1}^{d}$
. Then an application of the arithmetic–geometric inequality reveals that
 $$\begin{eqnarray}\displaystyle & & \displaystyle \det A(x)D^{2}u(x)\nonumber\\ \displaystyle & & \displaystyle \qquad =\mathop{\prod }_{i=1}^{d}\unicode[STIX]{x1D707}_{i}(x)=\biggl(\mathop{\prod }_{i=1}^{d}\unicode[STIX]{x1D707}_{i}(x)^{1/d}\biggr)^{d}\leq \biggl(\displaystyle \frac{1}{d}\mathop{\sum }_{i=1}^{d}\unicode[STIX]{x1D707}_{i}(x)\biggr)^{d}\nonumber\\ \displaystyle & & \displaystyle \qquad =\biggl(\displaystyle \frac{1}{d}\operatorname{tr}A(x)D^{2}u(x)\biggr)^{d}=\biggl(\displaystyle \frac{1}{d}A(x):D^{2}u(x)\biggr)^{d}\leq \biggl(\displaystyle \frac{1}{d}f(x)\biggr)^{d},\nonumber\end{eqnarray}$$
where in the last step we used that
 ${\mathcal{L}}u\leq f$
. Theorem 2.60 then yields that
 $$\begin{eqnarray}\sup _{B_{r}}u^{-}\leq Cr\biggl(\int _{{\mathcal{C}}^{-}(u)}(f^{+})^{d}\biggr)^{1/d},\end{eqnarray}$$
for a constant that depends only on
 $d$
and
 $D$
.
While the considerations presented assumed that we were working with a linear equation, we essentially used that the matrix was uniformly positive definite and bounded, that is, the operator
 ${\mathcal{L}}$
is elliptic. A similar conclusion can be drawn from the fact that an operator is elliptic in the sense of Definition 2.10. We begin by observing Caffarelli and Cabré (Reference Caffarelli and Cabré1995, Lemma 2.2) that
 $F$
is uniformly elliptic if and only if
 $$\begin{eqnarray}F(x,r,\mathbf{p},M+N)-F(x,r,\mathbf{p},M)\leq \unicode[STIX]{x1D6EC}|N^{+}|-\unicode[STIX]{x1D706}|N^{-}|,\end{eqnarray}$$
where
 $N=N^{+}-N^{-}$
with
 $N^{+},N^{-}\geq 0$
and
 $N^{+}N^{-}=0$
. Now, if
 $u$
is a sufficiently smooth subsolution of (2.19), from the observation above we have
 $$\begin{eqnarray}\displaystyle f(x) & := & \displaystyle -F(x,0,\mathbf{0},0)\leq F(x,u(x),Du(x),D^{2}u(x))-F(x,0,\mathbf{0},0)\nonumber\\ \displaystyle & \leq & \displaystyle \unicode[STIX]{x1D6EC}\mathop{\sum }_{\unicode[STIX]{x1D706}_{i}(u)>0}\unicode[STIX]{x1D706}_{i}(u)+\unicode[STIX]{x1D706}\mathop{\sum }_{\unicode[STIX]{x1D706}_{i}(u)<0}\unicode[STIX]{x1D706}_{i}(u),\nonumber\end{eqnarray}$$
where
 $\unicode[STIX]{x1D70E}(D^{2}u(x))=\{\unicode[STIX]{x1D706}_{i}(u)\}_{i=1}^{d}$
. Similarly, for a supersolution we have
 $$\begin{eqnarray}f(x)\geq \unicode[STIX]{x1D6EC}\mathop{\sum }_{\unicode[STIX]{x1D706}_{i}(u)<0}\unicode[STIX]{x1D706}_{i}(u)+\unicode[STIX]{x1D706}\mathop{\sum }_{\unicode[STIX]{x1D706}_{i}(u)>0}\unicode[STIX]{x1D706}_{i}(u).\end{eqnarray}$$
This motivates the following definitions which, in a sense, describe the class of all possible viscosity solutions to uniformly elliptic equations.
Definition 2.61 (class
${\mathcal{S}}$
).

Let the operator
 $F$
be uniformly elliptic in the sense of Definition 2.10 and let
 $f=-F(\cdot ,0,\mathbf{0},0)$
. We say that
 $u\in \text{}\underline{{\mathcal{S}}}(\unicode[STIX]{x1D706},\unicode[STIX]{x1D6EC},f)$
if
 $u\in C(\unicode[STIX]{x1D6FA})$
and the inequality
 $$\begin{eqnarray}f(x)\leq \unicode[STIX]{x1D6EC}\mathop{\sum }_{\unicode[STIX]{x1D706}_{i}(u)>0}\unicode[STIX]{x1D706}_{i}(u)+\unicode[STIX]{x1D706}\mathop{\sum }_{\unicode[STIX]{x1D706}_{i}(u)<0}\unicode[STIX]{x1D706}_{i}(u)\end{eqnarray}$$
holds in the viscosity sense. Similarly, we say that
 $u\in \overline{{\mathcal{S}}}(\unicode[STIX]{x1D706},\unicode[STIX]{x1D6EC},f)$
if
 $u\in C(\unicode[STIX]{x1D6FA})$
and
 $$\begin{eqnarray}f(x)\geq \unicode[STIX]{x1D6EC}\mathop{\sum }_{\unicode[STIX]{x1D706}_{i}(u)<0}\unicode[STIX]{x1D706}_{i}(u)+\unicode[STIX]{x1D706}\mathop{\sum }_{\unicode[STIX]{x1D706}_{i}(u)>0}\unicode[STIX]{x1D706}_{i}(u)\end{eqnarray}$$
in the viscosity sense. Finally
 ${\mathcal{S}}(\unicode[STIX]{x1D706},\unicode[STIX]{x1D6EC},f)=\text{}\underline{{\mathcal{S}}}(\unicode[STIX]{x1D706},\unicode[STIX]{x1D6EC},f)\cap \overline{{\mathcal{S}}}(\unicode[STIX]{x1D706},\unicode[STIX]{x1D6EC},f)$
.
With this notation at hand we present the Alexandrov–Bakelman–Pucci (ABP) estimate.
Theorem 2.62 (ABP estimate).
Let
 $u\in \overline{{\mathcal{S}}}(\unicode[STIX]{x1D706},\unicode[STIX]{x1D6EC},f)$
in
 $\unicode[STIX]{x1D6FA}$
with
 $u\geq 0$
on
 $\unicode[STIX]{x2202}\unicode[STIX]{x1D6FA}$
and assume that
 $f$
is continuous and bounded in
 $\unicode[STIX]{x1D6FA}$
. Then
 $$\begin{eqnarray}\sup _{\unicode[STIX]{x1D6FA}}u^{-}\leq Cr\biggl(\int _{{\mathcal{C}}^{-}(u)}(f^{+})^{d}\biggr)^{1/d},\end{eqnarray}$$
where the constant
 $C$
depends only on
 $d$
,
 $\unicode[STIX]{x1D706}$
and
 $\unicode[STIX]{x1D6EC}$
, and
 $r$
is such that
 $\unicode[STIX]{x1D6FA}\subset B_{r/2}$
, and we have extended
 $u$
by zero outside
 $\unicode[STIX]{x1D6FA}$
.
Note that, as in the Alexandrov estimate, only the contact set
 ${\mathcal{C}}^{-}(u)$
is relevant in this estimate. Note also that we obtain control of the
 $L^{\infty }$
-norm of
 $u$
in terms of the
 $L^{d}$
-norm of the data
 $f$
. While Theorem 2.62 is a sort of stability estimate, it is also useful in establishing regularity of solutions. To do so, we begin with the Harnack inequality of Krylov and Safonov; see Safonov (Reference Safonov1980). In what follows, we let
 $Q_{l}$
denote a cube with sides parallel to the coordinate axes and of length
 $l$
.
Theorem 2.63 (Harnack inequality).
Let
 $u\in {\mathcal{S}}(\unicode[STIX]{x1D706},\unicode[STIX]{x1D6EC},f)$
in
 $Q_{1}$
with
 $f\in C(Q_{1})\cap L^{\infty }(Q_{1})$
. If
 $u\geq 0$
in
 $Q_{1}$
, then
 $$\begin{eqnarray}\sup _{Q_{1/2}}u\leq C\Bigl(\inf _{Q_{1}}u+\Vert f\Vert _{L^{d}(Q_{1})}\Bigr),\end{eqnarray}$$
where the constant
 $C$
depends only on
 $d$
,
 $\unicode[STIX]{x1D706}$
and
 $\unicode[STIX]{x1D6EC}$
.
Since this will be useful later on, let us now show how one can obtain interior Hölder continuity of functions in
 ${\mathcal{S}}(\unicode[STIX]{x1D706},\unicode[STIX]{x1D6EC},f)$
from a Harnack inequality. We begin with a technical result, commonly referred to as an iteration lemma; see Han and Lin (Reference Han and Lin2011, Lemma 3.4) and Gilbarg and Trudinger (Reference Gilbarg and Trudinger2001, Lemma 8.23).
Lemma 2.64 (iteration).
Let
 $\unicode[STIX]{x1D711}:(0,R]\rightarrow \mathbb{R}$
be non-decreasing. Assume that for some
 $A>0$
,
 $B\geq 0$
and
 $\unicode[STIX]{x1D6FC}>\unicode[STIX]{x1D6FD}$
we have
 $$\begin{eqnarray}\unicode[STIX]{x1D711}(\unicode[STIX]{x1D70C})\leq A\biggl[\biggl(\displaystyle \frac{\unicode[STIX]{x1D70C}}{r}\biggr)^{\unicode[STIX]{x1D6FC}}+\unicode[STIX]{x1D700}\biggr]\unicode[STIX]{x1D711}(r)+Br^{\unicode[STIX]{x1D6FD}}\end{eqnarray}$$
whenever
 $0<\unicode[STIX]{x1D70C}\leq r\leq R$
. Then, for every
 $\unicode[STIX]{x1D6FE}\in (\unicode[STIX]{x1D6FD},\unicode[STIX]{x1D6FC})$
there exists
 $\unicode[STIX]{x1D700}_{0}$
such that if
 $\unicode[STIX]{x1D700}<\unicode[STIX]{x1D700}_{0}$
then
 $$\begin{eqnarray}\unicode[STIX]{x1D711}(r)\leq C\biggl[\displaystyle \frac{\unicode[STIX]{x1D711}(R_{0})}{R_{0}}r^{\unicode[STIX]{x1D6FE}}+Br^{\unicode[STIX]{x1D6FD}}\biggr],\quad \text{for all}~r\in [0,R_{0}),\end{eqnarray}$$
for some fixed constant
 $C$
.
With this result at hand we obtain local Hölder continuity.
Theorem 2.65 (local Hölder regularity).
Let
 $u\in {\mathcal{S}}(\unicode[STIX]{x1D706},\unicode[STIX]{x1D6EC},f)$
in
 $Q_{1}$
. Then there exists
 $\unicode[STIX]{x1D6FC}\in (0,1)$
for which
 $u\in C^{\unicode[STIX]{x1D6FC}}(\bar{Q}_{1/2})$
and
 $$\begin{eqnarray}\Vert u\Vert _{C^{\unicode[STIX]{x1D6FC}}(\bar{Q}_{1/2})}\leq C(\Vert u\Vert _{L^{\infty }(Q_{1})}+\Vert f\Vert _{L^{d}(Q_{1})}),\end{eqnarray}$$
where the constant
 $C$
is independent of
 $u$
and
 $f$
.
Proof. The proof is rather standard, so we merely sketch it. Let
 $m_{r}=\inf _{Q_{r}}u$
,
 $M_{r}=\sup _{Q_{r}}u$
and
 $\unicode[STIX]{x1D71B}_{r}=M_{r}-m_{r}$
. Applying the Harnack inequality of Theorem 2.63 to the non-negative function
 $u-m_{1}$
yields
 $$\begin{eqnarray}M_{1/2}-m_{1}\leq C(m_{1/2}-m_{1}+\Vert f\Vert _{L^{d}(Q_{1})}).\end{eqnarray}$$
Since the function
 $M_{1}-u\geq 0$
, we can once more apply the Harnack inequality to obtain
 $$\begin{eqnarray}M_{1}-m_{1/2}\leq C(M_{1}-M_{1/2}+\Vert f\Vert _{L^{d}(Q_{1})}).\end{eqnarray}$$
Adding these two inequalities yields
 $$\begin{eqnarray}\unicode[STIX]{x1D71B}_{1/2}\leq \unicode[STIX]{x1D707}\unicode[STIX]{x1D71B}_{1}+2\Vert f\Vert _{L^{d}(Q_{1})},\end{eqnarray}$$
where
 $\unicode[STIX]{x1D707}=(C-1)/(C+1)\in (0,1)$
.
A similar argument for the functions
 $u_{r}(y)=u(ry)/r^{2}$
and
 $f_{r}(y)=f(ry)$
with
 $y\in Q_{1}$
reveals that
 $$\begin{eqnarray}\unicode[STIX]{x1D71B}_{r}\leq \unicode[STIX]{x1D707}\unicode[STIX]{x1D71B}_{r/2}+2r\Vert f\Vert _{L^{d}(Q_{1})}.\end{eqnarray}$$
An application of the iteration Lemma 2.64 with
 $\unicode[STIX]{x1D711}(r)=\unicode[STIX]{x1D71B}_{r}$
immediately yields Hölder continuity and the estimate.
In a similar fashion, we can establish smoothness up to the boundary; see Caffarelli and Cabré (Reference Caffarelli and Cabré1995, Proposition 4.14).
Theorem 2.66 (global regularity).
Let
 $\unicode[STIX]{x1D6FA}$
be sufficiently smooth and
 $u\in {\mathcal{S}}(\unicode[STIX]{x1D706},\unicode[STIX]{x1D6EC},f)\cap C(\bar{\unicode[STIX]{x1D6FA}})$
with
 $f\in C(\unicode[STIX]{x1D6FA})$
. Let
 $g=u_{|\unicode[STIX]{x2202}\unicode[STIX]{x1D6FA}}$
and
 $\unicode[STIX]{x1D71A}$
be a modulus of continuity of
 $g$
. Then there is a modulus of continuity
 $\unicode[STIX]{x1D71A}^{\ast }$
of
 $u$
in
 $\bar{\unicode[STIX]{x1D6FA}}$
which depends only on
 $\unicode[STIX]{x1D706},\unicode[STIX]{x1D6EC},\unicode[STIX]{x1D71A},\Vert f\Vert _{L^{d}(\unicode[STIX]{x1D6FA})}$
and
 $\Vert g\Vert _{L^{\infty }(\unicode[STIX]{x1D6FA})}$
.
We now focus on Hölder estimates for first and second derivatives. To simplify the presentation, in problem (2.6), the PDE takes the form
 $$\begin{eqnarray}F(x,D^{2}u)=f\quad \text{in }\unicode[STIX]{x1D6FA}.\end{eqnarray}$$
To quantify the smoothness of
 $F$
with respect to the
 $x$
variable, we introduce the function
 $$\begin{eqnarray}\unicode[STIX]{x1D6FD}(x)=\sup _{M\in \mathbb{S}^{d}}\displaystyle \frac{|F(M,x)-F(M,0)|}{|M|+1}.\end{eqnarray}$$
The local regularity is as follows.
Theorem 2.67 (local
$C^{2,\unicode[STIX]{x1D6FC}}$
-regularity).

Assume that
 $F$
is uniformly elliptic in the sense of Definition 2.10,
 $\unicode[STIX]{x1D6FD},f\in C^{\unicode[STIX]{x1D6FC}}(B_{1})$
and that there is a constant
 $\bar{\unicode[STIX]{x1D6FC}}\in (0,1)$
such that for any
 $M\in \mathbb{S}^{d}$
with
 $F(0,M)=0$
and
 $w_{0}\in C(\unicode[STIX]{x2202}B_{1})$
there exists
 $w\in C^{2}(B_{1})\cap C(\bar{B}_{1})\cap C^{2,\bar{\unicode[STIX]{x1D6FC}}}(B_{1/2})$
which satisfies
 $$\begin{eqnarray}F(0,D^{2}w+M)=0\quad \text{in }B_{1},\quad w=w_{0}\quad \text{on }\unicode[STIX]{x2202}B_{1},\end{eqnarray}$$
with an a priori estimate. If
 $u$
is a viscosity solution of (2.21) then
 $u\in C^{2,\unicode[STIX]{x1D6FC}}(\bar{B}_{1/2})$
for some
 $\unicode[STIX]{x1D6FC}\in (0,1)$
with an a priori estimate.
To apply this theorem, one must verify that solutions to (2.22) have
 $C^{2,\bar{\unicode[STIX]{x1D6FC}}}$
-estimates. For an
 $F$
that is convex, the Evans–Krylov theorem Caffarelli and Silvestre (Reference Caffarelli and Silvestre2010a
) provides such an estimate.
Theorem 2.68 (Evans–Krylov).
Let
 $F$
be convex and depend only on
 $M$
. If
 $u$
is a viscosity solution of
 $F(D^{2}u)=0$
in
 $B_{1}$
, then
 $$\begin{eqnarray}\Vert u\Vert _{C^{2,\bar{\unicode[STIX]{x1D6FC}}}(\bar{B}_{1/2})}\leq C(\Vert u\Vert _{L^{\infty }(B_{1})}+|F(0)|),\end{eqnarray}$$
for some constants
 $\bar{\unicode[STIX]{x1D6FC}}\in (0,1)$
and
 $C$
that depend only on the dimension
 $d$
and the ellipticity of
 $F$
.
We mention that Theorem 2.67 can be applied to the Hamilton–Jacobi–Bellman operators of Example 2.12. With the aid of the so-called method of continuity, this allows us to show that solutions to the Dirichlet problem (2.6) for this class of operators are classical.
On the other hand, it is natural to ask if the convexity of
 $F$
is essential for this result. To understand this, we begin by providing a
 $C^{1,\unicode[STIX]{x1D6FC}}$
-estimate without convexity assumptions.
Theorem 2.69 (
$C^{1,\unicode[STIX]{x1D6FC}}$
-regularity).

Let
 $u$
be a viscosity solution of
 $$\begin{eqnarray}F(D^{2}u)=0\quad \text{in }B_{1}.\end{eqnarray}$$
Then
 $$\begin{eqnarray}\Vert u\Vert _{C^{1,\bar{\unicode[STIX]{x1D6FC}}}(\bar{B}_{1/2})}\leq C(\Vert u\Vert _{L^{\infty }(B_{1})}+|F(0)|),\end{eqnarray}$$
where the constants
 $\bar{\unicode[STIX]{x1D6FC}}\in (0,1)$
and
 $C$
depend only on the dimension and ellipticity of
 $F$
.
A similar argument to Theorem 2.67 then allows us to conclude that, in this setting and under similar assumptions, solutions to (2.6) are locally
 $C^{1,\unicode[STIX]{x1D6FC}}$
with an a priori estimate. However, there exists a series of counterexamples Nadirashvili and Vlăduţ (Reference Nadirashvili and Vlăduţ2007), Nadirashvili and Vlăduţ (Reference Nadirashvili and Vlăduţ2008), Nadirashvili, Tkachev and Vlăduţ (Reference Nadirashvili, Tkachev and Vlăduţ2012) showing that, in general, the convexity assumption on
 $F$
cannot be removed.
Example 2.70 (non-classical viscosity solution).
Let
 $d=5$
. Define
 $$\begin{eqnarray}P_{5}(x)=x_{1}^{3}+\displaystyle \frac{3}{2}x_{1}(x_{3}^{2}+x_{4}^{2}-2x_{5}^{2}-2x_{2}^{2})+\displaystyle \frac{3\sqrt{3}}{2}(x_{2}x_{3}^{2}-x_{2}x_{4}^{2}+2x_{3}x_{4}x_{5}),\end{eqnarray}$$
and, for
 $\unicode[STIX]{x1D6FF}\in [0,1)$
,
 $$\begin{eqnarray}w(x)=P_{5}(x)/|x|^{1+\unicode[STIX]{x1D6FF}}\in C^{1,1-\unicode[STIX]{x1D6FF}}(\bar{B}_{1})\setminus C^{2}(B_{1}).\end{eqnarray}$$
There exists an Isaacs operator
 $F$
that depends only on
 $M$
and is Lipschitz, such that
 $w$
is a viscosity solution of
 $$\begin{eqnarray}F(D^{2}w)=0\quad \text{in }B_{1},\quad w=P_{5}\quad \text{on }\unicode[STIX]{x2202}B_{1}.\end{eqnarray}$$
The existence of non-classical solutions in dimensions
 $3\leq d<5$
is an open problem.
We conclude by providing global regularity results in the general case; see Caffarelli and Souganidis (Reference Caffarelli and Souganidis2008), Caffarelli and Silvestre (Reference Caffarelli and Silvestre2010b ) and Turanova (Reference Turanova2015).
Theorem 2.71 (global regularity).
Let
 $\unicode[STIX]{x1D6FA}$
be sufficiently regular and let
 $u$
be a viscosity solution to (2.6) with
 $F$
of the form (2.21) being Lipschitz and uniformly elliptic. If
 $f\in C^{0,1}(\unicode[STIX]{x1D6FA})$
and, for some
 $\unicode[STIX]{x1D6FE}\in (0,1]$
,
 $g\in C^{1,\unicode[STIX]{x1D6FE}}(\unicode[STIX]{x2202}\unicode[STIX]{x1D6FA})$
, then
 $u\in C^{1,\unicode[STIX]{x1D6FC}}(\unicode[STIX]{x1D6FA})\cap C^{0,1}(\bar{\unicode[STIX]{x1D6FA}})$
with
 $$\begin{eqnarray}\Vert u\Vert _{C^{1,\unicode[STIX]{x1D6FC}}(\unicode[STIX]{x1D6FA})}\leq C(\Vert f\Vert _{L^{\infty }(\unicode[STIX]{x1D6FA})}+\Vert g\Vert _{C^{1,\unicode[STIX]{x1D6FE}}(\unicode[STIX]{x2202}\unicode[STIX]{x1D6FA})}),\end{eqnarray}$$
where
 $\unicode[STIX]{x1D6FC}\in (0,1)$
and
 $C$
depend only on
 $d$
,
 $\unicode[STIX]{x1D706}$
,
 $\unicode[STIX]{x1D6EC}$
and the smoothness of
 $F$
.
3 Monotonicity in numerical methods
In this section we review some basic properties of numerical methods and state sufficient conditions to ensure that discrete approximations converge to the solutions of the underlying PDE. The underlying theme of this section is that as the notion of solution to the PDE becomes weaker, additional conditions of the numerical approximation are required to guarantee convergence. For example, for linear differential equations, the well-known Lax–Richtmyer equivalence theorem shows that any consistent scheme is convergent if and only if it is stable; these results extend to mildly nonlinear problems as well. However, in the fully nonlinear regime, consistency and stability are no longer sufficient in general. Rather, additional monotonicity conditions are required, that essentially mimic the comparison principles discussed in the previous section.
We note that while the content of this section deals with finite difference and finite element methods, the main ideas extend to other discretization techniques as well.
3.1 Stability, consistency and monotonicity implies convergence
As before, let
 $\unicode[STIX]{x1D6FA}$
be an open subset of
 $\mathbb{R}^{d}$
with Lipschitz boundary
 $\unicode[STIX]{x2202}\unicode[STIX]{x1D6FA}$
. We consider numerical approximations of elliptic problems of the most general form (2.20), which we recall for convenience:
 $$\begin{eqnarray}F(x,u,Du,D^{2}u)=0\quad \text{in }\unicode[STIX]{x1D6FA},\quad B(x,u,Du)=0\quad \text{on }\unicode[STIX]{x2202}\unicode[STIX]{x1D6FA}.\end{eqnarray}$$
Here
 $F\in C(\unicode[STIX]{x1D6FA}\times \mathbb{R}\times \mathbb{R}^{d}\times \mathbb{S}^{d})$
is locally bounded and elliptic in the sense of Definition 2.10.
We further assume that
 $B\in C(\unicode[STIX]{x1D6FA}\times \mathbb{R}\times \mathbb{R}^{d})$
is non-increasing in its second argument. For the moment, we consider viscosity solutions that satisfy the boundary conditions only in a viscosity sense; see Definition 2.53. In this case, and to simplify the presentation, we define the operator
 $$\begin{eqnarray}\mathsf{F}(x,r,\mathbf{p},M)=\left\{\begin{array}{@{}ll@{}}F(x,r,\mathbf{p},M)\quad & \text{if }x\in \unicode[STIX]{x1D6FA},\\ B(x,r,\boldsymbol{ p})\quad & \text{if }x\in \unicode[STIX]{x2202}\unicode[STIX]{x1D6FA},\end{array}\right.\end{eqnarray}$$
so that (3.1) becomes
 $$\begin{eqnarray}\mathsf{F}[u]:=\mathsf{F}(x,u,Du,D^{2}u)=0\quad \text{in }\bar{\unicode[STIX]{x1D6FA}}.\end{eqnarray}$$
Note that, since
 $B$
is non-increasing in its second argument and
 $F$
is elliptic, the operator
 $\mathsf{F}$
is elliptic in the sense of Definition 2.10. We further see that, according to Definition 2.53,
 $u\in C(\bar{\unicode[STIX]{x1D6FA}})$
is a viscosity solution to (3.1) (equivalently (3.2)) if it is a viscosity solution to
 $$\begin{eqnarray}F(x,u,Du,D^{2}u)=0\quad \text{in }\unicode[STIX]{x1D6FA},\end{eqnarray}$$
and
 $$\begin{eqnarray}\displaystyle \max \{F(x,u,Du,D^{2}u),B(x,u,Du)\} & \geq & \displaystyle 0\quad \text{on }\unicode[STIX]{x2202}\unicode[STIX]{x1D6FA},\nonumber\\ \displaystyle \min \{F(x,u,Du,D^{2}u),B(x,u,Du)\} & \leq & \displaystyle 0\quad \text{on }\unicode[STIX]{x2202}\unicode[STIX]{x1D6FA}\nonumber\end{eqnarray}$$
in the viscosity sense.
We now consider approximation schemes. Find
 $u_{h}\in X_{h}$
satisfying
 $$\begin{eqnarray}\mathsf{F}_{h}[u_{h}](z)=0\quad \text{in }\bar{\unicode[STIX]{x1D6FA}}_{h},\end{eqnarray}$$
where
 $\mathsf{F}_{h}$
is a locally bounded operator which we may think of as an approximation to
 $\mathsf{F}$
, and
 $X_{h}$
is some finite-dimensional space. The operator is parametrized by
 $h>0$
, which we may view as a discretization parameter, or in some cases, a regularization parameter. The discrete domain
 $\overline{\unicode[STIX]{x1D6FA}}_{h}$
is an approximation to
 $\overline{\unicode[STIX]{x1D6FA}}$
with the property
 $\lim _{h\rightarrow 0^{+}}\bar{\unicode[STIX]{x1D6FA}}_{h}=\bar{\unicode[STIX]{x1D6FA}}$
; namely, for all
 $z_{0}\in \bar{\unicode[STIX]{x1D6FA}}$
, there exists a sequence
 $\{z_{h}\}_{h>0}\subset \bar{\unicode[STIX]{x1D6FA}}_{h}$
such that
 $\lim _{h\rightarrow 0^{+}}z_{h}=z_{0}$
.
We now address the well-posedness of (3.3), and the sufficient structure conditions on
 $\mathsf{F}_{h}$
to ensure that the discrete solutions to (3.3) (if they exist) converge. As a first step we state the fundamental notions of consistency and stability.
Definition 3.1 (consistency).
The discrete problem (3.3) is said to be consistent with (3.2) if there exists an operator
 $I_{h}:C(\bar{\unicode[STIX]{x1D6FA}})\rightarrow X_{h}$
such that
 $I_{h}$
converges uniformly to the identity operator as
 $h\rightarrow 0^{+}$
, and for all sequences
 $\{z_{h}\}_{h>0}$
with
 $z_{h}\in \bar{\unicode[STIX]{x1D6FA}}_{h}$
and
 $z_{h}\rightarrow z_{0}\in \bar{\unicode[STIX]{x1D6FA}}$
and
 $\unicode[STIX]{x1D719}\in C^{2}(\bar{\unicode[STIX]{x1D6FA}})$
,
 $$\begin{eqnarray}\lim _{h\rightarrow 0^{+}}\mathsf{F}_{h}[I_{h}\unicode[STIX]{x1D719}](z_{h})=\mathsf{F}[\unicode[STIX]{x1D719}](z_{0}).\end{eqnarray}$$
Remark 3.2 (envelopes).
If the operators are not continuous, then the notion of consistency is changed to
 $$\begin{eqnarray}\displaystyle \limsup _{h\rightarrow 0^{+}}\mathsf{F}_{h}[I_{h}\unicode[STIX]{x1D719}](z_{h}) & \leq & \displaystyle \mathsf{F}^{\ast }[\unicode[STIX]{x1D719}](z_{0}),\nonumber\\ \displaystyle \liminf _{h\rightarrow 0^{+}}\mathsf{F}_{h}[I_{h}\unicode[STIX]{x1D719}](z_{h}) & \geq & \displaystyle \mathsf{F}_{\ast }[\unicode[STIX]{x1D719}](z_{0}),\nonumber\end{eqnarray}$$
where
 $\mathsf{F}^{\ast }$
(resp.
 $\mathsf{F}_{\ast }$
) denote the upper (resp. lower) semi-continuous envelope of
 $\mathsf{F}$
; see Definition 2.47.
Definition 3.3 (stability).
We say that problem (3.3) is stable if, for all
 $h>0$
, there exists a solution
 $u_{h}\in X_{h}$
to (3.3), and moreover, if
 $w_{h}\in X_{h}$
satisfies
 $\mathsf{F}_{h}[w_{h}]=\unicode[STIX]{x1D716}_{h}$
, then
 $\Vert u_{h}-w_{h}\Vert _{L^{\infty }(\bar{\unicode[STIX]{x1D6FA}}_{h})}\leq C\Vert \unicode[STIX]{x1D716}_{h}\Vert _{L^{\infty }(\bar{\unicode[STIX]{x1D6FA}}_{h})}$
, with
 $C>0$
independent of
 $h$
.
The following theorem states the well-known result that, for linear problems with classical solutions, consistent and stable schemes converge.
Theorem 3.4 (Lax–Richtmyer).
Suppose that
 $\mathsf{F}_{h}$
is an affine operator, and that there exists a classical solution
 $u\in C^{2}(\bar{\unicode[STIX]{x1D6FA}})$
satisfying (3.2). Suppose further that problem (3.3) is stable and that the operator in Definition 3.1 satisfies the stronger condition
 $\lim _{h\rightarrow 0^{+}}\Vert \mathsf{F}_{h}[I_{h}u]\Vert _{L^{\infty }(\bar{\unicode[STIX]{x1D6FA}}_{h})}=0$
. Then
 $u_{h}$
converges locally uniformly to
 $u$
.
Proof. By the given assumptions, there exists a linear operator
 $\mathsf{G}_{h}$
and a function
 $\mathsf{l}_{h}$
such that
 $$\begin{eqnarray}\mathsf{F}_{h}[v_{h}](z)=\mathsf{G}_{h}[v_{h}](z)-\mathsf{l}_{h}(z)\quad z\in \bar{\unicode[STIX]{x1D6FA}}_{h}.\end{eqnarray}$$
The stability of the scheme shows that
 $\mathsf{G}_{h}[\cdot ]$
is an isomorphism whose inverse is bounded independent of
 $h$
. Since
 $$\begin{eqnarray}\mathsf{G}_{h}[u_{h}-I_{h}u]=\mathsf{l}_{h}-\mathsf{G}_{h}[I_{h}u]=-\mathsf{F}_{h}[I_{h}u],\end{eqnarray}$$
the consistency of the scheme implies that
 $\lim _{h\rightarrow 0^{+}}\Vert u_{h}-I_{h}u\Vert _{L^{\infty }(\bar{\unicode[STIX]{x1D6FA}}_{h})}=0$
, and thus, since
 $I_{h}$
converges to the identity operator,
 $u_{h}$
converges locally uniformly to
 $u$
.
While Theorem 3.4 is a useful result for a large class of problems, it is not applicable to fully nonlinear problems nor to weaker notions of solutions, in particular, viscosity solutions. The issue is that, if
 $u$
is not a classical solution, then the approximation
 $I_{h}u$
may not be well-defined, and the consistency
 $\mathsf{F}_{h}[I_{h}u]\rightarrow 0$
used in the proof of Theorem 3.4 is no longer valid. Rather, to prove convergence to viscosity solutions, an additional structure condition is required. This requirement is summarized in the following definition.
Definition 3.5 (monotone operator).
The discrete operator
 $\mathsf{F}_{h}$
is said to be monotone if, whenever
 $u_{h}-v_{h}$
has a global non-negative maximum at
 $z\in \bar{\unicode[STIX]{x1D6FA}}_{h}$
, we have
 $$\begin{eqnarray}\mathsf{F}_{h}[u_{h}](z)\leq \mathsf{F}_{h}[v_{h}](z).\end{eqnarray}$$
Remark 3.6 (monotonicity).
The notion of monotonicity is essentially a discrete version of ellipticity. Indeed, following the proof of Theorem 2.16, if
 $F$
is an elliptic operator in the sense of Definition 2.10, and if
 $u-v$
, with
 $u,v\in C^{2}(\bar{\unicode[STIX]{x1D6FA}})$
, has a global non-negative maximum at
 $x\in \bar{\unicode[STIX]{x1D6FA}}$
, then
 $u(x)\geq v(x)$
,
 $Du(x)=Dv(x)$
and
 $D^{2}u(x)\leq D^{2}v(x)$
. Since
 $\mathsf{F}$
is non-increasing in its second argument, and non-decreasing in its fourth, we have
 $$\begin{eqnarray}\mathsf{F}[u](x)=\mathsf{F}(x,u(x),Du(x),D^{2}u(x))\leq \mathsf{F}(x,v(x),Dv(x),D^{2}v(x))=\mathsf{F}[v](x).\end{eqnarray}$$
Conversely, it can be shown that the operator
 $\mathsf{F}$
is elliptic if, whenever
 $u-v$
has a global non-negative maximum at
 $x\in \bar{\unicode[STIX]{x1D6FA}}$
, then
 $\mathsf{F}[u](x)\leq \mathsf{F}[v](x)$
.
Consistency, stability and monotonicity are the three sufficient ingredients to guarantee convergence to viscosity solutions. The following result closely follows Barles and Souganidis (Reference Barles and Souganidis1991, Theorem 2.1).
Theorem 3.7 (Barles–Souganidis).
Suppose that problem (3.3) is consistent, stable and monotone in the sense of Definitions 3.1, 3.3 and 3.5, respectively. Suppose further that
 $\mathsf{F}$
satisfies the comparison principle given in Definition 2.49. Then
 $u_{h}$
converges locally uniformly to the unique continuous viscosity solution of (3.2).
Proof. Define
 $\bar{u}\in \mathit{USC}(\unicode[STIX]{x1D6FA})$
and
 $\text{}\underline{u}\in \mathit{LSC}(\unicode[STIX]{x1D6FA})$
by
 $$\begin{eqnarray}\bar{u}(x):=\limsup _{\substack{ y\rightarrow x \\ h\rightarrow 0^{+}}}u_{h}(y),\quad \text{}\underline{u}(x):=\liminf _{\substack{ y\rightarrow x \\ h\rightarrow 0^{+}}}u_{h}(y),\quad x\in \bar{\unicode[STIX]{x1D6FA}}.\end{eqnarray}$$
Note that the stability of the scheme implies that both
 $\bar{u}$
and
 $\text{}\underline{u}$
are well-defined. The proof proceeds by showing that
 $\bar{u}$
and
 $\text{}\underline{u}$
are (viscosity) subsolutions and supersolutions to (3.2), respectively, and then appealing to the comparison principle.
To this end, suppose that
 $z_{0}\in \unicode[STIX]{x1D6FA}$
is a strict local maximum of
 $\text{}\underline{u}-\unicode[STIX]{x1D719}$
for some
 $\unicode[STIX]{x1D719}\in C^{2}(\unicode[STIX]{x1D6FA})$
. Then standard arguments show that there exist sequences
 $\{h_{n}\}_{n=1}^{\infty }$
and
 $\{z_{h_{n}}\}_{n=1}^{\infty }$
such that
 $$\begin{eqnarray}h_{n}\rightarrow 0,\quad z_{h_{n}}\rightarrow x_{0},\quad \text{as }n\rightarrow \infty ,\end{eqnarray}$$
and
 $u_{h_{n}}-I_{h_{n}}\unicode[STIX]{x1D719}$
obtains a strict local maximum at
 $z_{h_{n}}$
. Since
 $\mathsf{F}_{h_{n}}[u_{h_{n}}](z_{h_{n}})=0$
, the monotonicity of the discrete operator implies that
 $$\begin{eqnarray}\mathsf{F}_{h_{n}}[I_{h_{n}}\unicode[STIX]{x1D719}](z_{h_{n}})\geq 0.\end{eqnarray}$$
Passing to the limit, together with consistency of the scheme, yields
 $$\begin{eqnarray}0\leq \lim _{n\rightarrow \infty }\mathsf{F}_{h_{n}}[I_{h_{n}}\unicode[STIX]{x1D719}](z_{h_{n}})=\mathsf{F}[\unicode[STIX]{x1D719}](z_{0}).\end{eqnarray}$$
Similar arguments show that if
 $\bar{u}-\unicode[STIX]{x1D719}$
obtains a strict minimum at
 $z_{0}\in \unicode[STIX]{x1D6FA}$
, then
 $0\geq \mathsf{F}[\unicode[STIX]{x1D719}](z_{0})$
. Thus,
 $\bar{u}$
and
 $\text{}\underline{u}$
are subsolutions and supersolutions to (3.2), respectively. Since
 $\text{}\underline{u}\leq \bar{u}$
, the comparison principle of
 $\mathsf{F}$
implies that
 $\text{}\underline{u}=\bar{u}=u$
, and
 $u$
is the viscosity solution to (3.2).
We once again mention that the problems and discretizations considered so far take into account the boundary conditions in a viscosity sense. While this set-up simplifies the proof of convergence, it may have practical limitations since the framework requires a consistent and monotone discretization of both the boundary conditions and the differential operator for all
 $x\in \unicode[STIX]{x2202}\unicode[STIX]{x1D6FA}$
and smooth functions
 $\unicode[STIX]{x1D719}$
. Also recall that, in general, viscosity boundary conditions are not equivalent to those imposed pointwise unless other conditions are assumed; see Proposition 2.55. Here we turn our attention to the elliptic boundary value problem (2.6), where the Dirichlet boundary condition is understood in the classical sense; see Definition 2.48.
To this end, we consider approximations of the form
 $$\begin{eqnarray}F_{h}[u_{h}]=0\quad \text{in }\unicode[STIX]{x1D6FA}_{h}^{I},\quad u_{h}=g_{h}\quad \text{on }\unicode[STIX]{x1D6FA}_{h}^{B},\end{eqnarray}$$
where
 $g_{h}=I_{h}g\in X_{h}$
is a discrete approximation to the Dirichlet data
 $g\in C(\bar{\unicode[STIX]{x1D6FA}})$
, and
 $\unicode[STIX]{x1D6FA}_{h}^{I}$
and
 $\unicode[STIX]{x1D6FA}_{h}^{B}$
are disjoint sets with
 $\unicode[STIX]{x1D6FA}_{h}^{I}\rightarrow \unicode[STIX]{x1D6FA}$
and
 $\unicode[STIX]{x1D6FA}_{h}^{B}\rightarrow \unicode[STIX]{x2202}\unicode[STIX]{x1D6FA}$
as
 $h\rightarrow 0^{+}$
. Note that with minor notational changes, the notions of consistency, stability, and monotonicity are applicable to the operator
 $F_{h}$
. A natural question is whether the results of Theorem 3.7 carry over to the discrete problem (3.6). This issue is addressed in the next theorem.
Theorem 3.8 (convergence).
Suppose that
 $F_{h}$
is a consistent, stable and monotone operator. Suppose further that either
-
(i)
$\text{}\underline{u}(x)\geq g(x)$
and
$\bar{u}(x)\leq g(x)$
for all
$x\in \unicode[STIX]{x2202}\unicode[STIX]{x1D6FA}$
, where
$\text{}\underline{u},\bar{u}$
are given by (3.5), or -
(ii) the sequence of solutions
$\{u_{h}\}_{h>0}$
is equicontinuous.


Then
 $u_{h}$
converges locally uniformly to the unique continuous viscosity solution of (3.1) with
 $B(x,u,Du)=g-u$
.
3.2 Monotonicity in finite difference schemes
Here we discuss basic monotonicity results of finite difference schemes. The main message given in this section is that for any uniformly elliptic operator, one can construct a consistent and monotone finite difference scheme. The drawback, however, is that monotonicity requires a wide stencil, which may severely impact its practical use. Much of the material in this section is found in Kuo and Trudinger (Reference Kuo and Trudinger1990, Reference Kuo and Trudinger1992), Kocan (Reference Kocan1995), Motzkin and Wasow (Reference Motzkin and Wasow1953) and Oberman (Reference Oberman2006).
For simplicity we assume that the domain
 $\unicode[STIX]{x1D6FA}$
is discretized on an equally spaced Cartesian grid and that each coordinate direction is discretized uniformly; in particular, by a possible change of coordinates, we assume that the grid is given by
 $$\begin{eqnarray}\bar{\unicode[STIX]{x1D6FA}}_{h}=\mathbb{Z}_{h}^{d}\cap \overline{\unicode[STIX]{x1D6FA}},\quad \text{with }\mathbb{Z}_{h}^{d}:=\{he:e\in \mathbb{Z}^{d}\},\end{eqnarray}$$
where
 $h>0$
is the grid scale and
 $\mathbb{Z}^{d}$
is the set of
 $d$
-tuples of integers. A finite subset
 $S\subset \mathbb{Z}^{d}\backslash \{0\}$
is called a stencil, and the space of nodal functions, denoted by
 $X_{h}^{fd}$
, consists of real-valued functions with domain
 $\bar{\unicode[STIX]{x1D6FA}}_{h}$
. The canonical interpolant
 $I_{h}^{fd}:C^{0}(\bar{\unicode[STIX]{x1D6FA}})\rightarrow X_{h}^{fd}$
is the operator satisfying
 $I_{h}^{fd}v(z)=v(z)$
for all
 $z\in \bar{\unicode[STIX]{x1D6FA}}_{h}$
. We assume the existence of a positive integer
 $m$
such that
 $S$
is of the form
 $$\begin{eqnarray}S=\{y:y\in \mathbb{Z}^{d}\backslash \{0\}:|y|_{\ell ^{\infty }}\leq m\}.\end{eqnarray}$$
The value
 $m$
satisfying (3.7) is called the stencil size of
 $S$
. The cardinality of
 $S$
is
 $|S|:=(2m+1)^{d}-1$
.
We consider finite difference schemes with stencil
 $S$
acting on grid functions. These discrete operators are thus of the (implicit) form
 $$\begin{eqnarray}F_{h}[v_{h}](z)=F_{h}(z,v_{h}(z),Tv_{h}(z)),\end{eqnarray}$$
where
 $Tv_{h}(x)=\{v_{h}(x+hy):y\in S\}$
is the set of translates of
 $v_{h}(x)$
with respect to the stencil. The method (3.8) is called a one-step scheme if
 $m=1$
, that is, the value
 $F_{h}[v_{h}](z)$
depends only on
 $z$
,
 $v_{h}(z)$
, and the values of
 $v_{h}$
at neighbouring points of
 $z$
. Otherwise, we call the scheme a wide-stencil scheme if
 $m\geq 2$
.
To construct monotone schemes, we first reformulate this property so that it is easier to work with.
Definition 3.9 (non-negative operator).
The operator
 $F_{h}$
is of non-negative type (or simply non-negative) if
 $$\begin{eqnarray}F_{h}(z,r,q+\unicode[STIX]{x1D70F})\geq F_{h}(z,r,q)\geq F_{h}(z,r+t,q+\unicode[STIX]{x1D70F}),\end{eqnarray}$$
for all
 $z\in \mathbb{R}^{d}$
,
 $r,t\in \mathbb{R}$
, and
 $q,\unicode[STIX]{x1D70F}\in \mathbb{R}^{|S|}$
satisfying
 $$\begin{eqnarray}0\leq \unicode[STIX]{x1D70F}_{i}\leq t\quad i=1,2,\ldots ,|S|.\end{eqnarray}$$
We see that if
 $F_{h}$
is of non-negative type, then
 $F_{h}$
is non-increasing in its second argument and non-decreasing in its third argument. If
 $F_{h}$
is differentiable, then it is of non-negative type provided that
 $$\begin{eqnarray}\displaystyle \frac{\unicode[STIX]{x2202}F_{h}}{\unicode[STIX]{x2202}q_{i}}\geq 0~(i=1,2,\ldots ,|S|),\quad \displaystyle \frac{\unicode[STIX]{x2202}F_{h}}{\unicode[STIX]{x2202}r}+\mathop{\sum }_{i=1}^{|S|}\displaystyle \frac{\unicode[STIX]{x2202}F_{h}}{\unicode[STIX]{x2202}q_{i}}\leq 0.\end{eqnarray}$$
Remark 3.10 (reformulation).
Alternatively, as in Oberman (Reference Oberman2006), one can consider finite difference schemes of the form
 $$\begin{eqnarray}F_{h}[u](z)=G_{h}(z,u(z),u(z)-Tu(z)).\end{eqnarray}$$
Let
 $\mathbf{1}\in \mathbb{R}^{|S|}$
denote the vector of ones. Then using the correspondence
 $F_{h}(z,r,q)=G_{h}(z,r,r\mathbf{1}-q)$
, one sees that
 $F_{h}$
is of non-negative type if and only if
 $G_{h}$
is non-increasing in its second and third arguments.
Let us now show that non-negativity is simply a reformulation of monotonicity.
Lemma 3.11 (equivalence).
A finite difference scheme of the form (3.8) is monotone if and only if it is of non-negative type.
Proof. Suppose that
 $F_{h}$
is of non-negative type. Let
 $u_{h}$
and
 $v_{h}$
be two grid functions such that
 $u_{h}-v_{h}$
has a global non-negative maximum at some grid point
 $z$
. Set
 $r=v_{h}(z)$
,
 $t=u_{h}(z)-v_{h}(z)\geq 0$
,
 $q_{i}=v_{h}(z+hy_{i})$
, and
 $\unicode[STIX]{x1D70F}_{i}=\max \{0,u_{h}(z+hy_{i})-v_{h}(z+hy_{i})\}$
, so that
 $t\geq \unicode[STIX]{x1D70F}_{i}$
. Noting that
 $q_{i}+\unicode[STIX]{x1D70F}_{i}=v_{h}(z+hy_{i})+\max \{0,u_{h}(z+hy_{i})-v_{h}(z+hy_{i})\}\geq u_{h}(z+hy_{i})$
, and
 $F_{h}$
is non-decreasing in its third argument, we find that
 $F_{h}[u_{h}](z)\leq F_{h}(z,r+t,q+\unicode[STIX]{x1D70F}).$
Therefore, by the second inequality in (3.9) we have
 $$\begin{eqnarray}F_{h}[u_{h}](z)\leq F_{h}(z,r+t,q+\unicode[STIX]{x1D70F})\leq F_{h}(z,r,q)=F_{h}[v_{h}](z).\end{eqnarray}$$
Thus,
 $F_{h}$
is monotone.
Now suppose that
 $F_{h}$
is monotone. Let
 $z\in \mathbb{R}^{d}$
be fixed, and let
 $r,t\in \mathbb{R}$
and
 $q,\unicode[STIX]{x1D70F}\in \mathbb{R}^{|S|}$
satisfy (3.9). Then define the grid functions
 $u_{h},v_{h}$
(locally) as
 $$\begin{eqnarray}v_{h}(z)=r,\quad v_{h}(z+hy_{i})=q_{i},\quad u_{h}(z)=r+t,\quad u_{h}(z+y_{i})=q_{i}+\unicode[STIX]{x1D70F}_{i}.\end{eqnarray}$$
Then
 $$\begin{eqnarray}u_{h}(z)-v_{h}(z)=t\geq \unicode[STIX]{x1D70F}_{i}=u_{h}(z+hy_{i})-v_{h}(z+hy_{i}),\end{eqnarray}$$
that is,
 $u_{h}-v_{h}$
has a non-negative maximum at
 $z$
. The monotonicity of
 $F_{h}$
yields
 $F_{h}[u_{h}](z)\leq F_{h}[v_{h}](z)$
; thus
 $$\begin{eqnarray}F_{h}(z,r+t,q+\unicode[STIX]{x1D70F})\leq F_{h}(z,r,q).\end{eqnarray}$$
On the other hand, with
 $v_{h}$
as before, we consider the grid function
 $w_{h}$
with
 $$\begin{eqnarray}w_{h}(z)=r,\quad w_{h}(z+hy_{i})=q_{i}+\unicode[STIX]{x1D70F}_{i}.\end{eqnarray}$$
Then
 $v_{h}-w_{h}$
has a global maximum at
 $z$
and thus
 $$\begin{eqnarray}F_{h}(z,r,q)=F_{h}[v_{h}](z)\leq F_{h}[w_{h}](z)=F_{h}(z,r,q+\unicode[STIX]{x1D70F}).\end{eqnarray}$$
We conclude from (3.11)–(3.12) that
 $F_{h}$
is of non-negative type.
Following the framework given in Kuo and Trudinger (Reference Kuo and Trudinger1990, Reference Kuo and Trudinger1992) and Kocan (Reference Kocan1995), we consider discrete operators constructed from the first- and second-order difference operators
 $$\begin{eqnarray}\displaystyle \unicode[STIX]{x1D6FF}_{y,h}^{+}u(z) & := & \displaystyle \displaystyle \frac{1}{h}(u(z+hy)-u(z)),\nonumber\\ \displaystyle \unicode[STIX]{x1D6FF}_{y,h}^{-}u(z) & := & \displaystyle \displaystyle \frac{1}{h}(u(z)-u(z-hy)),\nonumber\\ \displaystyle \unicode[STIX]{x1D6FF}_{y,h}u(z) & := & \displaystyle \displaystyle \frac{1}{2}(\unicode[STIX]{x1D6FF}_{y}^{+}+\unicode[STIX]{x1D6FF}_{y}^{-})u(z)=\displaystyle \frac{1}{2h}(u(z+hy)-u(z-hy)),\nonumber\\ \displaystyle \unicode[STIX]{x1D6FF}_{y,h}^{2}u(z) & := & \displaystyle \displaystyle \frac{1}{h^{2}}(u(z+hy)-2u(x)+u(z-hy)),\nonumber\end{eqnarray}$$
with
 $y\in S$
. Taylor’s theorem shows that the differences
 $\unicode[STIX]{x1D6FF}_{y,h}^{\pm }u(z)$
are first-order approximations to
 $$\begin{eqnarray}\displaystyle \frac{\unicode[STIX]{x2202}u(z)}{\unicode[STIX]{x2202}y}:=Du(z)\cdot y,\end{eqnarray}$$
whereas
 $\unicode[STIX]{x1D6FF}_{y,h}u(z)$
and
 $\unicode[STIX]{x1D6FF}_{y,h}^{2}u(z)$
, respectively, are second-order approximations to
 $$\begin{eqnarray}\displaystyle \frac{\unicode[STIX]{x2202}u(z)}{\unicode[STIX]{x2202}y}\quad \text{and}\quad \displaystyle \frac{\unicode[STIX]{x2202}^{2}u(z)}{\unicode[STIX]{x2202}y^{2}}:=y\cdot D^{2}u(z)y;\end{eqnarray}$$
by this we mean that
 $$\begin{eqnarray}\displaystyle \biggl|\displaystyle \frac{\unicode[STIX]{x2202}^{\pm }u(z)}{\unicode[STIX]{x2202}y}-\unicode[STIX]{x1D6FF}_{y,h}^{\pm }u(z)\biggr| & = & \displaystyle O(h|y|^{2}),\nonumber\\ \displaystyle \biggl|\displaystyle \frac{\unicode[STIX]{x2202}u(z)}{\unicode[STIX]{x2202}y}-\unicode[STIX]{x1D6FF}_{y,h}u(z)\biggr| & = & \displaystyle O(h^{2}|y|^{3}),\nonumber\\ \displaystyle \biggl|\displaystyle \frac{\unicode[STIX]{x2202}^{2}u(z)}{\unicode[STIX]{x2202}y^{2}}-\unicode[STIX]{x1D6FF}_{y,h}^{2}u(z)\biggr| & = & \displaystyle O(h^{2}|y|^{4}),\nonumber\end{eqnarray}$$
for sufficiently smooth
 $u$
.
Let
 $$\begin{eqnarray}\unicode[STIX]{x1D6FF}_{h}u_{h}(z)=\{\unicode[STIX]{x1D6FF}_{y,h}u_{h}(z):y\in S\}\quad \text{and}\quad \unicode[STIX]{x1D6FF}_{h}^{2}u_{h}(z)=\{\unicode[STIX]{x1D6FF}_{y,h}^{2}u_{h}(z):y\in S\}.\end{eqnarray}$$
Then a consistent and monotone finite difference scheme can be constructed in the form
 $$\begin{eqnarray}F_{h}[u_{h}](z)={\mathcal{F}}_{h}(z,u_{h}(z),\unicode[STIX]{x1D6FF}_{h}u_{h}(z),\unicode[STIX]{x1D6FF}_{h}^{2}u_{h}(z))\end{eqnarray}$$
Kuo and Trudinger (Reference Kuo and Trudinger1990, Reference Kuo and Trudinger1992), Motzkin and Wasow (Reference Motzkin and Wasow1953), where
 ${\mathcal{F}}_{h}:\unicode[STIX]{x1D6FA}_{h}\times \mathbb{R}\times \mathbb{R}^{|S|}\times \mathbb{R}^{|S|}\rightarrow \mathbb{R}$
. Let
 $(z,r,q,s)$
denote points in the domain of
 ${\mathcal{F}}_{h}$
, and assume that
 ${\mathcal{F}}_{h}$
is symmetric with respect to
 $\pm q_{\pm i}$
and
 $s_{\pm i}$
. Then from Definition 3.9 and Lemma 3.11 we see that
 $F_{h}$
of the form (3.13) is monotone provided that
 $$\begin{eqnarray}\displaystyle \frac{h}{2}\biggl|\displaystyle \frac{\unicode[STIX]{x2202}{\mathcal{F}}_{h}}{\unicode[STIX]{x2202}q_{i}}\biggr|\leq \displaystyle \frac{\unicode[STIX]{x2202}{\mathcal{F}}_{h}}{\unicode[STIX]{x2202}s_{i}}\quad i=1,2,\ldots ,|S|,\quad \text{and}\quad \displaystyle \frac{\unicode[STIX]{x2202}{\mathcal{F}}_{h}}{\unicode[STIX]{x2202}r}\leq 0.\end{eqnarray}$$
Below, we will require slightly stronger conditions on the operator
 ${\mathcal{F}}_{h}$
.
Definition 3.12 (positive operator).
An operator of the form (3.13) is of positive type (or simply positive) if (3.14) is satisfied and there exists
 $\unicode[STIX]{x1D706}_{0,h}>0$
and an orthogonal set of vectors
 $\{y_{i}\}_{i=1}^{d}\subset S$
such that
 $$\begin{eqnarray}\unicode[STIX]{x1D706}_{0,h}+\displaystyle \frac{h}{2}\biggl|\displaystyle \frac{\unicode[STIX]{x2202}{\mathcal{F}}_{h}}{\unicode[STIX]{x2202}q_{i}}\biggr|\leq \displaystyle \frac{\unicode[STIX]{x2202}{\mathcal{F}}_{h}}{\unicode[STIX]{x2202}s_{i}}.\end{eqnarray}$$
Remark 3.13 (discrete ellipticity).
The discrete ellipticity constant
 $\unicode[STIX]{x1D706}_{0,h}$
may depend on the stencil size
 $m$
; see Theorem 3.36.
3.3 Finite difference stability estimates: Alexandrov estimates and Alexandrov–Bakelman–Pucci maximum principle
We now turn our attention to maximum principles of discrete operators, and correspondingly, stability estimates. As a starting point, we discuss monotone finite difference schemes for the linear non-divergence-form PDEs of Example 2.11
 $$\begin{eqnarray}F[u]={\mathcal{L}}u-f=A:D^{2}u-f=0.\end{eqnarray}$$
While this setting may seem overly simplistic, as we shall see, the construction and theoretical results for the linear problem form all of the necessary tools to approximate viscosity solutions of nonlinear elliptic equations.
We assume that
 $f\in C(\bar{\unicode[STIX]{x1D6FA}})$
and that the coefficient matrix
 $A$
is bounded and uniformly symmetric positive definite. It is then reasonable to assume that
 $F_{h}$
is linear and thus has the form
 $$\begin{eqnarray}F_{h}[u_{h}](z)={\mathcal{L}}_{h}u_{h}(z)-f(z):=\mathop{\sum }_{y\in S}a_{y}(z)\unicode[STIX]{x1D6FF}_{y,h}^{2}u_{h}(z)-f(z)\end{eqnarray}$$
for nodal functions (or coefficients)
 $a_{y}$
. Applying Definition 3.9 to (3.16), we see that
 $F_{h}$
is non-negative (and hence monotone) provided
 $$\begin{eqnarray}a_{y}(z)\geq 0,\end{eqnarray}$$
and of positive type if
 $$\begin{eqnarray}a_{y_{i}}(z)\geq \unicode[STIX]{x1D706}_{0,h}>0\quad i=1,2,\ldots ,d.\end{eqnarray}$$
for some orthogonal basis
 $\{y_{i}\}_{i=1}^{d}\subset S$
. These inequalities suggest that the negation of the ensuing system is an
 $M$
-matrix, and hence solutions to the discrete problem satisfy certain maximum principles, analogous to the continuous setting. This issue is discussed in the next section.
3.3.1 Finite difference Alexandrov estimates
In this section we state and prove ABP maximum principles for grid functions. To get started, we first specify the fundamental notion of interior and boundary nodes used in this section.
Definition 3.14 (interior and boundary nodes).
For a discrete operator
 $F_{h}$
, we define the set of interior nodes
 $\unicode[STIX]{x1D6FA}_{h}^{I}$
as the set of grid points
 $z\in \bar{\unicode[STIX]{x1D6FA}}_{h}$
such that for any mesh function
 $v_{h}$
,
 $F_{h}[v_{h}](z)$
depends only on the translates of
 $v_{h}$
at points in
 $\bar{\unicode[STIX]{x1D6FA}}_{h}$
. The set of boundary nodes are given by
 $\unicode[STIX]{x1D6FA}_{h}^{B}:=\bar{\unicode[STIX]{x1D6FA}}_{h}\backslash \unicode[STIX]{x1D6FA}_{h}^{I}$
.
Remark 3.15 (discrete domain).
If
 $F_{h}$
is a one-step method (i.e.
 $m=1$
), then
 $\unicode[STIX]{x1D6FA}_{h}^{B}=\unicode[STIX]{x2202}\unicode[STIX]{x1D6FA}\cap \mathbb{Z}_{h}^{d}$
and
 $\unicode[STIX]{x1D6FA}_{h}^{I}=\unicode[STIX]{x1D6FA}\cap \mathbb{Z}_{h}^{d}$
.
As a next step we introduce and discuss several basic properties of convexity and the subdifferential for discrete (nodal) functions.
Definition 3.16 (convex nodal function).
We say that a nodal function
 $v_{h}\in X_{h}^{fd}$
is a convex nodal function if there is a supporting hyperplane of
 $v_{h}$
at all interior nodes
 $z\in \unicode[STIX]{x1D6FA}_{h}^{I}.$
Note that if
 $v_{h}$
is the nodal interpolant of a convex function, then
 $v_{h}$
is a convex nodal function.
Definition 3.17 (discrete convex envelope).
Let
 $R>0$
be sufficiently large so that
 $\bar{\unicode[STIX]{x1D6FA}}$
(and hence
 $\bar{\unicode[STIX]{x1D6FA}}_{h}$
) is compactly contained in a ball
 $B_{R}$
. For a nodal function (or continuous function)
 $v_{h}$
with
 $v_{h}\geq 0$
on
 $\unicode[STIX]{x1D6FA}_{h}^{B}$
, we extend
 $v_{h}^{-}$
to
 $B_{R,h}\backslash \bar{\unicode[STIX]{x1D6FA}}_{h}$
by zero, where
 $B_{R,h}=B_{R}\cap \mathbb{Z}_{h}^{d}$
, and
 $v_{h}^{-}=-\max \{0,-v_{h}\}$
is the negative part of
 $v_{h}$
. We define the discrete convex envelope of
 $-v_{h}^{-}$
as
 $$\begin{eqnarray}\unicode[STIX]{x1D6E4}_{h}(v_{h})(x):=\sup \{L(x):L(z)\leq -v_{h}^{-}(z)~\forall z\in B_{R,h},~L\in \mathbb{P}_{1}\}\end{eqnarray}$$
for all
 $x\in \bar{B}_{R}$
.
Remark 3.18 (discrete convexity).
There are subtle issues in the above definitions that require some elaboration.
-
∙ If
$v_{h}\in X_{h}^{fd}$
is convex and
$v_{h}\leq 0$
, then we have (3.19)Thus,
$$\begin{eqnarray}v_{h}(z)=\unicode[STIX]{x1D6E4}_{h}(v_{h})(z)\quad \text{for all }z\in \unicode[STIX]{x1D6FA}_{h}^{I}.\end{eqnarray}$$
$\unicode[STIX]{x1D6E4}_{h}(v_{h})$
is a natural convex extension of
$v_{h}$
.
-
∙ Since for every
$x\in \unicode[STIX]{x2202}B_{R}$
, there exists an affine function
$L$
with
$L(z)\leq -v_{h}^{-}(z)$
for all
$z\in \bar{\unicode[STIX]{x1D6FA}}_{h}$
and
$L(x)=0$
, we conclude that
$\unicode[STIX]{x1D6E4}_{h}(v_{h})=0$
on
$\unicode[STIX]{x2202}B_{R}$
. -
∙ Definition 3.17 implies that
$\unicode[STIX]{x1D6E4}_{h}(v_{h})$
is a convex, piecewise linear function with respect to a simplicial triangulation. The vertices of the triangulation are a subset of the gridpoints
$B_{R,h}$
, and its configuration depends on
$v_{h}$
; see Examples 3.44–3.45. -
∙ For
$v_{h}\in X_{h}^{fd}$
, let
$\tilde{v}_{h}\in C(\bar{\unicode[STIX]{x1D6FA}})$
denote the canonical multi-linear function. Then, since the inequality constraints in (3.18) are only posed on a discrete set of points, and since
$\tilde{v}_{h}$
is not necessarily piecewise affine, we have
$\unicode[STIX]{x1D6E4}(\tilde{v}_{h})\neq \unicode[STIX]{x1D6E4}_{h}(v_{h})$
in general Carnicer and Dahmen (Reference Carnicer and Dahmen1994).


Next, we require the notion of a subdifferential acting on nodal functions. Recall from Definition 2.58 that the subdifferential requires function values at all points of the domain
 $\unicode[STIX]{x1D6FA}$
, so this notion is not directly applicable to the discrete case. Instead, with a slight abuse of notation, we define its natural extension to nodal functions as follows:
 $$\begin{eqnarray}\unicode[STIX]{x2202}v_{h}(z)=\{\mathbf{p}\in \mathbb{R}^{d}:v_{h}(x)-v_{h}(z)\geq \mathbf{p}\cdot (x-z),~\forall x\in \bar{\unicode[STIX]{x1D6FA}}_{h}\},\end{eqnarray}$$
for all
 $z\in \bar{\unicode[STIX]{x1D6FA}}_{h}$
and
 $v_{h}\in X_{h}^{fd}$
.
Lemma 3.19 (discrete subdifferential).
If
 $v_{h}\in X_{h}^{fd}$
is a convex nodal function, then
 $\unicode[STIX]{x2202}v_{h}(z)=\unicode[STIX]{x2202}\unicode[STIX]{x1D6E4}_{h}(v_{h})(z)$
for all
 $z\in \unicode[STIX]{x1D6FA}_{h}^{I}$
.
Proof. Thanks to (3.19), if
 $\mathbf{p}\in \unicode[STIX]{x2202}\unicode[STIX]{x1D6E4}_{h}(v_{h})(z)$
, that is,
 $$\begin{eqnarray}\unicode[STIX]{x1D6E4}_{h}(v_{h})(x)\geq \unicode[STIX]{x1D6E4}_{h}(v_{h})(z)+\mathbf{p}\cdot (x-z),\quad \text{for all}~x\in \unicode[STIX]{x1D6FA},\end{eqnarray}$$
then
 $\mathbf{p}\in \unicode[STIX]{x2202}v_{h}(z)$
.
Conversely, let
 ${\mathcal{T}}_{z}$
be a local mesh induced by
 $\unicode[STIX]{x1D6E4}(u_{h})(z)$
, let
 $K\in {\mathcal{T}}_{z}$
be a
 $d$
-dimensional simplex, and let
 $\{z_{j}\}_{j=1}^{d+1}$
be the vertices of
 $K$
. If
 $\mathbf{p}\in \unicode[STIX]{x2202}v_{h}(z)$
, then we clearly have
 $v_{h}(x)\geq v_{h}(z)+\mathbf{p}\cdot (x-z)$
for all vertices
 $x\in \bar{\unicode[STIX]{x1D6FA}}_{h}$
. Again, thanks to (3.19), we have
 $\unicode[STIX]{x1D6E4}(v_{h})(z_{i})\geq \unicode[STIX]{x1D6E4}(v_{h})(z)+\mathbf{p}\cdot (z_{i}-z)$
for all vertices. Since
 $\unicode[STIX]{x1D6E4}(v_{h})$
is linear on element
 $K$
, we have
 $\unicode[STIX]{x1D6E4}(v_{h})(x)\geq \unicode[STIX]{x1D6E4}(v_{h})(z)+\mathbf{p}\cdot (x-z)$
for any
 $x\in K$
. This shows that
 $\mathbf{p}\in \unicode[STIX]{x2202}\unicode[STIX]{x1D6E4}(u_{h})(z)$
as well.
Let us state two properties of subdifferentials. The proof of the first one follows directly from its definition.
Lemma 3.20 (monotonicity of subdifferential).
Let
 $w_{h},v_{h}\in X_{h}^{fd}$
be two convex nodal functions such that, for a fixed
 $z_{\ast }\in \bar{\unicode[STIX]{x1D6FA}}_{h}$
,
 $w_{h}(z_{\ast })=v_{h}(z_{\ast })$
and
 $w_{h}(z)\leq v_{h}(z)$
for all
 $z\neq z_{\ast }$
. Then,
 $$\begin{eqnarray}\unicode[STIX]{x2202}w_{h}(z_{\ast })\subset \unicode[STIX]{x2202}v_{h}(z_{\ast }).\end{eqnarray}$$
Lemma 3.21 (addition inequality).
Let
 $w_{h}$
and
 $v_{h}$
be two convex nodal functions. Then
 $$\begin{eqnarray}\unicode[STIX]{x2202}w_{h}(z)+\unicode[STIX]{x2202}v_{h}(z)\subset \unicode[STIX]{x2202}(w_{h}+v_{h})(z),\quad \text{for all}~z\in \unicode[STIX]{x1D6FA}_{h}^{I},\end{eqnarray}$$
where
 $\unicode[STIX]{x2202}w_{h}(z)+\unicode[STIX]{x2202}v_{h}(z)$
is the Minkowski sum:
 $$\begin{eqnarray}\unicode[STIX]{x2202}w_{h}(z)+\unicode[STIX]{x2202}v_{h}(z)=\{\mathbf{p}+\mathbf{q}\in \mathbb{R}^{d}:\mathbf{p}\in \unicode[STIX]{x2202}w_{h}(z),\mathbf{q}\in \unicode[STIX]{x2202}v_{h}(z)\}.\end{eqnarray}$$
Proof. We note that if
 $\mathbf{p}\in \unicode[STIX]{x2202}w_{h}(z)$
and
 $\mathbf{q}\in \unicode[STIX]{x2202}v_{h}(z)$
, then
 $$\begin{eqnarray}w_{h}(x)\geq w_{h}(z)+w\cdot (x-z)\quad \text{and}\quad v_{h}(x)\geq v_{h}(z)+v\cdot (x-z)\end{eqnarray}$$
for all
 $x\in \bar{\unicode[STIX]{x1D6FA}}_{h}$
. Adding the two inequalities yields
 $$\begin{eqnarray}w_{h}(x)+v_{h}(x)\geq w_{h}(z)+v_{h}(z)+(\mathbf{p}+\mathbf{q})\cdot (x-z),\end{eqnarray}$$
which implies that
 $(\mathbf{p}+\mathbf{q})\in \unicode[STIX]{x2202}(w_{h}+v_{h})$
.
Given a convex nodal function
 $u_{h}$
, computing its discrete subdifferential set is a non-trivial task. The following lemma shows that it involves computing the convex envelope of
 $u_{h}$
.
Lemma 3.22 (characterization of subdifferential).
Let
 $u_{h}$
be a convex nodal function, and let
 ${\mathcal{T}}_{h}$
be the simplicial mesh induced by its convex envelope. The subdifferential of
 $u_{h}$
at
 $z$
is the convex hull of the piecewise gradient, that is,
 $$\begin{eqnarray}\operatorname{conv}\{Du_{h}|_{K},K\in {\mathcal{T}}_{h},~z\in \bar{K}\}.\end{eqnarray}$$
Here,
 $Du_{h}$
is the gradient of the piecewise linear polynomial induced by
 $u_{h}$
and
 ${\mathcal{T}}_{h}$
.
As final preparation for stating the finite difference version of the Alexandrov estimate, we define the nodal contact set.
Definition 3.23 (nodal contact set).
Let
 $v_{h}$
be either a nodal function or a continuous function with
 $v_{h}\geq 0$
on
 $\unicode[STIX]{x1D6FA}_{h}^{B}$
. The (lower) nodal contact set of
 $v_{h}$
is given by
 $$\begin{eqnarray}{\mathcal{C}}_{h}^{-}(v_{h})=\{z\in \unicode[STIX]{x1D6FA}_{h}^{I}:\unicode[STIX]{x1D6E4}_{h}(v_{h})(z)=v_{h}(z)\}.\end{eqnarray}$$
Note that, for
 $x\in {\mathcal{C}}_{h}^{-}(v_{h})$
, we have
 $$\begin{eqnarray}v_{h}(z)\geq \unicode[STIX]{x1D6E4}_{h}(v_{h})(z)\geq v_{h}(x)+\mathbf{p}\cdot (z-x),\end{eqnarray}$$
for all
 $z\in B_{R,h}$
and all
 $\mathbf{p}\in \unicode[STIX]{x2202}\unicode[STIX]{x1D6E4}_{h}(v_{h})(x)$
.
We are now ready to state and prove the finite difference Alexandrov estimate. Recall that we assume
 $\unicode[STIX]{x1D6FA}$
is compactly contained in a ball
 $B_{R}$
of radius
 $R$
, and that we set
 $B_{R,h}=B_{R}\cap \mathbb{Z}_{h}^{d}$
.
Lemma 3.24 (finite difference Alexandrov estimate).
Let
 $v_{h}\in X_{h}^{fd}$
with
 $v_{h}\geq 0$
on
 $\unicode[STIX]{x1D6FA}_{h}^{B}$
. Then
 $$\begin{eqnarray}\sup _{\bar{\unicode[STIX]{x1D6FA}}_{h}}v_{h}^{-}\leq CR\biggl(\mathop{\sum }_{z\in {\mathcal{C}}_{h}^{-}(v_{h})}|\unicode[STIX]{x2202}\unicode[STIX]{x1D6E4}_{h}(v_{h})(z)|\biggr)^{1/d},\end{eqnarray}$$
where the constant
 $C>0$
depends only on
 $d$
.
Proof. We follow the arguments given in Nochetto and Zhang (Reference Nochetto and Zhang2017a , Proposition 5.1); see also Kuo and Trudinger (Reference Kuo and Trudinger1990).
Let
 $z_{\ast }\in B_{R,h}$
satisfy
 $\sup _{B_{R,h}}v_{h}^{-}=v_{h}^{-}(z_{\ast })$
, and let
 $L$
be a horizontal plane touching
 $v_{h}$
from below at
 $z_{\ast }$
. By Definition 3.17 we have
 $$\begin{eqnarray}\unicode[STIX]{x1D6E4}_{h}(v_{h})(z)\geq L(z)=L(z_{\ast })=v_{h}(z_{\ast }),\quad \text{for all}~z\in B_{R,h}.\end{eqnarray}$$
Thus,
 $\sup _{B_{R,h}}\unicode[STIX]{x1D6E4}_{h}(v_{h})^{-}\leq v_{h}^{-}(z_{\ast })$
. Since
 $\unicode[STIX]{x1D6E4}_{h}(v_{h})\leq v_{h}$
on
 $B_{R,h}$
implies
 $$\begin{eqnarray}\sup _{B_{R,h}}v_{h}^{-}\leq \sup _{B_{R,h}}\unicode[STIX]{x1D6E4}_{h}(v_{h})^{-},\end{eqnarray}$$
we conclude that
 $$\begin{eqnarray}\sup _{\bar{\unicode[STIX]{x1D6FA}}_{h}}v_{h}^{-}=\sup _{B_{R,h}}v_{h}^{-}=\sup _{B_{R,h}}\unicode[STIX]{x1D6E4}_{h}(v_{h})^{-}=\sup _{B_{R}}\unicode[STIX]{x1D6E4}_{h}(v_{h})^{-}.\end{eqnarray}$$
Therefore, to conclude the proof it suffices to show that
 $$\begin{eqnarray}\max _{\bar{\unicode[STIX]{x1D6FA}}_{h}}\unicode[STIX]{x1D6E4}_{h}(v_{h})^{-}\leq CR\biggl(\mathop{\sum }_{z\in {\mathcal{C}}_{h}^{-}(v_{h})}|\unicode[STIX]{x2202}\unicode[STIX]{x1D6E4}_{h}(v_{h})(z)|\biggr)^{1/d}.\end{eqnarray}$$
This is done in three steps.
Step 1. Let
 $K(x)$
be the cone with vertex
 $z_{\ast }$
satisfying
 $$\begin{eqnarray}K(z_{\ast })=-\sup _{B_{R}}\unicode[STIX]{x1D6E4}_{h}(v_{h})^{-}=:-M\quad \text{and}\quad K(x)=0\quad \text{on }\unicode[STIX]{x2202}B_{R},\end{eqnarray}$$
and assume that
 $M>0$
, for otherwise (3.21) is trivial. We note that for any vector
 $\mathbf{p}\in B_{M/(2R)}(0)$
, the affine function
 $L(x)=-M+\mathbf{p}\cdot x-z_{\ast }$
is a supporting plane of
 $K(x)$
at point
 $z_{\ast }$
, namely
 $L(x)\leq K(x)$
for all
 $x\in B_{R}$
and
 $L(z_{\ast })=K(z_{\ast })$
. This implies that
 $\unicode[STIX]{x2202}K(z_{\ast })\supset B_{M/(2R)}(0),$
and therefore
 $$\begin{eqnarray}|\unicode[STIX]{x2202}K(z_{\ast })|\geq C\biggl(\displaystyle \frac{M}{R}\biggr)^{d}.\end{eqnarray}$$
Step 2. We claim that
 $$\begin{eqnarray}\unicode[STIX]{x2202}K(z_{\ast })\subset \mathop{\bigcup }_{z\in {\mathcal{C}}_{h}^{-}(v_{h})}\unicode[STIX]{x2202}\unicode[STIX]{x1D6E4}_{h}(v_{h})(z).\end{eqnarray}$$
This is equivalent to showing that for any supporting plane
 $L$
of
 $K$
at
 $z_{\ast }$
, there is a parallel supporting plane
 $\tilde{L}$
for
 $\unicode[STIX]{x1D6E4}_{h}(v_{h})$
at some contact node
 $y\in {\mathcal{C}}_{h}^{-}(v_{h})$
.
Consider the (nodal) function
 $v_{h}-L$
, and observe that
 $v_{h}\geq 0$
on
 $\unicode[STIX]{x1D6FA}_{h}^{B}$
and
 $v_{h}(z_{\ast })=K(z_{\ast })=L(z_{\ast })$
, whence
 $$\begin{eqnarray}\displaystyle v_{h}(z)-L(z) & \geq & \displaystyle K(z)-L(z)\geq 0\quad \text{on }~\unicode[STIX]{x1D6FA}_{h}^{B},\nonumber\\ \displaystyle v_{h}(z_{\ast })-L(z_{\ast }) & = & \displaystyle K(z_{\ast })-L(z_{\ast })=0.\nonumber\end{eqnarray}$$
We infer that
 $v_{h}-L$
attains a non-positive minimum for some
 $x\in \unicode[STIX]{x1D6FA}_{h}^{I}$
. Hence,
 $\widetilde{L}(z)=L(z)+v_{h}(x)-L(x)$
satisfies
 $\tilde{L}(z)\leq v_{h}(z)$
for all
 $z\in B_{R,h}$
and
 $\tilde{L}(x)=v_{h}(x)$
. Applying Definition 3.17 we conclude that
 $\tilde{L}\leq \unicode[STIX]{x1D6E4}_{h}(v_{h})\leq v_{h}$
and therefore
 $\unicode[STIX]{x1D6E4}_{h}(v_{h})(x)=v_{h}(x)$
; thus
 $x\in {\mathcal{C}}_{h}^{-}(v_{h})$
.
Step 3. Computing Lebesgue measures in (3.22) yields
 $$\begin{eqnarray}C\biggl(\displaystyle \frac{M}{R}\biggr)^{d}\leq |\unicode[STIX]{x2202}K(z_{\ast })|\leq \mathop{\sum }_{z\in {\mathcal{C}}_{h}^{-}(v_{h})}|\unicode[STIX]{x2202}\unicode[STIX]{x1D6E4}_{h}(v_{h})(z)|.\end{eqnarray}$$
Finally, (3.44) follows from this last inequality and some simple algebraic manipulation.
The following theorem states that positive finite difference operators satisfy a discrete Alexandrov–Bakelman–Pucci estimate (see Theorem 2.62 and Kuo and Trudinger Reference Kuo and Trudinger1990).
Theorem 3.25 (finite difference ABP estimate).
Suppose that
 ${\mathcal{L}}_{h}$
is of positive type and of the form (3.16). Suppose that
 $u_{h}\in X_{h}^{fd}$
satisfies
 $$\begin{eqnarray}\left\{\begin{array}{@{}ll@{}}{\mathcal{L}}_{h}u_{h}\leq f\quad & \text{in }\unicode[STIX]{x1D6FA}_{h}^{I},\\ u_{h}=g_{h}\quad & \text{on }\unicode[STIX]{x1D6FA}_{h}^{B}\end{array}\right.\end{eqnarray}$$
for some
 $g_{h}\in X_{h}^{fd}$
. Then
 $$\begin{eqnarray}\sup _{\bar{\unicode[STIX]{x1D6FA}}_{h}}u_{h}^{-}\leq \sup _{\unicode[STIX]{x1D6FA}_{h}^{B}}g_{h}^{-}+C\displaystyle \frac{R}{\unicode[STIX]{x1D706}_{0,h}}\biggl(\mathop{\sum }_{z\in {\mathcal{C}}_{h}^{-}(u_{h})}h^{d}(f^{+}(z))^{d}\biggr)^{1/d},\end{eqnarray}$$
where
 $\unicode[STIX]{x1D706}_{0,h}$
is given in Definition 3.12, and the constant
 $C>0$
depends only on
 $d$
.
Proof. We follow the arguments given in Kuo and Trudinger (Reference Kuo and Trudinger1990, Theorem 2.1).
Note that we can assume that
 $u_{h}\geq 0$
on
 $\unicode[STIX]{x1D6FA}_{h}^{B}$
, by replacing
 $u_{h}$
with
 $u_{h}+\max _{\unicode[STIX]{x1D6FA}_{h}^{B}}g_{h}^{-}$
. Moreover we can assume that
 $\max _{\bar{\unicode[STIX]{x1D6FA}}_{h}}u_{h}^{-}>0$
, since otherwise the proof is trivial.
Let
 $z\in {\mathcal{C}}_{h}^{-}(u_{h})$
and
 $y\in S$
. As
 $\unicode[STIX]{x1D6E4}_{h}(u_{h})$
is convex, we have
 $\unicode[STIX]{x1D6FF}_{y,h}^{2}\unicode[STIX]{x1D6E4}_{h}(u_{h})(z)\geq 0$
. Thus, since the coefficients of
 $F_{h}$
are positive,
 $\unicode[STIX]{x1D6E4}_{h}(u_{h})(z)=u_{h}(z)$
and
 $\unicode[STIX]{x1D6E4}_{h}(u_{h})(z\pm hy)\leq u_{h}(z\pm hy)$
, we have
 $$\begin{eqnarray}0\leq a_{y}(z)\unicode[STIX]{x1D6FF}_{y,h}^{2}\unicode[STIX]{x1D6E4}_{h}(u_{h})(z)\leq a_{y}(z)\unicode[STIX]{x1D6FF}_{y,h}^{2}u_{h}(z).\end{eqnarray}$$
Summing over
 $y\in S$
yields
 $$\begin{eqnarray}0\leq a_{y}(z)\unicode[STIX]{x1D6FF}_{y,h}^{2}\unicode[STIX]{x1D6E4}_{h}(u_{h})(z)\leq \mathop{\sum }_{y^{\prime }\in S}a_{y^{\prime }}(z)\unicode[STIX]{x1D6FF}_{y^{\prime },h}^{2}u_{h}(z)\leq f(z)=f^{+}(z).\end{eqnarray}$$
Take
 $y$
to be the orthogonal set
 $\{y_{i}\}_{i=1}^{d}$
given in Definition 3.12. Expand the left-hand side of the above inequality to get
 $$\begin{eqnarray}\unicode[STIX]{x1D6FF}_{y_{i},h}^{+}\unicode[STIX]{x1D6E4}_{h}(u_{h})(z)-\unicode[STIX]{x1D6FF}_{y_{i},h}^{-}\unicode[STIX]{x1D6E4}_{h}(u_{h})(z)=h\unicode[STIX]{x1D6FF}_{y_{i},h}^{2}\unicode[STIX]{x1D6E4}_{h}(u_{h})(z)\leq \displaystyle \frac{h}{\unicode[STIX]{x1D706}_{0,h}}f^{+}(z).\end{eqnarray}$$
Now, let
 $\mathbf{p}\in \unicode[STIX]{x2202}\unicode[STIX]{x1D6E4}_{h}(u_{h})(z)$
so that
 $\unicode[STIX]{x1D6E4}_{h}(u_{h})(z\pm hy_{i})\geq \unicode[STIX]{x1D6E4}_{h}(u_{h})(z)\pm h\mathbf{p}\cdot y_{i}$
. By manipulating terms and applying inequality (3.24) we obtain
 $$\begin{eqnarray}\unicode[STIX]{x1D6FF}_{y_{i},h}^{-}\unicode[STIX]{x1D6E4}_{h}(u_{h})(z)\leq \mathbf{p}\cdot y_{i}\leq \unicode[STIX]{x1D6FF}_{y_{i},h}^{+}\unicode[STIX]{x1D6E4}_{h}(u_{h})(z)\leq \unicode[STIX]{x1D6FF}_{y_{i},h}^{-}\unicode[STIX]{x1D6E4}_{h}(u_{h})(z)+\displaystyle \frac{h}{\unicode[STIX]{x1D706}_{0,h}}f^{+}(z).\end{eqnarray}$$
Since
 $\{y_{i}/|y_{i}|\}_{i=1}^{d}$
is an orthonormal basis of
 $\mathbb{R}^{d}$
, these two inequalities show that the Lebesgue measure of
 $\unicode[STIX]{x2202}\unicode[STIX]{x1D6E4}_{h}(u_{h})(z)$
is bounded by
 $$\begin{eqnarray}|\unicode[STIX]{x2202}\unicode[STIX]{x1D6E4}_{h}(u_{h})(z)|\leq \displaystyle \frac{h^{d}}{\unicode[STIX]{x1D706}_{0,h}^{d}}|f^{+}(z)|^{d},\end{eqnarray}$$
and therefore
 $$\begin{eqnarray}\mathop{\sum }_{z\in {\mathcal{C}}_{h}^{-}(u_{h})}|\unicode[STIX]{x2202}\unicode[STIX]{x1D6E4}_{h}(u_{h})(z)|\leq \mathop{\sum }_{z\in {\mathcal{C}}_{h}^{-}(u_{h})}\displaystyle \frac{(hf^{+}(z))^{d}}{\unicode[STIX]{x1D706}_{0,h}^{d}}.\end{eqnarray}$$
Remark 3.26 (extensions).
The finite difference ABP estimate given in Theorem 3.25 has been extended to operators with lower-order terms and to general meshes in Kuo and Trudinger (Reference Kuo and Trudinger1996, Reference Kuo and Trudinger2000).
Theorem 3.25 implies that if
 $u_{h}$
solves
 $$\begin{eqnarray}\left\{\begin{array}{@{}ll@{}}{\mathcal{L}}_{h}u_{h}=f\quad & \text{in }\unicode[STIX]{x1D6FA}_{h}^{I},\\ u_{h}=g_{h}\quad & \text{on }\unicode[STIX]{x1D6FA}_{h}^{B},\end{array}\right.\end{eqnarray}$$
then
 $$\begin{eqnarray}\max _{\bar{\unicode[STIX]{x1D6FA}}_{h}}|u_{h}|\leq \max _{\unicode[STIX]{x1D6FA}_{h}^{B}}|g_{h}|+\displaystyle \frac{CR}{\unicode[STIX]{x1D706}_{0,h}}\biggl(\mathop{\sum }_{z\in \unicode[STIX]{x1D6FA}_{h}^{I}}h^{d}|f(z)|^{d}\biggr)^{1/d}.\end{eqnarray}$$
Since problem (3.26) is linear this estimate shows that there exists a unique solution to (3.26).
Similar to the continuous case (see Corollary 2.2), Theorem 3.25 implies a comparison principle.
Corollary 3.27 (discrete comparison).
Suppose that
 ${\mathcal{L}}_{h}$
is of positive type and of the form (3.16). Let
 $u_{h}$
and
 $v_{h}$
be two nodal functions with
 $u_{h}\leq v_{h}$
on
 $\unicode[STIX]{x1D6FA}_{h}^{B}$
and
 ${\mathcal{L}}_{h}u_{h}\geq {\mathcal{L}}_{h}v_{h}$
in
 $\unicode[STIX]{x1D6FA}_{h}^{I}$
. Then
 $u_{h}\leq v_{h}$
in
 $\bar{\unicode[STIX]{x1D6FA}}_{h}$
.
Finally, since problems (3.16) and (3.26) are linear, the Lax–Richtmyer theorem immediately gives us error estimates.
Corollary 3.28 (rate of convergence).
Let
 $I_{h}^{fd}:C(\bar{\unicode[STIX]{x1D6FA}})\rightarrow X_{h}^{fd}$
denote the canonical interpolant onto nodal functions. Let
 $u$
be the solution to (3.15), and let
 $u_{h}\in X_{h}^{fd}$
be the unique solution to (3.26). Then
 $$\begin{eqnarray}\Vert u_{h}-I_{h}^{fd}u\Vert _{L^{\infty }(\bar{\unicode[STIX]{x1D6FA}}_{h})}\leq \Vert g_{h}-I_{h}^{fd}u\Vert _{L^{\infty }(\unicode[STIX]{x1D6FA}_{h}^{B})}+\displaystyle \frac{CR}{\unicode[STIX]{x1D706}_{0,h}}\biggl(\mathop{\sum }_{z\in \unicode[STIX]{x1D6FA}_{h}^{I}}h^{d}|{\mathcal{L}}_{h}I_{h}^{fd}u(z))|^{d}\biggr)^{1/d}\!.\end{eqnarray}$$
Based on Corollary 3.28 and the consistency of the approximation scheme, one can derive error estimates with explicit dependence on the discretization parameter
 $h$
. For example, if we can show that
 $$\begin{eqnarray}\Vert g_{h}-I_{h}^{fd}u\Vert _{L^{\infty }(\unicode[STIX]{x1D6FA}_{h}^{B})}=O(h^{k})\quad \text{and}\quad \Vert {\mathcal{L}}_{h}I_{h}^{fd}u\Vert _{L^{\infty }(\unicode[STIX]{x1D6FA}_{h}^{I})}=O(h^{k})\end{eqnarray}$$
for some positive integer
 $k\in \mathbb{N}$
, then Corollary 3.28 shows that the error satisfies
 $\Vert u-I_{h}^{fd}u\Vert _{L^{\infty }(\bar{\unicode[STIX]{x1D6FA}}_{h})}\leq Ch^{k}$
. The value of
 $k$
is determined by the consistency of the scheme, which typically follows from Taylor’s theorem and the regularity of the exact solution. Unfortunately, the monotonicity of a scheme restricts the size of the order of convergence, as shown, for instance, by Oberman (Reference Oberman2006) and Kossaczký, Ehrhardt and Günther (Reference Kossaczký, Ehrhardt and Günther2016).
Theorem 3.29 (accuracy of monotone schemes).
A monotone finite difference scheme of the form (3.8) is at most second-order accurate for second-order equations.
Finally, solutions to the discrete problem are Hölder-continuous Kuo and Trudinger (Reference Kuo and Trudinger1990, Corollary 4.6, Theorem 5.1).
Theorem 3.30 (Hölder continuity).
Let
 ${\mathcal{L}}_{h}$
be of positive type, and let
 $u_{h}$
satisfy
 ${\mathcal{L}}_{h}u_{h}=f$
in
 $\unicode[STIX]{x1D6FA}_{h}^{I}$
. Assume that
 $\unicode[STIX]{x1D6FA}$
satisfies a uniform exterior cone condition. Then there exist
 $\unicode[STIX]{x1D702}\in (0,1)$
and
 $C>0$
, independent of
 $h$
, such that
 $$\begin{eqnarray}|u_{h}(z)-u_{h}(y)|\leq C|z-y|^{\unicode[STIX]{x1D702}},\end{eqnarray}$$
for all
 $z,y\in \bar{\unicode[STIX]{x1D6FA}}_{h}$
.
As in the continuous setting, the development of Hölder estimates depends on discrete Harnack inequalities.
3.4 Construction of monotone finite difference schemes
Theorem 3.25 shows that linear, positive finite difference schemes are indeed uniquely solvable with solutions uniformly bounded with respect to the data. We will also see that many of these results carry over to the fully nonlinear case, and thus, applying the Barles–Souganidis framework, such schemes converge to the viscosity solution of the nonlinear PDE. However, the theorem does not indicate how to construct such schemes. We now discuss this issue. First, we have the following classical results Motzkin and Wasow (Reference Motzkin and Wasow1953, Theorems 1 and 2).
Theorem 3.31 (impossibility).
For a given (fixed) stencil width
 $m\in \mathbb{N}$
, there exists an linear, elliptic operator
 ${\mathcal{L}}$
such that any linear and consistent finite difference scheme of the form (3.16) is not of positive type.
Theorem 3.32 (existence).
Let
 ${\mathcal{L}}$
be a linear and uniformly elliptic operator satisfying (3.15). Then there exists, for sufficiently small
 $h$
, a consistent finite difference scheme of the form (3.16) that is of positive type.
The main punchline of these theorems is that wide stencils are a necessary feature of consistent and positive-type finite difference discretizations, even for linear problems. The proof of Theorem 3.32, as presented in Motzkin and Wasow (Reference Motzkin and Wasow1953, Theorem 2), is not constructive. On the other hand, the arguments given in Kuo and Trudinger (Reference Kuo and Trudinger1990) and Kocan (Reference Kocan1995) explicitly give an algorithm to construct consistent and positive schemes, and as a result, provide an estimate of the stencil width. We end this section by summarizing these results. As a first step, we state the following trivial observation.
Lemma 3.33 (positivity criterion).
Suppose that
 ${\mathcal{L}}u=A:D^{2}u$
, where the coefficient matrix is positive definite and has the form
 $$\begin{eqnarray}A(x)=\mathop{\sum }_{\substack{ y\in \mathbb{Z}^{d} \\ |y|_{\infty }\leq M}}a_{y}(x)y\otimes y,\end{eqnarray}$$
for some
 $M\in \mathbb{N}$
and with coefficients
 $a_{y}(x)\geq 0$
for all
 $x\in \unicode[STIX]{x1D6FA}$
. Assume further that there exists an orthogonal set
 $\{y_{i}\}_{i=1}^{d}\subset \mathbb{Z}^{d}$
with
 $|y_{i}|_{\infty }\leq M$
such that
 $a_{y_{i}}(x)\geq c$
for some
 $c>0$
. Then the finite difference operator
 $$\begin{eqnarray}{\mathcal{L}}_{h}u_{h}(z)=\mathop{\sum }_{\substack{ y\in \mathbb{Z}^{d} \\ |y|_{\infty }\leq M}}a_{y}(z)\unicode[STIX]{x1D6FF}_{y,h}^{2}u_{h}(z)\end{eqnarray}$$
is of positive type and a consistent approximation to
 ${\mathcal{L}}$
with
 $\unicode[STIX]{x1D706}_{0,h}=c$
.
Of course, not all positive definite matrices are of the form (3.28). However, quite surprisingly, Lemma 3.33 provides the essential tools to construct consistent and positive finite difference schemes for linear (and nonlinear) elliptic equations. Let us consider an example.
Lemma 3.34 (diagonally dominant matrix).
Suppose that
 ${\mathcal{L}}u=A:D^{2}u$
with
 $$\begin{eqnarray}A(x)=\mathop{\sum }_{i,j=1}^{d}a_{i,j}(x)y_{i}\otimes y_{j},\end{eqnarray}$$
where
 $\{y_{i}\}_{i=1}^{d}\subset \mathbb{Z}^{d}$
is an orthogonal basis of
 $\mathbb{R}^{d}$
, that is,
 $$\begin{eqnarray}a_{i,j}=y_{i}\cdot Ay_{j}/(|y_{i}|\,|y_{j}|).\end{eqnarray}$$
Suppose, in addition, that for some
 $c>0$
we have
 $$\begin{eqnarray}\mathop{\sum }_{\substack{ i,j=1 \\ j\neq i}}^{d}|a_{i,j}(x)|\leq a_{i,i}(x)-c\quad i=1,2,\ldots ,\quad x\in \unicode[STIX]{x1D6FA},\end{eqnarray}$$
Then there exists a positive finite difference method
 ${\mathcal{L}}_{h}$
that is consistent with
 ${\mathcal{L}}$
and with
 $\unicode[STIX]{x1D706}_{0,h}=c$
.
Proof. By manipulating terms, we may write
 $$\begin{eqnarray}\displaystyle A & = & \displaystyle \mathop{\sum }_{i=1}^{d}\left(a_{ii}-\mathop{\sum }_{\substack{ j=1 \\ j\neq i}}^{d}|a_{i,j}|\right)y_{i}\otimes y_{i}\nonumber\\ \displaystyle & & \displaystyle \qquad +\,\displaystyle \frac{1}{4}\mathop{\sum }_{\substack{ i,j=1 \\ i\neq j}}^{d}(|a_{i,j}|+a_{i,j})(y_{i}+y_{j})\otimes (y_{i}+y_{j})\nonumber\\ \displaystyle & & \displaystyle \qquad +\,\displaystyle \frac{1}{4}\mathop{\sum }_{\substack{ i,j=1 \\ i\neq j}}^{d}(|a_{i,j}|-a_{i,j})(y_{i}-y_{j})\otimes (y_{i}-y_{j}).\nonumber\end{eqnarray}$$
Thus,
 $A$
satisfies the conditions in Lemma 3.33 with
 $M\leq 2\max _{i}|y_{i}|_{\infty }$
. The result now follows from Lemma 3.33.
Remark 3.35 (stencil size).
By taking
 $\{y_{i}\}_{i=1}^{d}\subset \mathbb{Z}^{d}$
as the standard basis of
 $\mathbb{R}^{d}$
in Lemma 3.34, we deduce that if
 $A$
is strictly diagonally dominant, then there exists a consistent and positive one-step finite difference method.
Now, following Kocan (Reference Kocan1995, Theorem 5), we can estimate the stencil size for a general positive definite matrix.
Theorem 3.36 (existence).
Consider the elliptic operator
 ${\mathcal{L}}u=A:D^{2}u$
, where
 $A$
is uniformly positive definite in
 $\unicode[STIX]{x1D6FA}$
with
 $$\begin{eqnarray}\unicode[STIX]{x1D706}I\leq A\leq \unicode[STIX]{x1D6EC}I\end{eqnarray}$$
for positive constants
 $\unicode[STIX]{x1D706}\leq \unicode[STIX]{x1D6EC}$
. Then there exists a consistent and positive operator
 ${\mathcal{L}}_{h}$
. The stencil size
 $m$
satisfies
 $m\leq 2M_{d}(8d^{3}{\mathcal{E}})$
, where
 ${\mathcal{E}}:=\unicode[STIX]{x1D6EC}/\unicode[STIX]{x1D706}$
and
 $$\begin{eqnarray}M_{d}(s)=C\left\{\begin{array}{@{}ll@{}}s\quad & d=2,\\ s^{5/2}\quad & d=3,\\ s^{2d-4}\quad & d\geq 4.\end{array}\right.\end{eqnarray}$$
Here the constant
 $C>0$
depends only on the dimension
 $d$
. Moreover, one can take the discrete ellipticity constant to be
 $\unicode[STIX]{x1D706}_{0,h}=\unicode[STIX]{x1D706}/(2dm^{2})$
.
Proof. Let
 $\{\unicode[STIX]{x1D706}_{i}\}_{i=1}^{d}\subset [\unicode[STIX]{x1D706},\unicode[STIX]{x1D6EC}]$
denote the eigenvalues of
 $A$
and let
 $\{\unicode[STIX]{x1D711}_{i}\}_{i=1}^{d}$
be an orthonormal set of eigenvectors of
 $A$
, labelled such that
 $$\begin{eqnarray}A=\mathop{\sum }_{i=1}^{d}\unicode[STIX]{x1D706}_{i}\unicode[STIX]{x1D711}_{i}\otimes \unicode[STIX]{x1D711}_{i}.\end{eqnarray}$$
By Kocan (Reference Kocan1995, Theorem 2), for
 $s>0$
to be determined, there exists
 $y_{i}\in \mathbb{Z}^{d}$
such that
 $$\begin{eqnarray}\biggl|\unicode[STIX]{x1D711}_{i}-\displaystyle \frac{y_{i}}{|y_{i}|}\biggr|_{\infty }\leq \displaystyle \frac{1}{s},\quad \displaystyle \frac{M_{d}(s)}{2}\leq |y_{i}|_{\infty }\leq M_{d}(s).\end{eqnarray}$$
Since
 $\{y_{i}\otimes y_{j}\}_{i,j=1}^{d}$
spans
 $\mathbb{S}^{d}$
, we may write
 $$\begin{eqnarray}\displaystyle A & = & \displaystyle \mathop{\sum }_{i=1}^{d}\displaystyle \frac{\unicode[STIX]{x1D706}_{i}}{|y_{i}|^{2}}y_{i}\otimes y_{i}+\mathop{\sum }_{i=1}^{d}\unicode[STIX]{x1D706}_{i}\biggl(\unicode[STIX]{x1D711}_{i}\otimes \unicode[STIX]{x1D711}_{i}-\displaystyle \frac{y_{i}\otimes y_{i}}{|y_{i}|^{2}}\biggr)\nonumber\\ \displaystyle & = & \displaystyle \mathop{\sum }_{i=1}^{d}\displaystyle \frac{\unicode[STIX]{x1D706}_{i}}{|y_{i}|^{2}}y_{i}\otimes y_{i}+\mathop{\sum }_{i,j=1}^{d}\displaystyle \frac{B_{i,j}}{|y_{i}|\,|y_{j}|}y_{i}\otimes y_{j}\nonumber\end{eqnarray}$$
for some
 $B\in \mathbb{R}^{d\times d}$
. Thus,
 $A$
is of the form (3.30) with
 $a_{i,i}=(\unicode[STIX]{x1D706}_{i}+B_{i,i})/|y_{i}|^{2}$
and
 $a_{i,j}=B_{i,j}/(|y_{i}|\,|y_{j}|)$
.
Applying (3.32) and the inequalities
 $\unicode[STIX]{x1D706}\leq \unicode[STIX]{x1D706}_{i}\leq \unicode[STIX]{x1D6EC}$
, we obtain
 $$\begin{eqnarray}|B_{i,j}|\leq \displaystyle \frac{2\unicode[STIX]{x1D6EC}d^{3/2}}{s},\end{eqnarray}$$
and hence
 $$\begin{eqnarray}|a_{i,i}|\geq \displaystyle \frac{1}{|y_{i}|^{2}}\biggl(\unicode[STIX]{x1D706}-\displaystyle \frac{2\unicode[STIX]{x1D6EC}d^{3/2}}{s}\biggr)\geq \displaystyle \frac{\unicode[STIX]{x1D706}}{|y_{i}|^{2}},\quad |a_{i,j}|\leq \displaystyle \frac{2d^{3/2}\unicode[STIX]{x1D6EC}}{s|y_{i}|\,|y_{j}|}.\end{eqnarray}$$
Thus (3.31) will be satisfied if
 $$\begin{eqnarray}\unicode[STIX]{x1D706}\geq \max _{i}\biggl(\displaystyle \frac{2d^{3/2}\unicode[STIX]{x1D6EC}}{s}\mathop{\sum }_{j=1}^{d}\displaystyle \frac{|y_{i}|}{|y_{j}|}+c|y_{i}|^{2}\biggr)\end{eqnarray}$$
for some constant
 $c>0$
. Taking
 $c=\unicode[STIX]{x1D706}/(2dm^{2})$
, and noting that
 $|y_{i}|/|y_{j}|\leq 2d^{1/2}$
, we conclude that if
 $$\begin{eqnarray}s\geq 8d^{3}{\mathcal{E}},\end{eqnarray}$$
then (3.31) is satisfied. The desired result now follows from Lemma 3.34.
Finally we end this section with a result which shows that the uniform ellipticity of
 ${\mathcal{L}}$
condition in Theorem 3.36 cannot be relaxed; see Kocan (Reference Kocan1995, Theorem 1).
Example 3.37 (uniform ellipticity is necessary).
Suppose that
 $d=2$
and
 $Lu=A:D^{2}u$
, where
 $$\begin{eqnarray}A=\left(\begin{array}{@{}cc@{}}\unicode[STIX]{x1D6FC} & \unicode[STIX]{x1D6FD}\\ \unicode[STIX]{x1D6FD} & \unicode[STIX]{x1D6FE}\end{array}\right)\!,\end{eqnarray}$$
 $\unicode[STIX]{x1D6FC},\unicode[STIX]{x1D6FE}>0$
and
 $\unicode[STIX]{x1D6FC}\unicode[STIX]{x1D6FE}=\unicode[STIX]{x1D6FD}^{2}$
(so that
 $\det (A)=0$
). Then if
 $\sqrt{\unicode[STIX]{x1D6FC}/\unicode[STIX]{x1D6FE}}$
is irrational, there does not exist a consistent and non-negative scheme for the problem
 ${\mathcal{L}}u=f$
.
3.5 Monotonicity in finite element methods
In this section we discuss the construction of monotone finite element methods for second-order elliptic problems. As in the previous section, we focus on the linear case, where the elliptic problem is given by (3.15), and extend these results to nonlinear problems in subsequent sections. We further simplify the presentation and analysis by assuming that the coefficient matrix is the identity matrix,
 $A=I$
, and assume Dirichlet boundary conditions. Thus, we focus on the Poisson problem
 $$\begin{eqnarray}\unicode[STIX]{x1D6E5}u=f\quad \text{in }\unicode[STIX]{x1D6FA},\quad u=g\quad \text{on }\unicode[STIX]{x2202}\unicode[STIX]{x1D6FA}.\end{eqnarray}$$
Quite surprisingly, the results given here extend to fully nonlinear problems.
Let
 ${\mathcal{T}}_{h}$
be a simplicial, conforming and quasi-uniform triangulation of
 $\unicode[STIX]{x1D6FA}$
Ciarlet (Reference Ciarlet2002). For simplicity, and to communicate the essential ideas, we shall ignore the approximation of
 $\unicode[STIX]{x1D6FA}$
by the triangulation-induced polytope, and simply assume throughout the paper that
 $\bar{\unicode[STIX]{x1D6FA}}=\cup _{T\in {\mathcal{T}}_{h}}\bar{T}$
. Let
 $X_{h}^{l}$
be the linear Lagrange finite element space, that is,
 $$\begin{eqnarray}X_{h}^{l}=\{v_{h}\in C(\bar{\unicode[STIX]{x1D6FA}}):v_{h}|_{T}\in \mathbb{P}_{1}~\forall T\in {\mathcal{T}}_{h}\}.\end{eqnarray}$$
We extend the definitions given in the previous sections to unstructured meshes by letting
 $\unicode[STIX]{x1D6FA}_{h}^{I}$
and
 $\unicode[STIX]{x1D6FA}_{h}^{B}$
denote the sets of vertices (or nodes) of the triangulation
 ${\mathcal{T}}_{h}$
that belong to
 $\unicode[STIX]{x1D6FA}$
and
 $\unicode[STIX]{x2202}\unicode[STIX]{x1D6FA}$
respectively. Then any function
 $w_{h}\in X_{h}^{l}$
is uniquely determined by the values
 $w_{h}(z)$
for all
 $z\in \bar{\unicode[STIX]{x1D6FA}}_{h}:=\unicode[STIX]{x1D6FA}_{h}^{I}\cup \unicode[STIX]{x1D6FA}_{h}^{B}$
.
To describe the finite element method and to facilitate further developments, we assume that the vertices are labelled such that
 $\bar{\unicode[STIX]{x1D6FA}}_{h}=\{z_{i}\}_{i=1}^{N+M}$
for positive integers
 $N,M$
, with
 $\unicode[STIX]{x1D6FA}_{h}^{I}=\{z_{i}\}_{i=1}^{N}$
and
 $\unicode[STIX]{x1D6FA}_{h}^{B}=\{z_{i}\}_{i=N+1}^{M}$
. The fact that continuous piecewise linear polynomials are uniquely determined by their values at the vertices induces a basis of hat functions
 $\{\tilde{\unicode[STIX]{x1D719}}_{i}\}\subset X_{h}^{l}$
, with the unique property
 $\tilde{\unicode[STIX]{x1D719}}_{i}(z_{j})=\unicode[STIX]{x1D6FF}_{i,j}$
. We define the normalized hat functions as
 $\unicode[STIX]{x1D719}_{i}=c_{i}^{-1}\tilde{\unicode[STIX]{x1D719}}_{i}$
with
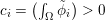 $c_{i}=(\int _{\unicode[STIX]{x1D6FA}}\tilde{\unicode[STIX]{x1D719}}_{i})>0$
, and note that
 $$\begin{eqnarray}v_{h}=\mathop{\sum }_{i=1}^{N+M}c_{i}v_{h}(z_{i})\unicode[STIX]{x1D719}_{i},\quad \text{for all}~v_{h}\in X_{h}^{l},\end{eqnarray}$$
and
 $$\begin{eqnarray}v_{h}=\mathop{\sum }_{i=1}^{N}c_{i}v_{h}(z_{i})\unicode[STIX]{x1D719}_{i},\quad \text{for all}~v_{h}\in X_{0,h}^{l}:=X_{h}^{l}\cap H_{0}^{1}(\unicode[STIX]{x1D6FA}).\end{eqnarray}$$
We set
 $\unicode[STIX]{x1D714}_{z_{i}}=\text{supp}(\unicode[STIX]{x1D719}_{i})$
, which is the union of elements in
 ${\mathcal{T}}_{h}$
that have
 $z_{i}$
as a vertex.
A finite element method for the Poisson problem simply restricts the variational formulation (2.9) (with
 $A=I$
) onto the piecewise polynomial space
 $X_{h}^{l}$
. Thus, we consider the following problem: find
 $u_{h}\in X_{h}^{l}$
with
 $u_{h}(z_{i})=g(z_{i})$
(
 $N+1\leq i\leq N+M$
) and
 $$\begin{eqnarray}-\int _{\unicode[STIX]{x1D6FA}}Du_{h}\cdot Dv_{h}=\int _{\unicode[STIX]{x1D6FA}}fv_{h},\quad \text{for all}~v_{h}\in X_{0,h}^{l}.\end{eqnarray}$$
As in the continuous setting, the existence and uniqueness of
 $u_{h}$
readily follows from the Lax–Milgram lemma. An application of Céa’s lemma and interpolation results also show that the error satisfies
 $\Vert \unicode[STIX]{x1D6FB}(u-u_{h})\Vert _{L^{2}(\unicode[STIX]{x1D6FA})}=O(h)$
provided
 $u\in H^{2}(\unicode[STIX]{x1D6FA})$
; we refer the reader to Ciarlet (Reference Ciarlet2002), Brenner and Scott (Reference Brenner and Scott2008) and Ern and Guermond (Reference Ern and Guermond2004), for example, for proofs of these basic results.
To pose this problem in the operator framework of the previous sections, we first note that (3.36) is equivalent to the conditions
 $$\begin{eqnarray}-\int _{\unicode[STIX]{x1D6FA}}Du_{h}\cdot D\unicode[STIX]{x1D719}_{i}=\int _{\unicode[STIX]{x1D6FA}}f\unicode[STIX]{x1D719}_{i}\quad i=1,2,\ldots ,N.\end{eqnarray}$$
Define
 ${\mathcal{L}}_{h}$
such that for all interior vertices
 $z_{i}\in \unicode[STIX]{x1D6FA}_{h}^{I}$
,
 $$\begin{eqnarray}{\mathcal{L}}_{h}u_{h}(z_{i})=\unicode[STIX]{x1D6E5}_{h}u_{h}(z_{i}),\end{eqnarray}$$
where the finite element Laplacian is defined by
 $$\begin{eqnarray}\unicode[STIX]{x1D6E5}_{h}u_{h}(z_{i}):=-\int _{\unicode[STIX]{x1D6FA}}Du_{h}\cdot D\unicode[STIX]{x1D719}_{i}.\end{eqnarray}$$
Set
 $$\begin{eqnarray}f_{h}(z_{i})=\int _{\unicode[STIX]{x1D6FA}}f\unicode[STIX]{x1D719}_{i}.\end{eqnarray}$$
We further define the piecewise linear function
 $g_{h}$
on
 $\unicode[STIX]{x2202}\unicode[STIX]{x1D6FA}$
with the property
 $$\begin{eqnarray}g_{h}(z_{i})=g(z_{i})\quad i=N+1,\ldots ,N+M,\end{eqnarray}$$
that is,
 $g_{h}=I_{h}^{fe}g$
is the nodal interpolant of
 $g$
. With this notation, we see that the finite element method (3.36) is equivalent to problem (3.6) with
 $F_{h}={\mathcal{L}}_{h}-f_{h}$
.
Before discussing the monotonicity of the scheme (3.36), let us first point out that, unlike the finite difference scheme, one cannot take
 $I_{h}=I_{h}^{fe}$
, the nodal interpolant, in Definition 3.1 to deduce the (operator) consistency of the finite element approximation. The next lemma exemplifies this point. For further details the reader is referred to Jensen and Smears (Reference Jensen and Smears2013b
) and Nochetto and Zhang (Reference Nochetto and Zhang2017a
).
Lemma 3.38 (finite element inconsistency).
Let
 $\unicode[STIX]{x1D6E5}_{h}$
be the finite element Laplacian, defined in (3.39), and denote by
 $I_{h}^{fe}:C(\bar{\unicode[STIX]{x1D6FA}})\rightarrow X_{h}^{l}$
, the nodal interpolant onto the linear Lagrange finite element space. Then, in general, we have
 $$\begin{eqnarray}\unicode[STIX]{x1D6E5}_{h}(I_{h}^{fe}u)(z)\not \rightarrow \unicode[STIX]{x1D6E5}u(z),\quad \text{for all}~z\in \bar{\unicode[STIX]{x1D6FA}}_{h}~~\text{as }h\rightarrow 0\end{eqnarray}$$
for all
 $u\in C^{2}(\unicode[STIX]{x1D6FA})$
.
Proof. Let
 $d=2$
, and consider the triangulation
 ${\mathcal{T}}_{h}$
with four triangles and vertices
 $z_{1}=(0,0)$
,
 $z_{2}=(h,0)$
,
 $z_{3}=(0,h)$
,
 $z_{4}=(-h,0)$
and
 $z_{5}=(0,-h)$
. Let
 $u$
be a
 $C^{2}$
-function that vanishes at the origin. Then a calculation shows that
 $$\begin{eqnarray}\unicode[STIX]{x1D6E5}_{h}I_{h}^{fe}u(z_{1})=\displaystyle \frac{3}{2}h^{-2}\mathop{\sum }_{i=2}^{5}u(z_{i}).\end{eqnarray}$$
Taking, for example,
 $u(x_{1},x_{2})=x_{1}^{2}$
then yields
 $$\begin{eqnarray}\unicode[STIX]{x1D6E5}_{h}I_{h}^{fe}u(z_{1})=3\neq 2=\unicode[STIX]{x1D6E5}u(z_{1}),\quad \text{for all}~h>0.\end{eqnarray}$$
In other words,
 $\unicode[STIX]{x1D6E5}_{h}$
and
 $I_{h}^{fe}$
are not a consistent approximation scheme.
The inconsistency in Lemma 3.38 is caused by the wrong choice of interpolation operator. The so-called elliptic projection gives a correct one.
Definition 3.39 (elliptic projection).
The elliptic projection
 $$\begin{eqnarray}I_{h}^{ep}:H^{1}(\unicode[STIX]{x1D6FA})\cap C(\bar{\unicode[STIX]{x1D6FA}})\rightarrow X_{h}^{l}\end{eqnarray}$$
is defined by
 $$\begin{eqnarray}\unicode[STIX]{x1D6E5}_{h}I_{h}^{ep}u(z_{i})=-\int _{\unicode[STIX]{x1D6FA}}Du\cdot D\unicode[STIX]{x1D719}_{i}\quad i=1,2,\ldots ,N,\end{eqnarray}$$
and
 $I_{h}^{ep}u=u$
on
 $\unicode[STIX]{x1D6FA}_{h}^{B}$
.
The elliptic projection is (almost) quasi-optimal in the
 $L^{\infty }$
-norm Schatz and Wahlbin (Reference Schatz and Wahlbin1982).
Proposition 3.40 (properties of
$I_{h}^{ep}$
).

Let
 $I_{h}^{ep}u\in X_{0,h}^{l}$
be the elliptic projection of
 $u\in C(\bar{\unicode[STIX]{x1D6FA}})\cap H_{0}^{1}(\unicode[STIX]{x1D6FA})$
defined by (3.41). Then
 $$\begin{eqnarray}\Vert u-I_{h}^{ep}u\Vert _{L^{\infty }(\unicode[STIX]{x1D6FA})}\leq C\,|\text{log}\,h|\inf _{v_{h}\in X_{0,h}^{l}}\Vert u-v_{h}\Vert _{L^{\infty }(\unicode[STIX]{x1D6FA})}.\end{eqnarray}$$
If
 $u\in W^{2,\infty }(\unicode[STIX]{x1D6FA})$
, then
 $$\begin{eqnarray}\Vert u-I_{h}^{ep}u\Vert _{L^{\infty }(\unicode[STIX]{x1D6FA})}\leq C\,|\text{log}\,h|h^{2}\Vert u\Vert _{W^{2,\infty }(\unicode[STIX]{x1D6FA})}.\end{eqnarray}$$
More importantly, the finite element method is consistent when one uses the elliptic projection
 $I_{h}^{fe}$
.
Lemma 3.41 (finite element consistency).
Let
 $\{z_{h}\}_{h>0}$
with
 $z_{h}\in \bar{\unicode[STIX]{x1D6FA}}_{h}^{I}$
and
 $z_{h}\rightarrow z_{0}\in \unicode[STIX]{x1D6FA}$
. Then, for all
 $u\in C^{2}(\bar{\unicode[STIX]{x1D6FA}})$
,
 $$\begin{eqnarray}{\mathcal{L}}_{h}I_{h}^{ep}u(z_{h})=\unicode[STIX]{x1D6E5}_{h}(I_{h}^{ep}u)(z_{h})\rightarrow \unicode[STIX]{x1D6E5}u(z_{0}),\quad \text{for all}~z\in \bar{\unicode[STIX]{x1D6FA}}_{h},\end{eqnarray}$$
as
 $h\rightarrow 0+$
. Moreover,
 $I_{h}^{ep}u\rightarrow u$
on
 $\unicode[STIX]{x2202}\unicode[STIX]{x1D6FA}$
.
Proof. The convergence
 $I_{h}^{ep}u\rightarrow u$
on
 $\unicode[STIX]{x2202}\unicode[STIX]{x1D6FA}$
follows from the definition of
 $I_{h}^{ep}$
and standard interpolation theory.
Owing to the regularity of
 $u$
, we have
 $\unicode[STIX]{x1D6E5}u(z_{h})\rightarrow \unicode[STIX]{x1D6E5}u(z_{0})$
as
 $h\rightarrow 0^{+}$
. Now, let
 $\{\unicode[STIX]{x1D719}_{h}\}_{h>0}\subset X_{0,h}^{l}$
denote the normalized hat functions. Then, since
 $\Vert \unicode[STIX]{x1D719}_{h}\Vert _{L^{1}(\unicode[STIX]{x1D6FA})}=1$
, and
 $\unicode[STIX]{x1D719}_{h}\geq 0$
, we have
 $$\begin{eqnarray}\int _{\unicode[STIX]{x1D6FA}}(\unicode[STIX]{x1D6E5}u)\unicode[STIX]{x1D719}_{h}=\int _{\unicode[STIX]{x1D714}_{z_{h}}}(\unicode[STIX]{x1D6E5}u)\unicode[STIX]{x1D719}_{h}\rightarrow \unicode[STIX]{x1D6E5}u(z_{0}).\end{eqnarray}$$
Therefore, by integration by parts,
 $$\begin{eqnarray}\unicode[STIX]{x1D6E5}_{h}I_{h}^{ep}u(z_{h})=\int _{\unicode[STIX]{x1D6FA}}(\unicode[STIX]{x1D6E5}u)\unicode[STIX]{x1D719}_{h}\rightarrow \unicode[STIX]{x1D6E5}u(z_{0})\end{eqnarray}$$
as
 $h\rightarrow 0+$
, and consequently
 $\unicode[STIX]{x1D6E5}_{h}$
is consistent.
Lemma 3.42 (finite element monotonicity).
Suppose that the bases satisfy
 $$\begin{eqnarray}\int _{\unicode[STIX]{x1D6FA}}D\unicode[STIX]{x1D719}_{i}\cdot D\unicode[STIX]{x1D719}_{j}\leq 0.\end{eqnarray}$$
for
 $i,j=1,2,\ldots ,N+M$
and
 $i\neq j$
. Then
 ${\mathcal{L}}_{h}$
, given by (3.38), is monotone.
Proof. Suppose that
 $v_{h},w_{h}\in X_{h}^{l}$
and
 $w_{h}-v_{h}$
has a non-negative maximum at an interior vertex
 $z_{i}\in \unicode[STIX]{x1D6FA}_{h}^{B}$
. Without loss of generality we may assume that
 $w_{h}\leq v_{h}$
and
 $w_{h}(z_{i})=v_{h}(z_{i})$
. Then we find that
 $$\begin{eqnarray}\displaystyle {\mathcal{L}}_{h}w_{h}(z_{i})-{\mathcal{L}}_{h}v_{h}(z_{i}) & = & \displaystyle -\int _{\unicode[STIX]{x1D6FA}}D(w_{h}-v_{h})\cdot D\unicode[STIX]{x1D719}_{i}\nonumber\\ \displaystyle & = & \displaystyle -\mathop{\sum }_{j=1}^{N+M}c_{j}(w_{h}(z_{j})-v_{h}(z_{j}))\int _{\unicode[STIX]{x1D6FA}}D\unicode[STIX]{x1D719}_{j}\cdot D\unicode[STIX]{x1D719}_{i}\leq 0.\nonumber\end{eqnarray}$$
Thus,
 ${\mathcal{L}}_{h}w_{h}(z_{i})\leq {\mathcal{L}}_{h}v_{h}(z_{i})$
, and therefore
 ${\mathcal{L}}_{h}$
is monotone.
Lemma 3.42 indicates that the finite element method is monotone provided that a certain mesh condition is satisfied. Indeed, for an edge
 $E\subset \unicode[STIX]{x2202}T$
, we let
 $\unicode[STIX]{x1D703}_{E}^{T}$
denote the angle between the faces not containing
 $E$
, and let
 $\unicode[STIX]{x1D705}_{E}^{T}$
be the
 $(d-2)$
-dimensional simplex opposite to
 $E$
. Then we have
 $$\begin{eqnarray}\int _{\unicode[STIX]{x1D6FA}}D\tilde{\unicode[STIX]{x1D719}}_{i}\cdot D\tilde{\unicode[STIX]{x1D719}}_{j}=-\displaystyle \frac{1}{d(d-1)}\mathop{\sum }_{T\supset E}|\unicode[STIX]{x1D705}_{E}^{T}|\cot \unicode[STIX]{x1D703}_{E}^{T}\end{eqnarray}$$
Xu and Zikatanov (Reference Xu and Zikatanov1999), Strang and Fix (Reference Strang and Fix1973), where
 $E$
is the edge with vertices
 $z_{i}$
and
 $z_{j}$
. The condition (3.42) is satisfied if the mesh is weakly acute. For example, in two dimensions, this condition means that the sum of the angles opposite to any edge is less than or equal to
 $\unicode[STIX]{x1D70B}$
.
Corollary 3.43 (maximum principle).
Let
 $u_{h}\in X_{h}^{l}$
solve (3.37). Suppose that (3.42) is satisfied and
 $f\geq 0$
and
 $g\leq 0$
. Then
 $u_{h}\leq 0$
.
Proof. Define the stiffness matrix
 $S\in \mathbb{R}^{(N+M)\times (N+M)}$
by
 $$\begin{eqnarray}S_{i,j}=-\int _{\unicode[STIX]{x1D6FA}}D\unicode[STIX]{x1D719}_{i}\cdot D\unicode[STIX]{x1D719}_{j},\end{eqnarray}$$
and note that condition (3.42) is equivalent to
 $S_{i,j}\geq 0$
for
 $i\neq j$
. Moreover, since the hat functions form a partition of unity,
 $$\begin{eqnarray}\mathop{\sum }_{j=1}^{N+M}c_{j}S_{i,j}=0.\end{eqnarray}$$
Now, suppose that
 $u_{h}$
attains a strict positive maximum at an interior node
 $z_{i}$
. We then find
 $$\begin{eqnarray}\displaystyle 0 & = & \displaystyle {\mathcal{L}}_{h}u_{h}(z_{i})=-\int _{\unicode[STIX]{x1D6FA}}Du_{h}\cdot D\unicode[STIX]{x1D719}_{i}-\int _{\unicode[STIX]{x1D6FA}}f\unicode[STIX]{x1D719}_{i}\nonumber\\ \displaystyle & \leq & \displaystyle -\int _{\unicode[STIX]{x1D6FA}}Du_{h}\cdot D\unicode[STIX]{x1D719}_{i}\nonumber\\ \displaystyle & = & \displaystyle \mathop{\sum }_{j=1}^{N+M}c_{j}u_{h}(z_{j})S_{i,j}=\mathop{\sum }_{j=1}^{N+M}c_{j}(u_{h}(z_{j})-u_{h}(z_{i}))S_{i,j}<0,\nonumber\end{eqnarray}$$
a contradiction.
3.6 Finite element stability estimates: Alexandrov estimates and Alexandrov–Bakelman–Pucci maximum principle
As in the finite difference schemes discussed in the previous section, we develop some discrete Alexandrov estimates for finite element functions and analogous ABP maximum principles. Before stating and proving these results, it is useful to discuss some properties of the convex envelope of piecewise linear polynomials.
For
 $v_{h}\in X_{h}^{l}$
with
 $v_{h}\geq 0$
on
 $\unicode[STIX]{x2202}\unicode[STIX]{x1D6FA}$
, let
 $\unicode[STIX]{x1D6E4}(v_{h})$
and
 $\unicode[STIX]{x1D6E4}_{h}(v_{h})$
denote the convex envelope and discrete convex envelope of
 $v_{h}$
given in Definitions 2.59 and 3.17, respectively. Then, since
 $v_{h}$
is piecewise affine, we find that
 $\unicode[STIX]{x1D6E4}_{h}(v_{h})=\unicode[STIX]{x1D6E4}(v_{h})$
, and furthermore,
 $\unicode[STIX]{x1D6E4}_{h}(v_{h})$
is also piecewise affine. However, perhaps unexpectedly,
 $\unicode[STIX]{x1D6E4}(v_{h})$
is not necessarily piecewise linear subordinate to
 ${\mathcal{T}}_{h}$
! The following examples illustrate this feature.
Example 3.44 (convex envelope).
Consider a triangulation with vertices
 $z_{1}=(1,0),~z_{2}=(0,1),~z_{3}=(-1,0),~z_{4}=(0,-1)$
and
 $z_{5}=(0,0)$
. Consider the piecewise linear functions satisfying
 $$\begin{eqnarray}\displaystyle & \displaystyle v_{1}(z_{1})=v_{1}(z_{3})=1,\quad v_{2}(z_{2})=v_{2}(z_{4})=1, & \displaystyle \nonumber\\ \displaystyle & \displaystyle v_{3}(z_{1})=v_{3}(z_{2})=v_{3}(z_{3})=v_{3}(v_{4})=1, & \displaystyle \nonumber\end{eqnarray}$$
and
 $v_{j}(z_{i})=0$
otherwise. The convex envelopes are
 $\unicode[STIX]{x1D6E4}(v_{1})=|x_{1}|$
,
 $\unicode[STIX]{x1D6E4}(v_{2})=|x_{2}|$
, and
 $\unicode[STIX]{x1D6E4}(v_{3})=|x_{1}|+|x_{2}|$
. The convex envelopes are subordinate to the meshes depicted in Figure 3.1.
Meshes corresponding to convex envelopes
 $\unicode[STIX]{x1D6E4}(v_{1})=|x_{1}|$
(a) and
 $\unicode[STIX]{x1D6E4}(v_{2})=|x_{2}|$
(b), and
 $\unicode[STIX]{x1D6E4}(v_{3})=|x_{1}|+|x_{2}|$
(c).

As shown in the example above, since
 $\unicode[STIX]{x1D6E4}(v_{h})$
is a piecewise linear function, it induces a mesh
 $\tilde{{\mathcal{T}}}_{h}$
which depends on
 $v_{h}$
. The following example shows that if
 $v_{h}$
is the nodal interpolant of a function
 $v$
, and if the Hessian
 $D^{2}v$
is degenerate (or nearly degenerate), the induced mesh may be anisotropic.
Example 3.45 (anisotropy).
Let
 $\unicode[STIX]{x1D6FA}=\mathbb{R}^{2}$
and
 $\bar{\unicode[STIX]{x1D6FA}}_{h}=\{(k,m)\}$
. Let
 $v(x)=(x\cdot e)^{2}$
, where
 $e=(1,A)$
for some integer
 $0<A$
and
 $v_{h}(z)=v(z)$
for all
 $z\in \bar{\unicode[STIX]{x1D6FA}}_{h}$
. Then the convex envelope induces an anisotropic mesh depicted in Figure 3.2. The convex envelope in the star of the origin is
 $|x\cdot e|$
.
Mesh induced by the nodal interpolant of
 $v(x)=(x\cdot e)^{2}$
where
 $e=(1,2)$
. Its convex envelope equals
 $|x\cdot e|$
in the star of
 $(0,0)$
.

Let us now state the Alexandrov estimate for finite element functions. Recall that
 $\unicode[STIX]{x1D6FA}$
is compactly contained in a ball
 $B_{R}$
, and the nodal contact set
 ${\mathcal{C}}_{h}^{-}(v_{h})$
is given in Definition 3.23.
Lemma 3.46 (finite element Alexandrov estimate).
For every
 $v_{h}\in X_{h}^{l}$
such that
 $v_{h}\geq 0$
on
 $\unicode[STIX]{x2202}\unicode[STIX]{x1D6FA}$
, we have
 $$\begin{eqnarray}\sup _{\bar{\unicode[STIX]{x1D6FA}}}v_{h}^{-}\leq CR\biggl(\mathop{\sum }_{z\in {\mathcal{C}}_{h}^{-}(v_{h})}|\unicode[STIX]{x2202}\unicode[STIX]{x1D6E4}(v_{h})(z)|\biggr)^{1/d},\end{eqnarray}$$
where the constant
 $C$
depends only on the dimension
 $d$
and the domain
 $\unicode[STIX]{x1D6FA}$
.
Proof. The result directly follows from the proof of Lemma 3.24. Indeed it suffices to realize that, for every
 $v_{h}\in X_{h}^{l}$
,
 $\sup _{\bar{\unicode[STIX]{x1D6FA}}}v_{h}^{-}=\sup _{\bar{\unicode[STIX]{x1D6FA}}_{h}}v_{h}^{-}$
and
 $\unicode[STIX]{x1D6E4}_{h}(v_{h})=\unicode[STIX]{x1D6E4}(v_{h})$
; see Nochetto and Zhang (Reference Nochetto and Zhang2017a
, Proposition 5.1) for details.
Let us point out that, with Lemma 3.46 in hand, it may be possible to extend the arguments given in Theorem 3.25 to develop ABP estimates for piecewise linear polynomials. Instead, following Nochetto and Zhang (Reference Nochetto and Zhang2017a , Section 5), we outline a proof which is more geometric and is based on the characterization of the subdifferential of piecewise linear functions.
As a first step we define the local convex envelope and local subdifferential at a point
 $z\in {\mathcal{C}}_{h}^{-}(v_{h})$
(see Definition 3.23).
Definition 3.47 (local convex envelope).
For
 $v_{h}\in X_{h}^{l}$
and contact node
 $z\in {\mathcal{C}}_{h}^{-}(v_{h})$
, let
 $\unicode[STIX]{x1D714}_{z}$
denote the union of elements in
 ${\mathcal{T}}_{h}$
that have
 $z$
as a vertex. We then define the local convex envelope by
 $$\begin{eqnarray}\unicode[STIX]{x1D6E4}_{z}(v_{h})(x)=\sup \{L(x):L\leq v_{h}\quad \text{in }\unicode[STIX]{x1D714}_{z},~L\in \mathbb{P}_{1},~L(z)=v_{h}(z)\}\end{eqnarray}$$
for all
 $x\in \unicode[STIX]{x1D714}_{z}$
. Its local subdifferential is
 $$\begin{eqnarray}\unicode[STIX]{x2202}\unicode[STIX]{x1D6E4}_{z}(v_{h})(z)=\{\mathbf{p}\in \mathbb{R}^{d}:\unicode[STIX]{x1D6E4}_{z}(v_{h})(x)\geq \unicode[STIX]{x1D6E4}_{z}(v_{h})(z)+\mathbf{p}\cdot (x-z),~\forall x\in \unicode[STIX]{x1D714}_{z}\}.\end{eqnarray}$$
Comparing (3.45) with Definition 2.59, we easily deduce that
 $$\begin{eqnarray}\unicode[STIX]{x2202}\unicode[STIX]{x1D6E4}(v_{h})(z)\subset \unicode[STIX]{x2202}\unicode[STIX]{x1D6E4}_{z}(v_{h})(z),\quad \text{for all}~z\in {\mathcal{C}}_{h}^{-}(v_{h}),\end{eqnarray}$$
and therefore, by Lemma 3.46,
 $$\begin{eqnarray}\sup _{\bar{\unicode[STIX]{x1D6FA}}}v_{h}^{-}\leq CR\biggl(\mathop{\sum }_{z\in {\mathcal{C}}_{h}^{-}(v_{h})}|\unicode[STIX]{x2202}\unicode[STIX]{x1D6E4}_{z}(v_{h})(z)|\biggr)^{1/d}.\end{eqnarray}$$
Less obvious is the following result.
Proposition 3.48 (subordination).
Suppose that
 $d=2$
and, for
 $v_{h}\in X_{h}^{l}$
and contact point
 $z\in {\mathcal{C}}_{h}^{-}(v_{h})$
, let
 $\unicode[STIX]{x1D6E4}_{z}(v_{h})$
be given by Definition 3.47. Then
 $\unicode[STIX]{x1D6E4}_{z}(v_{h})$
is subordinate to
 ${\mathcal{T}}_{h}$
.
We refer the reader to Nochetto and Zhang (Reference Nochetto and Zhang2017a
, Lemma 5.1) for a proof of this result. Here, instead, we will show that if
 $d\geq 3$
the assertion is no longer true. Set
 $$\begin{eqnarray}z_{0}=(0,0,-1),\quad z_{1}=(-1,0,0),\quad z_{2}=(0,1,0),\quad z_{3}=(1,0,0),\end{eqnarray}$$
and let
 $T_{1},T_{2}$
be the convex hulls of
 $z_{0},z_{1},z_{2},z_{3}$
and
 $z_{0},z_{1},-z_{2},z_{3}$
. Consider the piecewise linear function
 $v_{h}$
with values
 $v_{h}(z_{0})=-1,~v_{h}(z_{1})=v_{h}(z_{3})=0$
and
 $v_{h}(\pm z_{2})=-1$
. Then
 $\unicode[STIX]{x1D6E4}_{z_{0}}(v_{h})(x)=|x_{1}|-1$
is not affine on
 $T_{i}$
for each
 $i=1,2$
.
Next, to derive an ABP maximum principle, we state the relation between the subdifferential of a convex, piecewise linear polynomial with its finite element Laplacian. As a first step, we first integrate by parts in (3.38) to get the identity
 $$\begin{eqnarray}\unicode[STIX]{x1D6E5}_{h}v_{h}(z_{i})=-\mathop{\sum }_{F\in {\mathcal{F}}_{z_{i}}}\int _{F}[\!\!\;[\!\!\;Dv_{h}\!\!\;]\!\!\;]\unicode[STIX]{x1D719}_{i},\quad \text{for all}~v_{h}\in X_{h}^{l}.\end{eqnarray}$$
Here,
 ${\mathcal{F}}_{z_{i}}$
is the set of (interior)
 $(d-1)$
-dimensional simplices that have
 $z_{i}$
as a vertex, and, for a vector-valued function
 $\mathbf{w}$
, the jump of
 $\mathbf{w}$
across the face
 $F$
is given by
 $$\begin{eqnarray}[\!\!\;[\!\!\;\mathbf{w}\!\!\;]\!\!\;]\big|_{F}:=\left\{\begin{array}{@{}ll@{}}\mathbf{n}_{F}^{+}\cdot \mathbf{w}^{+}\big|_{F}+\mathbf{n}_{F}^{-}\cdot \mathbf{w}^{-}\big|_{F}\quad & \text{if }F=\unicode[STIX]{x2202}K^{+}\cap \unicode[STIX]{x2202}K^{-},\\ \mathbf{n}_{F}^{+}\cdot \mathbf{w}^{+}\big|_{F}\quad & \text{if }F=\unicode[STIX]{x2202}K^{+}\cap \unicode[STIX]{x2202}\unicode[STIX]{x1D6FA},\end{array}\right.\end{eqnarray}$$
with
 $\mathbf{w}^{\pm }=\mathbf{w}|_{K^{\pm }}$
, and
 $\mathbf{n}_{F}^{\pm }$
denoting the outward unit normal vectors of
 $K^{\pm }$
on
 $F$
. We also define the jump of a scalar function
 $v$
across
 $F$
as
 $$\begin{eqnarray}[\!\!\;[\!\!\;v\!\!\;]\!\!\;]\big|_{F}:=\left\{\begin{array}{@{}ll@{}}\mathbf{n}_{F}^{+}v^{+}\big|_{F}+\mathbf{n}_{F}^{-}v^{-}\big|_{F}\quad & \text{if }F=\unicode[STIX]{x2202}K^{+}\cap \unicode[STIX]{x2202}K^{-},\\ \mathbf{n}_{F}^{+}v^{+}\big|_{F}\quad & \text{if }F=\unicode[STIX]{x2202}K^{+}\cap \unicode[STIX]{x2202}\unicode[STIX]{x1D6FA}.\end{array}\right.\end{eqnarray}$$
Now, since
 $[\!\!\;[\!\!\;Dv_{h}\!\!\;]\!\!\;]$
is constant on
 $F$
, and
 $$\begin{eqnarray}\int _{F}\unicode[STIX]{x1D719}_{i}=\displaystyle \frac{d+1}{d}\displaystyle \frac{|F|}{|\unicode[STIX]{x1D714}_{z_{i}}|},\end{eqnarray}$$
we can obtain an expression on the finite element Laplacian with explicit dependence on the jumps:
 $$\begin{eqnarray}\unicode[STIX]{x1D6E5}_{h}v_{h}(z_{i})=\displaystyle \frac{-(d+1)}{d}\mathop{\sum }_{F\in {\mathcal{F}}_{z_{i}}}\displaystyle \frac{|F|}{|\unicode[STIX]{x1D714}_{z_{i}}|}[\!\!\;[\!\!\;Dv_{h}\!\!\;]\!\!\;]\big|_{F}.\end{eqnarray}$$
A relationship between the jumps of the gradients (and hence the discrete Laplacian) and the subdifferential of a convex, piecewise affine function is now given.
Proposition 3.49 (subdifferential versus jumps).
Let
 $\unicode[STIX]{x1D6FE}$
be a piecewise affine convex function on a patch
 $\unicode[STIX]{x1D714}_{z}$
for some node
 $z\in \unicode[STIX]{x1D6FA}_{h}^{I}$
, and let
 ${\mathcal{F}}_{z}$
denote the set of
 $(d-1)$
-dimensional simplices that touch
 $z$
. Then, for any
 $F\in {\mathcal{F}}_{z}$
, the jump
 $[\!\!\;[\!\!\;D\unicode[STIX]{x1D6FE}\!\!\;]\!\!\;]|_{F}$
is non-positive and
 $$\begin{eqnarray}|\unicode[STIX]{x2202}\unicode[STIX]{x1D6FE}(z)|\leq C\biggl(\mathop{\sum }_{F\in {\mathcal{F}}_{z}}-[\!\!\;[\!\!\;D\unicode[STIX]{x1D6FE}\!\!\;]\!\!\;]\big|_{F}\biggr)^{d}.\end{eqnarray}$$
We will not give a complete proof of Proposition 3.49, but rather give a rough idea of how such a result is obtained in two dimensions. Further details can be found in Nochetto and Zhang (Reference Nochetto and Zhang2017a , Section 5.2).
Without loss of generality, assume that
 $z=0$
and
 $\unicode[STIX]{x1D6FE}(0)=0$
. We further denote by
 $\{z_{j}\}_{j=1}^{m}$
the set of nodes in
 $\unicode[STIX]{x1D714}_{z}$
. Now, since
 $\unicode[STIX]{x1D6FE}$
is a piecewise affine function, a vector
 $\mathbf{p}\in \unicode[STIX]{x2202}\unicode[STIX]{x1D6FE}(0)$
is characterized by the inequalities
 $$\begin{eqnarray}\mathbf{p}\cdot z_{j}\leq \unicode[STIX]{x1D6FE}(z_{j})\quad 1\leq j\leq m.\end{eqnarray}$$
Therefore, we conclude that the subdifferential of
 $\unicode[STIX]{x1D6FE}(0)$
is a convex polygon determined by the intersection of the half-spaces
 $$\begin{eqnarray}S_{j}:=\{\mathbf{p}\in \mathbb{R}^{2}:\mathbf{p}\cdot z_{j}\leq \unicode[STIX]{x1D6FE}(z_{j})\},\end{eqnarray}$$
and that a vector
 $\mathbf{p}$
is in the interior of
 $\unicode[STIX]{x2202}\unicode[STIX]{x1D6FE}(0)$
if and only if
 $$\begin{eqnarray}\mathbf{p}\cdot z_{j}<\unicode[STIX]{x1D6FE}(z_{j}),\quad 1\leq j\leq m,\end{eqnarray}$$
and it is on the boundary of
 $\unicode[STIX]{x2202}\unicode[STIX]{x1D6FE}(0)$
if
 $$\begin{eqnarray}\mathbf{p}\cdot z_{j}=\unicode[STIX]{x1D6FE}(z_{j})\end{eqnarray}$$
for some
 $j$
. This characterization of the boundary motivates the introduction of a
 $\unicode[STIX]{x2202}\unicode[STIX]{x1D6FE}(0)$
-induced dual mesh, which we now explain.
Let
 $T$
be an
 $n$
-dimensional simplex in
 $\unicode[STIX]{x1D714}_{z}$
with
 $0\leq n\leq 2$
such that
 $0\in T$
. We then define the
 $(2-n)$
-dimensional dual set
 $T^{\ast }$
as follows (see Figure 3.3).
-
∙ If
$n=0$
, so that
$T=\{0\}$
, then we define
$T^{\ast }$
as the subdifferential
$\unicode[STIX]{x2202}\unicode[STIX]{x1D6FE}(0)$
. -
∙ If
$n=2$
, so that
$T=K$
is an element of
$\unicode[STIX]{x1D714}_{z}$
, then
$T^{\ast }$
is the vector
$\unicode[STIX]{x2202}\unicode[STIX]{x1D6FE}\big|_{K}$
. -
∙ If
$n=1$
, so that
$T=F=\unicode[STIX]{x2202}K^{+}\cap \unicode[STIX]{x2202}K^{-}$
is an (interior) edge in
$\unicode[STIX]{x1D714}_{z}$
, then
$T^{\ast }$
is the line segment jointing the two vectors
$\unicode[STIX]{x2202}\unicode[STIX]{x1D6FE}|_{K^{\pm }}=D\unicode[STIX]{x1D6FE}_{K^{\pm }}$
.


Note that
 $T^{\ast }$
is a convex polytope contained in the
 $(2-n)$
-dimensional plane
 $$\begin{eqnarray}P_{T}=\{\mathbf{p}\in \mathbb{R}^{2}:\mathbf{p}\cdot z=\unicode[STIX]{x1D6FE}(z)~\forall z\in T\},\end{eqnarray}$$
and therefore, for arbitrary
 $\mathbf{p}_{1},\mathbf{p}_{2}\in P_{T}$
,
 $(\mathbf{p}_{1}-\mathbf{p}_{2})\cdot z=0$
for all
 $z\in T$
, that is,
 $P_{T}$
is orthogonal to
 $T$
.
A pictorial description of the dual set of a patch.

Now, the proceeding discussion implies that the boundary of
 $\unicode[STIX]{x2202}\unicode[STIX]{x1D6FE}(0)$
is given by
 $$\begin{eqnarray}\bigcup \{F^{\ast }:\text{edges }F\text{ in }\unicode[STIX]{x1D714}_{z}\text{ with }0\in F\},\end{eqnarray}$$
in other words, the boundary of
 $\unicode[STIX]{x2202}\unicode[STIX]{x1D6FE}$
is made of line segments that join
 $\unicode[STIX]{x2202}\unicode[STIX]{x1D6FE}(0)$
on neighbouring triangles; for further details see Nochetto and Zhang (Reference Nochetto and Zhang2017a
, Proposition 5.6). If
 $F=\unicode[STIX]{x2202}K^{+}\cap \unicode[STIX]{x2202}K^{-}$
, then it follows that the length of
 $F^{\ast }$
is given by
 $$\begin{eqnarray}|F^{\ast }|=|D\unicode[STIX]{x1D6FE}|_{K^{+}}-D\unicode[STIX]{x1D6FE}|_{K^{-}}|=-[\!\!\;[\!\!\;D\unicode[STIX]{x1D6FE}\!\!\;]\!\!\;]|_{F},\end{eqnarray}$$
where we have used the fact that
 $D\unicode[STIX]{x1D6FE}|_{K^{+}}-D\unicode[STIX]{x1D6FE}_{K^{-}}$
is perpendicular to
 $F$
and the non-positivity of
 $[\!\!\;[\!\!\;D\unicode[STIX]{x1D6FE}\!\!\;]\!\!\;]$
. Putting everything together, we conclude that the boundary of
 $\unicode[STIX]{x2202}\unicode[STIX]{x1D6FE}(0)$
is bounded by
 $\sum _{F\in {\mathcal{F}}_{z}}-[\!\!\;[\!\!\;D\unicode[STIX]{x1D6FE}\!\!\;]\!\!\;]\big|_{F}$
. Thus, by the isoperimetric inequality,
 $$\begin{eqnarray}|\unicode[STIX]{x2202}\unicode[STIX]{x1D6FE}(0)|\leq C\biggl(\mathop{\sum }_{F\in {\mathcal{F}}_{z}}-[\!\!\;[\!\!\;D\unicode[STIX]{x1D6FE}\!\!\;]\!\!\;]\big|_{F}\biggr)^{2}.\end{eqnarray}$$
This last statement is (3.51) for
 $d=2$
.
Theorem 3.50 (finite element ABP estimate).
Suppose that the simplicial mesh
 ${\mathcal{T}}_{h}$
satisfies (3.42) and that
 $u_{h}\in X_{h}^{l}$
satisfies
 $$\begin{eqnarray}\left\{\begin{array}{@{}ll@{}}{\mathcal{L}}_{h}u_{h}\leq f_{h}\quad & \text{in }\unicode[STIX]{x1D6FA}_{h}^{I},\\ u_{h}=g_{h}\quad & \text{on }\unicode[STIX]{x1D6FA}_{h}^{B},\end{array}\right.\end{eqnarray}$$
where
 ${\mathcal{L}}_{h}$
and
 $g_{h}$
are given by (3.38) and (3.40), respectively, and
 $X_{h}^{l}$
is the linear Lagrange space defined by (3.34). Then
 $$\begin{eqnarray}\sup _{\bar{\unicode[STIX]{x1D6FA}}}u_{h}^{-}\leq \sup _{\unicode[STIX]{x1D6FA}_{h}^{B}}g_{h}^{-}+CR\biggl(\mathop{\sum }_{z\in {\mathcal{C}}_{h}^{-}(u_{h})}|\unicode[STIX]{x1D714}_{z}|(f_{h}^{+}(z))^{d}\biggr)^{1/d}.\end{eqnarray}$$
Proof. We give the proof under the assumption that
 $\unicode[STIX]{x1D6E4}_{z}(u_{h})$
is subordinate to
 ${\mathcal{T}}_{h}$
(which is the case in two dimensions). For the proof of the general case, we refer interested readers to Nochetto and Zhang (Reference Nochetto and Zhang2017a
).
As in the proof of Theorem 3.25, we may assume
 $u_{h}\geq 0$
on
 $\unicode[STIX]{x1D6FA}_{h}^{B}$
and
 $\sup _{\bar{\unicode[STIX]{x1D6FA}}}u_{h}^{-}>0$
.
Let
 $z\in {\mathcal{C}}_{h}^{-}(u_{h})$
, and note that
 $\unicode[STIX]{x1D6E4}_{z}(u_{h})(x)\leq u_{h}(x)$
for all
 $x\in \unicode[STIX]{x1D714}_{z}$
with equality at
 $z$
. Then by (3.42) and Lemma 3.42, and since
 $\unicode[STIX]{x1D6E4}_{z}(u_{h})$
is subordinate to
 ${\mathcal{T}}_{h}$
, we find that
 $$\begin{eqnarray}\unicode[STIX]{x1D6E5}_{h}\unicode[STIX]{x1D6E4}_{z}(u_{h})(z)\leq \unicode[STIX]{x1D6E5}_{h}u_{h}(z).\end{eqnarray}$$
Moreover, by (3.50), we have
 $$\begin{eqnarray}-\mathop{\sum }_{F\in {\mathcal{F}}_{z}}\displaystyle \frac{|F|}{|\unicode[STIX]{x1D714}_{z}|}[\!\!\;[\!\!\;D\unicode[STIX]{x1D6E4}_{z}(u_{h})\!\!\;]\!\!\;]\big|_{F}=\displaystyle \frac{d}{d+1}\unicode[STIX]{x1D6E5}_{h}\unicode[STIX]{x1D6E4}_{z}(u_{h})(z)\leq \displaystyle \frac{d}{d+1}\unicode[STIX]{x1D6E5}_{h}u_{h}(z).\end{eqnarray}$$
Applying Proposition 3.49, and using
 $|F|\approx |\unicode[STIX]{x1D714}_{z}|^{1-1/d}$
, we conclude that
 $$\begin{eqnarray}|\unicode[STIX]{x2202}\unicode[STIX]{x1D6E4}_{z}(u_{h})(z)|\leq C\biggl(-\mathop{\sum }_{F\in {\mathcal{F}}_{z}}\displaystyle \frac{|F|}{|\unicode[STIX]{x1D714}_{z}|}[\!\!\;[\!\!\;D\unicode[STIX]{x1D6E4}_{z}\!\!\;]\!\!\;]\big|_{F}\biggr)^{d}|\unicode[STIX]{x1D714}_{z}|\leq C\displaystyle \frac{|\unicode[STIX]{x1D714}_{z}|}{d+1}\unicode[STIX]{x1D6E5}_{h}u_{h}(z).\end{eqnarray}$$
Combining this last inequality with (3.47) yields the result.


4 Finite element methods for elliptic problems in non-divergence form
In this section we summarize recent advances in finite element methods for elliptic problems in non-divergence form with non-smooth coefficients. For simplicity, and to illustrate the main ideas, we consider problems of the form (2.5) with no lower-order terms and with homogeneous Dirichlet boundary conditions. In this setting the problem reads
 $$\begin{eqnarray}{\mathcal{L}}u=A:D^{2}u=f\quad \text{in }\unicode[STIX]{x1D6FA},\quad u=0\quad \text{on }\unicode[STIX]{x2202}\unicode[STIX]{x1D6FA},\end{eqnarray}$$
where
 $A$
is a symmetric positive definite in
 $\bar{\unicode[STIX]{x1D6FA}}\subset \mathbb{R}^{d}$
with either
 $A\in C(\bar{\unicode[STIX]{x1D6FA}},\mathbb{S}^{d})$
or
 $A\in L^{\infty }(\unicode[STIX]{x1D6FA},\mathbb{S}^{d})$
. Further assumptions of the domain
 $\unicode[STIX]{x1D6FA}$
, its boundary
 $\unicode[STIX]{x2202}\unicode[STIX]{x1D6FA}$
, the coefficient matrix
 $A$
, and the source function
 $f$
will be made as they become necessary.
Recall from Section 2.1 that if the coefficient matrix is sufficiently smooth, then we can write the PDE in divergence form with
 $A$
as the diffusion coefficient and
 $D\cdot A$
(taken column-wise) as the convective coefficient. In this setting, (weak) solutions are defined by an integration-by-parts argument (see Section 2.3), and as such, finite element methods are easily constructed. However, when
 $A$
is not differentiable, the clear-cut methodology of Galerkin methods is no longer valid.
This section summarizes three classes of finite element methods for problem (4.1), each motivated by the different solution concepts presented in Sections 2.4–2.5. The first class considers problem (4.1) on convex domains with
 $A\in L^{\infty }(\unicode[STIX]{x1D6FA},\mathbb{S}^{d})$
satisfying the Cordes condition. The second class of methods is motivated by the notion of strong solutions (see Section 2.4) under the assumption that
 $A\in C(\bar{\unicode[STIX]{x1D6FA}},\mathbb{S}^{d})$
. Finally, the third method is motivated by the notion of viscosity solutions (see Section 2.5), where comparison principles and monotonicity of the scheme are the central themes.
4.1 Discretization of non-divergence-form PDEs satisfying the Cordes condition
Here we discuss recent numerical methods for second-order elliptic PDEs in non-divergence form satisfying the Cordes condition (2.15). Recall from Section 2.4.1 that, if the domain is convex, this condition on the coefficient matrix ensures that the bilinear mapping
 $$\begin{eqnarray}a(\cdot ,\cdot ):(H^{2}(\unicode[STIX]{x1D6FA})\cap H_{0}^{1}(\unicode[STIX]{x1D6FA}))^{2}\ni (v,w)\rightarrow a(v,w)=\int _{\unicode[STIX]{x1D6FA}}\unicode[STIX]{x1D6FE}{\mathcal{L}}v\unicode[STIX]{x1D6E5}w\end{eqnarray}$$
is coercive, thus allowing one to define strong solutions via variational principles. Here, the function
 $\unicode[STIX]{x1D6FE}$
is given by (2.13). In this setting the existence of a strong solution
 $u\in H^{2}(\unicode[STIX]{x1D6FA})\cap H_{0}^{1}(\unicode[STIX]{x1D6FA})$
to (4.1) is deduced from the variational formulation
 $$\begin{eqnarray}a(u,v)=\int _{\unicode[STIX]{x1D6FA}}\unicode[STIX]{x1D6FE}f\unicode[STIX]{x1D6E5}v\,dx,\quad \text{for all}~v\in H^{2}(\unicode[STIX]{x1D6FA})\cap H_{0}^{1}(\unicode[STIX]{x1D6FA})\end{eqnarray}$$
and appealing to the Lax–Milgram lemma. Since the mapping
 $\unicode[STIX]{x1D6E5}:H^{2}(\unicode[STIX]{x1D6FA})\cap H_{0}^{1}(\unicode[STIX]{x1D6FA})\rightarrow L^{2}(\unicode[STIX]{x1D6FA})$
is surjective on convex domains, one concludes that a function
 $u\in H^{2}(\unicode[STIX]{x1D6FA})\cap H_{0}^{1}(\unicode[STIX]{x1D6FA})$
satisfying (4.3) satisfies (4.1) almost everywhere, that is,
 $u\in H^{2}(\unicode[STIX]{x1D6FA})\cap H_{0}^{1}(\unicode[STIX]{x1D6FA})$
is a strong solution to (4.1). We refer the reader to Theorem 2.39 for details.
One immediately sees that the solution concept lends itself to a finite element approximation which would pose (4.3) over a finite-dimensional subspace of
 $H^{2}(\unicode[STIX]{x1D6FA})\cap H_{0}^{1}(\unicode[STIX]{x1D6FA})$
consisting of piecewise polynomials. To describe this procedure, we let
 ${\mathcal{T}}_{h}$
denote a simplicial, conforming and shape-regular triangulation of
 $\unicode[STIX]{x1D6FA}$
parametrized by
 $h>0$
, and let
 $X_{h}^{cd}\subset H^{2}(\unicode[STIX]{x1D6FA})\cap H_{0}^{1}(\unicode[STIX]{x1D6FA})$
be a finite-dimensional subspace consisting of piecewise polynomials with respect to
 ${\mathcal{T}}_{h}$
. A conforming finite element approximation to (4.3) seeks a function
 $u_{h}\in X_{h}^{cd}$
satisfying the discrete variational formulation
 $$\begin{eqnarray}a(u_{h},v_{h})=\int _{\unicode[STIX]{x1D6FA}}\unicode[STIX]{x1D6FE}f\unicode[STIX]{x1D6E5}v_{h},\quad \text{for all}~v_{h}\in X_{h}^{cd}.\end{eqnarray}$$
Problem (4.4) represents a square linear system of equations. The coercivity of the bilinear form
 $a(\cdot ,\cdot )$
over
 $H^{2}(\unicode[STIX]{x1D6FA})\cap H_{0}^{1}(\unicode[STIX]{x1D6FA})$
implies that this system is invertible, and thus there exists a unique solution
 $u_{h}\in X_{h}^{cd}$
to problem (4.4). Moreover, the continuity of
 $a(\cdot ,\cdot )$
and Céa’s lemma show that such approximations are quasi-optimal in the sense that
 $$\begin{eqnarray}\Vert u-u_{h}\Vert _{H^{2}(\unicode[STIX]{x1D6FA})}\leq \displaystyle \frac{C}{\unicode[STIX]{x1D6FC}}\inf _{v_{h}\in X_{h}^{cd}}\Vert u-v_{h}\Vert _{H^{2}(\unicode[STIX]{x1D6FA})},\end{eqnarray}$$
where
 $C>0$
and
 $\unicode[STIX]{x1D6FC}=1-\sqrt{1-\unicode[STIX]{x1D716}}$
are the continuity and coercivity constants of
 $a(\cdot ,\cdot )$
, respectively.
While method (4.4) is a stable and convergent numerical scheme for computing solutions to (4.3), it has some potential practical drawbacks. Piecewise polynomial subspaces of
 $H^{2}(\unicode[STIX]{x1D6FA})$
are difficult to construct and implement, and are not a practical option for solving second-order PDEs. These properties are further exacerbated in three dimensions, where, for example, polynomials of degree of at least nine are required to construct
 $H^{2}$
-conforming finite element spaces on general simplicial partitions; see Lai and Schumaker (Reference Lai and Schumaker2007, Remark 1) and Ženíšek (Reference Ženíšek1973). Nevertheless, this path is explored by Gallistl (Reference Gallistl2017), who also presents a mixed formulation.
4.1.1
$C^{0}$
finite element approximations

We now discuss finite element methods for problem (4.1) that use continuous basis functions, commonly used for second-order problems in divergence form. To this end, with
 ${\mathcal{T}}_{h}$
given in the previous section, we define the Lagrange finite element space
 $$\begin{eqnarray}X_{h}^{cg}=\{v_{h}\in H_{0}^{1}(\unicode[STIX]{x1D6FA}):v_{h}\big|_{T}\in \mathbb{P}_{k}(T)~\forall T\in {\mathcal{T}}_{h}\}\end{eqnarray}$$
with
 $k\in \mathbb{N}$
. Note that functions in
 $X_{h}^{cg}$
are locally smooth, yet not globally
 $H^{2}(\unicode[STIX]{x1D6FA})$
, and therefore second-order derivatives are only defined piecewise with respect to
 ${\mathcal{T}}_{h}$
. To simplify the presentation, we shall write
 $$\begin{eqnarray}\Vert v\Vert _{L^{2}({\mathcal{T}}_{h})}:=\biggl(\mathop{\sum }_{K\in {\mathcal{T}}_{h}}\Vert v\Vert _{L^{2}(K)}^{2}\biggr)^{1/2}\end{eqnarray}$$
for piecewise
 $L^{2}$
-functions.
Since
 $X_{h}^{cg}\not \subset H^{2}(\unicode[STIX]{x1D6FA})\cap H_{0}^{1}(\unicode[STIX]{x1D6FA})$
, the bilinear form
 $a(\cdot ,\cdot )$
defined by (4.2) is not well-defined on
 $X_{h}^{cg}\times X_{h}^{cg}$
. Moreover, a piecewise version of the bilinear form is not generally coercive on
 $X_{h}^{cg}$
, since, for example,
 $$\begin{eqnarray}\mathop{\sum }_{K\in {\mathcal{T}}_{h}}\int _{K}\unicode[STIX]{x1D6FE}{\mathcal{L}}v_{h}\unicode[STIX]{x1D6E5}v_{h}=0\end{eqnarray}$$
for all piecewise linear
 $v_{h}\in X_{h}^{cg}$
. This stems from the fact that a piecewise version of the Miranda–Talenti estimate
 $\Vert D^{2}v\Vert _{L^{2}(\unicode[STIX]{x1D6FA})}\leq \Vert \unicode[STIX]{x1D6E5}v\Vert _{L^{2}(\unicode[STIX]{x1D6FA})}$
is not satisfied on
 $X_{h}^{cg}$
. As such, the coercivity proof of
 $a(\cdot ,\cdot )$
found at the continuous level does not directly carry over to the discrete setting.
To overcome this we develop a discrete Miranda–Talenti estimate suitable for piecewise polynomials. To do so, we introduce some notation. Let
 ${\mathcal{F}}_{h}^{I}$
and
 ${\mathcal{F}}_{h}^{B}$
denote the set of interior and boundary edges/faces, respectively, and set
 ${\mathcal{F}}_{h}:={\mathcal{F}}_{h}^{I}\cup {\mathcal{F}}_{h}^{B}$
and
 $h_{F}:=\text{diam}(F)$
for
 $F\in {\mathcal{F}}_{h}$
. We recall that the jump of a vector-valued function
 $\mathbf{w}$
is given by (3.48).
A discrete Miranda–Talenti estimate is based on the following result, whose proof can be found in Georgoulis, Houston and Virtanen (Reference Georgoulis, Houston and Virtanen2011).
Lemma 4.1 (enrichment operator).
Suppose that
 $d=2$
. Then there exists a finite-dimensional space
 $X_{h}^{cd}\subset H^{2}(\unicode[STIX]{x1D6FA})\cap H_{0}^{1}(\unicode[STIX]{x1D6FA})$
and an (enrichment) operator
 $E_{h}:X_{h}^{cg}\rightarrow X_{h}^{cd}$
satisfying
 $$\begin{eqnarray}\Vert D^{2}(v_{h}-E_{h}v_{h})\Vert _{L^{2}({\mathcal{T}}_{h})}\leq C\biggl(\mathop{\sum }_{F\in {\mathcal{F}}_{h}^{I}}h_{F}^{-1}\Vert [\!\!\;[\!\!\;Dv_{h}\!\!\;]\!\!\;]\Vert _{L^{2}(F)}^{2}\biggr)^{1/2}\end{eqnarray}$$
for all
 $v_{h}\in X_{h}^{cg}$
. Here, the constant
 $C>0$
depends on the polynomial degree
 $k$
and the shape-regularity of
 ${\mathcal{T}}_{h}$
, but is independent of
 $h$
.
Theorem 4.2 (discrete Miranda–Talenti estimate).
Suppose that
 $\unicode[STIX]{x1D6FA}\subset \mathbb{R}^{2}$
is a convex polygon. Then, for all
 $v_{h}\in X_{h}^{cg}$
,
 $$\begin{eqnarray}\Vert D^{2}v_{h}\Vert _{L^{2}({\mathcal{T}}_{h})}\leq \Vert \unicode[STIX]{x1D6E5}v_{h}\Vert _{L^{2}({\mathcal{T}}_{h})}+C\biggl(\mathop{\sum }_{F\in {\mathcal{F}}_{h}^{I}}h_{F}^{-1}\Vert [\!\!\;[\!\!\;Dv_{h}\!\!\;]\!\!\;]\Vert _{L^{2}(F)}^{2}\biggr)^{1/2}.\end{eqnarray}$$
Proof. Fix
 $v_{h}\in X_{h}^{cg}$
and let
 $E_{h}:X_{h}^{cg}\rightarrow X_{h}^{cd}$
be the enrichment operator of Lemma 4.1. Since
 $E_{h}v_{h}\in H^{2}(\unicode[STIX]{x1D6FA})\cap H_{0}^{1}(\unicode[STIX]{x1D6FA})$
and
 $\unicode[STIX]{x1D6FA}$
is convex, the Miranda–Talenti estimate
 $$\begin{eqnarray}\Vert D^{2}E_{h}v_{h}\Vert _{L^{2}(\unicode[STIX]{x1D6FA})}\leq \Vert \unicode[STIX]{x1D6E5}E_{h}v_{h}\Vert _{L^{2}(\unicode[STIX]{x1D6FA})}=\Vert \unicode[STIX]{x1D6E5}E_{h}v_{h}\Vert _{L^{2}({\mathcal{T}}_{h})}\end{eqnarray}$$
is satisfied. Applying the triangle inequality, the inequality
 $\Vert \unicode[STIX]{x1D6E5}E_{h}v_{h}\Vert _{L^{2}(\unicode[STIX]{x1D6FA})}\leq \sqrt{2}\Vert D^{2}E_{h}v_{h}\Vert _{L^{2}(\unicode[STIX]{x1D6FA})}$
, and estimate (4.6) yields
 $$\begin{eqnarray}\displaystyle \Vert D^{2}v_{h}\Vert _{L^{2}({\mathcal{T}}_{h})} & \leq & \displaystyle \Vert D^{2}E_{h}v_{h}\Vert _{L^{2}(\unicode[STIX]{x1D6FA})}+\Vert D^{2}(v_{h}-E_{h}v_{h})\Vert _{L^{2}({\mathcal{T}}_{h})}\nonumber\\ \displaystyle & \leq & \displaystyle \Vert \unicode[STIX]{x1D6E5}E_{h}v_{h}\Vert _{L^{2}(\unicode[STIX]{x1D6FA})}+\Vert D^{2}(v_{h}-E_{h}v_{h})\Vert _{L^{2}({\mathcal{T}}_{h})}\nonumber\\ \displaystyle & \leq & \displaystyle \Vert \unicode[STIX]{x1D6E5}v_{h}\Vert _{L^{2}({\mathcal{T}}_{h})}+C\biggl(\mathop{\sum }_{F\in {\mathcal{F}}_{h}^{I}}h_{F}^{-1}\Vert [\!\!\;[\!\!\;Dv_{h}\!\!\;]\!\!\;]\Vert _{L^{2}(F)}^{2}\biggr)^{1/2},\nonumber\end{eqnarray}$$
where in the last step we used that
 $$\begin{eqnarray}\displaystyle \Vert \unicode[STIX]{x1D6E5}E_{h}v_{h}\Vert _{L^{2}(\unicode[STIX]{x1D6FA})} & \leq & \displaystyle \Vert \unicode[STIX]{x1D6E5}v_{h}\Vert _{L^{2}({\mathcal{T}}_{h})}+\Vert \unicode[STIX]{x1D6E5}(E_{h}v_{h}-v_{h})\Vert _{L^{2}({\mathcal{T}}_{h})}\nonumber\\ \displaystyle & \leq & \displaystyle \Vert \unicode[STIX]{x1D6E5}v_{h}\Vert _{L^{2}({\mathcal{T}}_{h})}+\sqrt{2}\Vert D^{2}(E_{h}v_{h}-v_{h})\Vert _{L^{2}({\mathcal{T}}_{h})}.\nonumber\end{eqnarray}$$
This concludes the proof.
Motivated by Theorem 4.2, we define the bilinear form
 $$\begin{eqnarray}a_{h}(v,w):=\mathop{\sum }_{K\in {\mathcal{T}}_{h}}\int _{K}\unicode[STIX]{x1D6FE}{\mathcal{L}}v\unicode[STIX]{x1D6E5}w+\mathop{\sum }_{F\in {\mathcal{F}}_{h}^{I}}\unicode[STIX]{x1D707}h_{F}^{-1}\int _{F}[\!\!\;[\!\!\;Dv\!\!\;]\!\!\;]\,[\!\!\;[\!\!\;Dw\!\!\;]\!\!\;],\end{eqnarray}$$
where
 $\unicode[STIX]{x1D707}$
is a positive penalty parameter. We also define the discrete
 $H^{2}$
-type norm
 $$\begin{eqnarray}\Vert v\Vert _{H_{h}^{2}(\unicode[STIX]{x1D6FA})}^{2}:=\Vert \unicode[STIX]{x1D6E5}v\Vert _{L^{2}({\mathcal{T}}_{h})}^{2}+\mathop{\sum }_{F\in {\mathcal{F}}_{h}^{I}}h_{F}^{-1}\Vert [\!\!\;[\!\!\;Dv\!\!\;]\!\!\;]\Vert _{L^{2}(F)}^{2}.\end{eqnarray}$$
We consider the following finite element method: find
 $u_{h}\in X_{h}^{cg}$
satisfying
 $$\begin{eqnarray}a_{h}(u_{h},v_{h})=\mathop{\sum }_{K\in {\mathcal{T}}_{h}}\int _{K}\unicode[STIX]{x1D6FE}f\unicode[STIX]{x1D6E5}v_{h},\quad \text{for all}~v_{h}\in X_{h}^{cg}.\end{eqnarray}$$
Note that the additional penalization term does not affect the consistency of the scheme; that is, we obtain
 $a_{h}(u,v_{h})=\sum _{K\in {\mathcal{T}}_{h}}\int _{K}\unicode[STIX]{x1D6FE}f\unicode[STIX]{x1D6E5}v_{h}$
for all
 $v_{h}\in X_{h}^{cg}$
. The role of this term is to weakly enforce
 $H^{2}$
-regularity and to ensure that the bilinear form
 $a_{h}(\cdot ,\cdot )$
is coercive provided
 $\unicode[STIX]{x1D707}$
is sufficiently large.
Lemma 4.3 (coercivity).
Suppose that
 $\unicode[STIX]{x1D6FA}\subset \mathbb{R}^{2}$
is convex and that
 $A\in L^{\infty }(\unicode[STIX]{x1D6FA},\mathbb{S}^{2})$
satisfies the Cordes condition (2.15) with parameter
 $\unicode[STIX]{x1D716}$
. There exists
 $\unicode[STIX]{x1D707}_{\ast }>0$
depending on the shape-regularity of the mesh, polynomial degree
 $k$
, and the parameter
 $\unicode[STIX]{x1D716}$
such that, for
 $\unicode[STIX]{x1D707}\geq \unicode[STIX]{x1D707}_{\ast }$
,
 $$\begin{eqnarray}\displaystyle \frac{\unicode[STIX]{x1D6FC}}{2}\Vert v_{h}\Vert _{H_{h}^{2}(\unicode[STIX]{x1D6FA})}^{2}\leq a_{h}(v_{h},v_{h}),\quad \text{for all}~v_{h}\in X_{h}^{cg},\end{eqnarray}$$
where
 $\unicode[STIX]{x1D6FC}=1-\sqrt{1-\unicode[STIX]{x1D716}}$
is the coercivity constant of
 $a(\cdot ,\cdot )$
.
Proof. Adding a subtracting
 $\unicode[STIX]{x1D6E5}v_{h}$
and applying the Cordes condition yields
 $$\begin{eqnarray}\displaystyle a_{h}(v_{h},v_{h}) & = & \displaystyle \mathop{\sum }_{K\in {\mathcal{T}}_{h}}\int _{K}\unicode[STIX]{x1D6FE}{\mathcal{L}}v_{h}\unicode[STIX]{x1D6E5}v_{h}+\unicode[STIX]{x1D707}\mathop{\sum }_{F\in {\mathcal{F}}_{h}^{I}}h_{F}^{-1}\Vert [\!\!\;[\!\!\;Dv_{h}\!\!\;]\!\!\;]\Vert _{L^{2}(F)}^{2}\nonumber\\ \displaystyle & = & \displaystyle \Vert \unicode[STIX]{x1D6E5}v_{h}\Vert _{L^{2}({\mathcal{T}}_{h})}^{2}+\mathop{\sum }_{K\in {\mathcal{T}}_{h}}\int _{K}(\unicode[STIX]{x1D6FE}{\mathcal{L}}v_{h}-\unicode[STIX]{x1D6E5}v_{h})\unicode[STIX]{x1D6E5}v_{h}\nonumber\\ \displaystyle & & \displaystyle \qquad +\,\unicode[STIX]{x1D707}\mathop{\sum }_{F\in {\mathcal{F}}_{h}^{I}}h_{F}^{-1}\Vert [\!\!\;[\!\!\;Dv_{h}\!\!\;]\!\!\;]\Vert _{L^{2}(F)}^{2}\nonumber\\ \displaystyle & \geq & \displaystyle \Vert \unicode[STIX]{x1D6E5}v_{h}\Vert _{L^{2}({\mathcal{T}}_{h})}^{2}-\sqrt{1-\unicode[STIX]{x1D716}}\Vert \unicode[STIX]{x1D6E5}v_{h}\Vert _{L^{2}({\mathcal{T}}_{h})}\Vert D^{2}v_{h}\Vert _{L^{2}({\mathcal{T}}_{h})}\nonumber\\ \displaystyle & & \displaystyle \qquad +\,\unicode[STIX]{x1D707}\mathop{\sum }_{F\in {\mathcal{F}}_{h}^{I}}h_{F}^{-1}\Vert [\!\!\;[\!\!\;Dv_{h}\!\!\;]\!\!\;]\Vert _{L^{2}(F)}^{2}.\nonumber\end{eqnarray}$$
Applying the discrete Miranda–Talenti estimate and the Cauchy–Schwarz inequality, we obtain, for any
 $\unicode[STIX]{x1D70F}>0$
,
 $$\begin{eqnarray}\displaystyle a_{h}(v_{h},v_{h}) & \geq & \displaystyle \biggl(\unicode[STIX]{x1D6FC}-\displaystyle \frac{\unicode[STIX]{x1D70F}}{2}\sqrt{1-\unicode[STIX]{x1D716}}\biggr)\Vert \unicode[STIX]{x1D6E5}v_{h}\Vert _{L^{2}({\mathcal{T}}_{h})}^{2}\nonumber\\ \displaystyle & & \displaystyle \qquad +\,\biggl(\unicode[STIX]{x1D707}-\displaystyle \frac{1}{2\unicode[STIX]{x1D70F}}\sqrt{1-\unicode[STIX]{x1D716}}\biggr)\mathop{\sum }_{F\in {\mathcal{F}}_{h}^{I}}h_{F}^{-1}\Vert [\!\!\;[\!\!\;Dv_{h}\!\!\;]\!\!\;]\Vert _{L^{2}(F)}^{2}.\nonumber\end{eqnarray}$$
Taking
 $\unicode[STIX]{x1D70F}=\unicode[STIX]{x1D6FC}/\sqrt{1-\unicode[STIX]{x1D716}}=1/\sqrt{1-\unicode[STIX]{x1D716}}-1$
and
 $\unicode[STIX]{x1D707}_{\ast }=\unicode[STIX]{x1D6FC}/2+\sqrt{1-\unicode[STIX]{x1D716}}(1-1/\unicode[STIX]{x1D6FC})$
yields
 $$\begin{eqnarray}\displaystyle \frac{\unicode[STIX]{x1D6FC}}{2}\Vert v_{h}\Vert _{H_{h}^{2}(\unicode[STIX]{x1D6FA})}^{2}\leq a_{h}(v_{h},v_{h}).\end{eqnarray}$$
The coercivity stated in Lemma 4.3 shows that there exists a unique solution to the finite element method (4.10). Combined with the consistency of the scheme, we immediately obtain quasi-optimal error estimates in the discrete
 $H^{2}$
-norm.
Theorem 4.4 (existence and error estimates).
Suppose that
 $\unicode[STIX]{x1D6FA}\subset \mathbb{R}^{2}$
is convex and that
 $A\in L^{\infty }(\unicode[STIX]{x1D6FA},\mathbb{S}^{2})$
satisfies the Cordes condition (2.15) with parameter
 $\unicode[STIX]{x1D716}$
. Suppose that
 $\unicode[STIX]{x1D707}\geq \unicode[STIX]{x1D707}_{\ast }$
, and let
 $u_{h}\in X_{h}^{cg}$
be the unique solution to (4.10) with
 $X_{h}^{cg}$
given by (4.5). Then, if the solution to (4.1) satisfies
 $u\in H^{s}(\unicode[STIX]{x1D6FA})$
with
 $2\leq s\leq k+1$
,
 $$\begin{eqnarray}\unicode[STIX]{x1D6FC}\Vert u-u_{h}\Vert _{H_{h}^{2}(\unicode[STIX]{x1D6FA})}\leq C\inf _{v_{h}\in X_{h}^{cg}}\Vert u-v_{h}\Vert _{H_{h}^{2}(\unicode[STIX]{x1D6FA})}\leq Ch^{s-2}\Vert u\Vert _{H^{s}(\unicode[STIX]{x1D6FA})},\end{eqnarray}$$
where
 $\unicode[STIX]{x1D6FC}=1-\sqrt{1-\unicode[STIX]{x1D716}}$
.
Remark 4.5 (linear case).
Note that in the piecewise linear case
 $(k=1)$
, Theorem 4.4 does not give a convergence result. In fact, it is easy to see that in this case the solution to (4.10) is the trivial one
 $u_{h}\equiv 0$
.

4.1.2 Discontinuous Galerkin approximations
In this section we summarize the discretization developed and analysed in in Smears and Süli (Reference Smears and Süli2013), where a consistent discontinuous Galerkin (DG) method is constructed. Instead of developing a discrete Miranda–Talenti via penalization, the key idea of this approach is to add auxiliary terms in the bilinear form to bypass the Miranda–Talenti estimate found at the continuous level.
For
 $k\in \mathbb{N}$
, define the piecewise polynomial space without continuity:
 $$\begin{eqnarray}X_{h}^{\mathit{dg}}=\{v\in L^{2}(\unicode[STIX]{x1D6FA}):v|_{T}\in \mathbb{P}_{k}(T)~\forall T\in {\mathcal{T}}_{h}\}.\end{eqnarray}$$
We note that the method in Smears and Süli (Reference Smears and Süli2013) considers discretizations in an
 $hp$
-framework where the polynomial degree is element-dependent. For simplicity, and to ease the presentation, we consider here only the
 $h$
-version of the method, where the polynomial degree is globally fixed and we do not trace the dependence of the constants on the polynomial degree
 $k$
.
To motivate the method, we again emphasize that a Miranda–Talenti estimate fails to hold for piecewise polynomials, and as such, the coercivity proof found at the continuous levels fails in the discrete setting. Indeed, mimicking the calculations in Lemma 2.38 element-wise over
 $X_{h}^{\mathit{dg}}$
leads to
 $$\begin{eqnarray}\mathop{\sum }_{K\in {\mathcal{T}}_{h}}\int _{K}\unicode[STIX]{x1D6FE}{\mathcal{L}}v_{h}\unicode[STIX]{x1D6E5}v_{h}=\mathop{\sum }_{K\in {\mathcal{T}}_{h}}\int _{K}\unicode[STIX]{x1D6E5}v_{h}\unicode[STIX]{x1D6E5}v_{h}+\mathop{\sum }_{K\in {\mathcal{T}}_{h}}\int _{K}(\unicode[STIX]{x1D6FE}{\mathcal{L}}v_{h}-\unicode[STIX]{x1D6E5}v_{h})\unicode[STIX]{x1D6E5}v_{h}.\end{eqnarray}$$
Applying the Cordes condition and the Cauchy–Schwarz inequality yields the inequality
 $$\begin{eqnarray}\mathop{\sum }_{K\in {\mathcal{T}}_{h}}\int _{K}\unicode[STIX]{x1D6FE}{\mathcal{L}}v_{h}\unicode[STIX]{x1D6E5}_{h}v\geq \Vert \unicode[STIX]{x1D6E5}v_{h}\Vert _{L^{2}({\mathcal{T}}_{h})}^{2}-\sqrt{1-\unicode[STIX]{x1D716}}\Vert D^{2}v_{h}\Vert _{L^{2}({\mathcal{T}}_{h})}\Vert \unicode[STIX]{x1D6E5}v_{h}\Vert _{L^{2}({\mathcal{T}}_{h})}.\end{eqnarray}$$
Since the piecewise Hessian matrix of
 $v_{h}$
cannot be controlled by its piecewise Laplacian (e.g. if
 $v_{h}$
is piecewise harmonic), one concludes that the bilinear mapping
 $(v_{h},w_{h})\rightarrow \sum _{K\in {\mathcal{T}}_{h}}\int _{K}\unicode[STIX]{x1D6FE}{\mathcal{L}}v_{h}\unicode[STIX]{x1D6E5}w_{h}$
is not coercive over
 $X_{h}^{\mathit{dg}}\times X_{h}^{\mathit{dg}}$
in general.
The essential idea presented in Smears and Süli (Reference Smears and Süli2013) is to replace the bilinear form
 $(v_{h},w_{h})\rightarrow \sum _{K\in {\mathcal{T}}_{h}}\int _{K}\unicode[STIX]{x1D6E5}v_{h}\unicode[STIX]{x1D6E5}w_{h}$
implicit in the right-hand side of (4.12) with a consistent bilinear form that is coercive with a discrete
 $H^{2}$
-type norm.
For a face
 $F\in {\mathcal{F}}_{h}$
, let
 $\{t_{i}\}_{i=1}^{d-1}$
be an orthonormal coordinate system, and define the tangential gradient, tangential divergence, and tangential Laplacian, respectively, as
 $$\begin{eqnarray}D_{T}v=\mathop{\sum }_{i=1}^{d-1}t_{i}\displaystyle \frac{\unicode[STIX]{x2202}v}{\unicode[STIX]{x2202}t_{i}},\quad D_{T}\cdot \mathbf{w}=\mathop{\sum }_{i=1}^{d-1}\displaystyle \frac{\unicode[STIX]{x2202}w_{i}}{\unicode[STIX]{x2202}t_{i}},\quad \unicode[STIX]{x1D6E5}_{T}v=D_{T}\cdot D_{T}v.\end{eqnarray}$$
We also define the average of a scalar or vector-valued function as
 $$\begin{eqnarray}\{\hspace{-3.25201pt}\{v\}\hspace{-3.25201pt}\}|_{F}:=\left\{\begin{array}{@{}ll@{}}\displaystyle \frac{1}{2}(v_{+}+v_{-})\quad & \text{if }F=\unicode[STIX]{x2202}K^{+}\cap \unicode[STIX]{x2202}K^{-}\in {\mathcal{F}}_{h}^{I},\\ v_{+}\quad & \text{if }F=\unicode[STIX]{x2202}K^{+}\cap \unicode[STIX]{x2202}\unicode[STIX]{x1D6FA}\in {\mathcal{F}}_{h}^{B}.\end{array}\right.\end{eqnarray}$$
Then define the bilinear form
 $$\begin{eqnarray}\displaystyle & & \displaystyle B_{h}(u_{h},v_{h})=\mathop{\sum }_{K\in {\mathcal{T}}_{h}}\int _{K}(D^{2}u_{h}:D^{2}v_{h}+\unicode[STIX]{x1D6E5}u_{h}\unicode[STIX]{x1D6E5}v_{h})\nonumber\\ \displaystyle & & \displaystyle \qquad +\,\mathop{\sum }_{F\in {\mathcal{F}}_{h}^{I}}\int _{F}(\{\hspace{-3.25201pt}\{\unicode[STIX]{x1D6E5}_{T}u_{h}\}\hspace{-3.25201pt}\}[\!\!\;[\!\!\;Dv_{h}\!\!\;]\!\!\;]+\{\hspace{-3.25201pt}\{\unicode[STIX]{x1D6E5}_{T}v_{h}\}\hspace{-3.25201pt}\}[\!\!\;[\!\!\;Du_{h}\!\!\;]\!\!\;])\nonumber\\ \displaystyle & & \displaystyle \qquad -\,\mathop{\sum }_{F\in {\mathcal{F}}_{h}}\int _{F}(D_{T}\{\hspace{-3.25201pt}\{Du_{h}\cdot n\}\hspace{-3.25201pt}\}\cdot [\!\!\;[\!\!\;D_{T}v_{h}\!\!\;]\!\!\;]_{T}+D_{T}\{\hspace{-3.25201pt}\{Dv_{h}\cdot n\}\hspace{-3.25201pt}\}\cdot [\!\!\;[\!\!\;D_{T}u_{h}\!\!\;]\!\!\;]_{T})\nonumber\\ \displaystyle & & \displaystyle \qquad +\,\mathop{\sum }_{F\in {\mathcal{F}}_{h}^{I}}\unicode[STIX]{x1D707}h_{F}^{-1}\int _{F}[\!\!\;[\!\!\;Du_{h}\!\!\;]\!\!\;][\!\!\;[\!\!\;Dv_{h}\!\!\;]\!\!\;]+\mathop{\sum }_{F\in {\mathcal{F}}_{h}}\unicode[STIX]{x1D707}h_{F}^{-3}\int _{F}[\!\!\;[\!\!\;u_{h}\!\!\;]\!\!\;]\cdot [\!\!\;[\!\!\;v_{h}\!\!\;]\!\!\;],\end{eqnarray}$$
where
 $[\!\!\;[\!\!\;\mathbf{v}\!\!\;]\!\!\;]_{T}|_{F}:=\mathbf{v}_{+}-\mathbf{v}_{-}$
on
 ${\mathcal{F}}_{h}^{I}$
and
 $[\!\!\;[\!\!\;\mathbf{v}\!\!\;]\!\!\;]_{T}|_{F}:=\mathbf{v}_{+}$
on
 ${\mathcal{F}}_{h}^{B}$
, and
 $\unicode[STIX]{x1D707}>0$
is a penalization parameter.
For
 $\unicode[STIX]{x1D703}\in [0,1]$
, let us define the discrete
 $\mathit{DG}$
-norm
 $$\begin{eqnarray}\displaystyle \Vert v\Vert _{\mathit{DG}(\unicode[STIX]{x1D703})}^{2} & = & \displaystyle (1-\unicode[STIX]{x1D703})\Vert \unicode[STIX]{x1D6E5}v\Vert _{L^{2}({\mathcal{T}}_{h})}^{2}+\unicode[STIX]{x1D703}\Vert D^{2}v\Vert _{L^{2}({\mathcal{T}}_{h})}^{2}\nonumber\\ \displaystyle & & \displaystyle \qquad +\,c_{\ast }\biggl(\mathop{\sum }_{F\in {\mathcal{F}}_{h}^{I}}h_{F}^{-1}\Vert [\!\!\;[\!\!\;Dv\!\!\;]\!\!\;]\Vert _{L^{2}(F)}^{2}+\mathop{\sum }_{F\in {\mathcal{F}}_{h}}h_{F}^{-3}\Vert [\!\!\;[\!\!\;v\!\!\;]\!\!\;]\Vert _{L^{2}(F)}^{2}\biggr).\end{eqnarray}$$
The seemingly abstruse bilinear form
 $B_{h}(\cdot ,\cdot )$
is carefully defined to satisfy the following properties Smears and Süli (Reference Smears and Süli2013, Lemmas 5 and 7).
Lemma 4.7 (properties of
$B_{h}$
).

The bilinear form
 $B_{h}:X_{h}^{\mathit{dg}}\times X_{h}^{\mathit{dg}}\rightarrow \mathbb{R}$
, defined in (4.14), satisfies the following properties.
-
∙ Consistency. If
$u\in H^{s}(\unicode[STIX]{x1D6FA})\cap H_{0}^{1}(\unicode[STIX]{x1D6FA})$
for some
$s>5/2$
, then for all
$$\begin{eqnarray}B_{h}(u,v_{h})=2\mathop{\sum }_{K\in {\mathcal{T}}_{h}}\int _{K}\unicode[STIX]{x1D6E5}u\unicode[STIX]{x1D6E5}v_{h}\end{eqnarray}$$
$v_{h}\in X_{h}^{\mathit{dg}}$
.
-
∙ Coercivity. For any
$\unicode[STIX]{x1D705}>1$
, there exists a
$\unicode[STIX]{x1D707}_{\ast }=C\unicode[STIX]{x1D705}/(\unicode[STIX]{x1D705}-1)$
with
$C>0$
depending only on the shape-regularity of
${\mathcal{T}}_{h}$
and
$k$
such that for
$\unicode[STIX]{x1D707}\geq \unicode[STIX]{x1D707}_{\ast }$
, (4.16)for some constant
$$\begin{eqnarray}2\Vert v_{h}\Vert _{\mathit{DG}(1/2)}^{2}\leq \unicode[STIX]{x1D705}B_{h}(v_{h},v_{h}),\quad \text{for all}~v_{h}\in X_{h}^{\mathit{dg}},\end{eqnarray}$$
$c_{\ast }>0$
independent of the discretization parameter
$h$
and polynomial degree
$k$
.


The properties of
 $B_{h}(\cdot ,\cdot )$
shown above allow us to define the following DG method: find
 $u_{h}\in X_{h}^{\mathit{dg}}$
such that, for all
 $v_{h}\in X_{h}^{\mathit{dg}}$
,
 $$\begin{eqnarray}\displaystyle a_{h}^{\mathit{DG}}(u_{h},v_{h}) & := & \displaystyle \mathop{\sum }_{K\in {\mathcal{T}}_{h}}\int _{K}\unicode[STIX]{x1D6FE}({\mathcal{L}}u_{h}-\unicode[STIX]{x1D6E5}u_{h})\unicode[STIX]{x1D6E5}v_{h}+\displaystyle \frac{1}{2}B_{h}(u_{h},v_{h})\nonumber\\ \displaystyle & = & \displaystyle \mathop{\sum }_{K\in {\mathcal{T}}_{h}}\int _{K}\unicode[STIX]{x1D6FE}f\unicode[STIX]{x1D6E5}v_{h}.\end{eqnarray}$$
Due to the consistency of
 $B_{h}(\cdot ,\cdot )$
we see that the scheme is consistent provided the exact solution is sufficiently smooth. If
 $u$
is the solution to (4.1) and satisfies
 $u\in H^{s}(\unicode[STIX]{x1D6FA})$
for some
 $s>5/2$
, then
 $a_{h}^{\mathit{DG}}(u,v_{h})=\int _{\unicode[STIX]{x1D6FA}}\unicode[STIX]{x1D6FE}f\unicode[STIX]{x1D6E5}_{h}v_{h}$
for all
 $v_{h}\in X_{h}^{\mathit{dg}}$
. In addition, the coercivity of
 $B_{h}(\cdot ,\cdot )$
implies the coercivity of
 $a_{h}^{\mathit{DG}}(\cdot ,\cdot )$
; see Smears and Süli (Reference Smears and Süli2013, Theorem 8).
Lemma 4.8 (coercivity).
Suppose that
 $\unicode[STIX]{x1D6FA}\subset \mathbb{R}^{d}$
is convex and that
 $A$
satisfies the Cordes condition (2.15). Then there exists
 $\unicode[STIX]{x1D707}_{\ast }=O(\unicode[STIX]{x1D716}^{-1})>0$
such that
 $$\begin{eqnarray}C\Vert v_{h}\Vert _{\mathit{DG}(1)}^{2}\leq a_{h}^{\mathit{DG}}(v_{h},v_{h}),\quad \text{for all}~v_{h}\in X_{h}^{\mathit{dg}}.\end{eqnarray}$$
Consequently, there exists a unique solution
 $u_{h}\in X_{h}^{\mathit{dg}}$
to (4.17).
Combined with consistency of
 $a_{h}^{\mathit{DG}}(\cdot ,\cdot )$
, Lemma 4.8 implies quasi-optimal error estimates in the discrete
 $H^{2}$
-type norm Smears and Süli (Reference Smears and Süli2013, Theorem 9).
Theorem 4.9 (existence and error estimates).
Suppose the hypotheses of Lemma 4.8 hold. Further, suppose that the solution to (4.1) satisfies
 $u\in H^{s}(\unicode[STIX]{x1D6FA})$
for some
 $5/2<s\leq k+1$
. Then there exists an
 $h$
-independent constant
 $C>0$
such that
 $$\begin{eqnarray}\Vert u-u_{h}\Vert _{\mathit{DG}(1)}\leq Ch^{s-2}\Vert u\Vert _{H^{s}(\unicode[STIX]{x1D6FA})}.\end{eqnarray}$$
Remark 4.10 (regularity).
The regularity assumption
 $u\in H^{s}(\unicode[STIX]{x1D6FA})$
with
 $s>5/2$
ensures that
 $a_{h}^{\mathit{DG}}(u,v_{h})$
is well-defined.
Remark 4.11 (extensions).
Wang and Wang (Reference Wang and Wang2017) recently proposed and analysed a primal–dual discontinuous Galerkin method for second-order elliptic equations in non-divergence form.
4.2 Discrete finite element Calderón–Zygmund estimates
In this section we describe finite element discretizations to non-divergence-form elliptic operators based on the notion and theory of strong solutions. Recall from Definition 2.28 that a function
 $u\in W^{2,p}(\unicode[STIX]{x1D6FA})$
is a strong solution to (4.1) if the equation and boundary conditions hold almost everywhere in
 $\bar{\unicode[STIX]{x1D6FA}}$
. Such solutions exist provided the data is sufficiently regular and
 $A\in C(\bar{\unicode[STIX]{x1D6FA}},\mathbb{S}^{d})$
; see Theorem 2.29. This result is obtained by using the Calderón–Zygmund decomposition technique when
 $A=I$
, and then extended to general
 ${\mathcal{L}}$
using the continuity of the coefficient matrix. In this section, we develop a discrete version of this theory to develop a priori estimates and convergence results of finite element solutions. Let us first present the derivation of the method.
Assume for the moment that the coefficient matrix
 $A$
in (4.1) is sufficiently smooth. Then, as explained in Example 2.8, we can write problem (4.1) in divergence form:
 $$\begin{eqnarray}D\cdot (ADu)-(D\cdot A)\cdot Du=f\quad \text{in }\unicode[STIX]{x1D6FA}.\end{eqnarray}$$
A standard finite element method for this problem (without stabilization) reads as follows: find
 $u_{h}\in X_{h}^{cg}$
such that
 $$\begin{eqnarray}-\int _{\unicode[STIX]{x1D6FA}}(ADu_{h})\cdot Dv_{h}-\int _{\unicode[STIX]{x1D6FA}}((D\cdot A)\cdot Du_{h})v_{h}=\int _{\unicode[STIX]{x1D6FA}}fv_{h},\quad \text{for all}~v_{h}\in X_{h}^{cg},\end{eqnarray}$$
where
 $X_{h}^{cg}\subset H_{0}^{1}(\unicode[STIX]{x1D6FA})$
is the Lagrange finite element space of degree
 $k\geq 1$
defined by (3.34). It is well known that, for
 $h$
sufficiently small, there exists a unique solution to (4.18).
If
 $A$
is not sufficiently smooth and/or if the locations of the singularities are complex/unknown, then the classical finite element method (4.18) is not viable due to the differential operators acting on
 $A$
. However, we easily circumvent this issue by using the integration-by-parts identity
 $$\begin{eqnarray}\int _{\unicode[STIX]{x1D6FA}}\boldsymbol{\unicode[STIX]{x1D70F}}\cdot Dv_{h}=-\mathop{\sum }_{K\in {\mathcal{T}}_{h}}\int _{K}(D\cdot \boldsymbol{\unicode[STIX]{x1D70F}})v_{h}+\mathop{\sum }_{F\in {\mathcal{F}}_{h}^{I}}\int _{F}[\!\!\;[\!\!\;\boldsymbol{\unicode[STIX]{x1D70F}}\!\!\;]\!\!\;]v_{h},\end{eqnarray}$$
which holds for all piecewise smooth
 $\boldsymbol{\unicode[STIX]{x1D70F}}$
and
 $v_{h}\in X_{h}^{cg}$
. Taking
 $\boldsymbol{\unicode[STIX]{x1D70F}}=ADu_{h}$
and applying the product rule yields
 $$\begin{eqnarray}\displaystyle -\int _{\unicode[STIX]{x1D6FA}}(ADu_{h})\cdot Dv_{h} & = & \displaystyle \mathop{\sum }_{K\in {\mathcal{T}}_{h}}\int _{K}(A:D^{2}u_{h})v_{h}\nonumber\\ \displaystyle & & \displaystyle \qquad +\,\int _{\unicode[STIX]{x1D6FA}}((D\cdot A)\cdot Du_{h})v_{h}+\mathop{\sum }_{F\in {\mathcal{F}}_{h}^{I}}\int _{F}[\!\!\;[\!\!\;ADu_{h}\!\!\;]\!\!\;]v_{h}.\nonumber\end{eqnarray}$$
Substituting this identity into the (ill-posed) formulation leads to the finite element method
 $$\begin{eqnarray}b_{h}(u_{h},v_{h}):=\mathop{\sum }_{K\in {\mathcal{T}}_{h}}\int _{K}(A:D^{2}u_{h})v_{h}-\mathop{\sum }_{F\in {\mathcal{F}}_{h}^{I}}\int _{F}[\!\!\;[\!\!\;ADu_{h}\!\!\;]\!\!\;]v_{h}=\int _{\unicode[STIX]{x1D6FA}}fv_{h}\end{eqnarray}$$
for all
 $v_{h}\in X_{h}^{cg}$
. In contrast to (4.18), the formulation (4.19) is well-defined for non-differentiable
 $A$
. Furthermore, by reversing the arguments, we see that (4.19) is equivalent to (4.18) if
 $A$
is sufficiently smooth. In particular, when
 $A(x)\equiv \bar{A}$
is a constant SPD matrix, the method (4.19) reduces to the (well-posed) problem
 $$\begin{eqnarray}b_{h,0}(u_{h},v_{h}):=-\int _{\unicode[STIX]{x1D6FA}}(\bar{A}Du_{h})\cdot Dv_{h}=\int _{\unicode[STIX]{x1D6FA}}fv_{h},\quad \text{for all}~v_{h}\in X_{h}^{cg}.\end{eqnarray}$$
We point out that method (4.19) is consistent and meaningful in the piecewise linear case
 $(k=1)$
.
While the derivation of the finite element method (4.19) is relatively simple, a stability and convergence analysis of the method is less obvious. The key difficulty is that integration by parts is not at our disposal, and it is unclear whether a clever choice of test function will render a coercivity or inf-sup condition. Rather, the stability analysis of (4.19) mimics the techniques found in the PDE theory, where Calderón–Zygmund estimates are the essential tools.
To describe the stability and convergence theory, we first define a discrete
 $W^{2,p}$
-type norm:
 $$\begin{eqnarray}\Vert v\Vert _{W_{h}^{2,p}(\unicode[STIX]{x1D6FA})}^{p}:=\mathop{\sum }_{K\in {\mathcal{T}}_{h}}\Vert D^{2}v\Vert _{L^{p}(K)}^{p}+\mathop{\sum }_{F\in {\mathcal{F}}_{h}^{I}}h_{F}^{1-p}\Vert [\!\!\;[\!\!\;Dv\!\!\;]\!\!\;]\Vert _{L^{p}(F)}^{p},\quad \text{for }1<p<\infty .\end{eqnarray}$$
A discrete Calderón–Zygmund-type estimate with respect to this norm in the case of constant coefficients is now given.
Lemma 4.12 (discrete Calderón–Zygmund estimate).
Let
 $L$
be the elliptic, divergence-form operator (2.4), where the coefficient matrix
 $A$
is constant and SPD. Suppose that the a priori estimate
 $C\Vert w\Vert _{W^{2,p}(\unicode[STIX]{x1D6FA})}\leq \Vert Lw\Vert _{L^{p}(\unicode[STIX]{x1D6FA})}$
is satisfied for all
 $w\in W^{2,p}(\unicode[STIX]{x1D6FA})\cap W_{0}^{1,p}(\unicode[STIX]{x1D6FA})$
. Let
 $b_{h,0}(\cdot ,\cdot )$
be defined by (4.20). Then, for
 $h$
sufficiently small,
 $$\begin{eqnarray}C\Vert v_{h}\Vert _{W_{h}^{2,p}(\unicode[STIX]{x1D6FA})}\leq \sup _{w_{h}\in X_{h}^{cg}\backslash \{0\}}\displaystyle \frac{b_{h,0}(v_{h},w_{h})}{\Vert w_{h}\Vert _{L^{p^{\prime }}(\unicode[STIX]{x1D6FA})}},\quad \text{for all}~v_{h}\in X_{h}^{cg},\end{eqnarray}$$
where
 $1/p+1/p^{\prime }=1$
.
Proof. We prove the simpler case
 $p=2$
, and refer the reader to Feng, Hennings and Neilan (Reference Feng, Hennings and Neilan2017, Lemma 2.6) and Neilan (Reference Neilan2013, Lemma 4.1) for general
 $p\in (1,\infty )$
.
First, let
 ${\mathcal{B}}_{h}(v_{h})\in X_{h}^{cg}$
be the unique solution to the problem
 $$\begin{eqnarray}\int _{\unicode[STIX]{x1D6FA}}{\mathcal{B}}_{h}(v_{h})w_{h}\,dx=b_{h,0}(v_{h},w_{h}),\quad \text{for all}~w_{h}\in X_{h}^{cg},\end{eqnarray}$$
and let
 $\unicode[STIX]{x1D711}\in H_{0}^{1}(\unicode[STIX]{x1D6FA})$
be the unique (weak) solution to
 $L\unicode[STIX]{x1D711}=-{\mathcal{B}}_{h}(v_{h})$
in
 $\unicode[STIX]{x1D6FA}$
. Then, for
 $w_{h}\in X_{h}^{cg}$
, we find
 $$\begin{eqnarray}b_{h,0}(v_{h},w_{h})=\int _{\unicode[STIX]{x1D6FA}}{\mathcal{B}}_{h}(v_{h})w_{h}=-\int _{\unicode[STIX]{x1D6FA}}(AD\unicode[STIX]{x1D711})\cdot Dw_{h}=b_{h,0}(\unicode[STIX]{x1D711},w_{h}).\end{eqnarray}$$
Thus,
 $v_{h}$
is the elliptic projection of
 $\unicode[STIX]{x1D711}$
with respect to
 $b_{h,0}(\cdot ,\cdot )$
. Therefore, Céa’s lemma and the hypothesis
 $\unicode[STIX]{x1D711}\in H^{2}(\unicode[STIX]{x1D6FA})$
with
 $$\begin{eqnarray}\Vert \unicode[STIX]{x1D711}\Vert _{H^{2}(\unicode[STIX]{x1D6FA})}\leq C\Vert {\mathcal{B}}_{h}(v_{h})\Vert _{L^{2}(\unicode[STIX]{x1D6FA})}\end{eqnarray}$$
yield
 $$\begin{eqnarray}\Vert \unicode[STIX]{x1D711}-v_{h}\Vert _{H^{1}(\unicode[STIX]{x1D6FA})}\leq Ch\Vert \unicode[STIX]{x1D711}\Vert _{H^{2}(\unicode[STIX]{x1D6FA})}\leq Ch\Vert {\mathcal{B}}_{h}(v_{h})\Vert _{L^{2}(\unicode[STIX]{x1D6FA})}.\end{eqnarray}$$
Next, for any
 $\unicode[STIX]{x1D711}_{h}\in X_{h}^{cg}$
, the triangle inequality and a scaling argument show that
 $$\begin{eqnarray}\displaystyle & & \displaystyle \Vert v_{h}\Vert _{H_{h}^{2}(\unicode[STIX]{x1D6FA})}\leq \Vert v_{h}-\unicode[STIX]{x1D711}_{h}\Vert _{H_{h}^{2}(\unicode[STIX]{x1D6FA})}+\Vert \unicode[STIX]{x1D711}_{h}-\unicode[STIX]{x1D711}\Vert _{H_{h}^{2}(\unicode[STIX]{x1D6FA})}+\Vert \unicode[STIX]{x1D711}\Vert _{H_{h}^{2}(\unicode[STIX]{x1D6FA})}\nonumber\\ \displaystyle & & \displaystyle \quad \leq \,Ch^{-1}(\Vert v_{h}-\unicode[STIX]{x1D711}\Vert _{H^{1}(\unicode[STIX]{x1D6FA})}+\Vert \unicode[STIX]{x1D711}-\unicode[STIX]{x1D711}_{h}\Vert _{H^{1}(\unicode[STIX]{x1D6FA})})+\Vert \unicode[STIX]{x1D711}_{h}-\unicode[STIX]{x1D711}\Vert _{H_{h}^{2}(\unicode[STIX]{x1D6FA})}+\Vert \unicode[STIX]{x1D711}\Vert _{H^{2}(\unicode[STIX]{x1D6FA})}.\nonumber\end{eqnarray}$$
By taking
 $\unicode[STIX]{x1D711}_{h}$
to be the nodal interpolant of
 $\unicode[STIX]{x1D711}$
and applying (4.21) and the definition of
 ${\mathcal{B}}_{h}(v_{h})$
, we obtain
 $$\begin{eqnarray}\displaystyle \Vert v_{h}\Vert _{H_{h}^{2}(\unicode[STIX]{x1D6FA})} & \leq & \displaystyle C[h^{-1}\Vert v_{h}-\unicode[STIX]{x1D711}\Vert _{H^{1}(\unicode[STIX]{x1D6FA})}+\Vert \unicode[STIX]{x1D711}\Vert _{H^{2}(\unicode[STIX]{x1D6FA})}]\leq C\Vert {\mathcal{B}}_{h}(v_{h})\Vert _{L^{2}(\unicode[STIX]{x1D6FA})}\nonumber\\ \displaystyle & = & \displaystyle C\sup _{w_{h}\in X_{h}^{cg}\backslash \{0\}}\displaystyle \frac{\int _{\unicode[STIX]{x1D6FA}}{\mathcal{B}}_{h}(v_{h})w_{h}}{\Vert w_{h}\Vert _{L^{2}(\unicode[STIX]{x1D6FA})}}=C\sup _{w_{h}\in X_{h}^{cg}\backslash \{0\}}\displaystyle \frac{b_{h,0}(v_{h},w_{h})}{\Vert w_{h}\Vert _{L^{2}(\unicode[STIX]{x1D6FA})}}.\nonumber\end{eqnarray}$$
Remark 4.13 (
$p=2$
).

Note that when
 $\unicode[STIX]{x1D6FA}$
is convex, the assumptions of Lemma 4.12 hold for
 $p=2$
.
A corollary of this result is a local stability estimate of the discrete adjoint problem.
Corollary 4.14 (local stability).
For a domain
 $D\subset \unicode[STIX]{x1D6FA}$
, let
 $\unicode[STIX]{x1D70C}_{D}$
denote the radius of the largest ball inscribed in
 $D$
, and let
 $X_{h}^{cg}(D)$
denote the set of functions in
 $X_{h}^{cg}$
that vanish outside
 $D$
. Suppose that the hypothesis of Lemma 4.12 are satisfied. Then, if
 $h$
and
 $\unicode[STIX]{x1D70C}_{D}$
are sufficiently small,
 $$\begin{eqnarray}C\Vert w_{h}\Vert _{L^{p^{\prime }}(D)}\leq \sup _{v_{h}\in X_{h}^{cg}(D_{h})\backslash \{0\}}\displaystyle \frac{b_{h}(v_{h},w_{h})}{\Vert v_{h}\Vert _{W_{h}^{2,p}(D_{h})}},\quad \text{for all}~w_{h}\in X_{h}^{cg}(D).\end{eqnarray}$$
with
 $D_{h}=\{x\in \unicode[STIX]{x1D6FA}:\text{dist}(x,D)\leq h\}$
.
Proof. Again, we prove the case
 $p=p^{\prime }=2$
and refer the reader to Feng et al. (Reference Feng, Hennings and Neilan2017, Appendix B) for the general result.
Let
 $w_{h}\in X_{h}^{cg}(D)$
, and let
 $\unicode[STIX]{x1D711}_{h}\in X_{h}^{cg}$
satisfy
 $$\begin{eqnarray}b_{h,0}(\unicode[STIX]{x1D711}_{h},v_{h})=\int _{\unicode[STIX]{x1D6FA}}w_{h}v_{h},\quad \text{for all}~v_{h}\in X_{h}^{cg},\end{eqnarray}$$
where
 $b_{h,0}(\cdot ,\cdot )$
is defined by (4.20) with
 $$\begin{eqnarray}\bar{A}=\displaystyle \frac{1}{|D|}\int _{D}A.\end{eqnarray}$$
Taking
 $v_{h}=w_{h}$
in the method yields
 $$\begin{eqnarray}\Vert w_{h}\Vert _{L^{2}(D)}^{2}=b_{h,0}(\unicode[STIX]{x1D711}_{h},w_{h})=b_{h}(\unicode[STIX]{x1D711}_{h},w_{h})+(b_{h,0}(\unicode[STIX]{x1D711}_{h},w_{h})-b_{h}(\unicode[STIX]{x1D711}_{h},w_{h})).\end{eqnarray}$$
Using the (uniform) continuity of
 $A$
, for any
 $\unicode[STIX]{x1D70F}>0$
, we have
 $$\begin{eqnarray}|b_{h,0}(\unicode[STIX]{x1D711}_{h},w_{h})-b_{h}(\unicode[STIX]{x1D711}_{h},w_{h})|\leq \unicode[STIX]{x1D70F}\Vert \unicode[STIX]{x1D711}_{h}\Vert _{H_{h}^{2}(\unicode[STIX]{x1D6FA})}\Vert w_{h}\Vert _{L^{2}(D)}\end{eqnarray}$$
provided
 $\unicode[STIX]{x1D70C}_{D}$
is sufficiently small.
Applying the estimate
 $$\begin{eqnarray}\Vert \unicode[STIX]{x1D711}_{h}\Vert _{H_{h}^{2}(\unicode[STIX]{x1D6FA})}\leq C\Vert w_{h}\Vert _{L^{2}(\unicode[STIX]{x1D6FA})}=C\Vert w_{h}\Vert _{L^{2}(D)}\end{eqnarray}$$
established in Theorem 4.12, we obtain
 $$\begin{eqnarray}\displaystyle (1-C\unicode[STIX]{x1D70F})\Vert w_{h}\Vert _{L^{2}(D)}^{2} & \leq & \displaystyle b_{h}(\unicode[STIX]{x1D711}_{h},w_{h})=\biggl(\displaystyle \frac{b_{h}(\unicode[STIX]{x1D711}_{h},w_{h})}{\Vert \unicode[STIX]{x1D711}_{h}\Vert _{H_{h}^{2}(D_{h})}}\biggr)\Vert \unicode[STIX]{x1D711}\Vert _{H_{h}^{2}(\unicode[STIX]{x1D6FA})}\nonumber\\ \displaystyle & \leq & \displaystyle C\biggl(\sup _{v_{h}\in X_{h}^{cg}(D_{h})\backslash \{0\}}\displaystyle \frac{b_{h}(v_{h},w_{h})}{\Vert v_{h}\Vert _{H_{h}^{2}(D_{h})}}\biggr)\Vert w_{h}\Vert _{L^{2}(\unicode[STIX]{x1D6FA})}.\nonumber\end{eqnarray}$$
Taking
 $\unicode[STIX]{x1D70F}$
sufficiently small and manipulating terms in the last inequality yields the result.
The local stability result for the discrete adjoint problem given in Corollary 4.14 leads to a stability estimate for method (4.19).
Theorem 4.15 (global stability).
Suppose that
 $A\in C(\bar{\unicode[STIX]{x1D6FA}},\mathbb{S}^{d})$
, and that elliptic and divergence-form operators with constant coefficients inherit
 $W^{2,p}$
-regularity
 $(1<p<\infty )$
. Then there exists
 $h_{\ast }>0$
depending on the modulus of continuity of
 $A$
and
 $p$
such that, for
 $h\leq h_{\ast }$
,
 $$\begin{eqnarray}C\Vert v_{h}\Vert _{W_{h}^{2,p}(\unicode[STIX]{x1D6FA})}\leq \sup _{w_{h}\in X_{h}^{cg}\backslash \{0\}}\displaystyle \frac{b_{h}(v_{h},w_{h})}{\Vert w_{h}\Vert _{L^{p^{\prime }}(\unicode[STIX]{x1D6FA})}},\quad \text{for all}~v_{h}\in X_{h}^{cg}.\end{eqnarray}$$
Proof. We outline the main steps of the proof and refer to Feng et al. (Reference Feng, Hennings and Neilan2017) for details.
Combining Corollary 4.14 with cut-off functions techniques and a covering argument leads to the Gärding-type inequality
 $$\begin{eqnarray}C\Vert w_{h}\Vert _{L^{p^{\prime }}(\unicode[STIX]{x1D6FA})}\leq \sup _{v_{h}\in X_{h}^{cg}\backslash \{0\}}\displaystyle \frac{b_{h}(v_{h},w_{h})}{\Vert v_{h}\Vert _{W_{h}^{2,p}(\unicode[STIX]{x1D6FA})}}+\Vert w_{h}\Vert _{W^{-1,p^{\prime }}(\unicode[STIX]{x1D6FA})},\quad \text{for all}~w_{h}\in X_{h}^{cg}.\end{eqnarray}$$
A standard duality argument then shows that, for
 $h$
sufficiently small,
 $$\begin{eqnarray}C\Vert w_{h}\Vert _{L^{p^{\prime }}(\unicode[STIX]{x1D6FA})}\leq \sup _{v_{h}\in X_{h}^{cg}\backslash \{0\}}\displaystyle \frac{b_{h}(v_{h},w_{h})}{\Vert v_{h}\Vert _{W_{h}^{2,p}(\unicode[STIX]{x1D6FA})}},\quad \text{for all}~w_{h}\in X_{h}^{cg}.\end{eqnarray}$$
This estimate shows that, for fixed
 $v_{h}\in X_{h}^{cg}$
, there exists a unique
 $w_{h}\in X_{h}^{cg}$
satisfying
 $$\begin{eqnarray}\displaystyle b_{h}(z_{h},w_{h}) & = & \displaystyle \mathop{\sum }_{K\in {\mathcal{T}}_{h}}\int _{K}|D^{2}v_{h}|^{p-2}D^{2}v_{h}:D^{2}z_{h}\nonumber\\ \displaystyle & & \displaystyle \qquad +\,\mathop{\sum }_{F\in {\mathcal{F}}_{h}}h_{F}^{-1}\int _{F}|[\!\!\;[\!\!\;Dv_{h}\!\!\;]\!\!\;]|^{p-2}[\!\!\;[\!\!\;Dv_{h}\!\!\;]\!\!\;][\!\!\;[\!\!\;Dz_{h}\!\!\;]\!\!\;],\quad \text{for all}~z_{h}\in X_{h}^{cg}.\end{eqnarray}$$
Applying the global stability estimate for the adjoint problem and Hölder’s inequality, we obtain
 $$\begin{eqnarray}C\Vert w_{h}\Vert _{L^{p^{\prime }}(\unicode[STIX]{x1D6FA})}\leq \sup _{z_{h}\in X_{h}^{cg}\backslash \{0\}}\displaystyle \frac{b_{h}(z_{h},w_{h})}{\Vert z_{h}\Vert _{W_{h}^{2,p}(\unicode[STIX]{x1D6FA})}}\leq C\Vert v_{h}\Vert _{W_{h}^{2,p}(\unicode[STIX]{x1D6FA})}^{p-1}.\end{eqnarray}$$
On the other hand, setting
 $z_{h}=v_{h}$
in (4.23) yields
 $$\begin{eqnarray}\displaystyle \Vert v_{h}\Vert _{W_{h}^{2,p}(\unicode[STIX]{x1D6FA})}^{p} & = & \displaystyle b_{h}(v_{h},w_{h})\leq \biggl(\sup _{z_{h}\in X_{h}^{cg}\backslash \{0\}}\displaystyle \frac{b_{h}(v_{h},z_{h})}{\Vert z_{h}\Vert _{L^{p^{\prime }}(\unicode[STIX]{x1D6FA})}}\biggr)\Vert w_{h}\Vert _{L^{p^{\prime }}(\unicode[STIX]{x1D6FA})}\nonumber\\ \displaystyle & \leq & \displaystyle C\biggl(\sup _{z_{h}\in X_{h}^{cg}\backslash \{0\}}\displaystyle \frac{b_{h}(v_{h},z_{h})}{\Vert z_{h}\Vert _{L^{p^{\prime }}(\unicode[STIX]{x1D6FA})}}\biggr)\Vert v_{h}\Vert _{W_{h}^{2,p}(\unicode[STIX]{x1D6FA})}^{p-1}.\nonumber\end{eqnarray}$$
Dividing by
 $\Vert v_{h}\Vert _{W_{h}^{2,p}(\unicode[STIX]{x1D6FA})}$
, we obtain (4.22).
Theorem 4.16 (existence and error estimates).
Suppose that the hypotheses of Theorem 4.15 are satisfied. Then there exists a unique solution
 $u_{h}\in X_{h}^{cg}$
to (4.19). If the solution to (4.1) satisfies
 $u\in W^{s,p}(\unicode[STIX]{x1D6FA})$
for
 $2\leq s\leq k+1$
, then
 $$\begin{eqnarray}\Vert u-u_{h}\Vert _{W_{h}^{2,p}(\unicode[STIX]{x1D6FA})}\leq Ch^{s-2}\Vert u\Vert _{W^{s,p}(\unicode[STIX]{x1D6FA})}.\end{eqnarray}$$
Proof. The existence and uniqueness of a solution to (4.19) follows from the stability estimate (4.22). The error estimate follows from the stability and continuity of the bilinear form
 $b_{h}(\cdot ,\cdot )$
, the consistency of the scheme, and approximation properties of
 $X_{h}^{cg}$
with respect to the discrete
 $W^{2,p}$
-norm.
Remark 4.17 (extensions).
The ideas and analysis presented in this section has been extended to discontinuous Galerkin methods Feng, Neilan and Schnake (Reference Feng, Neilan and Schnake2016) and mixed finite element methods Lakkis and Pryer (Reference Lakkis and Pryer2011), Neilan (Reference Neilan2017).
4.3 Finite element method based on integro-differential approximation
In this section we consider a two-scale finite element discretization for problem (4.1) developed in Nochetto and Zhang (Reference Nochetto and Zhang2017a
), which is based on a regularized, integro-differential approximation proposed in Caffarelli and Silvestre (Reference Caffarelli and Silvestre2010b
). As in the previous sections we assume that the PDE operator
 ${\mathcal{L}}$
is uniformly elliptic, that is, there exist strictly positive constants
 $\unicode[STIX]{x1D706},\unicode[STIX]{x1D6EC}$
satisfying
 $\unicode[STIX]{x1D706}I\leq A(x)\leq \unicode[STIX]{x1D6EC}(x)I$
, for all
 $x\in \bar{\unicode[STIX]{x1D6FA}}$
. We further make the simplifying assumption that
 $A\in C(\bar{\unicode[STIX]{x1D6FA}},\mathbb{S}^{d})$
, and make remarks when this regularity can be relaxed.
To explain and motivate the method, we first perform some algebraic manipulations, and rewrite the PDE as
 $$\begin{eqnarray}A:D^{2}u=\displaystyle \frac{\unicode[STIX]{x1D706}}{2}\unicode[STIX]{x1D6E5}u+A_{\unicode[STIX]{x1D706}}^{2}:D^{2}u,\quad A_{\unicode[STIX]{x1D706}}:=\biggl(A-\displaystyle \frac{\unicode[STIX]{x1D706}}{2}I\biggr)^{1/2}.\end{eqnarray}$$
Let
 $\unicode[STIX]{x1D711}$
be a radially symmetric function with compact support in the unit ball satisfying
 $\int _{\mathbb{R}^{d}}|z|^{2}\unicode[STIX]{x1D711}(z)=d$
. We then find that
 $$\begin{eqnarray}\int _{\mathbb{R}^{d}}z_{i}z_{j}\unicode[STIX]{x1D711}(z)=0\quad \text{for }i\neq j,\quad \text{and}\quad \int _{\mathbb{R}^{d}}z_{i}^{2}\unicode[STIX]{x1D711}(z)=1.\end{eqnarray}$$
Consequently, we have
 $$\begin{eqnarray}\int _{\mathbb{R}^{d}}z\otimes z\unicode[STIX]{x1D711}(z)=I,\end{eqnarray}$$
and therefore
 $$\begin{eqnarray}(A_{\unicode[STIX]{x1D706}}(x))^{2}:D^{2}u(x)=A_{\unicode[STIX]{x1D706}}(x)\biggl(\int _{\mathbb{ R}^{d}}z\otimes z\unicode[STIX]{x1D711}(z)\biggr)A_{\unicode[STIX]{x1D706}}(x):D^{2}u(x).\end{eqnarray}$$
For a regularization parameter
 $\unicode[STIX]{x1D716}>0$
, we make the change of variables
 $y=\unicode[STIX]{x1D716}A_{\unicode[STIX]{x1D706}}(x)z$
in the integral to obtain
 $$\begin{eqnarray}(A_{\unicode[STIX]{x1D706}}(x))^{2}:D^{2}u(x)=\int _{\mathbb{ R}^{d}}\displaystyle \frac{(y\otimes y):D^{2}u(x)}{\unicode[STIX]{x1D716}^{d+2}\det (A_{\unicode[STIX]{x1D706}}(x))}\unicode[STIX]{x1D711}\biggl(\displaystyle \frac{A_{\unicode[STIX]{x1D706}}^{-1}(x)y}{\unicode[STIX]{x1D716}}\biggr).\end{eqnarray}$$
Set
 $$\begin{eqnarray}Q=\biggl(\unicode[STIX]{x1D6EC}-\displaystyle \frac{\unicode[STIX]{x1D706}}{2}\biggr)^{1/2},\quad \unicode[STIX]{x1D6FA}_{\unicode[STIX]{x1D716}}=\{x\in \unicode[STIX]{x1D6FA}:\text{dist}(x,\unicode[STIX]{x2202}\unicode[STIX]{x1D6FA})>Q\unicode[STIX]{x1D716}\},\quad \unicode[STIX]{x1D714}_{\unicode[STIX]{x1D716}}=\unicode[STIX]{x1D6FA}\backslash \unicode[STIX]{x1D6FA}_{\unicode[STIX]{x1D716}},\end{eqnarray}$$
and note that
 $\unicode[STIX]{x1D711}(A_{\unicode[STIX]{x1D706}}^{-1}(x)y/\unicode[STIX]{x1D716})$
has support in the ball
 $B_{Q\unicode[STIX]{x1D716}}(0)$
. For
 $x\in \unicode[STIX]{x1D6FA}$
, let
 $\unicode[STIX]{x1D703}=\unicode[STIX]{x1D703}(x)\in (0,1]$
be the largest number such that
 $x\pm \unicode[STIX]{x1D703}y\in \unicode[STIX]{x1D6FA}$
for all
 $y\in B_{Q\unicode[STIX]{x1D716}}(0)$
. Recall that the second difference operator is given by
 $$\begin{eqnarray}\unicode[STIX]{x1D6FF}_{y,\unicode[STIX]{x1D703}}^{2}u(x):=\frac{u(x+\unicode[STIX]{x1D703}y)-2u(x)+u(x-\unicode[STIX]{x1D703}y)}{\unicode[STIX]{x1D703}^{2}},\end{eqnarray}$$
and note that
 $\unicode[STIX]{x1D6FF}_{\unicode[STIX]{x1D703}y,\unicode[STIX]{x1D703}}^{2}u(x)=(y\otimes y):D^{2}u(x)$
if
 $u$
is a quadratic polynomial, and that
 $\unicode[STIX]{x1D703}=1$
for
 $x\in \unicode[STIX]{x1D6FA}_{\unicode[STIX]{x1D716}}$
.
Combining these calculations and identities, we are led to the approximation
 $$\begin{eqnarray}(A_{\unicode[STIX]{x1D706}}(x))^{2}:D^{2}u(x)\approx \int _{\mathbb{ R}^{d}}\displaystyle \frac{|y|^{2}\unicode[STIX]{x1D6FF}_{\unicode[STIX]{x1D703}y,\unicode[STIX]{x1D703}}^{2}u(x)}{\unicode[STIX]{x1D716}^{d+2}\det (A_{\unicode[STIX]{x1D706}}(x))}\unicode[STIX]{x1D711}\biggl(\displaystyle \frac{A_{\unicode[STIX]{x1D706}}^{-1}(x)y}{\unicode[STIX]{x1D716}}\biggr)=:I_{\unicode[STIX]{x1D716}}u(x).\end{eqnarray}$$
The approximation is quantified in the next lemma Nochetto and Zhang (Reference Nochetto and Zhang2017a , Lemma 2.1).
Lemma 4.18 (rate of convergence of integral transform).
Let
 $I_{\unicode[STIX]{x1D716}}$
be the integral operator defined by (4.26), and let
 $U_{Q\unicode[STIX]{x1D716}}(x):=\bar{B}_{Q\unicode[STIX]{x1D716}}(x)\cap \bar{\unicode[STIX]{x1D6FA}}$
.
-
∙ If
$u\in C^{2}(\bar{\unicode[STIX]{x1D6FA}})$
, then for all
$$\begin{eqnarray}I_{\unicode[STIX]{x1D716}}u(x)\rightarrow \biggl(A(x)-\displaystyle \frac{\unicode[STIX]{x1D706}}{2}I\biggr):D^{2}u(x)\quad \text{as }\unicode[STIX]{x1D716}\rightarrow 0^{+},\end{eqnarray}$$
$x\in \unicode[STIX]{x1D6FA}$
.
-
∙ If
$u\in C^{2,\unicode[STIX]{x1D6FC}}(U_{Q\unicode[STIX]{x1D716}}(x))$
for some
$\unicode[STIX]{x1D6FC}\in (0,1]$
, then for all
$$\begin{eqnarray}\biggl|I_{\unicode[STIX]{x1D716}}u(x)-\biggl(A(x)-\displaystyle \frac{\unicode[STIX]{x1D706}}{2}I\biggr):D^{2}u(x)\biggr|\leq C\Vert u\Vert _{C^{2,\unicode[STIX]{x1D6FC}}(U_{Q\unicode[STIX]{x1D716}})}\unicode[STIX]{x1D703}^{\unicode[STIX]{x1D6FC}}\unicode[STIX]{x1D716}^{\unicode[STIX]{x1D6FC}},\end{eqnarray}$$
$x\in \unicode[STIX]{x1D6FA}$
.





We approximate equation (4.1) by the integro-differential equation
 $$\begin{eqnarray}{\mathcal{L}}^{\unicode[STIX]{x1D716}}u^{\unicode[STIX]{x1D716}}:=\displaystyle \frac{\unicode[STIX]{x1D706}}{2}\unicode[STIX]{x1D6E5}u^{\unicode[STIX]{x1D716}}+I_{\unicode[STIX]{x1D716}}u^{\unicode[STIX]{x1D716}}=f\quad \text{in }\unicode[STIX]{x1D6FA}.\end{eqnarray}$$
We refer the reader to Caffarelli and Silvestre (Reference Caffarelli and Silvestre2010b
) for details about the existence, uniqueness and regularity estimates of solution
 $u^{\unicode[STIX]{x1D716}}$
.
We now describe a convergent finite element scheme for the non-divergence-form problem (4.1) based on the regularized problem (4.27). To this end, we let
 $X_{0,h}^{l}=X_{h}^{l}\cap H_{0}^{1}(\unicode[STIX]{x1D6FA})$
be the linear, Lagrange finite element space with vanishing trace. Let
 $\unicode[STIX]{x1D719}_{i}\in X_{0,h}^{l}$
denote the normalized hat function with respect to the interior node
 $z_{i}\in \unicode[STIX]{x1D6FA}_{h}^{I}$
, and let
 $\unicode[STIX]{x1D6E5}_{h}$
be the finite element Laplacian defined by (3.39). We consider the following finite element method: find
 $u_{h}\in X_{0,h}^{l}$
such that
 $$\begin{eqnarray}{\mathcal{L}}_{h}^{\unicode[STIX]{x1D716}}u_{h}^{\unicode[STIX]{x1D716}}(z_{i}):=\displaystyle \frac{\unicode[STIX]{x1D706}}{2}\unicode[STIX]{x1D6E5}_{h}u_{h}^{\unicode[STIX]{x1D716}}(z_{i})+I_{\unicode[STIX]{x1D716}}u_{h}^{\unicode[STIX]{x1D716}}(z_{i})=f_{i}:=\int _{\unicode[STIX]{x1D6FA}}f\unicode[STIX]{x1D719}_{i},\quad \text{for all}~z_{i}\in \unicode[STIX]{x1D6FA}_{h}^{I}.\end{eqnarray}$$
Note that the formulation (4.28) is not obtained by testing (4.27) with
 $\unicode[STIX]{x1D719}_{i}$
(which would introduce the term
 $\int _{\unicode[STIX]{x1D6FA}}I_{\unicode[STIX]{x1D716}}u_{h}^{\unicode[STIX]{x1D716}}\unicode[STIX]{x1D719}_{i}$
). Instead, mass lumping is used to preserve the monotonicity of the scheme.
Lemma 4.19 (monotonicity).
Suppose that
 $v_{h},w_{h}\in X_{0,h}^{l}$
satisfy
 $v_{h}\leq w_{h}$
with equality at
 $z\in \unicode[STIX]{x1D6FA}_{h}^{I}$
. Then
 $I_{\unicode[STIX]{x1D716}}v_{h}(z)\leq I_{\unicode[STIX]{x1D716}}w_{h}(z)$
. Consequently, if
 ${\mathcal{T}}_{h}$
satisfies (3.42), then
 ${\mathcal{L}}_{h}^{\unicode[STIX]{x1D716}}$
is monotone.
Proof. From the hypotheses and the definition of
 $\unicode[STIX]{x1D6FF}_{\unicode[STIX]{x1D703}y,\unicode[STIX]{x1D703}}^{2}$
, we have
 $\unicode[STIX]{x1D6FF}_{\unicode[STIX]{x1D703}y,\unicode[STIX]{x1D703}}^{2}v(z)\leq \unicode[STIX]{x1D6FF}_{\unicode[STIX]{x1D703}y,\unicode[STIX]{x1D703}}^{2}w(z)$
, and therefore
 $I_{\unicode[STIX]{x1D716}}v_{h}(z_{i})\leq I_{\unicode[STIX]{x1D716}}w_{h}(z_{i})$
. The monotonicity of
 ${\mathcal{L}}_{h}^{\unicode[STIX]{x1D716}}$
then follows from Lemma 3.42.
The monotonicity, along with the Alexandrov–Bakelman–Pucci estimate for the finite element Laplacian, yields the following maximum principle.
Theorem 4.20 (discrete ABP estimate for
${\mathcal{L}}_{h}^{\unicode[STIX]{x1D716}}$
).

Suppose that
 ${\mathcal{T}}_{h}$
satisfies (3.42). Then, for
 $v_{h}\in X_{0,h}^{l}$
satisfying
 $$\begin{eqnarray}{\mathcal{L}}_{h}^{\unicode[STIX]{x1D716}}v_{h}(z_{i})\leq f_{i},\quad \text{for all}~z_{i}\in \unicode[STIX]{x1D6FA}_{h}^{I},\end{eqnarray}$$
we obtain
 $$\begin{eqnarray}\sup _{\unicode[STIX]{x1D6FA}}v_{h}^{-}\leq \displaystyle \frac{C}{\unicode[STIX]{x1D706}}\biggl(\mathop{\sum }_{z_{i}\in {\mathcal{C}}_{h}^{-}(v_{h})}|f_{i}^{+}|^{d}|\unicode[STIX]{x1D714}_{z_{i}}|\biggr)^{1/d},\end{eqnarray}$$
where
 ${\mathcal{C}}_{h}^{-}(v_{h})$
is the nodal contact set given in Definition 3.23.
Proof. Let
 $\unicode[STIX]{x1D6E4}_{h}(v_{h})=\unicode[STIX]{x1D6E4}(v_{h})$
be the convex envelope of
 $v_{h}$
. Then, for a contact point
 $z_{i}\in {\mathcal{C}}_{h}^{-}(v_{h})$
,
 $$\begin{eqnarray}0\leq I_{\unicode[STIX]{x1D716}}\unicode[STIX]{x1D6E4}(v_{h})(z_{i})\leq I_{\unicode[STIX]{x1D716}}v_{h}(z_{i}),\end{eqnarray}$$
where the first inequality follows from the convexity of
 $\unicode[STIX]{x1D6E4}(v_{h})$
and the second follows from the monotonicity of
 $I_{\unicode[STIX]{x1D716}}$
in Lemma 4.19. Consequently,
 $$\begin{eqnarray}\displaystyle \frac{\unicode[STIX]{x1D706}}{2}\unicode[STIX]{x1D6E5}_{h}v_{h}(z_{i})\leq {\mathcal{L}}_{h}^{\unicode[STIX]{x1D716}}v_{h}(z_{i})\leq f_{i}^{+}\end{eqnarray}$$
since
 $f_{i}\geq 0$
for
 $z_{i}\in {\mathcal{C}}_{h}^{-}(v_{h})$
. The result now follows from this inequality and Theorem 3.50 (see Remark 3.51).
Since the method (4.28) is linear, a corollary of the ABP estimate is the existence and uniqueness of a solution
 $u_{h}$
.
Corollary 4.21 (existence and uniqueness).
Suppose that
 ${\mathcal{T}}_{h}$
satisfies (3.42). Then there exists a unique
 $u_{h}\in X_{0,h}^{l}$
satisfying (4.28).
We now turn our attention to error estimates of the finite element method (4.28) and derive a rate of convergence in the
 $L^{\infty }$
-norm. To do so we assume that the solution to (4.1) satisfies
 $u\in C^{2,\unicode[STIX]{x1D6FC}}(\unicode[STIX]{x1D6FA})$
. Recall (see Theorem 2.17) that this regularity is guaranteed provided that
 $A$
is Hölder-continuous and
 $\unicode[STIX]{x2202}\unicode[STIX]{x1D6FA}$
is sufficiently smooth.
Now, since the method is linear and the problem is stable, such estimates reduce to the consistency of the method. However, as shown in Lemma 3.38, the finite element method is not consistent, in the sense of Definition 3.1, when supplemented with the canonical interpolant
 $I_{h}^{fe}$
. Instead, we make use of the elliptic projection
 $I_{h}^{ep}$
defined in (3.41) and its properties (see Lemma 3.41 and Proposition 3.40).
In conclusion, in order to derive error estimates, it suffices to derive upper bounds for the difference
 $u_{h}^{\unicode[STIX]{x1D716}}-I_{h}^{ep}u$
. To this end, we apply the definition of the method (4.28) to obtain the error equation
 $$\begin{eqnarray}{\mathcal{L}}_{h}^{\unicode[STIX]{x1D716}}[I_{h}^{ep}u-u_{h}^{\unicode[STIX]{x1D716}}](z_{i})=\int _{\unicode[STIX]{x1D714}_{z_{i}}}(T_{1}^{(i)}+T_{2}^{(i)}+T_{3}^{(i)})\unicode[STIX]{x1D719}_{i}\end{eqnarray}$$
with
 $$\begin{eqnarray}\displaystyle T_{1}^{(i)} & = & \displaystyle I_{\unicode[STIX]{x1D716}}[I_{h}^{ep}u](z_{i})-I_{\unicode[STIX]{x1D716}}u(z_{i}),\nonumber\\ \displaystyle T_{2}^{(i)} & = & \displaystyle I_{\unicode[STIX]{x1D716}}u(z_{i})-\biggl(A(z_{i})-\displaystyle \frac{\unicode[STIX]{x1D706}}{2}I\biggr):D^{2}u(z_{i}),\nonumber\\ \displaystyle T_{3}^{(i)} & = & \displaystyle \biggl(A(z_{i})-\displaystyle \frac{\unicode[STIX]{x1D706}}{2}I\biggr):(D^{2}u(z_{i})-D^{2}u(x)).\nonumber\end{eqnarray}$$
Note that, with the finite element ABP estimate given in Theorem 4.20 and the approximation results of the elliptic projection stated in Proposition 3.40, upper-bound estimates of
 $T_{j}^{(i)}$
yield error estimates of
 $u-u_{h}$
.
With the assumed regularity
 $u\in C^{2,\unicode[STIX]{x1D6FC}}(\unicode[STIX]{x1D6FA})$
, we immediately find that
 $T_{3}^{(i)}$
can be bounded by
 $$\begin{eqnarray}|T_{3}^{(i)}|\leq Ch^{\unicode[STIX]{x1D6FC}}\Vert u\Vert _{C^{2,\unicode[STIX]{x1D6FC}}(\unicode[STIX]{x1D6FA})}.\end{eqnarray}$$
For
 $T_{2}^{(i)}$
, we apply Lemma 4.18 to obtain
 $$\begin{eqnarray}|T_{2}^{(i)}|\leq C\unicode[STIX]{x1D703}^{\unicode[STIX]{x1D6FC}}\unicode[STIX]{x1D716}^{\unicode[STIX]{x1D6FC}}\Vert u\Vert _{C^{2,\unicode[STIX]{x1D6FC}}(\unicode[STIX]{x1D6FA})}\leq C\unicode[STIX]{x1D716}^{\unicode[STIX]{x1D6FC}}\Vert u\Vert _{C^{2,\unicode[STIX]{x1D6FC}}(\unicode[STIX]{x1D6FA})}.\end{eqnarray}$$
Finally, we apply the approximation results of Proposition 3.40 and the definition of the second-order difference operator
 $\unicode[STIX]{x1D6FF}_{\unicode[STIX]{x1D703}y,\unicode[STIX]{x1D703}}^{2}$
to obtain
 $$\begin{eqnarray}|\unicode[STIX]{x1D6FF}_{\unicode[STIX]{x1D703}y,\unicode[STIX]{x1D703}}^{2}(I_{h}^{ep}u(z_{i})-u(z_{i}))|\leq C\displaystyle \frac{h^{2}}{\unicode[STIX]{x1D703}^{2}}\,|\text{log}\,h|\Vert u\Vert _{W^{2,\infty }(\unicode[STIX]{x1D6FA})}.\end{eqnarray}$$
This leads to the estimate
 $$\begin{eqnarray}|T_{1}^{(i)}|\leq C\Vert u\Vert _{W^{2,\infty }(\unicode[STIX]{x1D6FA})}\biggl(\displaystyle \frac{h^{2}}{\unicode[STIX]{x1D716}^{2}}\,|\text{log}\,h|+\displaystyle \frac{h^{2}}{\unicode[STIX]{x1D703}^{2}\unicode[STIX]{x1D716}^{2}}\,|\text{log}\,h|\unicode[STIX]{x1D712}_{\unicode[STIX]{x1D714}_{\unicode[STIX]{x1D716}}}(z_{i})\biggr),\end{eqnarray}$$
where
 $\unicode[STIX]{x1D712}_{\unicode[STIX]{x1D714}_{\unicode[STIX]{x1D716}}}$
is the indicator function of
 $\unicode[STIX]{x1D714}_{\unicode[STIX]{x1D716}}$
, which is defined in (4.25). Combining (4.30)–(4.32), we obtain
 $$\begin{eqnarray}\displaystyle & & \displaystyle |T_{1}^{(i)}+T_{2}^{(i)}+T_{3}^{(i)}|\nonumber\\ \displaystyle & & \displaystyle \quad \leq \,C\biggl(h^{\unicode[STIX]{x1D6FC}}+\unicode[STIX]{x1D716}^{\unicode[STIX]{x1D6FC}}+\displaystyle \frac{h^{2}}{\unicode[STIX]{x1D716}^{2}}\,|\text{log}\,h|+\displaystyle \frac{h^{2}}{\unicode[STIX]{x1D703}^{2}\unicode[STIX]{x1D716}^{2}}\,|\text{log}\,h|\,|\unicode[STIX]{x1D712}_{\unicode[STIX]{x1D714}_{\unicode[STIX]{x1D716}}}(z_{i})\biggr),\end{eqnarray}$$
where we have absorbed the factor
 $\Vert u\Vert _{C^{2,\unicode[STIX]{x1D6FC}}(\unicode[STIX]{x1D6FA})}$
into the constant
 $C$
.
Note that, owing to the last term on the right-hand side, estimate (4.33) reduces to order
 $1$
in the boundary layer
 $\unicode[STIX]{x1D714}_{\unicode[STIX]{x1D716}}$
. In order to derive meaningful estimates in this region, we introduce the barrier layer function
 $$\begin{eqnarray}b(x):=\unicode[STIX]{x1D709}(\text{dist}(x,\unicode[STIX]{x2202}\unicode[STIX]{x1D6FA})),~\text{with}~\unicode[STIX]{x1D709}(s):=\left\{\begin{array}{@{}ll@{}}Q^{-2}(s-Q\unicode[STIX]{x1D716})^{2}-\unicode[STIX]{x1D716}^{2}\quad & \text{if }s\leq Q\unicode[STIX]{x1D716},\\ -\unicode[STIX]{x1D716}^{2}\quad & \text{if }s>Q_{\unicode[STIX]{x1D716}},\end{array}\right.\end{eqnarray}$$
The discrete boundary layer function is defined as
 $b_{h}:=I_{h}^{fe}b$
. The next result summarizes key properties of
 $b_{h}$
; see Nochetto and Zhang (Reference Nochetto and Zhang2017a
, Lemma 6.1)
Lemma 4.22 (properties of barrier layer function).
Let
 $b_{h}=I_{h}^{fe}b$
, where
 $b$
is given by (4.34). Then
 $$\begin{eqnarray}{\mathcal{L}}_{h}^{\unicode[STIX]{x1D716}}b_{h}(z_{i})\geq C\unicode[STIX]{x1D712}_{\unicode[STIX]{x1D714}_{\unicode[STIX]{x1D716}}(z_{i})},\quad |b_{h}(z_{i})|\leq C\unicode[STIX]{x1D716}^{2}.\end{eqnarray}$$
Note that since every
 $z_{i}\in \unicode[STIX]{x1D714}_{\unicode[STIX]{x1D716}}$
is at most
 $O(h)$
from
 $\unicode[STIX]{x2202}\unicode[STIX]{x1D6FA}$
, we have
 $\unicode[STIX]{x1D716}\unicode[STIX]{x1D703}\geq Ch$
on
 $\unicode[STIX]{x1D714}_{\unicode[STIX]{x1D716}}$
. Consequently, the last term in (4.33) can be bounded by the discrete barrier function as follows:
 $$\begin{eqnarray}\displaystyle \frac{h^{2}}{\unicode[STIX]{x1D703}^{2}\unicode[STIX]{x1D716}^{2}}\,|\text{log}\,h|\unicode[STIX]{x1D712}_{\unicode[STIX]{x1D714}_{\unicode[STIX]{x1D716}}(z_{i})}\Vert u\Vert _{C^{2,\unicode[STIX]{x1D6FC}}(\unicode[STIX]{x1D6FA})}\leq C\,|\text{log}\,h|\unicode[STIX]{x1D712}_{\unicode[STIX]{x1D714}_{\unicode[STIX]{x1D716}}}(z_{i})\leq C\,|\text{log}\,h|{\mathcal{L}}_{h}^{\unicode[STIX]{x1D716}}b_{h}(z_{i}).\end{eqnarray}$$
Thus, combining this estimate with (4.33) and (4.29) leads to
 $$\begin{eqnarray}{\mathcal{L}}_{h}^{\unicode[STIX]{x1D716}}[I_{h}^{ep}u-u_{h}^{\unicode[STIX]{x1D716}}-C\,|\text{log}\,h|b_{h}](z_{i})\leq C\biggl(h^{\unicode[STIX]{x1D6FC}}+\unicode[STIX]{x1D716}^{\unicode[STIX]{x1D6FC}}+\displaystyle \frac{h^{2}}{\unicode[STIX]{x1D716}^{2}}\,|\text{log}\,h|\biggr).\end{eqnarray}$$
From this expression, we easily obtain estimates of
 $u-u_{h}$
.
Theorem 4.23 (rate of convergence).
Suppose that
 ${\mathcal{T}}_{h}$
satisfies (3.42), and that the solution to (4.1) satisfies
 $u\in C^{2,\unicode[STIX]{x1D6FC}}(\unicode[STIX]{x1D6FA})$
. Let
 $u_{h}\in X_{0,h}^{l}$
be the solution to (4.28) with
 $\unicode[STIX]{x1D716}=C(h^{2}\,|\text{log}\,h|)^{1/(2+\unicode[STIX]{x1D6FC})}$
. Then
 $$\begin{eqnarray}\Vert u-u_{h}\Vert _{L^{\infty }(\unicode[STIX]{x1D6FA})}\leq C(h^{2}\,|\text{log}\,h|)^{\unicode[STIX]{x1D6FC}/(2+\unicode[STIX]{x1D6FC})}.\end{eqnarray}$$
Proof. Applying the finite element ABP for
 ${\mathcal{L}}_{h}^{\unicode[STIX]{x1D716}}$
(see Theorem 4.20) to (4.35) yields
 $$\begin{eqnarray}\sup _{\unicode[STIX]{x1D6FA}}(I_{h}^{ep}u-u_{h}^{\unicode[STIX]{x1D716}}-C\,|\text{log}\,h|b_{h})^{-}\leq C\biggl(h^{\unicode[STIX]{x1D6FC}}+\unicode[STIX]{x1D716}^{\unicode[STIX]{x1D6FC}}+\displaystyle \frac{h^{2}}{\unicode[STIX]{x1D716}^{2}}\,|\text{log}\,h|\biggr).\end{eqnarray}$$
Therefore, since
 $|b_{h}|\leq \unicode[STIX]{x1D716}^{2}$
, we get
 $$\begin{eqnarray}\sup (I_{h}^{ep}u-u_{h}^{\unicode[STIX]{x1D716}})^{-}\leq C\biggl(h^{\unicode[STIX]{x1D6FC}}+\unicode[STIX]{x1D716}^{\unicode[STIX]{x1D6FC}}+\biggl(\unicode[STIX]{x1D716}^{2}+\displaystyle \frac{h^{2}}{\unicode[STIX]{x1D716}^{2}}\biggr)\,|\text{log}\,h|\biggr).\end{eqnarray}$$
Similar estimates are obtained for
 $\sup _{\unicode[STIX]{x1D6FA}}(I_{h}^{ep}u-u_{h}^{\unicode[STIX]{x1D716}})^{+}$
, thus leading to
 $$\begin{eqnarray}\Vert I_{h}^{ep}u-u_{h}^{\unicode[STIX]{x1D716}}\Vert _{L^{\infty }(\unicode[STIX]{x1D6FA})}\leq C\biggl(h^{\unicode[STIX]{x1D6FC}}+\unicode[STIX]{x1D716}^{\unicode[STIX]{x1D6FC}}+\biggl(\unicode[STIX]{x1D716}^{2}+\displaystyle \frac{h^{2}}{\unicode[STIX]{x1D716}^{2}}\biggr)\,|\text{log}\,h|\biggr).\end{eqnarray}$$
If
 $\unicode[STIX]{x1D716}=C(h^{2}\,|\text{log}\,h|)^{1/(2+\unicode[STIX]{x1D6FC})}$
, then
 $$\begin{eqnarray}(h^{2}/\unicode[STIX]{x1D716}^{2})\,|\text{log}\,h|\leq C\unicode[STIX]{x1D716}^{\unicode[STIX]{x1D6FC}}\leq C(h^{2}|\text{log}\,h|)^{\unicode[STIX]{x1D6FC}/(2+\unicode[STIX]{x1D6FC})},\end{eqnarray}$$
and therefore
 $$\begin{eqnarray}\Vert I_{h}^{ep}u-u_{h}^{\unicode[STIX]{x1D716}}\Vert _{L^{\infty }(\unicode[STIX]{x1D6FA})}\leq C(h^{2}|\text{log}\,h|)^{\unicode[STIX]{x1D6FC}/(2+\unicode[STIX]{x1D6FC})}.\end{eqnarray}$$
Finally, applying Proposition 3.40 and the triangle inequality yields (4.36). The proof is complete.
Theorem 4.23 shows that if
 $\unicode[STIX]{x1D6FC}=1$
, then the error satisfies
 $\Vert u-u_{h}\Vert _{L^{\infty }(\unicode[STIX]{x1D6FA})}=O(h^{2/3-\unicode[STIX]{x1D70F}})$
for arbitrary
 $\unicode[STIX]{x1D70F}>0$
. If more regularity is assumed then an almost linear rate is obtained Nochetto and Zhang (Reference Nochetto and Zhang2017a
, Corollary 6.8)
Theorem 4.24 (improved rate).
Let
 $h$
and
 $\unicode[STIX]{x1D716}$
satisfy
 $\unicode[STIX]{x1D716}=Ch^{2/(3+\unicode[STIX]{x1D6FC})}$
. If the solution to (4.1) has the regularity
 $u\in C^{3,\unicode[STIX]{x1D6FC}}(\unicode[STIX]{x1D6FA})$
, and if
 ${\mathcal{T}}_{h}$
satisfies (3.42), then
 $$\begin{eqnarray}\Vert u-u_{h}^{\unicode[STIX]{x1D716}}\Vert _{L^{\infty }(\unicode[STIX]{x1D6FA})}\leq Ch^{2(1+\unicode[STIX]{x1D6FC})/(3+\unicode[STIX]{x1D6FC})}\,|\text{log}\,h|.\end{eqnarray}$$
In the opposite direction, if we assume less regularity of the solution and data, then convergence is still obtained, although without rates Nochetto and Zhang (Reference Nochetto and Zhang2017a , Corollary 6.5).
Theorem 4.25 (convergence).
Assume that
 $u\in C^{2}(\bar{\unicode[STIX]{x1D6FA}})$
, that the coefficient matrix satisfies
 $A\in \mathit{VMO}(\unicode[STIX]{x1D6FA},\mathbb{S}^{d})$
, and that the two scales
 $\unicode[STIX]{x1D716}$
and
 $h$
satisfy
 $\unicode[STIX]{x1D716}=Ch\,|\text{log}\,h|$
. Let
 $u_{h}^{\unicode[STIX]{x1D716}}\in X_{0,h}^{l}$
satisfy (4.28) with
 $A(z_{i})$
replaced by its average
 $$\begin{eqnarray}\bar{A}(z_{i}):=\displaystyle \frac{1}{|\unicode[STIX]{x1D714}_{z_{i}}|}\int _{\unicode[STIX]{x1D714}_{z_{i}}}A(y).\end{eqnarray}$$
If the mesh condition (3.42) is satisfied, then
 $\lim _{h\rightarrow 0^{+}}\Vert u-u_{h}^{\unicode[STIX]{x1D716}}\Vert _{L^{\infty }(\unicode[STIX]{x1D6FA})}=0$
.
5 Discretizations of convex second-order elliptic equations
Up to this point we have discussed general issues regarding stability and convergence of numerical methods for general fully nonlinear equations, as well as the construction of suitable schemes for linear problems in non-divergence form. For the rest of this overview we will merge the ideas presented in the previous sections. Since convergence of these schemes has already been discussed in Theorems 3.7 and 3.8, we will pay special attention to obtaining rates of convergence for them. In this section we will focus on convex equations. Moreover, as explained Section 1.3, there is no loss of generality in assuming that we are dealing with the Hamilton–Jacobi–Bellman equation, which we recall reads
 $$\begin{eqnarray}\left\{\begin{array}{@{}ll@{}}F(x,u,Du,D^{2}u):=\sup _{\unicode[STIX]{x1D6FC}\in {\mathcal{A}}}[\tilde{{\mathcal{L}}}^{\unicode[STIX]{x1D6FC}}u(x)-f^{\unicode[STIX]{x1D6FC}}(x)]=0\quad & \text{in }\unicode[STIX]{x1D6FA},\\ u=g\quad & \text{on }\unicode[STIX]{x2202}\unicode[STIX]{x1D6FA},\end{array}\right.\end{eqnarray}$$
where
 $$\begin{eqnarray}\tilde{{\mathcal{L}}}^{\unicode[STIX]{x1D6FC}}u(x):=A^{\unicode[STIX]{x1D6FC}}(x):D^{2}u(x)+\mathbf{b}(x)\cdot Du(x)+c(x)u(x).\end{eqnarray}$$
We assume that the linear elliptic operators are such that, for every
 $\unicode[STIX]{x1D6FC}\in {\mathcal{A}}$
,
 $$\begin{eqnarray}A^{\unicode[STIX]{x1D6FC}}\geq \unicode[STIX]{x1D706}I,\quad \text{for all}~\unicode[STIX]{x1D6FC}\in {\mathcal{A}},\end{eqnarray}$$
so that the operator
 $F$
is uniformly elliptic.
The numerical schemes for problem (5.1) can be roughly classified as finite difference, finite element and semi-Lagrangian methods. In this section we will focus on the first two. Semi-Lagrangian schemes will be illustrated in a particular case, the Monge–Ampère equation, in Section 6.2.
5.1 Finite difference methods
The analysis of the convergence properties of finite difference schemes for (5.1) dates back to Krylov (Reference Krylov1997, Reference Krylov2000), who considered the problem for
 $\unicode[STIX]{x1D6FA}=\mathbb{R}^{d}$
and constant ‘coefficients’, that is, when the operators
 $\tilde{{\mathcal{L}}}^{\unicode[STIX]{x1D6FC}}$
are
 $x$
-independent. These results were later extended by Barles and Jakobsen (Reference Barles and Jakobsen2002) to Lipschitz coefficients. Before embarking on the technical details of their results, let us give some intuition. Recall that, in general, a finite difference scheme is written in the form (3.13). Ideally, to approximate
 $u$
, the solution of (5.1), one would first construct a smooth function
 $u_{\unicode[STIX]{x1D700}}$
, parametrized by
 $\unicode[STIX]{x1D700}$
which, for a constant
 $C$
independent of
 $\unicode[STIX]{x1D700}$
, satisfies
 $$\begin{eqnarray}\Vert u-u_{\unicode[STIX]{x1D700}}\Vert _{L^{\infty }(\unicode[STIX]{x1D6FA})}\leq C\unicode[STIX]{x1D700}^{\unicode[STIX]{x1D705}_{1}}.\end{eqnarray}$$
A strengthened notion of consistency (see Definition 3.1) would then imply that
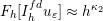 $F_{h}[I_{h}^{fd}u_{\unicode[STIX]{x1D700}}]\approx h^{\unicode[STIX]{x1D705}_{2}}$
, where the hidden constants in this expression may depend on
 $\unicode[STIX]{x1D700}$
. By stability, Definition 3.3, and monotonicity, Definition 3.5, we obtain
 $$\begin{eqnarray}\Vert I_{h}^{fd}u_{\unicode[STIX]{x1D700}}-u_{h}\Vert _{L^{\infty }(\bar{\unicode[STIX]{x1D6FA}}_{h})}\leq Ch^{\unicode[STIX]{x1D705}_{2}}.\end{eqnarray}$$
An application of the triangle inequality and relating the smoothing parameter
 $\unicode[STIX]{x1D700}$
to the discretization
 $h$
would yield a rate of convergence.
Unfortunately, the construction of such a smooth approximation
 $u_{\unicode[STIX]{x1D700}}$
is not immediate in practice. The groundbreaking idea of Krylov was to ‘shake the coefficients’. He introduced
 $u_{\unicode[STIX]{x1D700}}$
as the solution of
 $$\begin{eqnarray}\inf _{|e|\leq \unicode[STIX]{x1D700}}F(x+e,u_{\unicode[STIX]{x1D700}},Du_{\unicode[STIX]{x1D700}},D^{2}u_{\unicode[STIX]{x1D700}})=0,\end{eqnarray}$$
and, from
 $u_{\unicode[STIX]{x1D700}}$
, he was able to construct a smooth subsolution to (5.1) so that by comparison we can obtain an upper bound for
 $u_{h}-u$
. To obtain a lower bound, the original work of Krylov invoked arguments that some authors have characterized as probabilistic. However, Krylov (Reference Krylov2015, page 3) disagrees with this statement. Another line of reasoning was given by Barles and Jakobsen (Reference Barles and Jakobsen2002) who, instead, proposed that the problem and scheme should play a symmetric role. In other words, they introduce
 $u_{h}^{\unicode[STIX]{x1D700}}$
which solves
 $$\begin{eqnarray}\inf _{|e|\leq \unicode[STIX]{x1D700}}F_{h}[u_{h}^{\unicode[STIX]{x1D700}}](z+e)=0.\end{eqnarray}$$
Under suitable assumptions they show that this family of operators possesses unique smooth solutions, where the smoothness is independent of
 $\unicode[STIX]{x1D700}$
. This then allows us to compare
 $u$
and
 $u_{h}^{\unicode[STIX]{x1D700}}$
and obtain a rate of convergence. The assumptions that they rely on, however, must be checked for every particular instance.
Let us now proceed with the details. Recall that we are operating in the whole space
 $\mathbb{R}^{d}$
and that the mesh is given by
 $\bar{\unicode[STIX]{x1D6FA}}_{h}=\mathbb{Z}_{h}^{d}$
. We assume that all the coefficients of
 $\tilde{{\mathcal{L}}}^{\unicode[STIX]{x1D6FC}}$
and
 $f^{\unicode[STIX]{x1D6FC}}$
are Lipschitz-continuous uniformly in
 $\unicode[STIX]{x1D6FC}$
and that
 $\sup _{\unicode[STIX]{x1D6FC}\in {\mathcal{A}}}c^{\unicode[STIX]{x1D6FC}}(x)\leq c<0$
for every
 $x\in \mathbb{R}^{d}$
. This, as indicated in Theorem 2.52
(b), implies that the operator has a comparison principle. The structural requirements on the discretization scheme are summarized below.
Assumption 5.1 (finite differences).
The finite difference scheme
 $$\begin{eqnarray}F_{h}=F_{h}(z,r,q)\end{eqnarray}$$
satisfies the following.
-
(i) The scheme is consistent in a sense stronger than Definition 3.1, namely, for some
$\unicode[STIX]{x1D705}>0$
, for all sufficiently smooth
$$\begin{eqnarray}\Vert F_{h}[I_{h}^{fd}\unicode[STIX]{x1D719}]-F[\unicode[STIX]{x1D719}]\Vert _{L^{\infty }(\bar{\unicode[STIX]{x1D6FA}}_{h})}\leq Ch^{\unicode[STIX]{x1D705}},\end{eqnarray}$$
$\unicode[STIX]{x1D719}$
.
-
(ii) The scheme is of non-negative type: see Definition 3.9. In addition, there exists
$\bar{c}>0$
such that
$F_{h}(z,r+t,q+\mathbf{1}t)\leq F_{h}(z,r,q)-\bar{c}t$
for all
$t\geq 0$
. -
(iii) The scheme is convex in the
$r$
and
$q$
variables. -
(iv) The scheme is uniformly solvable and smooth under perturbations. In other words, for
$h>0$
small enough and
$\unicode[STIX]{x1D700}\in [0,1]$
, problem (5.3) has a unique solution
$u_{h}^{\unicode[STIX]{x1D700}}$
and, moreover, for some
$\unicode[STIX]{x1D6FF}>0$
we have
$$\begin{eqnarray}\Vert u_{h}-u_{h}^{\unicode[STIX]{x1D700}}\Vert _{L^{\infty }(\bar{\unicode[STIX]{x1D6FA}}_{h})}\leq C\unicode[STIX]{x1D700}^{\unicode[STIX]{x1D6FF}}.\end{eqnarray}$$





Note that conditions (i)–(iii) of Assumption 5.1 are relatively easy to enforce. However, condition (iv) must be verified in each case. As a first step, we show that schemes satisfying the non-negativity condition satisfy a comparison principle.
Lemma 5.2 (discrete comparison principle).
Let
 $F_{h}$
satisfy Assumption 5.1
(ii). Let
 $v_{h},w_{h}\in X_{h}^{fd}$
be two bounded nodal functions that are sub- and supersolutions to the discrete problem
 $F_{h}[u_{h}]=0$
, respectively. Then
 $v_{h}\leq w_{h}$
.
Proof. We assume
 $r=\sup _{\bar{\unicode[STIX]{x1D6FA}}_{h}}(v_{h}-w_{h})>0$
and derive a contradiction. For simplicity we assume there exists
 $z\in \bar{\unicode[STIX]{x1D6FA}}_{h}$
such that
 $v_{h}(z)-w_{h}(z)=r$
, for otherwise we can apply a standard limiting argument.
As in Section 3.2 we write
 $F_{h}[v_{h}](z)=F_{h}(z,v_{h}(z),Tv_{h}(z))$
, where the set of translates of
 $v_{h}(z)$
is
 $Tv_{h}(z)=\{v_{h}(z+hy):y\in S\}$
, and
 $S$
is the stencil. Note that
 $v_{h}(z)=w_{h}(z)+r$
and
 $v_{h}(z+hy)\leq w_{h}(z+hy)+r$
for
 $y\in S$
. Since
 $F_{h}$
is increasing in its third argument (see Definition 3.9), we have
 $$\begin{eqnarray}\displaystyle 0 & \leq & \displaystyle F_{h}[v_{h}](z)-F_{h}[w_{h}](z)\nonumber\\ \displaystyle & = & \displaystyle F_{h}(z,w_{h}(z)+r,Tv_{h}(z))-F_{h}(z,w_{h}(z),Tw_{h}(z))\nonumber\\ \displaystyle & \leq & \displaystyle F_{h}(z,w_{h}(z)+r,Tw_{h}(z)+\mathbf{1}r)-F_{h}(z,w_{h}(z),Tw_{h}(z)).\nonumber\end{eqnarray}$$
Applying Assumption 5.1 (ii) then yields
 $$\begin{eqnarray}0\leq (F_{h}(z,w_{h}(z),Tw_{h}(z))-\bar{c}r)-F_{h}(z,w_{h}(z),Tw_{h}(z))=-\bar{c}r,\end{eqnarray}$$
which is a contradiction.
Having shown the comparison principle, we now state the convergence rate of the scheme.
Theorem 5.3 (rate of convergence).
Assume that the finite difference scheme satisfies Assumption 5.1. Then there are constants
 $C_{1},C_{2}>0$
such that, for every
 $z\in \bar{\unicode[STIX]{x1D6FA}}_{h}$
,
 $$\begin{eqnarray}I_{h}^{fd}u(z)-u_{h}(z)\leq C_{1}h^{\unicode[STIX]{x1D705}_{1}},\quad u_{h}(z)-I_{h}^{fd}u(z)\leq C_{2}h^{\unicode[STIX]{x1D705}_{2}},\end{eqnarray}$$
where the rates
 $\unicode[STIX]{x1D705}_{1},\unicode[STIX]{x1D705}_{2}>0$
are not necessarily the same.
Proof. Let us sketch the proof of each of these bounds.
Proof of
 $I_{h}^{fd}u(z)-u_{h}(z)\leq C_{1}h^{\unicode[STIX]{x1D705}_{1}}$
. Let
 $u_{\unicode[STIX]{x1D700}}$
be the solution of (5.2). By definition, after the change of variables
 $y=x+e$
, we realize that
 $u_{\unicode[STIX]{x1D700}}(\cdot -e)$
is, for
 $|e|\leq \unicode[STIX]{x1D700}$
, a subsolution to the equation, that is, it satisfies, in the viscosity sense,
 $$\begin{eqnarray}F(y,u_{\unicode[STIX]{x1D700}}(\cdot -e),Du_{\unicode[STIX]{x1D700}}(\cdot -e),D^{2}u_{\unicode[STIX]{x1D700}}(\cdot -e))\geq 0.\end{eqnarray}$$
We regularize this function by the mollification
 $u^{\unicode[STIX]{x1D700}}=u_{\unicode[STIX]{x1D700}}\star \unicode[STIX]{x1D70C}_{\unicode[STIX]{x1D700}}$
, where
 $\unicode[STIX]{x1D70C}_{\unicode[STIX]{x1D700}}$
are the standard mollifiers. From the convexity of the operator
 $F$
and Jensen’s inequality, it follows that
 $u^{\unicode[STIX]{x1D700}}$
is also a subsolution. Since
 $u^{\unicode[STIX]{x1D700}}$
is now a smooth function, we can invoke consistency to obtain
 $$\begin{eqnarray}F_{h}[I_{h}^{fd}u^{\unicode[STIX]{x1D700}}](z)\geq F(z,u^{\unicode[STIX]{x1D700}}(z),Du^{\unicode[STIX]{x1D700}}(z),D^{2}u^{\unicode[STIX]{x1D700}}(z))-Ch^{\unicode[STIX]{x1D705}}\geq -Ch^{\unicode[STIX]{x1D705}},\end{eqnarray}$$
for some constant
 $C$
that depends on the smoothness of
 $u^{\unicode[STIX]{x1D700}}$
which, in turn, scales like negative powers of
 $\unicode[STIX]{x1D700}$
, say
 $C\leq \unicode[STIX]{x1D700}^{-\unicode[STIX]{x1D6FF}_{1}}$
. In conclusion, we have obtained that
 $$\begin{eqnarray}F_{h}[I_{h}^{fd}u^{\unicode[STIX]{x1D700}}](z)\geq -Ch^{\unicode[STIX]{x1D705}}\unicode[STIX]{x1D700}^{-\unicode[STIX]{x1D6FF}_{1}}.\end{eqnarray}$$
Assumption 5.1
(ii) shows that the function
 $I_{h}^{fd}(u^{\unicode[STIX]{x1D700}}-Ch^{\unicode[STIX]{x1D705}}\unicode[STIX]{x1D700}^{-\unicode[STIX]{x1D6FF}_{1}})$
is, for a suitably chosen
 $C$
, a subsolution of the scheme, that is,
 $F_{h}[I_{h}^{fd}(u^{\unicode[STIX]{x1D700}}-Ch^{\unicode[STIX]{x1D705}}\unicode[STIX]{x1D700}^{-\unicode[STIX]{x1D6FF}_{1}})]\geq 0$
. Therefore, by the comparison principle given in Lemma 5.2,
 $$\begin{eqnarray}I_{h}^{fd}u^{\unicode[STIX]{x1D700}}(z)-u_{h}(z)\leq Ch^{\unicode[STIX]{x1D705}}\unicode[STIX]{x1D700}^{-\unicode[STIX]{x1D6FF}_{1}}.\end{eqnarray}$$
In conclusion, using the continuity properties of equation (5.1) and properties of mollifiers, we obtain
 $$\begin{eqnarray}\displaystyle I_{h}^{fd}u(z)-u_{h}(z) & = & \displaystyle I_{h}^{fd}(u-u_{\unicode[STIX]{x1D700}})(z)+I_{h}^{fd}(u_{\unicode[STIX]{x1D700}}-u^{\unicode[STIX]{x1D700}})(z)+I_{h}^{fd}(u^{\unicode[STIX]{x1D700}}-u_{h})(z)\nonumber\\ \displaystyle & \leq & \displaystyle \displaystyle \frac{C_{1}}{2}(\unicode[STIX]{x1D700}^{\unicode[STIX]{x1D6FF}_{2}}+h^{\unicode[STIX]{x1D705}}\unicode[STIX]{x1D700}^{-\unicode[STIX]{x1D6FF}_{1}}),\nonumber\end{eqnarray}$$
where
 $\unicode[STIX]{x1D6FF}_{2}>0$
depends on the smoothness of
 $u$
(see Theorem 2.67). Optimizing with respect to
 $\unicode[STIX]{x1D700}$
, we get the result.
Proof of
 $u_{h}(z)-I_{h}^{fd}u(z)\leq C_{2}h^{\unicode[STIX]{x1D705}_{2}}$
. We follow similar reasoning but this time, we interchange the roles that the equation and the scheme have played in the previous step. Indeed, by Assumption 5.1
(iv) we know that there is a
 $u_{h}^{\unicode[STIX]{x1D700}}\in X_{h}^{fd}$
that solves (5.3) and, again with the change of variables
 $\tilde{z}=z+e$
, this function satisfies
 $$\begin{eqnarray}F_{h}[u_{h}^{\unicode[STIX]{x1D700}}](z)\geq 0,\end{eqnarray}$$
so that it is a subsolution of the scheme. Now, convexity of
 $F_{h}$
implies that
 $I_{h}^{fd}(u_{h}^{\unicode[STIX]{x1D700}}\star \unicode[STIX]{x1D70C}_{\unicode[STIX]{x1D700}})$
is also a subsolution of the scheme. Moreover, we have that
 $u_{h}^{\unicode[STIX]{x1D700}}\star \unicode[STIX]{x1D70C}_{\unicode[STIX]{x1D700}}$
is a smooth function, and therefore consistency implies that for some
 $\unicode[STIX]{x1D6FF}_{3}>0$
we have
 $$\begin{eqnarray}F[u_{h}^{\unicode[STIX]{x1D700}}\star \unicode[STIX]{x1D70C}_{\unicode[STIX]{x1D700}}](z)\geq -Ch^{\unicode[STIX]{x1D705}}\unicode[STIX]{x1D700}^{-\unicode[STIX]{x1D6FF}_{3}}.\end{eqnarray}$$
Monotonicity of the equation shows that, for a suitably chosen
 $C$
, the function
 $u_{h}^{\unicode[STIX]{x1D700}}\star \unicode[STIX]{x1D70C}_{\unicode[STIX]{x1D700}}-Ch^{\unicode[STIX]{x1D705}}\unicode[STIX]{x1D700}^{-\unicode[STIX]{x1D6FF}_{3}}$
is a subsolution which, by comparison, readily implies that
 $$\begin{eqnarray}u_{h}^{\unicode[STIX]{x1D700}}\star \unicode[STIX]{x1D70C}_{\unicode[STIX]{x1D700}}(z)-u(z)\leq Ch^{\unicode[STIX]{x1D705}}\unicode[STIX]{x1D700}^{-\unicode[STIX]{x1D6FF}_{3}}.\end{eqnarray}$$
Properties of convolutions together with Assumption 5.1 (iv) then imply
 $$\begin{eqnarray}\displaystyle u_{h}(z)-I_{h}^{fd}u(z) & = & \displaystyle (u_{h}-u_{h}^{\unicode[STIX]{x1D700}})(z)+(u_{h}^{\unicode[STIX]{x1D700}}-I_{h}^{fd}(u_{h}^{\unicode[STIX]{x1D700}}\star \unicode[STIX]{x1D70C}_{\unicode[STIX]{x1D700}}))(z)\nonumber\\ \displaystyle & & \displaystyle \qquad +\,I_{h}^{fd}(u_{h}^{\unicode[STIX]{x1D700}}\star \unicode[STIX]{x1D70C}_{\unicode[STIX]{x1D700}}-u)(z)\leq \displaystyle \frac{C_{2}}{3}(\unicode[STIX]{x1D700}^{\unicode[STIX]{x1D6FF}}+\unicode[STIX]{x1D700}^{\unicode[STIX]{x1D6FF}_{2}}+h^{\unicode[STIX]{x1D705}}\unicode[STIX]{x1D700}^{-\unicode[STIX]{x1D6FF}_{3}}).\nonumber\end{eqnarray}$$
Optimization in
 $\unicode[STIX]{x1D700}$
once again yields the result.
Let us now give an example of finite difference schemes for which the assumptions of Theorem 5.3 can be verified.
Example 5.4 (monotone finite differences).
Let
 $A^{\unicode[STIX]{x1D6FC}}$
be independent of
 $x$
for every
 $\unicode[STIX]{x1D6FC}$
and, possibly after a renormalization, verify
 $$\begin{eqnarray}\mathop{\sum }_{i=1}^{d}\left[a_{i,i}^{\unicode[STIX]{x1D6FC}}-\mathop{\sum }_{j\neq i}|a_{i,j}^{\unicode[STIX]{x1D6FC}}|\right]\leq 1.\end{eqnarray}$$
More importantly, we assume that these matrices are diagonally dominant, that is, (3.31) holds. For simplicity, assume also that
 $\mathbf{b}^{\unicode[STIX]{x1D6FC}}\equiv 0$
for all
 $\unicode[STIX]{x1D6FC}\in {\mathcal{A}}$
. As shown in Lemma 3.34, there exists a monotone finite difference
 ${\mathcal{L}}_{h}^{\unicode[STIX]{x1D6FC}}+c^{\unicode[STIX]{x1D6FC}}$
that is consistent with
 $\tilde{{\mathcal{L}}}^{\unicode[STIX]{x1D6FC}}$
. We then define
 $$\begin{eqnarray}F_{h}[u_{h}](z)=\sup _{\unicode[STIX]{x1D6FC}\in {\mathcal{A}}}[{\mathcal{L}}_{h}^{\unicode[STIX]{x1D6FC}}u_{h}(z)+c^{\unicode[STIX]{x1D6FC}}(z)u_{h}(z)-f^{\unicode[STIX]{x1D6FC}}(z)]=0.\end{eqnarray}$$
In this case, Barles and Jakobsen (Reference Barles and Jakobsen2002, Section 4) show that all the assumptions are verified and, moreover, that
 $\unicode[STIX]{x1D705}_{1}=\unicode[STIX]{x1D705}_{2}=1/3$
.
Remark 5.5 (examples and improvements).
Let us comment on the various improvements and refinements of Theorem 5.3 as well as some extensions of Example 5.4.
-
∙ In Example 5.4 it is assumed that the leading coefficients
$A^{\unicode[STIX]{x1D6FC}}$
do not depend on the spatial variable
$x$
. Barles and Jakobsen (Reference Barles and Jakobsen2005) studied the relation between (5.1) and a certain system of quasi-variational inequalities of compliance obstacle type (see (5.4) below). They used this system instead of Assumption 5.1
(iv) to obtain an upper bound for
$u_{h}-I_{h}^{fd}u$
for the case when
$A^{\unicode[STIX]{x1D6FC}}$
is Lipschitz-continuous in the space variable. Their results show that
$\Vert I_{h}^{fd}u-u_{h}\Vert _{L^{\infty }(\bar{\unicode[STIX]{x1D6FA}}_{h})}\leq Ch^{1/5}$
. -
∙ Let
$\{\mathbf{e}_{i}\}_{i=1}^{d}$
be an orthonormal basis of
$\mathbb{R}^{d}$
and assume that the matrices have the form for some
$$\begin{eqnarray}A^{\unicode[STIX]{x1D6FC}}(x)=\mathop{\sum }_{i=1}^{d}a_{i}^{\unicode[STIX]{x1D6FC}}(x)\mathbf{e}_{i}\otimes \mathbf{e}_{i}\end{eqnarray}$$
$a_{i}^{\unicode[STIX]{x1D6FC}}$
that is Lipschitz in
$x$
uniformly in
$\unicode[STIX]{x1D6FC}$
. Recall that, with this assumption, Lemma 3.33 guarantees the existence of a monotone finite difference scheme. In this setting Krylov (Reference Krylov2005) shows that
$\unicode[STIX]{x1D705}_{1}=\unicode[STIX]{x1D705}_{2}=1/2$
. Moreover, in the same setting but assuming that the coefficients are
$C^{1,1}$
, Krylov (Reference Krylov2014) shows that
$\unicode[STIX]{x1D705}_{1}=\unicode[STIX]{x1D705}_{2}=2/3$
.
-
∙ All the aforementioned results consider the case
$\unicode[STIX]{x1D6FA}=\mathbb{R}^{d}$
, so that boundary conditions are not an issue: see Theorem 3.8. Dong and Krylov (Reference Dong and Krylov2007) consider the boundary value problem (5.1) under the assumption that the boundary conditions are attained classically; see Definitions 2.48 and 2.53. Under the assumption that a barrier function can be constructed, that is, a smooth
$b$
such that
$b>0$
in
$\unicode[STIX]{x1D6FA}$
,
$b=0$
on
$\unicode[STIX]{x2202}\unicode[STIX]{x1D6FA}$
and they were able to extend the results presented here and show that the rate of convergence is
$$\begin{eqnarray}F[b](x)\leq -1,\end{eqnarray}$$
$\Vert I_{h}^{fd}u-u_{h}\Vert _{L^{\infty }(\bar{\unicode[STIX]{x1D6FA}}_{h})}\leq Ch^{1/2}$
.






Other results, which invoke the probabilistic interpretation of (5.1), can be found in the literature; see, for instance, Fleming and Soner (Reference Fleming and Soner2006) and Menaldi (Reference Menaldi1989). The reader is also referred to the introduction of Krylov (Reference Krylov2015) for a detailed account of the development of error estimates for (5.1).
5.2 Finite element methods
We now focus on the construction and analysis of finite element schemes for (5.1). We will divide the exposition in two cases. First we will discuss the discretization for a variant of the problem when the operators
 $\tilde{{\mathcal{L}}}^{\unicode[STIX]{x1D6FC}}$
are replaced by operators in divergence form
 $\tilde{L}^{\unicode[STIX]{x1D6FC}}$
with smooth coefficients. Then we will discuss the case of (5.1) where the coefficients for
 $\tilde{{\mathcal{L}}}^{\unicode[STIX]{x1D6FC}}$
satisfy the Cordes condition of Definition 2.32, which is based on the discretization of non-divergence-form operators of Section 4.1. We must remark that it is possible to construct discrete schemes using the integro-differential approximation of Section 4.3. However, to avoid repetition, its discussion will be illustrated in Section 7.3 for a non-convex operator of Isaacs type (see Example 2.13). Setting
 $\#{\mathcal{B}}=1$
there, we reduce the scheme and its analysis to the case we are concerned with here.
5.2.1 Discretization for divergence-form operators
Let us consider (5.1) but where the operators
 $\tilde{{\mathcal{L}}}^{\unicode[STIX]{x1D6FC}}$
are replaced by divergence-form elliptic operators
 $\tilde{L}^{\unicode[STIX]{x1D6FC}}$
with
 $C^{2}(\bar{\unicode[STIX]{x1D6FA}})$
coefficients; see Definition 2.3. In addition, we assume that
 $\unicode[STIX]{x2202}\unicode[STIX]{x1D6FA}$
is sufficiently smooth,
 $g=0$
and that, for every
 $\unicode[STIX]{x1D6FC}\in {\mathcal{A}}$
, we have
 $0\leq f^{\unicode[STIX]{x1D6FC}}\in L^{\infty }(\unicode[STIX]{x1D6FA})$
. Finally, we assume that
 ${\mathcal{A}}=\{1,\ldots ,M\}$
for some
 $M\in \mathbb{N}$
.
Remark 5.6 (smooth coefficients).
Note that, if the coefficients of
 $\tilde{{\mathcal{L}}}^{\unicode[STIX]{x1D6FC}}$
in (5.1) are sufficiently smooth, one can rewrite this operator in divergence form. Therefore, this reformulation is sufficiently general.
Recall that, by integration by parts, to every operator
 $\tilde{L}^{\unicode[STIX]{x1D6FC}}$
we can associate the bilinear form
 $a^{\unicode[STIX]{x1D6FC}}:H^{1}(\unicode[STIX]{x1D6FA})\times H^{1}(\unicode[STIX]{x1D6FA})\rightarrow \mathbb{R}$
, defined by
 $$\begin{eqnarray}a^{\unicode[STIX]{x1D6FC}}(v,w)=\int _{\unicode[STIX]{x1D6FA}}(A^{\unicode[STIX]{x1D6FC}}Dv\cdot Dw+v^{\unicode[STIX]{x1D6FC}}\mathbf{b}^{\unicode[STIX]{x1D6FC}}\cdot Dw+\mathbf{c}^{\unicode[STIX]{x1D6FC}}\cdot Dvw+d^{\unicode[STIX]{x1D6FC}}vw).\end{eqnarray}$$
To simplify the discussion, we will assume that these forms are coercive uniformly in
 $\unicode[STIX]{x1D6FC}$
, that is, there is a constant
 $\unicode[STIX]{x1D706}_{0}$
such that
 $$\begin{eqnarray}\inf _{\unicode[STIX]{x1D6FC}\in {\mathcal{A}}}a^{\unicode[STIX]{x1D6FC}}(v,v)\geq \unicode[STIX]{x1D706}_{0}\Vert Dv\Vert _{L^{2}(\unicode[STIX]{x1D6FA})}^{2},\quad \text{for all}~v\in H_{0}^{1}(\unicode[STIX]{x1D6FA}).\end{eqnarray}$$
Given
 $k>0$
and
 $w\in H_{0}^{1}(\unicode[STIX]{x1D6FA})$
, define
 $$\begin{eqnarray}{\mathcal{K}}(k,w)=\{v\in H_{0}^{1}(\unicode[STIX]{x1D6FA}):v\leq k+w\},\end{eqnarray}$$
which is a closed and convex subset of
 $H_{0}^{1}(\unicode[STIX]{x1D6FA})$
. For
 $k>0$
we introduce a system of quasi-variational inequalities of compliance obstacle type as follows: find
 $u_{k}^{\unicode[STIX]{x1D6FC}}\in {\mathcal{K}}(k,u^{\unicode[STIX]{x1D6FC}+1})$
such that
 $$\begin{eqnarray}a^{\unicode[STIX]{x1D6FC}}(u_{k}^{\unicode[STIX]{x1D6FC}},u_{k}^{\unicode[STIX]{x1D6FC}}-v)\leq (f^{\unicode[STIX]{x1D6FC}},u_{k}^{\unicode[STIX]{x1D6FC}}-v),\quad \text{for all}~v\in {\mathcal{K}}(k,u^{\unicode[STIX]{x1D6FC}+1}),\end{eqnarray}$$
with
 $u_{k}^{M+1}=u_{k}^{1}$
. Standard results on quasi-variational inequalities, like those presented in Bensoussan and Lions (Reference Bensoussan and Lions1984, Chapter 4), imply the existence and uniqueness of
 $\mathbf{u}_{k}:=\{u_{k}^{\unicode[STIX]{x1D6FC}}\}_{\unicode[STIX]{x1D6FC}\in {\mathcal{A}}}\subset H_{0}^{1}(\unicode[STIX]{x1D6FA})$
that solves (5.4). In addition, adaptions of the results of Section 2.3 to the case of (quasi-) variational inequalities (i.e. by penalization and a limiting argument) allow us to conclude that
 $\mathbf{u}_{k}\subset W^{1,\infty }(\unicode[STIX]{x1D6FA})\cap W_{\text{loc}}^{2,p}(\unicode[STIX]{x1D6FA})$
(
 $p<\infty$
). The purpose of this system lies in the fact that, as
 $k\rightarrow 0$
, the solutions to (5.4) converge to the solution to (5.1). For a proof of the following result see Evans and Friedman (Reference Evans and Friedman1979, Theorem 7.2) and Bensoussan and Lions (Reference Bensoussan and Lions1984, Section 4.6).
Theorem 5.7 (convergence as
$k\rightarrow 0$
).

In the setting described above there exists a unique strong solution
 $u$
to (5.1). Moreover, defining
 $\mathbf{u}=\{u\}_{\unicode[STIX]{x1D6FC}\in {\mathcal{A}}}$
, we have
 $$\begin{eqnarray}\lim _{k\rightarrow 0}\Vert \mathbf{u}-\mathbf{u}_{k}\Vert _{\ell ^{\infty }({\mathcal{A}},L^{\infty }(\unicode[STIX]{x1D6FA}))}=0.\end{eqnarray}$$
It is remarkable that this result was shown before the development of the viscosity solutions of Section 2, and it was originally used to show the well-posedness of the Hamilton–Jacobi–Bellman equations. In addition, it can be used to propose finite element discretizations of (5.1) by instead discretizing (5.4). Then, if one is able to extend the standard
 $L^{\infty }(\unicode[STIX]{x1D6FA})$
-norm estimates for variational inequalities (see Nochetto, Otárola and Salgado Reference Nochetto, Otárola and Salgado2015, Theorem 2.9) and give a rate for the limit in Theorem 5.7, we obtain a convergent (with rates) finite element method. This programme has been carried out by Cortey-Dumont (Reference Cortey-Dumont1987), Boulbrachene and Haiour (Reference Boulbrachene and Haiour2001) and Boulbrachene and Cortey-Dumont (Reference Boulbrachene and Cortey-Dumont2009), with some success.
With the notation of Section 3.5 we begin by defining, for
 $k>0$
and
 $w_{h}\in X_{0,h}^{l}$
, the set
 $$\begin{eqnarray}{\mathcal{K}}_{h}(k,w_{h})=\{v_{h}\in X_{0,h}^{l}:v_{h}\leq k+w_{h}\},\end{eqnarray}$$
which is a closed and convex subset of
 $X_{0,h}^{l}$
. Moreover, we remark that it is sufficient to impose the inequality at the nodes
 $z\in \unicode[STIX]{x1D6FA}_{h}^{I}$
. We approximate the solution to (5.4) by the following set of discrete quasi-variational inequalities: find
 $u_{h}^{\unicode[STIX]{x1D6FC},k}\in {\mathcal{K}}_{h}(k,u_{h}^{\unicode[STIX]{x1D6FC}+1,k})$
such that
 $$\begin{eqnarray}a^{\unicode[STIX]{x1D6FC}}(u_{h}^{\unicode[STIX]{x1D6FC},k},u_{h}^{\unicode[STIX]{x1D6FC},k}-v_{h})\leq (f^{\unicode[STIX]{x1D6FC}},u_{h}^{\unicode[STIX]{x1D6FC},k}-v_{h}),\quad \text{for all}~v_{h}\in {\mathcal{K}}_{h}(k,u_{h}^{\unicode[STIX]{x1D6FC}+1,k}),\end{eqnarray}$$
with
 $u_{h}^{M+1,k}=u_{h}^{1,k}$
. Once again, it can be shown that this problem always has a unique solution
 $\mathbf{u}_{h,k}=\{u_{h}^{\unicode[STIX]{x1D6FC},k}\}_{\unicode[STIX]{x1D6FC}\in {\mathcal{A}}}\subset X_{0,h}^{l}$
.
To establish the
 $L^{\infty }(\unicode[STIX]{x1D6FA})$
-norm convergence of the solutions to (5.5) to the solution to (5.4), we must assume that the ensuing stiffness matrices are
 $M$
-matrices. Examining the proof of Lemma 3.42, we realize that for this to hold, it is sufficient to require that
 $$\begin{eqnarray}a^{\unicode[STIX]{x1D6FC}}(\unicode[STIX]{x1D719}_{i},\unicode[STIX]{x1D719}_{j})\leq 0,\quad \text{for all}~\unicode[STIX]{x1D6FC}\in {\mathcal{A}},~i\neq j,\end{eqnarray}$$
which we assume below.
Remark 5.8 (lack of generality).
The discussion of Section 3.5 shows that condition (5.6) is satisfied if the mesh is weakly acute in the metric induced by
 $A^{\unicode[STIX]{x1D6FC}}$
for all
 $\unicode[STIX]{x1D6FC}\in {\mathcal{A}}$
. This is a severe restriction in practice, as it is not clear how to impose such a condition for one matrix, let alone for a family of them.
Although a rate of convergence for the limit in Theorem 5.7 does not seem possible, there is a rate for the approximation of (5.4) by (5.5).
Theorem 5.9 (rate of convergence).
Assume that, for all
 $h>0$
, the family of triangulations
 ${\mathcal{T}}_{h}$
satisfies condition (5.6). Then we have
 $$\begin{eqnarray}\Vert \mathbf{u}_{k}-\mathbf{u}_{h,k}\Vert _{\ell ^{\infty }({\mathcal{A}},L^{\infty }(\unicode[STIX]{x1D6FA}))}\leq Ch^{2}\,|\text{log}\,h|^{3},\end{eqnarray}$$
where the constant
 $C>0$
depends on
 $M=\#{\mathcal{A}}$
and
 $k$
.
Proof. We will follow the ideas of Boulbrachene and Haiour (Reference Boulbrachene and Haiour2001) which, in turn, borrow from the iterative schemes used to prove existence of elliptic quasi-variational inequalities considered in Bensoussan and Lions (Reference Bensoussan and Lions1984, Chapter 4).
Step 1. We introduce the following iterative scheme. Define
 $\hat{\mathbf{u}}^{0}=\{\hat{u} ^{\unicode[STIX]{x1D6FC},0}\}_{\unicode[STIX]{x1D6FC}\in {\mathcal{A}}}$
as the solutions to the unconstrained problems, that is,
 $$\begin{eqnarray}a^{\unicode[STIX]{x1D6FC}}(\hat{u} ^{\unicode[STIX]{x1D6FC},0},v)=(f^{\unicode[STIX]{x1D6FC}},v),\quad \text{for all}~v\in H_{0}^{1}(\unicode[STIX]{x1D6FA}).\end{eqnarray}$$
Assuming that, for
 $n\geq 0$
,
 $\hat{\mathbf{u}}^{n}$
has been defined, we look for
 $\hat{u} ^{\unicode[STIX]{x1D6FC},n+1}\in {\mathcal{K}}(k,\hat{u} ^{\unicode[STIX]{x1D6FC}+1,n})$
such that
 $$\begin{eqnarray}a^{\unicode[STIX]{x1D6FC}}(\hat{u} ^{\unicode[STIX]{x1D6FC},n+1},\hat{u} ^{\unicode[STIX]{x1D6FC},n+1}-v)\leq (f^{\unicode[STIX]{x1D6FC}},\hat{u} ^{\unicode[STIX]{x1D6FC},n+1}-v),\quad \text{for all}~v\in {\mathcal{K}}(k,\hat{u} ^{\unicode[STIX]{x1D6FC}+1,n}).\end{eqnarray}$$
Using the positivity and order-preserving properties of the associated map, it is possible then to show that for
 $\unicode[STIX]{x1D706}<\min \{1,k/\Vert \hat{\mathbf{u}}^{0}\Vert _{\ell ^{\infty }({\mathcal{A}},L^{\infty }(\unicode[STIX]{x1D6FA}))}\}$
we have
 $$\begin{eqnarray}\Vert \mathbf{u}_{k}-\hat{\mathbf{u}}^{n}\Vert _{\ell ^{\infty }({\mathcal{A}},L^{\infty }(\unicode[STIX]{x1D6FA}))}\leq (1-\unicode[STIX]{x1D706})^{n}\Vert \hat{\mathbf{u}}^{0}\Vert _{\ell ^{\infty }({\mathcal{A}},L^{\infty }(\unicode[STIX]{x1D6FA}))}.\end{eqnarray}$$
Step 2. Define
 $\tilde{\mathbf{u}}_{h}^{0}=\{\tilde{u} _{h}^{\unicode[STIX]{x1D6FC},0}\}_{\unicode[STIX]{x1D6FC}\in {\mathcal{A}}}$
as the finite element approximation of the unconstrained problems, that is,
 $$\begin{eqnarray}a^{\unicode[STIX]{x1D6FC}}(\tilde{u} _{h}^{\unicode[STIX]{x1D6FC},0},v_{h})=(f^{\unicode[STIX]{x1D6FC}},v_{h}),\quad \text{for all}~v_{h}\in X_{0,h}^{l}.\end{eqnarray}$$
Using (5.6), we can invoke standard finite element error estimates for linear problems to obtain
 $$\begin{eqnarray}\Vert \hat{\mathbf{u}}^{0}-\tilde{\mathbf{u}}_{h}^{0}\Vert _{\ell ^{\infty }({\mathcal{A}},L^{\infty }(\unicode[STIX]{x1D6FA}))}\leq Ch^{2}\,|\text{log}\,h|^{2}.\end{eqnarray}$$
For each
 $n\geq 0$
we define
 $\tilde{u} _{h}^{\unicode[STIX]{x1D6FC},n+1}\in {\mathcal{K}}_{h}(k,\hat{u} ^{\unicode[STIX]{x1D6FC}+1,n})$
as the solution of
 $$\begin{eqnarray}a^{\unicode[STIX]{x1D6FC}}(\tilde{u} _{h}^{\unicode[STIX]{x1D6FC},n+1},\tilde{u} _{h}^{\unicode[STIX]{x1D6FC},n+1}-v_{h})\leq (f^{\unicode[STIX]{x1D6FC}},\tilde{u} _{h}^{\unicode[STIX]{x1D6FC},n+1}-v_{h}),\quad \text{for all}~v_{h}\in {\mathcal{K}}_{h}(k,I_{h}^{fe}\hat{u} ^{\unicode[STIX]{x1D6FC}+1,n}).\end{eqnarray}$$
Note that this is simply the finite element approximation of
 $\hat{u} ^{\unicode[STIX]{x1D6FC}+1,n}$
as the solution to an obstacle problem. Once again using (5.6), we can invoke pointwise estimates for obstacle problems (see Baiocchi Reference Baiocchi1977, and Theorem 2.9 of Nochetto et al. Reference Nochetto, Otárola and Salgado2015) to conclude that
 $$\begin{eqnarray}\Vert \hat{\mathbf{u}}^{n}-\tilde{\mathbf{u}}_{h}^{n}\Vert _{\ell ^{\infty }({\mathcal{A}},L^{\infty }(\unicode[STIX]{x1D6FA}))}\leq Ch^{2}\,|\text{log}\,h|^{2},\end{eqnarray}$$
where the constant is independent of
 $n$
.
Step 3. Introduce a discrete iterative scheme analogous to that given in Step 1. In other words, set
 $\hat{\mathbf{u}}_{h}^{0}=\tilde{\mathbf{u}}_{h}^{0}$
and, for
 $n\geq 0$
, find
 $\hat{u} _{h}^{\unicode[STIX]{x1D6FC},n+1}\in {\mathcal{K}}_{h}(k,\hat{u} _{h}^{\unicode[STIX]{x1D6FC}+1,n})$
as the solution of
 $$\begin{eqnarray}a^{\unicode[STIX]{x1D6FC}}(\hat{u} _{h}^{\unicode[STIX]{x1D6FC},n+1},\hat{u} _{h}^{\unicode[STIX]{x1D6FC},n+1}-v_{h})\leq (f^{\unicode[STIX]{x1D6FC}},\hat{u} _{h}^{\unicode[STIX]{x1D6FC},n+1}-v_{h}),\quad \text{for all}~v\in {\mathcal{K}}_{h}(k,\hat{u} _{h}^{\unicode[STIX]{x1D6FC}+1,n}).\end{eqnarray}$$
Similar techniques to those that led to (5.7) yield
 $$\begin{eqnarray}\Vert \mathbf{u}_{h,k}-\hat{\mathbf{u}}_{h}^{n}\Vert _{\ell ^{\infty }({\mathcal{A}},L^{\infty }(\unicode[STIX]{x1D6FA}))}\leq (1-\unicode[STIX]{x1D706})^{n}\Vert \hat{\mathbf{u}}_{h}^{0}\Vert _{\ell ^{\infty }({\mathcal{A}},L^{\infty }(\unicode[STIX]{x1D6FA}))}.\end{eqnarray}$$
Step 4. By induction, it can be shown that
 $$\begin{eqnarray}\Vert \hat{\mathbf{u}}^{n}-\hat{\mathbf{u}}_{h}^{n}\Vert _{\ell ^{\infty }({\mathcal{A}},L^{\infty }(\unicode[STIX]{x1D6FA}))}\leq \mathop{\sum }_{k=0}^{n}\Vert \hat{\mathbf{u}}^{k}-\tilde{\mathbf{u}}_{h}^{k}\Vert _{\ell ^{\infty }({\mathcal{A}},L^{\infty }(\unicode[STIX]{x1D6FA}))}.\end{eqnarray}$$
With this at hand, the triangle inequality yields
 $$\begin{eqnarray}\displaystyle \Vert \mathbf{u}_{k}-\mathbf{u}_{h,k}\Vert _{\ell ^{\infty }({\mathcal{A}},L^{\infty }(\unicode[STIX]{x1D6FA}))} & \leq & \displaystyle \Vert \mathbf{u}_{k}-\hat{\mathbf{u}}^{n}\Vert _{\ell ^{\infty }({\mathcal{A}},L^{\infty }(\unicode[STIX]{x1D6FA}))}+\Vert \hat{\mathbf{u}}_{h}^{n}-\mathbf{u}_{h,k}\Vert _{\ell ^{\infty }({\mathcal{A}},L^{\infty }(\unicode[STIX]{x1D6FA}))}\nonumber\\ \displaystyle & & \displaystyle \qquad +\,\mathop{\sum }_{k=0}^{n}\Vert \hat{\mathbf{u}}^{k}-\tilde{\mathbf{u}}_{h}^{k}\Vert _{\ell ^{\infty }({\mathcal{A}},L^{\infty }(\unicode[STIX]{x1D6FA}))},\nonumber\end{eqnarray}$$
so that by using (5.7)–(5.10) we obtain
 $$\begin{eqnarray}\Vert \mathbf{u}_{k}-\mathbf{u}_{h,k}\Vert _{\ell ^{\infty }({\mathcal{A}},L^{\infty }(\unicode[STIX]{x1D6FA}))}\leq C[(1-\unicode[STIX]{x1D706})^{n}+nh^{2}\,|\text{log}\,h|^{2}].\end{eqnarray}$$
Now choose
 $n$
so that
 $(1-\unicode[STIX]{x1D706})^{n}\approx h^{2}$
to obtain the result.
Remark 5.10 (
$k=0$
).

An algorithm similar to that used in the proof of Theorem 5.9 is studied in Lions and Mercier (Reference Lions and Mercier1980, Algorithme I) for
 $k=0$
. It is shown there that the ensuing iterates converge monotonically to
 $\mathbf{u}$
, but no rate is given.
5.2.2 Discretization for HJB satisfying the Cordes condition
Let us now discuss the case of (5.1) with non-divergence-form operators without lower-order terms, that is,
 ${\mathcal{L}}^{\unicode[STIX]{x1D6FC}}$
. For simplicity, we set
 $g=0$
. More importantly, we will assume that the coefficient matrices
 $A^{\unicode[STIX]{x1D6FC}}$
satisfy the Cordes condition of Definition 2.32. Furthermore, we will assume that the domain
 $\unicode[STIX]{x1D6FA}$
is convex and, finally, that
 ${\mathcal{A}}$
is a compact metric space.
The stated assumptions imply, invoking Theorem 2.39, that each one of the operators
 ${\mathcal{L}}^{\unicode[STIX]{x1D6FC}}$
is an isomorphism between
 $H^{2}(\unicode[STIX]{x1D6FA})\cap H_{0}^{1}(\unicode[STIX]{x1D6FA})$
and
 $L^{2}(\unicode[STIX]{x1D6FA})$
. Consequently, we can apply the techniques of Section 4.1 to each one. Now, following the arguments of Smears and Süli (Reference Smears and Süli2014), let us show that these assumptions also imply that problem (5.1) is also well-posed and that its solution is strong.
To do so we must assume that the Cordes condition holds uniformly in
 ${\mathcal{A}}$
which, from (2.16), yields the existence of
 $\unicode[STIX]{x1D716}>0$
for which
 $$\begin{eqnarray}\sup _{\unicode[STIX]{x1D6FC}\in {\mathcal{A}}}\Vert \unicode[STIX]{x1D6FE}^{\unicode[STIX]{x1D6FC}}{\mathcal{L}}^{\unicode[STIX]{x1D6FC}}v-\unicode[STIX]{x1D6E5}v\Vert _{L^{2}(\unicode[STIX]{x1D6FA})}\leq \sqrt{1-\unicode[STIX]{x1D716}}\Vert D^{2}v\Vert _{L^{2}(\unicode[STIX]{x1D6FA})},\quad \text{for all}~v\in H^{2}(\unicode[STIX]{x1D6FA}).\end{eqnarray}$$
This inequality motivates the definition of the (elliptic) nonlinear operator
 $$\begin{eqnarray}F_{\unicode[STIX]{x1D6FE}}[v]:=\sup _{\unicode[STIX]{x1D6FC}\in {\mathcal{A}}}[\unicode[STIX]{x1D6FE}^{\unicode[STIX]{x1D6FC}}({\mathcal{L}}^{\unicode[STIX]{x1D6FC}}v-f^{\unicode[STIX]{x1D6FC}})].\end{eqnarray}$$
The equivalence between problem
 $F_{\unicode[STIX]{x1D6FE}}[u]=0$
and (5.1) essentially follows from the continuity of the data and the positivity of
 $\unicode[STIX]{x1D6FE}^{\unicode[STIX]{x1D6FC}}$
. This result is summarized in the next lemma.
Lemma 5.11 (equivalence).
Suppose that
 $f^{\unicode[STIX]{x1D6FC}}$
and
 $A^{\unicode[STIX]{x1D6FC}}$
are uniformly continuous for each
 $\unicode[STIX]{x1D6FC}\in {\mathcal{A}}$
,
 ${\mathcal{A}}$
is compact, and
 $\unicode[STIX]{x1D6FA}$
is convex. The function
 $u\in H^{2}(\unicode[STIX]{x1D6FA})\cap H_{0}^{1}(\unicode[STIX]{x1D6FA})$
satisfies
 $F_{\unicode[STIX]{x1D6FE}}[u]=0$
 $\text{a.e.}~\unicode[STIX]{x1D6FA}$
(i.e.
 $u$
is a strong solution to this problem) if and only if it is a strong solution to (5.1).
Identity (5.11) and the algebraic identity
 $|\sup _{\unicode[STIX]{x1D6FC}\in {\mathcal{A}}}x^{\unicode[STIX]{x1D6FC}}-\sup _{\unicode[STIX]{x1D6FC}\in {\mathcal{A}}}y^{\unicode[STIX]{x1D6FC}}|\leq \sup _{\unicode[STIX]{x1D6FC}\in {\mathcal{A}}}|x^{\unicode[STIX]{x1D6FC}}-y^{\unicode[STIX]{x1D6FC}}|$
for bounded sequences
 $\{x^{\unicode[STIX]{x1D6FC}}\},\{y^{\unicode[STIX]{x1D6FC}}\}\subset \mathbb{R}$
then yields the following result.
Lemma 5.12 (continuity).
For all
 $u,v\in H^{2}(\unicode[STIX]{x1D6FA})$
we have
 $$\begin{eqnarray}|F_{\unicode[STIX]{x1D6FE}}[v]-F_{\unicode[STIX]{x1D6FE}}[w]-\unicode[STIX]{x1D6E5}(v-w)|\leq \sqrt{1-\unicode[STIX]{x1D716}}|D^{2}(v-w)|.\end{eqnarray}$$
Define
 $$\begin{eqnarray}G(v,w):=\int _{\unicode[STIX]{x1D6FA}}F_{\unicode[STIX]{x1D6FE}}[v]\unicode[STIX]{x1D6E5}w,\quad \text{for all}~v,w\in H^{2}(\unicode[STIX]{x1D6FA})\cap H_{0}^{1}(\unicode[STIX]{x1D6FA}).\end{eqnarray}$$
The estimate of Lemma 5.12 leads to the following (strong) monotonicity property of
 $G$
.
Theorem 5.13 (properties of
$G$
).

Under the given assumptions, there is a positive constant
 $C$
for which
 $$\begin{eqnarray}G(v,v-w)-G(w,v-w)\geq C(1-\sqrt{1-\unicode[STIX]{x1D716}})\Vert v-w\Vert _{H^{2}(\unicode[STIX]{x1D6FA})}^{2}\end{eqnarray}$$
for all
 $v,w\in H^{2}(\unicode[STIX]{x1D6FA})\cap H_{0}^{1}(\unicode[STIX]{x1D6FA})$
. In addition, if
 $A^{\unicode[STIX]{x1D6FC}}\in C(\bar{\unicode[STIX]{x1D6FA}},\mathbb{S}^{d})$
and
 $f^{\unicode[STIX]{x1D6FC}}\in C(\bar{\unicode[STIX]{x1D6FA}})$
, then
 $$\begin{eqnarray}|G(v,u)-G(w,u)|\leq C\Vert v-w\Vert _{H^{2}(\unicode[STIX]{x1D6FA})}\Vert u\Vert _{H^{2}(\unicode[STIX]{x1D6FA})}.\end{eqnarray}$$
Proof. Applying Lemma 5.12 yields
 $$\begin{eqnarray}\displaystyle & & \displaystyle G(v,v-w)-G(w,v-w)=\int _{\unicode[STIX]{x1D6FA}}(F_{\unicode[STIX]{x1D6FE}}[v]-F_{\unicode[STIX]{x1D6FE}}[w])\unicode[STIX]{x1D6E5}(v-w)\nonumber\\ \displaystyle & & \displaystyle \qquad =\Vert \unicode[STIX]{x1D6E5}(v-w)\Vert _{L^{2}(\unicode[STIX]{x1D6FA})}^{2}+\int _{\unicode[STIX]{x1D6FA}}(F_{\unicode[STIX]{x1D6FE}}[v]-F_{\unicode[STIX]{x1D6FE}}[w]-\unicode[STIX]{x1D6E5}(v-w))\unicode[STIX]{x1D6E5}(v-w)\nonumber\\ \displaystyle & & \displaystyle \qquad \geq \,\Vert \unicode[STIX]{x1D6E5}(v-w)\Vert _{L^{2}(\unicode[STIX]{x1D6FA})}^{2}-\sqrt{1-\unicode[STIX]{x1D716}}\Vert D^{2}(v-w)\Vert _{L^{2}(\unicode[STIX]{x1D6FA})}\Vert \unicode[STIX]{x1D6E5}(v-w)\Vert _{L^{2}(\unicode[STIX]{x1D6FA})}.\nonumber\end{eqnarray}$$
Since
 $\unicode[STIX]{x1D6FA}$
is convex, we can apply the Miranda–Talenti estimate (2.17) to get
 $$\begin{eqnarray}G(v,v-w)-G(w,v-w)\geq (1-\sqrt{1-\unicode[STIX]{x1D716}})\Vert \unicode[STIX]{x1D6E5}(v-w)\Vert _{L^{2}(\unicode[STIX]{x1D6FA})}^{2}.\end{eqnarray}$$
Inequality (5.13) now follows from the equivalence of
 $\Vert \unicode[STIX]{x1D6E5}\cdot \Vert _{L^{2}(\unicode[STIX]{x1D6FA})}$
and
 $\Vert \cdot \Vert _{H^{2}(\unicode[STIX]{x1D6FA})}$
on convex domains.
Finally, the Lipschitz property (5.14) follows from the continuity of the data and the Cauchy–Schwarz inequality.
Theorem 5.13 and Lemma 5.11, along with the Browder–Minty theorem and the fact that
 $\unicode[STIX]{x1D6E5}:H^{2}(\unicode[STIX]{x1D6FA})\cap H_{0}^{1}(\unicode[STIX]{x1D6FA})\rightarrow L^{2}(\unicode[STIX]{x1D6FA})$
is surjective on convex domains, yield the following existence and uniqueness result for the HJB problem (5.1); see Smears and Süli (Reference Smears and Süli2014, Theorem 3) for details.
Theorem 5.14 (existence and uniqueness).
Suppose that
 ${\mathcal{A}}$
is a compact metric space,
 $f^{\unicode[STIX]{x1D6FC}}\in C(\bar{\unicode[STIX]{x1D6FA}})$
, and
 $A^{\unicode[STIX]{x1D6FC}}\in C(\bar{\unicode[STIX]{x1D6FA}},\mathbb{S}^{d})$
satisfies the Cordes condition for each
 $\unicode[STIX]{x1D6FC}\in {\mathcal{A}}$
. Then there exists a unique strong solution
 $u\in H^{2}(\unicode[STIX]{x1D6FA})\cap H_{0}^{1}(\unicode[STIX]{x1D6FA})$
to
 $F_{\unicode[STIX]{x1D6FE}}[u]=0$
. Further,
 $u$
is also the unique strong solution to (5.1).
Let us now discuss how the finite element methods for linear problems given in Section 4.1 are extended to the nonlinear problem (5.1). While any of the methods given in that section can be adopted for the nonlinear problem, here we focus on the DG approximation (Smears and Süli Reference Smears and Süli2013, Reference Smears and Süli2014, Reference Smears and Süli2016).
Recall that
 $X_{h}^{\mathit{dg}}$
, defined by (4.11), is the piecewise polynomial space of degree
 $k$
with respect to a conforming and shape-regular, simplicial partition of
 $\unicode[STIX]{x1D6FA}$
. As in Section 4.1, we will only consider the
 $h$
-version of the method, where the polynomial degree is globally fixed, and we will not follow the dependence on the polynomial degree
 $k$
of all the ensuing constants. We refer the reader to Smears and Süli (Reference Smears and Süli2014), who consider
 $hp$
-DG methods.
The DG method for the linear problem (4.17) extends to the nonlinear problem (5.1) by essentially taking the supremum over
 ${\mathcal{A}}$
. This yields the following scheme: find
 $u_{h}\in X_{h}^{\mathit{dg}}$
such that
 $$\begin{eqnarray}G_{h}^{\mathit{dg}}(u_{h},v_{h}):=\mathop{\sum }_{K\in {\mathcal{T}}_{h}}\int _{K}[F_{\unicode[STIX]{x1D6FE}}[u_{h}]-\unicode[STIX]{x1D6E5}u_{h}]\unicode[STIX]{x1D6E5}v_{h}+\displaystyle \frac{1}{2}B_{h}(u_{h},v_{h})=0,\end{eqnarray}$$
where
 $B_{h}(\cdot ,\cdot )$
is the bilinear form defined by (4.14) with penalty parameter
 $\unicode[STIX]{x1D707}>0$
. Recall from Section 4.1 that if
 $u\in H^{s}(\unicode[STIX]{x1D6FA})\cap H_{0}^{1}(\unicode[STIX]{x1D6FA})$
with
 $s>5/2$
, then
 $$\begin{eqnarray}B_{h}(u,v_{h})=2\mathop{\sum }_{K\in {\mathcal{T}}_{h}}\int _{K}\unicode[STIX]{x1D6E5}u\unicode[STIX]{x1D6E5}v_{h},\quad \text{for all }v_{h}\in X_{h}^{\mathit{dg}}.\end{eqnarray}$$
Therefore (5.15) is a consistent method, that is,
 $G_{h}^{\mathit{dg}}(u,v_{h})=0$
for all
 $v_{h}\in X_{h}^{\mathit{dg}}$
provided
 $u$
is sufficiently smooth. In addition, as in the linear case, the coercivity properties of
 $B_{h}$
ensure that the structural properties found at the continuous level carry over. That is, we have the following result (see Smears and Süli Reference Smears and Süli2014, Theorem 7).
Theorem 5.15 (properties of
$G_{h}^{\mathit{dg}}$
).

Suppose that the hypotheses in Theorem 5.13 are satisfied. Then there exists
 $\unicode[STIX]{x1D707}_{\ast }=O(\unicode[STIX]{x1D716}^{-1})$
such that if
 $\unicode[STIX]{x1D707}\geq \unicode[STIX]{x1D707}_{\ast }$
, then
 $$\begin{eqnarray}C\Vert v_{h}-w_{h}\Vert _{\mathit{DG}(1)}^{2}\leq G_{h}^{\mathit{dg}}(v_{h},v_{h}-w_{h})-G_{h}^{\mathit{dg}}(w_{h},v_{h}-w_{h}),\end{eqnarray}$$
for all
 $v_{h},w_{h}\in X_{h}^{\mathit{dg}}$
, where the discrete
 $H^{2}(\unicode[STIX]{x1D6FA})$
-norm
 $\Vert \cdot \Vert _{\mathit{DG}(1)}$
is defined by (4.15). Moreover, there exists a constant
 $C>0$
such that, for all
 $v_{h},w_{h},u_{h}\in X_{h}^{cg}$
,
 $$\begin{eqnarray}|G_{h}^{\mathit{dg}}(v_{h},u_{h})-G_{h}^{\mathit{dg}}(w_{h},u_{h})|\leq C\Vert v_{h}-w_{h}\Vert _{\mathit{DG}(1)}\Vert u_{h}\Vert _{\mathit{DG}(1)}.\end{eqnarray}$$
Similar to the continuous setting, Theorem 5.15 yields existence and uniqueness for the DG method.
Corollary 5.16 (existence and uniqueness).
If the hypotheses of Theorem 5.15 hold, then there exists a unique
 $u_{h}\in X_{h}^{\mathit{dg}}$
satisfying (5.15).
Finally, stability/monotonicity and the consistency of the method lead to the following error estimates. We refer to Smears and Süli (Reference Smears and Süli2014, Theorem 8) for a proof.
Theorem 5.17 (rates of convergence).
Suppose that the hypotheses of Theorem 5.15 hold. Let
 $u_{h}\in X_{h}^{\mathit{dg}}$
be the solution to (5.15), and suppose that the solution to (5.1) has regularity
 $u\in H^{s}(\unicode[STIX]{x1D6FA})$
with
 $5/2<s\leq k+1$
. Then the error satisfies
 $$\begin{eqnarray}\Vert u-u_{h}\Vert _{\mathit{DG}(1)}\leq Ch^{s-2}\Vert u\Vert _{H^{s}(\unicode[STIX]{x1D6FA})}.\end{eqnarray}$$
5.2.3 Finite element methods for parabolic isotropic HJB problems
In this section we depart from the elliptic framework and discuss the finite element method for parabolic (time-dependent) Hamilton–Jacobi–Bellman problems developed by Jensen and Smears (Reference Jensen and Smears2013b ). Assuming homogeneous Dirichlet boundary conditions, we consider numerical approximations of the problem:
 $$\begin{eqnarray}\left\{\begin{array}{@{}ll@{}}\displaystyle \frac{\unicode[STIX]{x2202}u}{\unicode[STIX]{x2202}t}-\sup _{\unicode[STIX]{x1D6FC}\in {\mathcal{A}}}[\tilde{{\mathcal{L}}}^{\unicode[STIX]{x1D6FC}}u-f^{\unicode[STIX]{x1D6FC}}]=0\quad & \text{in }\unicode[STIX]{x1D6FA}\times (0,T),\\ u=0\quad & \text{on }\unicode[STIX]{x2202}\unicode[STIX]{x1D6FA}\times (0,T),\\ u=u_{0}\quad & \text{on }\bar{\unicode[STIX]{x1D6FA}}\times \{0\},\end{array}\right.\end{eqnarray}$$
where
 $u_{0}\in C(\bar{\unicode[STIX]{x1D6FA}})$
is the initial time condition and
 $T$
is the (finite) end-time. As before, we assume that
 ${\mathcal{A}}$
is compact and that the coefficients are uniformly continuous in
 $\bar{\unicode[STIX]{x1D6FA}}$
. In addition, we assume that the coefficients are time-independent,
 $f^{\unicode[STIX]{x1D6FC}}\geq 0$
,
 $c^{\unicode[STIX]{x1D6FC}}\leq 0$
,
 $u_{0}\geq 0$
, and, most importantly, the elliptic operator
 ${\mathcal{L}}^{\unicode[STIX]{x1D6FC}}$
is isotropic, that is,
 $$\begin{eqnarray}\tilde{{\mathcal{L}}}^{\unicode[STIX]{x1D6FC}}u(x)=a^{\unicode[STIX]{x1D6FC}}(x)\unicode[STIX]{x1D6E5}u(x)+\mathbf{b}^{\unicode[STIX]{x1D6FC}}(x)\cdot Du(x)+c^{\unicode[STIX]{x1D6FC}}(x)u(x),\end{eqnarray}$$
with
 $a^{\unicode[STIX]{x1D6FC}}\geq 0$
. Note that, even in the isotropic case, each elliptic operator is in non-divergence form.
Before discussing the finite element method let us first extend the definition of viscosity solutions to the parabolic setting (compare Definition 2.48).
Definition 5.18 (viscosity solution).
-
(a) A function
$u_{\star }\in \mathit{USC}(\bar{\unicode[STIX]{x1D6FA}}\times [0,T])$
is a viscosity subsolution to (5.16) if
$u_{\star }\leq 0$
on
$\unicode[STIX]{x2202}\unicode[STIX]{x1D6FA}\times (0,T)$
,
$u_{\star }\leq u_{0}$
on
$\bar{\unicode[STIX]{x1D6FA}}\times \{0\}$
, and if, whenever and
$$\begin{eqnarray}(x_{0},t_{0})\in \unicode[STIX]{x1D6FA}\times (0,T),\quad \unicode[STIX]{x1D711}\in C^{2}((0,T)\times \unicode[STIX]{x1D6FA})\end{eqnarray}$$
$u_{\star }-\unicode[STIX]{x1D711}$
has a local maximum at
$(x_{0},t_{0})$
, we have that
$$\begin{eqnarray}\displaystyle \frac{\unicode[STIX]{x2202}\unicode[STIX]{x1D711}}{\unicode[STIX]{x2202}t}(x_{0},t_{0})-\sup _{\unicode[STIX]{x1D6FC}\in {\mathcal{A}}}(\tilde{{\mathcal{L}}}^{\unicode[STIX]{x1D6FC}}(x_{0})\unicode[STIX]{x1D711}(x_{0},t_{0})-f^{\unicode[STIX]{x1D6FC}}(x_{0}))\leq 0.\end{eqnarray}$$
-
(b) A function
$u^{\star }\in \mathit{LSC}(\bar{\unicode[STIX]{x1D6FA}}\times [0,T])$
is a viscosity supersolution to (5.16) if
$u^{\star }\geq 0$
on
$\unicode[STIX]{x2202}\unicode[STIX]{x1D6FA}\times (0,T)$
,
$u^{\star }\geq u_{0}$
on
$\bar{\unicode[STIX]{x1D6FA}}\times \{0\}$
, and if, whenever and
$$\begin{eqnarray}(x_{0},t_{0})\in \unicode[STIX]{x1D6FA}\times (0,T),\quad \unicode[STIX]{x1D711}\in C^{2}((0,T)\times \unicode[STIX]{x1D6FA})\end{eqnarray}$$
$u_{\star }-\unicode[STIX]{x1D711}$
has a local minimum at
$(x_{0},t_{0})$
, we have that
$$\begin{eqnarray}\displaystyle \frac{\unicode[STIX]{x2202}\unicode[STIX]{x1D711}}{\unicode[STIX]{x2202}t}(x_{0},t_{0})-\sup _{\unicode[STIX]{x1D6FC}\in {\mathcal{A}}}(\tilde{{\mathcal{L}}}^{\unicode[STIX]{x1D6FC}}(x_{0})\unicode[STIX]{x1D711}(x_{0},t_{0})-f^{\unicode[STIX]{x1D6FC}}(x_{0}))\geq 0.\end{eqnarray}$$
-
(c) A function
$u\in C(\bar{\unicode[STIX]{x1D6FA}}\times [0,T])$
is a viscosity solution to (5.16) if it is both a sub- and supersolution.







The discretization of the non-divergence part of
 $\tilde{{\mathcal{L}}}^{\unicode[STIX]{x1D6FC}}$
proposed by Jensen and Smears (Reference Jensen and Smears2013b
) is based on a ‘freezing the coefficients’ strategy. Let
 $\{\unicode[STIX]{x1D719}_{i}\}\subset X_{0,h}^{l}$
be the normalized hat functions defined in Section 3.5, where we recall that
 $X_{0,h}^{l}$
is the space of piecewise linear polynomials with vanishing trace (see (3.35)). Then, since
 $\unicode[STIX]{x1D719}_{i}$
is essentially a regularized Dirac delta distribution, if a point
 $x\in \unicode[STIX]{x1D6FA}$
is close to a node
 $z_{i}\in \unicode[STIX]{x1D6FA}_{h}^{I}$
, then we have, at least formally,
 $$\begin{eqnarray}a^{\unicode[STIX]{x1D6FC}}(x)\unicode[STIX]{x1D6E5}u(x)\approx -a^{\unicode[STIX]{x1D6FC}}(z_{i})\int _{\unicode[STIX]{x1D6FA}}Du\cdot D\unicode[STIX]{x1D719}_{i}=a^{\unicode[STIX]{x1D6FC}}(z_{i})\unicode[STIX]{x1D6E5}_{h}I_{h}^{ep}u(z_{i}),\end{eqnarray}$$
where the finite element Laplacian
 $\unicode[STIX]{x1D6E5}_{h}$
is given by (3.39), and
 $I_{h}^{ep}$
is the elliptic projection. This heuristic approximation motivates the following semi-discrete finite element method: find
 $u_{h}:[0,T]\rightarrow X_{0,h}^{l}$
such that
 $u_{h}(0)=I_{h}^{fe}u_{0}$
and
 $$\begin{eqnarray}\displaystyle \frac{\unicode[STIX]{x2202}u_{h}}{\unicode[STIX]{x2202}t}-\sup _{\unicode[STIX]{x1D6FC}\in {\mathcal{A}}}(\tilde{{\mathcal{L}}}_{h}^{\unicode[STIX]{x1D6FC}}u_{h}-f_{h}^{\unicode[STIX]{x1D6FC}})=0\quad \text{in }\unicode[STIX]{x1D6FA}_{h}^{I}\times (0,T),\end{eqnarray}$$
where
 $I_{h}^{fe}:C^{0}(\bar{\unicode[STIX]{x1D6FA}})\rightarrow X_{h}^{l}$
is the nodal interpolant onto
 $X_{h}^{l}$
, and the discrete operator and discrete source function are given respectively by
 $$\begin{eqnarray}\displaystyle \tilde{{\mathcal{L}}}_{h}^{\unicode[STIX]{x1D6FC}}u_{h}(z_{i}) & = & \displaystyle a^{\unicode[STIX]{x1D6FC}}(z_{i})\unicode[STIX]{x1D6E5}_{h}u_{h}(z_{i})+\int _{\unicode[STIX]{x1D6FA}}(\mathbf{b}^{\unicode[STIX]{x1D6FC}}\cdot Du_{h}+c^{\unicode[STIX]{x1D6FC}}u_{h})\unicode[STIX]{x1D719}_{i},\nonumber\\ \displaystyle f_{h}^{\unicode[STIX]{x1D6FC}}(z_{i}) & = & \displaystyle \int _{\unicode[STIX]{x1D6FA}}f^{\unicode[STIX]{x1D6FC}}\unicode[STIX]{x1D719}_{i}.\nonumber\end{eqnarray}$$
The fully discrete method proposed in Jensen and Smears (Reference Jensen and Smears2013b
) applies a one-step explicit–implicit ODE solver to a regularized version of (5.17). Let
 $\unicode[STIX]{x1D70F}\in (0,1)$
be the (uniform) time step size and assume that
 $T/\unicode[STIX]{x1D70F}=:M\in \mathbb{N}$
. For a sequence of discrete functions
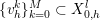 $\{v_{h}^{k}\}_{k=0}^{M}\subset X_{0,h}^{l}$
, we define the backward difference quotient as
 $$\begin{eqnarray}d_{\unicode[STIX]{x1D70F}}v_{h}^{k+1}:=\displaystyle \frac{1}{\unicode[STIX]{x1D70F}}(v_{h}^{k+1}-v_{h}^{k})\in X_{0,h}^{l}.\end{eqnarray}$$
For each
 $\unicode[STIX]{x1D6FC}\in {\mathcal{A}}$
, the discrete operator
 $\tilde{{\mathcal{L}}}_{h}^{\unicode[STIX]{x1D6FC}}$
is approximately split into an explicit and implicit part,
 $$\begin{eqnarray}\tilde{{\mathcal{L}}}_{h}^{\unicode[STIX]{x1D6FC}}\approx {\mathcal{E}}_{h}^{\unicode[STIX]{x1D6FC}}+{\mathcal{I}}_{h}^{\unicode[STIX]{x1D6FC}},\end{eqnarray}$$
with
 $$\begin{eqnarray}\displaystyle {\mathcal{E}}_{h}^{\unicode[STIX]{x1D6FC}}u_{h}(z_{i}) & = & \displaystyle a_{e}^{\unicode[STIX]{x1D6FC}}(z_{i})\unicode[STIX]{x1D6E5}_{h}u_{h}(z_{i})+\int _{\unicode[STIX]{x1D6FA}}(\mathbf{b}_{e}^{\unicode[STIX]{x1D6FC}}\cdot Du_{h}+c_{e}u_{h})\unicode[STIX]{x1D719}_{i},\nonumber\\ \displaystyle {\mathcal{I}}_{h}^{\unicode[STIX]{x1D6FC}}u_{h}(z_{i}) & = & \displaystyle a_{i}^{\unicode[STIX]{x1D6FC}}(z_{i})\unicode[STIX]{x1D6E5}_{h}u_{h}(z_{i})+\int _{\unicode[STIX]{x1D6FA}}(\mathbf{b}_{i}^{\unicode[STIX]{x1D6FC}}\cdot Du_{h}+c_{i}u_{h})\unicode[STIX]{x1D719}_{i}.\nonumber\end{eqnarray}$$
We now consider the following fully discrete method: find the sequence
 $\{u_{h}^{k}\}_{k=0}^{M}\subset X_{0,h}^{l}$
with
 $u_{h}^{0}=I_{h}^{fe}u_{0}$
and
 $$\begin{eqnarray}d_{\unicode[STIX]{x1D70F}}u_{h}^{k+1}-\sup _{\unicode[STIX]{x1D6FC}\in {\mathcal{A}}}({\mathcal{E}}_{h}^{\unicode[STIX]{x1D6FC}}u_{h}^{k}+{\mathcal{I}}_{h}^{\unicode[STIX]{x1D6FC}}u_{h}^{k+1}-f_{h}^{\unicode[STIX]{x1D6FC}})\quad \text{in }\unicode[STIX]{x1D6FA}_{h}^{I}.\end{eqnarray}$$
To show the well-posedness and to analyse method (5.19), we make several assumptions. First we quantify the approximation in (5.18) and make assumptions of the coefficients in the explicit and implicit operators.
Assumption 5.19 (coefficients).
We assume that the coefficients satisfy
 $$\begin{eqnarray}\displaystyle & & \displaystyle \lim _{h\rightarrow 0}\sup _{\unicode[STIX]{x1D6FC}\in {\mathcal{A}}}\Bigl(\sup _{z\in \unicode[STIX]{x1D6FA}_{h}^{I}}\Vert a^{\unicode[STIX]{x1D6FC}}-(a_{e}^{\unicode[STIX]{x1D6FC}}(z)+a_{i}^{\unicode[STIX]{x1D6FC}}(z))\Vert _{L^{\infty }(\unicode[STIX]{x1D714}_{z})}\nonumber\\ \displaystyle & & \displaystyle \qquad +\,\Vert \mathbf{b}^{\unicode[STIX]{x1D6FC}}-(\mathbf{b}_{e}^{\unicode[STIX]{x1D6FC}}+\mathbf{b}_{i}^{\unicode[STIX]{x1D6FC}})\Vert _{L^{\infty }(\unicode[STIX]{x1D6FA})}+\Vert c^{\unicode[STIX]{x1D6FC}}-(c_{e}^{\unicode[STIX]{x1D6FC}}+c_{i}^{\unicode[STIX]{x1D6FC}})\Vert _{L^{\infty }(\unicode[STIX]{x1D6FA})}\Bigr)=0.\nonumber\end{eqnarray}$$
In addition, when
 ${\mathcal{A}}$
is not finite, we also assume that the mappings
 $\unicode[STIX]{x1D6FC}\mapsto (a_{e}^{\unicode[STIX]{x1D6FC}},\mathbf{b}_{e}^{\unicode[STIX]{x1D6FC}},c_{i}^{\unicode[STIX]{x1D6FC}})$
and
 $\unicode[STIX]{x1D6FC}\mapsto (a_{i}^{\unicode[STIX]{x1D6FC}},\mathbf{b}_{i}^{\unicode[STIX]{x1D6FC}},c_{i}^{\unicode[STIX]{x1D6FC}})$
are continuous,
 $a_{e},a_{i}\geq 0$
, and
 $c_{e},c_{i}\leq 0$
.
Next we make assumptions regarding the monotonicity properties of the operators.
Assumption 5.20 (monotonicity).
The splitting (5.18) has the following properties.
-
(a) The time-step explicit operators satisfy
(5.20)where
$$\begin{eqnarray}\unicode[STIX]{x1D6FF}_{i,j}+\unicode[STIX]{x1D70F}{\mathcal{E}}_{h}^{\unicode[STIX]{x1D6FC}}(\tilde{\unicode[STIX]{x1D719}}_{j})(z_{i})\geq 0,\quad \text{for all}~\unicode[STIX]{x1D6FC}\in {\mathcal{A}},\end{eqnarray}$$
$\{\tilde{\unicode[STIX]{x1D719}}_{j}\}\subset X_{0,h}^{l}$
are the (unnormalized) hat functions satisfying
$\tilde{\unicode[STIX]{x1D719}}_{j}(z_{i})=\unicode[STIX]{x1D6FF}_{i,j}$
.
-
(b) The operator
${\mathcal{I}}_{h}^{\unicode[STIX]{x1D6FC}}$
is monotone (in the sense of Definition 3.5) for each
$\unicode[STIX]{x1D6FC}\in {\mathcal{A}}$
.


Condition (5.20) is essentially a time-step restriction and a monotonicity condition (if
 ${\mathcal{E}}_{h}^{\unicode[STIX]{x1D6FC}}\not \equiv 0$
for all
 $\unicode[STIX]{x1D6FC}\in {\mathcal{A}}$
). For example, if
 $c_{e}^{\unicode[STIX]{x1D6FC}}\equiv 0$
,
 $\mathbf{b}_{e}^{\unicode[STIX]{x1D6FC}}\equiv 0$
, and
 $a_{e}^{\unicode[STIX]{x1D6FC}}>0$
for all
 $\unicode[STIX]{x1D6FC}\in {\mathcal{A}}$
, then the condition reads
 $$\begin{eqnarray}\unicode[STIX]{x1D6FF}_{i,j}-\unicode[STIX]{x1D70F}a_{e}^{\unicode[STIX]{x1D6FC}}(z_{i})\int _{\unicode[STIX]{x1D6FA}}D\tilde{\unicode[STIX]{x1D719}}_{j}\cdot D\unicode[STIX]{x1D719}_{i}\geq 0.\end{eqnarray}$$
Therefore, in this setting, (5.20) is satisfied if and only if (3.42) holds (so that
 $\unicode[STIX]{x1D6E5}_{h}$
is monotone) and if
 $$\begin{eqnarray}\unicode[STIX]{x1D70F}\leq \biggl(a_{e}^{\unicode[STIX]{x1D6FC}}(z_{i})\int _{\unicode[STIX]{x1D6FA}}D\unicode[STIX]{x1D719}_{i}\cdot D\tilde{\unicode[STIX]{x1D719}}_{i}\biggr)^{-1}=O(h^{2}).\end{eqnarray}$$
The monotonicity of
 ${\mathcal{I}}_{h}^{\unicode[STIX]{x1D6FC}}$
implies that the inverse of
 $(I-\unicode[STIX]{x1D70F}{\mathcal{I}}_{h}^{\unicode[STIX]{x1D6FC}})$
is sign-preserving for any
 $\unicode[STIX]{x1D70F}>0$
, that is, if
 $(I-\unicode[STIX]{x1D70F}{\mathcal{I}}_{h}^{\unicode[STIX]{x1D6FC}})v_{h}\leq 0~(\geq 0)$
, then
 $v_{h}\leq 0~(\geq 0)$
. To see this, suppose that
 $v_{h}\in X_{0,h}^{l}$
satisfies
 $(I-\unicode[STIX]{x1D70F}{\mathcal{I}}_{h}^{\unicode[STIX]{x1D6FC}})v_{h}\leq 0$
and
 $v_{h}$
has a positive maximum at
 $z_{i}$
. Then the monotonicity of
 ${\mathcal{I}}_{h}^{\unicode[STIX]{x1D6FC}}$
implies
 ${\mathcal{I}}_{h}^{\unicode[STIX]{x1D6FC}}v_{h}(z_{i})\leq 0$
(see Definition 3.5), leading to
 $(I-\unicode[STIX]{x1D70F}{\mathcal{I}}_{h}^{\unicode[STIX]{x1D6FC}})v_{h}(z_{i})\geq v_{h}(z_{i})>0$
, a contradiction. This argument also shows that
 $(I-\unicode[STIX]{x1D70F}{\mathcal{I}}_{h}^{\unicode[STIX]{x1D6FC}})$
is invertible, and therefore the following problem is well-posed. For fixed
 $\unicode[STIX]{x1D6FC}\in {\mathcal{A}}$
, find
 $\{u_{h,\unicode[STIX]{x1D6FC}}^{k}\}_{k=0}^{M}\subset X_{0,h}^{l}$
such that
 $u_{h,\unicode[STIX]{x1D6FC}}^{0}=I_{h}^{fe}u_{0}$
and
 $(k=0,1,\ldots ,M-1)$
 $$\begin{eqnarray}d_{\unicode[STIX]{x1D70F}}u_{h,\unicode[STIX]{x1D6FC}}^{k+1}-({\mathcal{E}}_{h}^{\unicode[STIX]{x1D6FC}}u_{h,\unicode[STIX]{x1D6FC}}^{k}+{\mathcal{I}}_{h}^{\unicode[STIX]{x1D6FC}}u_{h,\unicode[STIX]{x1D6FC}}^{k+1}-f_{h})\quad \text{in }\unicode[STIX]{x1D6FA}_{h}^{I},\quad u_{h,\unicode[STIX]{x1D6FC}}^{0}=I_{h}^{fe}u_{0}.\end{eqnarray}$$
The construction of operators
 ${\mathcal{E}}_{h}^{\unicode[STIX]{x1D6FC}}$
,
 ${\mathcal{I}}_{h}^{\unicode[STIX]{x1D6FC}}$
satisfying Assumptions 5.19–5.20 (on weakly acute triangulations) using the method of artificial diffusion can be found in Jensen and Smears (Reference Jensen and Smears2013b
, Section 8) and Jensen and Smears (Reference Jensen, Smears and Cangiani2013a
).
Theorem 5.21 (existence).
Suppose that Assumptions 5.19 and 5.20 are satisfied. Then for each
 $k\in \{0,1,\ldots ,M-1\}$
there exists a unique solution
 $u_{h}^{k+1}\in X_{0,h}^{l}$
to (5.19). Moreover, if we let
 $\{u_{h,\unicode[STIX]{x1D6FC}}^{k}\}\subset X_{0,h}^{l}$
denote the solution to (5.21), then
 $0\leq u_{h}^{k}\leq u_{h,\unicode[STIX]{x1D6FC}}^{k}$
.
The proof of existence and uniqueness follows from the convergence results of Howard’s method, which is discussed in the next section. The monotonicity and continuity properties of
 ${\mathcal{E}}_{h}^{\unicode[STIX]{x1D6FC}}$
,
 ${\mathcal{I}}_{h}^{\unicode[STIX]{x1D6FC}}$
ensure that the hypotheses of Theorem 5.31 below are satisfied (see Jensen and Smears Reference Jensen and Smears2013b
, Theorem 3.1).
The next result establishes the stability of the method. Its proof essentially follows from Assumption 5.20 and the non-positivity of
 $c_{e}^{\unicode[STIX]{x1D6FC}}$
and
 $c_{i}^{\unicode[STIX]{x1D6FC}}$
; see Jensen and Smears (Reference Jensen and Smears2013b
, Lemma 3.2 and Corollary 3.3) for details.
Lemma 5.22 (stability).
Suppose that the assumptions of Theorem 5.21 hold, and let
 $\{u_{h,\unicode[STIX]{x1D6FC}}^{k}\}\subset X_{0,h}^{l}$
denote the solution to (5.21) for a fixed
 $\unicode[STIX]{x1D6FC}\in {\mathcal{A}}$
. Then we have
 $$\begin{eqnarray}\Vert \{u_{h,\unicode[STIX]{x1D6FC}}^{k}\}_{k=0}^{M}\Vert _{\ell ^{\infty }(\mathbb{N}\cap [0,M],L^{\infty }(\unicode[STIX]{x1D6FA}))}\leq \Vert I_{h}^{fe}u_{0}\Vert _{L^{\infty }(\unicode[STIX]{x1D6FA})}+T\Vert f^{\unicode[STIX]{x1D6FC}}\Vert _{L^{\infty }(\unicode[STIX]{x1D6FA})}.\end{eqnarray}$$
Therefore, by Theorem 5.21,
 $$\begin{eqnarray}\Vert \{u_{h}^{k}\}_{k=0}^{M}\Vert _{\ell ^{\infty }(\mathbb{N}\cap [0,M],L^{\infty }(\unicode[STIX]{x1D6FA}))}\leq \Vert I_{h}^{fe}u_{0}\Vert _{L^{\infty }(\unicode[STIX]{x1D6FA})}+T\inf _{\unicode[STIX]{x1D6FC}\in {\mathcal{A}}}\Vert f^{\unicode[STIX]{x1D6FC}}\Vert _{L^{\infty }(\unicode[STIX]{x1D6FA})}.\end{eqnarray}$$
Next, to apply the Barles–Souganidis theory, we look at the consistency of the method. Essentially this result follows from Lemma 3.41 and the stability of the elliptic projection.
Lemma 5.23 (consistency).
Let
 $I_{h}^{ep}:H^{1}(\unicode[STIX]{x1D6FA})\rightarrow X_{h}^{l}$
be the elliptic projection onto
 $X_{h}^{l}$
. Let
 $\{(z_{h},t_{\unicode[STIX]{x1D70F}})\}_{h>0,\unicode[STIX]{x1D70F}>0}$
with
 $(z_{h},t_{\unicode[STIX]{x1D70F}})\in \bar{\unicode[STIX]{x1D6FA}}_{h}\times \mathbb{N}\cap [0,M]$
and
 $(z_{h},t_{\unicode[STIX]{x1D70F}})\rightarrow (z_{0},t_{0})\in \bar{\unicode[STIX]{x1D6FA}}\times [0,T]$
as
 $h,\unicode[STIX]{x1D70F}\rightarrow 0^{+}$
. Then, for any
 $\unicode[STIX]{x1D719}\in C^{2}(\bar{\unicode[STIX]{x1D6FA}}\times [0,T])$
,
 $$\begin{eqnarray}\displaystyle & & \displaystyle \lim _{h,\unicode[STIX]{x1D70F}\rightarrow 0^{+}}(d_{\unicode[STIX]{x1D70F}}I_{h}^{ep}\unicode[STIX]{x1D719}(t_{\unicode[STIX]{x1D70F}}+\unicode[STIX]{x1D70F})-({\mathcal{E}}_{h}^{\unicode[STIX]{x1D6FC}}I_{h}^{ep}(\unicode[STIX]{x1D719}(t_{\unicode[STIX]{x1D70F}}))+{\mathcal{I}}_{h}^{\unicode[STIX]{x1D6FC}}I_{h}^{ep}(\unicode[STIX]{x1D719}(t_{\unicode[STIX]{x1D70F}}+\unicode[STIX]{x1D70F}))-f_{h}^{\unicode[STIX]{x1D6FC}}))(z_{h})\nonumber\\ \displaystyle & & \displaystyle \qquad =\displaystyle \frac{\unicode[STIX]{x2202}\unicode[STIX]{x1D719}}{\unicode[STIX]{x2202}t}(z_{0},t_{0})-(\tilde{{\mathcal{L}}}^{\unicode[STIX]{x1D6FC}}\unicode[STIX]{x1D719}(z_{0},t_{0})-f^{\unicode[STIX]{x1D6FC}}(z_{0})),\quad \text{for all}~\unicode[STIX]{x1D6FC}\in {\mathcal{A}},\nonumber\end{eqnarray}$$
where
 $\unicode[STIX]{x1D719}(t):=\unicode[STIX]{x1D719}(\cdot ,t)$
, and the convergence is uniform with respect to
 $\unicode[STIX]{x1D6FC}\in {\mathcal{A}}$
.
Remark 5.24 (anisotropy).
Note that the consistency result given in Lemma 5.23 does not extend to operators with anisotropic diffusion.
Finally to apply Theorem 3.8, the following assumption is made, which ensures that the limiting solution satisfies the boundary conditions in a classical sense.
Assumption 5.25 (limiting boundary values).
Define
 $\bar{u}_{\unicode[STIX]{x1D6FC}}\in \mathit{USC}(\bar{\unicode[STIX]{x1D6FA}}\times [0,T])$
:
 $$\begin{eqnarray}\bar{u}_{\unicode[STIX]{x1D6FC}}(x,t):=\limsup _{\substack{ (z,k\unicode[STIX]{x1D70F})\rightarrow (x,t) \\ h,\unicode[STIX]{x1D70F}\rightarrow 0^{+}}}u_{h,\unicode[STIX]{x1D6FC}}^{k}(z),\end{eqnarray}$$
where
 $u_{h,\unicode[STIX]{x1D6FC}}^{k}$
is the solution to (5.21). Then
 $$\begin{eqnarray}\inf _{\unicode[STIX]{x1D6FC}\in {\mathcal{A}}}\bar{u}_{\unicode[STIX]{x1D6FC}}(x,t)=0,\quad \text{for all}~(x,t)\in \unicode[STIX]{x2202}\unicode[STIX]{x1D6FA}\times [0,T].\end{eqnarray}$$
Finally, combining Lemmas 5.23 and 5.22 with Theorem 3.8 yields the following convergence result; see Jensen and Smears (Reference Jensen and Smears2013b , Theorem 6.2).
Theorem 5.26 (convergence).
Suppose that Assumptions 5.19, 5.20 and 5.25 are satisfied. Suppose further that the HJB problem (5.16) satisfies a comparison principle (see Definition 2.49). Then
 $$\begin{eqnarray}\lim _{h,\unicode[STIX]{x1D70F}\rightarrow 0^{+}}\max _{k}\Vert u(\cdot ,k\unicode[STIX]{x1D70F})-u_{h}^{k}\Vert _{L^{\infty }(\unicode[STIX]{x1D6FA})}=0.\end{eqnarray}$$
5.3 Solution of the discrete problems
To finalize the discussion concerning the approximation of convex equations, we must, at least briefly, discuss how to solve the system of nonlinear equations that arises after discretization, whether by finite differences or finite elements. We will present one of the most popular methods – known as policy iterations or Howard’s algorithm – and discuss its convergence properties.
Once (5.1) is discretized by any of the methods described in the previous sections, we end up with the following system of nonlinear equations: find
 $\mathbf{x}\in \mathbb{R}^{N}$
that satisfies
 $$\begin{eqnarray}\mathbf{F}(\mathbf{x})=\sup _{\unicode[STIX]{x1D6FC}\in {\mathcal{A}}}[\mathbf{K}^{\unicode[STIX]{x1D6FC}}\mathbf{x}-\mathbf{f}^{\unicode[STIX]{x1D6FC}}]=\mathbf{0},\end{eqnarray}$$
where the supremum is taken component-wise,
 $N$
is the number of degrees of freedom in the discretization,
 $\{\mathbf{K}^{\unicode[STIX]{x1D6FC}}\}_{\unicode[STIX]{x1D6FC}\in {\mathcal{A}}}$
and
 $\{\mathbf{f}^{\unicode[STIX]{x1D6FC}}\}_{\unicode[STIX]{x1D6FC}\in {\mathcal{A}}}$
are discretizations of
 $\{\tilde{{\mathcal{L}}}^{\unicode[STIX]{x1D6FC}}\}_{\unicode[STIX]{x1D6FC}\in {\mathcal{A}}}$
and
 $\{f^{\unicode[STIX]{x1D6FC}}\}_{\unicode[STIX]{x1D6FC}\in {\mathcal{A}}}$
, respectively, or as in (5.19), come from the implicit-explicit splitting of the operators (5.18).
An illustration of the selection procedure defined in (5.23), for the simplified case of
 $\mathbf{f}^{\unicode[STIX]{x1D6FC}}=\mathbf{0}$
for all
 $\unicode[STIX]{x1D6FC}\in {\mathcal{A}}$
and
 $\#{\mathcal{A}}=2$
. We multiply each matrix (solid red and dashed blue in the figure) by the vector
 $\mathbf{y}$
and compare the components of the results. The matrix
 $\mathbf{K}^{\unicode[STIX]{x1D736}(\mathbf{y})}$
is constructed by choosing the row of the matrix that gives the largest result.

In order to define Howard’s algorithm we must introduce the following operations on
 ${\mathcal{A}}$
, the matrices
 $\mathbf{K}^{\unicode[STIX]{x1D6FC}}$
and vectors
 $\mathbf{f}^{\unicode[STIX]{x1D6FC}}$
. Given
 $\mathbf{y}\in \mathbb{R}^{N}$
and
 $i\in \{1,\ldots ,N\}$
we define the element
 $\unicode[STIX]{x1D6FC}(\mathbf{y},i)\in {\mathcal{A}}$
as the element that realizes the supremum in (5.22) when applied to
 $\mathbf{y}$
at component
 $i$
, that is,
 $$\begin{eqnarray}[\mathbf{K}^{\unicode[STIX]{x1D6FC}(\mathbf{y},i)}\mathbf{y}-\mathbf{f}^{\unicode[STIX]{x1D6FC}(\mathbf{y},i)}]_{i}=\sup _{\unicode[STIX]{x1D6FC}\in {\mathcal{A}}}[\mathbf{K}^{\unicode[STIX]{x1D6FC}}\mathbf{y}-\mathbf{f}^{\unicode[STIX]{x1D6FC}}]_{i}.\end{eqnarray}$$
We define
 $\unicode[STIX]{x1D736}(\mathbf{y})\in {\mathcal{A}}^{N}$
with components
 $\unicode[STIX]{x1D736}(\mathbf{y})_{i}=\unicode[STIX]{x1D736}(\mathbf{y},i)$
. Given
 $\unicode[STIX]{x1D736}(\mathbf{y})$
we finally define the matrix
 $\mathbf{K}^{\unicode[STIX]{x1D736}(\mathbf{y})}$
and vector
 $\mathbf{f}^{\unicode[STIX]{x1D736}(\mathbf{y})}$
as follows:
 $$\begin{eqnarray}\mathbf{K}_{i,j}^{\unicode[STIX]{x1D736}(\mathbf{y})}=\mathbf{K}_{i,j}^{\unicode[STIX]{x1D736}(\mathbf{y},i)},\quad \mathbf{f}_{i}^{\unicode[STIX]{x1D736}(\mathbf{y})}=\mathbf{f}_{i}^{\unicode[STIX]{x1D736}(\mathbf{y},i)}.\end{eqnarray}$$
An illustration of this selection procedure for
 $\#{\mathcal{A}}=2$
is shown in Figure 5.1. With these operations at hand, Howard’s algorithm, as presented in Bokanowski, Maroso and Zidani (Reference Bokanowski, Maroso and Zidani2009), is described in Algorithm 5.1.

Note that at each step Algorithm 5.1 requires the solution to the linear system (5.24). Because of the way the matrices are constructed, it is necessary to ensure that they are invertible. This is guaranteed by the following condition.
Assumption 5.27 (monotonicity).
For every
 $\mathbf{y}\in \mathbb{R}^{N}$
the matrix
 $\mathbf{K}^{\unicode[STIX]{x1D736}(\mathbf{y})}$
is monotone in the sense of Definition 3.5.
It is natural to wonder when such a condition is satisfied. As shown by Witte and Reisinger (Reference Witte and Reisinger2012), if, for every
 $\unicode[STIX]{x1D6FC}\in {\mathcal{A}}$
, the matrix
 $\mathbf{K}^{\unicode[STIX]{x1D6FC}}$
is strictly diagonally dominant and monotone and its off-diagonal entries are non-positive, then this condition is satisfied. We comment finally that a monotone matrix is non-singular.
Having guaranteed that Howard’s algorithm can proceed, we focus our attention on its convergence. While many references have studied it, we will follow Bokanowski et al. (Reference Bokanowski, Maroso and Zidani2009) and Hintermüller, Ito and Kunisch (Reference Hintermüller, Ito and Kunisch2002), and draw a connection between this method and active set strategies which, in turn, can be analysed as semismooth Newton methods. We begin with the definition of slant derivative.
Definition 5.28 (slant derivative).
Let
 $X$
and
 $Z$
be Banach spaces and let
 $D\subset X$
be open. The mapping
 $F:D\rightarrow Z$
is called slantly differentiable in the open subset
 $U\subset D$
if there is a family of mappings
 $G:U\rightarrow \mathfrak{L}(X,Z)$
such that, for every
 $x\in U$
,
 $$\begin{eqnarray}\lim _{h\rightarrow 0}\displaystyle \frac{1}{\Vert h\Vert _{X}}\Vert F(x+h)-F(x)-G(x+h)h\Vert _{Z}=0.\end{eqnarray}$$
We call
 $G$
a slanting function for
 $F$
.
To approximate
 $x^{\star }\in X$
, the solution of
 $F(x)=0$
, one can then apply the semismooth Newton method which, starting from
 $x_{0}\in D$
, computes iterates via
 $$\begin{eqnarray}x_{k+1}=x_{k}-G(x_{k})^{-1}F(x_{k}).\end{eqnarray}$$
The convergence of (5.25) is given in the following result, whose proof can be found in Hintermüller et al. (Reference Hintermüller, Ito and Kunisch2002, Theorem 1.1).
Theorem 5.29 (convergence).
Assume that
 $F$
is slantly differentiable in a neighbourhood of
 $x^{\star }$
. If
 $G(x)$
is non-singular for all
 $x\in U$
and
 $\{\Vert G(x)^{-1}\Vert :x\in U\}$
is bounded, then the semismooth Newton method (5.25) converges superlinearly provided
 $x_{0}$
is sufficiently close to
 $x^{\star }$
.
The connection between Howard’s algorithm and semismooth Newton methods is given by the following result; see Hintermüller et al. (Reference Hintermüller, Ito and Kunisch2002, Lemma 3.1).
Lemma 5.30 (slant derivative of
$\max$
).

The mapping
 $$\begin{eqnarray}\mathbf{M}:\mathbb{R}^{N}\ni \mathbf{y}\mapsto \max \{\mathbf{0},\mathbf{y}\}\in \mathbb{R}^{N}\end{eqnarray}$$
is slantly differentiable on
 $\mathbb{R}^{N}$
and a slanting function is
 $$\begin{eqnarray}\mathbf{G}_{\mathbf{M}}(\mathbf{y})_{i,j}=g(\mathbf{y}_{j})\unicode[STIX]{x1D6FF}_{i,j},\quad g(z)=\left\{\begin{array}{@{}ll@{}}0\quad & z\leq 0,\\ 1\quad & z>0.\end{array}\right.\end{eqnarray}$$
Let us explain how this result relates to Howard’s algorithm in the (perhaps overly) simplistic case that
 $N=1$
,
 ${\mathcal{A}}=\{1,2\}$
and
 $\mathbf{f}^{1}=\mathbf{f}^{2}=\mathbf{f}$
. In this setting, we are looking for
 $\mathbf{x}\in \mathbb{R}$
that solves
 $$\begin{eqnarray}\mathbf{0}=\mathbf{F}(\mathbf{x})=\max \{\mathbf{K}^{1}\mathbf{x},\mathbf{K}^{2}\mathbf{x}\}-\mathbf{f}=\mathbf{K}^{1}\mathbf{x}+\max \{\mathbf{0},(\mathbf{K}^{2}-\mathbf{K}^{1})\mathbf{x}\}-\mathbf{f}.\end{eqnarray}$$
By Lemma 5.30 a slanting function for
 $\mathbf{F}$
at
 $\mathbf{y}$
is
 $$\begin{eqnarray}\mathbf{G}(\mathbf{y})=\mathbf{K}^{1}+\mathbf{G}_{\boldsymbol{ M}}((\mathbf{K}^{2}-\mathbf{K}^{1})\mathbf{y})(\mathbf{K}^{2}-\mathbf{K}^{1}).\end{eqnarray}$$
If
 $(\mathbf{K}^{2}-\mathbf{K}^{1})\mathbf{y}\geq 0$
, then
 $$\begin{eqnarray}\mathbf{G}(\mathbf{y})=\mathbf{K}^{1}+(\mathbf{K}^{2}-\mathbf{K}^{1})=\mathbf{K}^{2},\end{eqnarray}$$
and, similarly, if
 $(\mathbf{K}^{2}-\mathbf{K}^{1})\mathbf{y}\leq 0$
we get
 $\mathbf{G}(\mathbf{y})=\mathbf{K}^{1}$
. In other words,
 $\mathbf{G}(\mathbf{y})$
always coincides with the coefficient that gives the largest result. Having made this observation, we can now establish convergence for Howard’s algorithm Bokanowski et al. (Reference Bokanowski, Maroso and Zidani2009).
Theorem 5.31 (convergence).
If Assumption 5.27 is satisfied, then the sequence
 $\{\mathbf{x}_{k}\}_{k\geq 0}$
, generated by Algorithm Custref5.1alg:Howard, satisfies
 $\mathbf{x}_{k}\geq \mathbf{x}_{k+1}$
for every
 $k\geq 0$
and converges to
 $\mathbf{x}$
, the solution of (5.22). Moreover,
-
(1) If
$\#{\mathcal{A}}$
is finite, the sequence converges in at most
$(\#{\mathcal{A}})^{N}$
steps. -
(2) If
${\mathcal{A}}$
is infinite, the convergence is asymptotically superlinear.


Proof. To draw a connection between Algorithm 5.1 and the semismooth Newton method (5.25), let us sketch the proof. Recall that we are looking for a solution of (5.22), which can be understood as looking for a zero of the map
 $\mathbf{F}$
. Now, following Bokanowski et al. (Reference Bokanowski, Maroso and Zidani2009, Theorem 3.8), let us show that for
 $\mathbf{y}\in \mathbb{R}^{N}$
the matrix
 $\mathbf{K}^{\unicode[STIX]{x1D736}(\mathbf{y})}$
is a slanting function for
 $\mathbf{F}$
at the point
 $\mathbf{y}$
. For if that is the case, then (5.25) can be rewritten as
 $$\begin{eqnarray}\mathbf{K}^{\unicode[STIX]{x1D736}(\mathbf{x}_{k})}(\mathbf{x}_{k+1}-\mathbf{x}_{k})=-\mathbf{F}(\mathbf{x}_{k})=-\mathbf{K}^{\unicode[STIX]{x1D736}(\mathbf{x}_{k})}\mathbf{x}_{k}+\mathbf{f}^{\unicode[STIX]{x1D736}(\mathbf{x}_{k})},\end{eqnarray}$$
which is clearly (5.24). By invoking Theorem 5.29 this will yield the superlinear convergence of
 $\{\mathbf{x}_{k}\}_{k\geq 0}$
.
Now, to show the slant-differentiability of
 $\mathbf{F}$
, let
 $\mathbf{y},\mathbf{h}\in \mathbb{R}^{N}$
and note that
 $$\begin{eqnarray}\displaystyle \mathbf{F}(\mathbf{y})+\mathbf{K}^{\unicode[STIX]{x1D736}(\mathbf{y}+\mathbf{h})}\mathbf{h} & \geq & \displaystyle \mathbf{K}^{\unicode[STIX]{x1D736}(\mathbf{y}+\mathbf{h})}\mathbf{y}-\mathbf{f}^{\unicode[STIX]{x1D736}(\mathbf{y}+\mathbf{h})}+\mathbf{K}^{\unicode[STIX]{x1D736}(\mathbf{y}+\mathbf{h})}\mathbf{h}=\mathbf{F}(\mathbf{y}+\mathbf{h})\nonumber\\ \displaystyle & \geq & \displaystyle \mathbf{K}^{\unicode[STIX]{x1D736}(\mathbf{y})}(\mathbf{y}+\mathbf{h})-\mathbf{f}^{\unicode[STIX]{x1D736}(\mathbf{y})}=\mathbf{F}(\mathbf{y})+\mathbf{K}^{\unicode[STIX]{x1D736}(\mathbf{y})}\mathbf{h}.\nonumber\end{eqnarray}$$
Consequently,
 $$\begin{eqnarray}\displaystyle \mathbf{0} & \geq & \displaystyle \mathbf{F}(\mathbf{y}+\mathbf{h})-\mathbf{F}(\mathbf{y})-\mathbf{K}^{\unicode[STIX]{x1D736}(\mathbf{y}+\mathbf{h})}\mathbf{h}\geq [\mathbf{K}^{\unicode[STIX]{x1D736}(\mathbf{y})}-\mathbf{K}^{\unicode[STIX]{x1D736}(\mathbf{y}+\mathbf{h})}]\mathbf{h}\nonumber\\ \displaystyle & \geq & \displaystyle -|\mathbf{K}^{\unicode[STIX]{x1D736}(\mathbf{y})}-\mathbf{K}^{\unicode[STIX]{x1D736}(\mathbf{y}+\mathbf{h})}|_{\infty }|\mathbf{h}|_{\infty }.\nonumber\end{eqnarray}$$
Since Lemma 3.2 of Bokanowski et al. (Reference Bokanowski, Maroso and Zidani2009) shows that
 $\lim _{|\mathbf{h}|_{\infty }\rightarrow 0}|\mathbf{K}^{\unicode[STIX]{x1D736}(\mathbf{y})}-\mathbf{K}^{\unicode[STIX]{x1D736}(\mathbf{y}+\mathbf{h})}|_{\infty }=0$
, the result follows.
When
 $\#{\mathcal{A}}$
is finite we remark that convergence in a finite number of steps follows from the monotonicity of the iterates. To show the monotonicity, we exploit the construction of the parameters
 $\unicode[STIX]{x1D736}_{k}$
. Indeed, since
 $$\begin{eqnarray}\mathbf{K}^{\unicode[STIX]{x1D736}_{k+1}}\mathbf{x}_{k}-\mathbf{f}^{\unicode[STIX]{x1D736}_{k+1}}=\mathbf{F}(\mathbf{x}_{k})\geq \mathbf{K}^{\unicode[STIX]{x1D736}_{k}}\mathbf{x}_{k}-\mathbf{f}^{\unicode[STIX]{x1D736}_{k}}=\mathbf{0}=\mathbf{K}^{\unicode[STIX]{x1D736}_{k+1}}\mathbf{x}_{k+1}-\mathbf{f}^{\unicode[STIX]{x1D736}_{k+1}},\end{eqnarray}$$
we conclude that
 $\mathbf{K}^{\unicode[STIX]{x1D736}_{k+1}}(\mathbf{x}_{k}-\mathbf{x}_{k+1})\geq 0$
. From Assumption 5.27 we have that
 $\mathbf{K}^{\unicode[STIX]{x1D736}_{k+1}}$
is monotone and therefore
 $\mathbf{x}_{k}\geq \mathbf{x}_{k+1}$
. This concludes the proof.
We conclude by commenting that in Algorithm 5.1 it is necessary to solve the linear system of equations (5.24) sat every step, which, for large
 $N$
, can be very time-consuming. We refer to Hoppe (Reference Hoppe1986), who describes a multilevel technique to solve this problem and shows its global convergence. Variations of this multigrid strategy have been explored by Alla, Falcone and Kalise (Reference Alla, Falcone and Kalise2015) and Han and Wan (Reference Han and Wan2013). Numerical methods of penalty type have been studied by Witte and Reisinger (Reference Witte and Reisinger2012) and Lions and Mercier (Reference Lions and Mercier1980, Algorithme III).
6 The Monge–Ampère equation
The focus of this section is the study of discretizations for a particular convex equation, the Monge–Ampère equation with Dirichlet boundary conditions:
 $$\begin{eqnarray}\left\{\begin{array}{@{}ll@{}}\det (D^{2}u)=f\quad & \text{in }\unicode[STIX]{x1D6FA},\\ u=g\quad & \text{on }\unicode[STIX]{x2202}\unicode[STIX]{x1D6FA}.\end{array}\right.\end{eqnarray}$$
The Monge–Ampère equation finds relevance in several areas of mathematics and its applications, including differential geometry, calculus of variations, economics, meteorology and the optimal mass transportation problem (Gutiérrez Reference Gutiérrez2001, Trudinger and Wang Reference Trudinger and Wang2005, Villani Reference Villani2003, Benamou and Brenier Reference Benamou and Brenier1998, Reference Benamou and Brenier2000, Stojanovic Reference Stojanovic2005). As we have already mentioned (see also Remark 6.12 below), the Monge–Ampère problem fits into the framework of the previous section. However, due to its many applications, and correspondingly its many discretizations and convergence results, we find it appropriate to devote an entire section to a sample of detailed results. Before discussing these methods, let us give a brief synopsis of some discretizations for the Monge–Ampère problem that we do not cover in detail.
-
∙ Monotone, wide-stencil finite difference schemes (see Oberman Reference Oberman2008, Froese and Oberman Reference Froese and Oberman2011, Froese Reference Froese2016 and Benamou et al. Reference Benamou, Froese and Oberman2014). The basis of these methods is to use determinant identities (such as Hadamard’s inequality) to construct consistent and monotone finite difference schemes for the Monge–Ampère problem. Such schemes conform to the Barles–Souganidis theory under certain assumptions and convergence to the viscosity solution is immediate. We refer the reader to Nochetto and Zhang (Reference Nochetto and Zhang2017b ), who have recently derived rates of convergence for these methods.
-
∙ Regularization. Feng and Neilan (Reference Feng and Neilan2009, Reference Feng and Neilan2011) and Neilan (Reference Neilan2010) first approximate the Monge–Ampère equation at the continuous level by a fourth-order quasi-linear PDE. In this framework, solutions are defined via variational principles, and therefore Galerkin methods are readily constructed. Error estimates between the finite element approximation and the regularized solution are derived, but a general convergence theory for viscosity solutions is an open problem.
-
∙ Variational methods. Classical Galerkin methodologies are used by Böhmer (Reference Böhmer2008), Brenner et al. (Reference Brenner, Gudi, Neilan and Sung2011), Brenner and Neilan (Reference Brenner and Neilan2012), Neilan (Reference Neilan2013) and Awanou (Reference Awanou2015a , Reference Awanou2015b , Reference Awanou2015c ), for example, to construct finite element approximations for strong or classical solutions of the Monge–Ampère equation. Assuming that the solution to (6.1) is sufficiently regular, error estimates are typically derived in
$H^{1}$
- or
$H^{2}$
-type norms. -
∙ Optimal control. Dean and Glowinski (Reference Dean and Glowinski2006a , Reference Dean and Glowinski2006b ) treat the Monge–Ampère equation as a constraint of a minimization problem, leading to a saddle-point reformulation. Computationally efficient algorithms are proposed, but convergence to the viscosity solution is not shown.


We refer to the review paper by Feng, Glowinski and Neilan (Reference Feng, Glowinski and Neilan2013) for a summary of these discretization types.
6.1 Solution concepts
The Monge–Ampère equation has a very unique structure and, because of this, the solution to problem (6.1) can be understood not only with the concepts described in Section 2 but with some additional ones. To discuss these issues, we first make the (sometimes necessary) assumption that the domain
 $\unicode[STIX]{x1D6FA}$
is convex. With this assumption, and with an abuse of notation, we (re)define the convex envelope of a function
 $v$
with
 $v=0$
on
 $\unicode[STIX]{x2202}\unicode[STIX]{x1D6FA}$
as
 $$\begin{eqnarray}\unicode[STIX]{x1D6E4}(v)(x):=\sup \{L(x):L(z)\leq v(z)~\forall z\in \unicode[STIX]{x1D6FA},~L\in \mathbb{P}_{1}\}.\end{eqnarray}$$
As we previously described, in contrast to the problems discussed thus far, the Monge–Ampère operator
 $F(x,r,\mathbf{p},M):=\det (M)-f(x)$
is not elliptic on
 $\unicode[STIX]{x1D6FA}\times \mathbb{R}\times \mathbb{R}^{d}\times \mathbb{S}^{d}$
(see Definition 2.10 and Example 2.14). Indeed, we have
 $$\begin{eqnarray}\det (M)\leq \det (N),\quad \text{for all}~N\geq M\end{eqnarray}$$
if and only if
 $M\geq 0$
, and consequently
 $F$
is only elliptic when restricted to the class of semi-positive definite matrices. In particular, if a classical solution
 $u$
to (6.1) exists, then
 $F$
is elliptic at
 $u$
if and only if
 $D^{2}u\geq 0$
in
 $\unicode[STIX]{x1D6FA}$
, implying that
 $u$
is a convex function. Further note that, besides ensuring ellipticity, the convexity assumption is required to have any hope of uniqueness, since, when
 $d$
is even,
 $$\begin{eqnarray}\det (D^{2}(-u))=\det (D^{2}u).\end{eqnarray}$$
Let us now discuss the existence and uniqueness of different types of solutions of the Monge–Ampère problem (6.1) and the required conditions on the domain
 $\unicode[STIX]{x1D6FA}$
and data,
 $f$
and
 $g$
, to guarantee that such solutions exist. First we have the following result regarding classical solutions Wang (Reference Wang1996), Trudinger and Wang (Reference Trudinger and Wang2008).
Theorem 6.1 (classical solutions).
Suppose that
 $\unicode[STIX]{x1D6FA}$
is an open, bounded and strictly convex domain with boundary
 $\unicode[STIX]{x2202}\unicode[STIX]{x1D6FA}\in C^{3}$
. Suppose that
 $g\in C^{3}(\bar{\unicode[STIX]{x1D6FA}})$
,
 $f\in C^{\unicode[STIX]{x1D6FC}}(\unicode[STIX]{x1D6FA})$
for some
 $\unicode[STIX]{x1D6FC}\in (0,1)$
, and that
 $\min _{\bar{\unicode[STIX]{x1D6FA}}}f>0$
. Then there exists a unique (classical) convex solution
 $u\in C^{2,\unicode[STIX]{x1D6FC}}(\unicode[STIX]{x1D6FA})$
satisfying (6.1).
Remark 6.2 (optimality).
The conditions on
 $\unicode[STIX]{x2202}\unicode[STIX]{x1D6FA}$
,
 $g$
and
 $f$
stated in Theorem 6.1 are optimal Trudinger and Wang (Reference Trudinger and Wang2008).
Next we turn our attention to viscosity solutions to (6.1). Since the operator
 $F$
is only elliptic on the class of convex functions, we must modify the definition of viscosity solutions to reflect this fact.
Definition 6.3 (viscosity solution).
A function
 $u\in C(\bar{\unicode[STIX]{x1D6FA}})$
is called a viscosity subsolution (resp. supersolution) of (6.1) on the set of convex functions if
 $u$
is convex and if, for all convex
 $\unicode[STIX]{x1D711}\in C^{2}(\unicode[STIX]{x1D6FA})$
such that
 $u-\unicode[STIX]{x1D711}$
has a local maximum (resp. minimum) at
 $x_{0}\in \unicode[STIX]{x1D6FA}$
, we have
 $\det (D^{2}\unicode[STIX]{x1D711}(x_{0}))\geq f(x_{0})$
(resp.
 $\det (D^{2}\unicode[STIX]{x1D711}(x_{0}))\leq f(x_{0})$
). A function
 $u\in C(\bar{\unicode[STIX]{x1D6FA}})$
is a viscosity solution to (6.1) on the class of convex functions if it is simultaneously a viscosity subsolution and supersolution on the set of convex functions.
Remark 6.4 (
$f$
is non-negative).

Note that the definition of viscosity solution implicitly requires the source function
 $f$
to be continuous and non-negative.
Before stating existence and uniqueness results for viscosity solutions, let us give an example of a non-classical viscosity solution, following Froese and Oberman (Reference Froese and Oberman2011). Note that this example shows that
 $f\in C^{\unicode[STIX]{x1D6FC}}(\unicode[STIX]{x1D6FA})$
and smooth
 $\unicode[STIX]{x1D6FA}$
is not sufficient to guarantee the existence of a classical solution.
Example 6.5 (viscosity solution).
Let
 $\unicode[STIX]{x1D6FA}=B_{2}(0)\subset \mathbb{R}^{2}$
, and consider the function
 $$\begin{eqnarray}u(x)=\left\{\begin{array}{@{}ll@{}}0\quad & \text{in }|x|\leq 1,\\ \displaystyle \frac{1}{2}(|x|-1)^{2}\quad & \text{in }1\leq |x|\leq 2.\end{array}\right.\end{eqnarray}$$
Then
 $u$
is a viscosity solution of (6.1) with
 $g=1/2$
and
 $$\begin{eqnarray}f(x)=\left\{\begin{array}{@{}ll@{}}0\quad & \text{in }|x|\leq 1,\\ 1-|x|^{-1}\quad & \text{in }1\leq |x|\leq 2.\end{array}\right.\end{eqnarray}$$
Theorem 6.6 (existence).
Assume that
 $\unicode[STIX]{x1D6FA}$
is convex. Assume further that
 $g\in C(\unicode[STIX]{x2202}\unicode[STIX]{x1D6FA})$
,
 $f\in C(\bar{\unicode[STIX]{x1D6FA}})$
and
 $f\geq 0$
. Then there exists a unique viscosity solution
 $u\in C(\bar{\unicode[STIX]{x1D6FA}})$
to (6.1) in the class of convex functions.
Apart from the viscosity solution, another type of weak solution of the Monge–Ampère equation is based on geometric arguments, which we now describe. To motivate it, suppose for the moment that
 $f$
is uniformly positive in
 $\unicode[STIX]{x1D6FA}$
and that
 $u\in C^{2}(\bar{\unicode[STIX]{x1D6FA}})$
is a strictly convex function satisfying (6.1) pointwise. Let
 $\unicode[STIX]{x2202}u(x)$
denote the subdifferential of
 $u$
at the point
 $x\in \unicode[STIX]{x1D6FA}$
given by Definition 2.58, that is,
 $\unicode[STIX]{x2202}u(x)$
is the set of slopes of the supporting hyperplanes at
 $x$
. From the convexity and smoothness assumptions we infer that
 $\unicode[STIX]{x2202}u(x)=\{Du(x)\}$
and that the subdifferential, viewed as a map from
 $\unicode[STIX]{x1D6FA}$
to
 $\mathbb{R}^{d}$
, is injective. Consequently, a change of variables reveals that
 $$\begin{eqnarray}\int _{D}f=\int _{D}\det (D^{2}u)=\int _{\unicode[STIX]{x2202}u(D)}=|\unicode[STIX]{x2202}u(D)|\quad \text{for all Borel sets }D\subset \unicode[STIX]{x1D6FA},\end{eqnarray}$$
where we recall that
 $\unicode[STIX]{x2202}u(D)=\cup _{x\in D}\unicode[STIX]{x2202}u(x)$
and
 $|\unicode[STIX]{x2202}u(D)|$
is the
 $d$
-dimensional Lebesgue measure of
 $\unicode[STIX]{x2202}u(D)$
. Since
 $\unicode[STIX]{x2202}u$
is well-defined for non-smooth convex functions, the above identity allows us to widen the class of admissible solutions.
Definition 6.7 (Alexandrov solution).
A convex function
 $u\in C(\bar{\unicode[STIX]{x1D6FA}})$
is an Alexandrov solution to (6.1) if
 $u|_{\unicode[STIX]{x2202}\unicode[STIX]{x1D6FA}}=g$
and
 $$\begin{eqnarray}|\unicode[STIX]{x2202}u(D)|=\int _{D}f\end{eqnarray}$$
for all Borel sets
 $D\subset \unicode[STIX]{x1D6FA}$
.
Note that the continuity of the source term
 $f$
is no longer required for (6.3) to be well-defined. The following example illustrates this feature.
Example 6.8 (Alexandrov solution).
Let
 $\unicode[STIX]{x1D6FA}=B_{1}(0)\subset \mathbb{R}^{2}$
. Then the function
 $$\begin{eqnarray}u(x)=|x|-1\end{eqnarray}$$
is an Alexandrov solution of the Monge–Ampère equation
 $$\begin{eqnarray}\det (D^{2}u)(x)=\unicode[STIX]{x1D70B}\unicode[STIX]{x1D6FF}_{(x=0)},\end{eqnarray}$$
where
 $\unicode[STIX]{x1D6FF}_{(x=0)}$
is the Dirac measure at origin. However,
 $u$
is not a viscosity solution because the right-hand side is not a (continuous) function.
The existence and uniqueness of Alexandrov solutions is summarized in the next theorem: see Gutiérrez (Reference Gutiérrez2001, Theorem 1.6.2).
Theorem 6.9 (existence of Alexandrov solutions).
Let
 $\unicode[STIX]{x1D6FA}\subset \mathbb{R}^{d}$
be an open, bounded and strictly convex domain. Suppose that the data satisfies
 $g\in C(\unicode[STIX]{x2202}\unicode[STIX]{x1D6FA})$
and
 $\int _{\unicode[STIX]{x1D6FA}}f<\infty$
. Then there exists a unique Alexandrov solution
 $u\in C(\bar{\unicode[STIX]{x1D6FA}})$
to (6.1) in the class of convex functions.
The next result states situations where viscosity solutions and Alexandrov solutions coincide (Gutiérrez Reference Gutiérrez2001, Propositions 1.3.4 and 1.7.1). The result also shows that the notion of Alexandrov solution is strictly weaker than that of a viscosity solution.
Proposition 6.10 (equivalence).
Suppose that
 $u\in C(\bar{\unicode[STIX]{x1D6FA}})$
is an Alexandrov solution to (6.1). Then if
 $f$
is continuous,
 $u$
is a viscosity solution to (6.1). Conversely, if
 $u$
is a viscosity solution to (6.1) and if
 $f\in C(\bar{\unicode[STIX]{x1D6FA}})$
with
 $f>0$
in
 $\bar{\unicode[STIX]{x1D6FA}}$
, then
 $u$
is an Alexandrov solution.
The rest of our presentation will deal separately with numerical methods for (6.1) depending on the type of solution we aim to approximate: viscosity or Alexandrov solutions. Before we discuss them, it is useful to review a property of the determinant. For convenience of notation we define the set of symmetric non-negative definite matrices as
 $$\begin{eqnarray}\mathbb{S}_{+}^{d}:=\{A\in \mathbb{S}^{d}:A\geq 0\}.\end{eqnarray}$$
Proposition 6.11 (determinant inequality).
The following inequality holds:
 $$\begin{eqnarray}\det (A)^{1/d}\det (B)^{1/d}\leq \displaystyle \frac{1}{d}\operatorname{tr}AB=\displaystyle \frac{1}{d}(A:B),\quad \text{for all}~A,B\in \mathbb{S}_{+}^{d}\end{eqnarray}$$
with equality holding if and only if
 $B^{1/2}AB^{1/2}=cI$
for some scalar
 $c\geq 0$
.
Proof. Let
 $C=B^{1/2}AB^{1/2}$
, and note that
 $C\in \mathbb{S}_{+}^{d}$
. The arithmetic–geometric inequality yields
 $$\begin{eqnarray}\det (C)^{1/d}\leq \displaystyle \frac{1}{d}\operatorname{tr}C,\end{eqnarray}$$
with equality holding if and only if
 $B^{1/2}AB^{1/2}=C=cI$
. Since
 $A,B\in \mathbb{S}_{+}^{d}$
, we find that
 $c\geq 0$
. The inequality follows from the algebraic identities
 $\det C=\det (AB)=\det A\det B$
and
 $\operatorname{tr}C=\operatorname{tr}AB=A:B$
.
Remark 6.12 (Monge–Ampère is concave).
The determinant inequality of Proposition 6.11 implies that for any positive definite matrix
 $A$
,
 $$\begin{eqnarray}\det (A)^{1/d}=\inf _{B\in \mathbb{S}_{+}^{d}}\biggl\{\displaystyle \frac{1}{d}\operatorname{tr}AB:\det B=1\biggr\}.\end{eqnarray}$$
Therefore, for any symmetric positive definite
 $A$
and
 $B\in \mathbb{S}_{+}^{d}$
, and for
 $0<t\leq 1$
, we have
 $$\begin{eqnarray}\displaystyle \det (tA+(1-t)B)^{1/d} & = & \displaystyle \inf _{K\in \mathbb{S}_{+}^{d}}\biggl\{\displaystyle \frac{1}{d}\operatorname{tr}((tA+(1-t)B)K):\det K=1\biggr\}\nonumber\\ \displaystyle & \geq & \displaystyle t\inf _{K\in \mathbb{S}_{+}^{d}}\biggl\{\displaystyle \frac{1}{d}\operatorname{tr}(AK):\det K=1\biggr\}\nonumber\\ \displaystyle & & \displaystyle \qquad +\,(1-t)\inf _{K\in \mathbb{S}_{+}^{d}}\biggl\{\displaystyle \frac{1}{d}\operatorname{tr}(BK):\det K=1\biggr\}\nonumber\\ \displaystyle & = & \displaystyle t\det (A)^{1/d}+(1-t)\det (B)^{1/d}.\nonumber\end{eqnarray}$$
The inequality
 $$\begin{eqnarray}\det (tA+(1-t)B)^{1/d}\geq t\det (A)^{1/d}+(1-t)\det (B)^{1/d}\end{eqnarray}$$
is also satisfied if
 $t=0$
, and if
 $\det (A)=\det (B)=0$
. Thus the function
 $A\rightarrow \det A^{1/d}$
is concave over
 $\mathbb{S}_{+}^{d}$
.
6.2 Approximation of viscosity solutions: Hamilton–Jacobi–Bellman reformulation
In this section we summarize the results of Feng and Jensen (Reference Feng and Jensen2017), where a numerical method based on an HJB reformation of the Monge–Ampère problem is developed. Before stating the method we first note that Remark 6.12 implicitly gives such an HJB reformation, that is, if
 $u$
satisfies the first equation in (6.1), then formally
 $$\begin{eqnarray}f(x)^{1/d}=(\det (D^{2}u)(x))^{1/d}=\displaystyle \frac{1}{d}\inf _{\substack{ B\in \mathbb{S}_{+}^{d} \\ \det (B)=1}}D^{2}u(x):B.\end{eqnarray}$$
Note that the constraint in the control set is nonlinear, and furthermore, the control set is not compact. These two features make the PDE and numerical constructions less obvious. Instead, the method proposed in Feng and Jensen (Reference Feng and Jensen2017) is based on the following result Krylov (Reference Krylov1987).
Proposition 6.13 (HJB reformulation of MA).
Define
 $$\begin{eqnarray}\mathbb{S}_{1}^{d}=\{A\in \mathbb{S}_{+}^{d}:\text{tr}\,A=1\},\end{eqnarray}$$
and let
 $f\in \mathbb{R}$
with
 $f\geq 0$
. Then a matrix
 $A\in \mathbb{S}^{d}$
satisfies
 $$\begin{eqnarray}H(A,f):=\sup _{B\in \mathbb{S}_{1}^{d}}\biggl(-\displaystyle \frac{1}{d}B:A+f^{1/d}\det (B)^{1/d}\biggr)=0\end{eqnarray}$$
if and only if
 $\det (A)=f$
and
 $A\in \mathbb{S}_{+}^{d}$
. Moreover, there exists a maximizer
 $B_{\ast }\in \mathbb{S}_{1}^{d}$
that commutes with
 $A$
.
Proof. If
 $A\in \mathbb{S}_{+}^{d}$
and
 $\det (A)=f$
, then Proposition 6.11 implies
 $$\begin{eqnarray}-\displaystyle \frac{1}{d}B:A+f^{1/d}\det (B)^{1/d}\leq (f^{1/d}-\det (A)^{1/d})\det (B)^{1/d}=0\end{eqnarray}$$
and equality holds if and only if
 $B^{1/2}AB^{1/2}=cI$
for some
 $c\geq 0$
. If
 $A>0$
then we take
 $B=A^{-1}/(\operatorname{tr}A^{-1})$
. Otherwise, if
 $\det (A)=0$
, we use the eigendecomposition of a matrix to construct
 $B\in \mathbb{S}_{+}^{d}$
that commutes with
 $A$
,
 $\operatorname{tr}B=1$
, and
 $B^{1/2}AB^{1/2}=0$
. In either case we conclude that
 $A$
satisfies (6.4).
Now our goal is to show that (6.4) implies that
 $\det (A)=f$
and
 $A\in \mathbb{S}_{+}^{d}$
. We prove the statement in two cases.
Case I. If
 $A>0$
, then take
 $B=cA^{-1}$
with
 $c=1/(\operatorname{tr}A^{-1})$
in (6.4). Using the identities
 $$\begin{eqnarray}\displaystyle \frac{1}{d}B:A=c\quad \text{and}\quad \det (B)=c^{d}\det (A)^{-1},\end{eqnarray}$$
we find that
 $$\begin{eqnarray}c(f^{1/d}-\det (A)^{1/d})\det (A)^{-1/d}=\displaystyle \frac{-1}{d}B:A+f^{1/d}\det (B)^{1/d}\leq 0\end{eqnarray}$$
and therefore
 $\det (A)\geq f$
. On the other hand Proposition 6.11 implies that
 $$\begin{eqnarray}0=\sup _{B\in \mathbb{S}_{1}^{d}}\biggl(-\displaystyle \frac{1}{d}B:A+f^{1/d}\det (B)^{1/d}\biggr)\leq \sup _{B\in \mathbb{S}_{1}^{d}}(f^{1/d}-\det (A)^{1/d})\det (B)^{1/d}.\end{eqnarray}$$
Now if
 $\det (A)>f$
, then we must have
 $\det (B)=0$
for the matrix
 $B$
to attain the supremum. However, since
 $A>0$
, Proposition 6.11 implies that the inequality above is strict if
 $B\neq cA^{-1}$
. This leads to a contradiction. Therefore
 $\det (A)=f$
. This proves the first case.
Case II. If
 $A$
is not strictly positive definite, then without loss of generality, we assume that
 $A$
is of the diagonal form
 $$\begin{eqnarray}A=\unicode[STIX]{x1D706}_{1}\mathbf{v}_{1}\otimes \mathbf{v}_{1}+\cdots +\unicode[STIX]{x1D706}_{d}\mathbf{v}_{d}\otimes \mathbf{v}_{d}\quad \unicode[STIX]{x1D706}_{1}\leq \cdots \leq \unicode[STIX]{x1D706}_{d},\end{eqnarray}$$
where
 $\{\mathbf{v}_{i}\}_{i=1}^{d}$
are the eigenvectors of
 $A$
with unit length, and
 $\unicode[STIX]{x1D706}_{1}\leq 0$
.
Consider the matrix
 $$\begin{eqnarray}B=(1-\unicode[STIX]{x1D716})\mathbf{v}_{1}\otimes \mathbf{v}_{1}+\displaystyle \frac{\unicode[STIX]{x1D716}}{d-1}\mathop{\sum }_{i=2}^{d}\mathbf{v}_{i}\otimes \mathbf{v}_{i}\in \mathbb{S}_{1}^{d},\end{eqnarray}$$
for some parameter
 $\unicode[STIX]{x1D716}\in (0,1)$
. We then have
 $$\begin{eqnarray}\displaystyle -\displaystyle \frac{1}{d}B:A+f^{1/d}\det (B)^{1/d} & = & \displaystyle -\displaystyle \frac{1}{d}\biggl((1-\unicode[STIX]{x1D716})\unicode[STIX]{x1D706}_{1}+\displaystyle \frac{\unicode[STIX]{x1D716}}{d-1}\mathop{\sum }_{i=2}^{d}\unicode[STIX]{x1D706}_{i}\biggr)\nonumber\\ \displaystyle & & \displaystyle \qquad +\,(1-\unicode[STIX]{x1D716})^{1/d}\displaystyle \frac{\unicode[STIX]{x1D716}^{(d-1)/d}}{(d-1)^{(d-1)/d}}f^{1/d}\nonumber\\ \displaystyle & \geq & \displaystyle \displaystyle \frac{-1}{d}((1-\unicode[STIX]{x1D716})\unicode[STIX]{x1D706}_{1}+\unicode[STIX]{x1D716}\unicode[STIX]{x1D706}_{d})+\biggl[\displaystyle \frac{(1-\unicode[STIX]{x1D716})\unicode[STIX]{x1D716}^{(d-1)}}{(d-1)^{(d-1)}}f\biggr]^{1/d}.\nonumber\end{eqnarray}$$
Note that if
 $f>0$
and for sufficiently small
 $\unicode[STIX]{x1D716}$
, the dominating term is
 $$\begin{eqnarray}\biggl[\displaystyle \frac{(1-\unicode[STIX]{x1D716})\unicode[STIX]{x1D716}^{(d-1)}}{(d-1)^{(d-1)}}f\biggr]^{1/d}.\end{eqnarray}$$
Thus, if
 $f>0$
, then we deduce
 $$\begin{eqnarray}-\displaystyle \frac{1}{d}B:A+f^{1/d}\det (B)^{1/d}>0,\end{eqnarray}$$
which contradicts (6.4). If
 $f=0$
, then
 $$\begin{eqnarray}-\displaystyle \frac{1}{d}B:A+f^{1/d}\det (B)^{1/d}=-\displaystyle \frac{1}{d}\biggl((1-\unicode[STIX]{x1D716})\unicode[STIX]{x1D706}_{1}+\displaystyle \frac{\unicode[STIX]{x1D716}}{d-1}\mathop{\sum }_{i=2}^{d}\unicode[STIX]{x1D706}_{i}\biggr).\end{eqnarray}$$
Equation (6.4) holds for any
 $\unicode[STIX]{x1D716}>0$
if and only if
 $\unicode[STIX]{x1D706}_{1}=0$
. Thus,
 $A\geq 0$
and
 $\det (A)=f=0$
. This completes the proof.
Lemma 6.13 leads to the following result, showing that viscosity solutions to the Monge–Ampère equation are viscosity solutions of an HJB problem. We refer the reader to Feng and Jensen (Reference Feng and Jensen2017, Theorem 3.3) for a proof.
Theorem 6.14 (equivalence of viscosity solutions).
Let
 $f\in C(\unicode[STIX]{x1D6FA})$
be a non-negative function, and let
 $u$
be a viscosity subsolution (resp. supersolution) of the Monge–Ampère problem (6.1) on the set of convex functions. Then
 $u$
is a viscosity subsolution (resp. supersolution) to the HJB problem
 $$\begin{eqnarray}\left\{\begin{array}{@{}ll@{}}H(D^{2}u,f)=0\quad & \text{in }\unicode[STIX]{x1D6FA},\\ u=g\quad & \text{on }\unicode[STIX]{x2202}\unicode[STIX]{x1D6FA}.\end{array}\right.\end{eqnarray}$$
Remark 6.15 (convexity of solution).
We emphasize that the convexity of the solution to (6.5) is not assumed a priori; it occurs implicitly from the structure of the HJB problem.
Remark 6.16 (
$\mathbb{S}_{1}^{d}$
is not Cordes).

It is worth mentioning that matrices in
 $\mathbb{S}_{1}^{d}$
do not necessarily satisfy the Cordes condition if
 $d\geq 3$
(see Definition 2.32). To see this, consider
 $B\in \mathbb{S}_{1}^{3}$
with eigenvalues
 $\unicode[STIX]{x1D706}_{1}=1-\unicode[STIX]{x1D70F}$
,
 $\unicode[STIX]{x1D706}_{2}=\unicode[STIX]{x1D706}_{3}=\unicode[STIX]{x1D70F}/2$
for some
 $\unicode[STIX]{x1D70F}\in (0,1/3]$
. We then find
 $$\begin{eqnarray}\displaystyle \frac{|B|^{2}}{(\text{tr}\,B)^{2}}=\unicode[STIX]{x1D706}_{1}^{2}+\unicode[STIX]{x1D706}_{2}^{2}+\unicode[STIX]{x1D706}_{3}^{2}=\displaystyle \frac{3}{2}\unicode[STIX]{x1D70F}^{2}-2\unicode[STIX]{x1D70F}+1\geq \displaystyle \frac{1}{2},\end{eqnarray}$$
and thus
 $B$
does not satisfy the Cordes condition.
6.2.1 Discretization of the HJB-reformulation
To describe a discretization method for problem (6.5), we first note that if
 $B\in \mathbb{S}_{1}^{d}$
, then
 $B=YDY^{\intercal }$
, where
 $D\in \mathbb{S}_{1}^{d}$
is a diagonal matrix and
 $Y=[\mathbf{y}_{1},\cdots \,,\mathbf{y}_{d}]\in \mathbb{SO}^{d}$
, where
 $\mathbb{SO}^{d}$
is the special orthogonal group. Thus, letting
 $\mathbb{D}_{1}^{d}$
denote the space of diagonal non-negative definite matrices with unit trace, we find that
 $$\begin{eqnarray}H(A,f)=\sup _{\substack{ Y\in \mathbb{SO}^{d} \\ D\in \mathbb{D}_{1}^{d}}}\biggl(-\displaystyle \frac{1}{d}YDY^{\intercal }:A+f^{1/d}\det (D)^{1/d}\biggr).\end{eqnarray}$$
Let
 $\mathbf{y}_{i}\in \mathbb{R}^{d}$
denote the
 $i$
th column of
 $Y\in \mathbb{SO}^{d}$
and let
 $\unicode[STIX]{x1D706}_{i}=D_{i,i}$
. Then the solution to the Monge–Ampèreequation satisfies
 $$\begin{eqnarray}\sup _{\substack{ Y\in \mathbb{SO}^{d} \\ D\in \mathbb{D}_{1}^{d}}}\biggl(-\displaystyle \frac{1}{d}\mathop{\sum }_{i=1}^{d}\unicode[STIX]{x1D706}_{i}\mathbf{y}_{i}\otimes \mathbf{y}_{i}:D^{2}u(x)+f(x)^{1/d}\biggl(\mathop{\prod }_{i=1}^{d}\unicode[STIX]{x1D706}_{i}\biggr)^{1/d}\biggr)=0\end{eqnarray}$$
in the viscosity sense.
Let
 ${\mathcal{T}}_{h}$
be a quasi-uniform and shape-regular mesh of
 $\unicode[STIX]{x1D6FA}$
and let
 $X_{h}^{l}$
be the continuous piecewise linear polynomials over
 ${\mathcal{T}}_{h}$
defined by (3.34). We let
 $\unicode[STIX]{x1D6FA}_{h}^{I}$
denote the set of interior vertices of
 ${\mathcal{T}}_{h}$
, and let
 $\unicode[STIX]{x1D6FA}_{h}^{B}$
be the set of boundary vertices. Let
 $v_{h}\in X_{h}^{l}$
. Recall that, for a discretization parameter
 $k>0$
and vector
 $y$
, the second-order difference operator is defined by
 $$\begin{eqnarray}\unicode[STIX]{x1D6FF}_{y,k}^{2}v_{h}(z)=\displaystyle \frac{1}{k^{2}}(v_{h}(z+ky)-2v_{h}(z)+v_{h}(z-ky))\end{eqnarray}$$
provided that
 $z$
is sufficiently far from the boundary, namely,
 $z\pm ky\in \bar{\unicode[STIX]{x1D6FA}}$
. Otherwise we set
 $$\begin{eqnarray}\unicode[STIX]{x1D6FF}_{y,k}^{2}v_{h}(z)=\displaystyle \frac{2}{k^{+}+k^{-}}\biggl(\displaystyle \frac{v_{h}(z+k^{+}y)-v_{h}(z)}{k^{+}}+\displaystyle \frac{v_{h}(z-k^{-}y)-v_{h}(z)}{k^{-}}\biggr),\end{eqnarray}$$
where
 $k^{\pm }$
is the only element in
 $(0,k]$
such that
 $z\pm k^{\pm }y\in \unicode[STIX]{x2202}\unicode[STIX]{x1D6FA}$
.
With these definitions at hand we introduce, on
 $X_{h}^{l}$
, the following approximation of the HJB reformulation:
 $$\begin{eqnarray}H_{h}^{k}[u_{h},f](z)=\sup _{\substack{ Y\in \mathbb{SO}^{d} \\ D\in \mathbb{D}_{1}^{d}}}\biggl(\displaystyle \frac{-1}{d}\mathop{\sum }_{i=1}^{d}\unicode[STIX]{x1D706}_{i}\unicode[STIX]{x1D6FF}_{y,k}^{2}u_{h}(z)+f(z)^{1/d}\det (D)^{1/d}\biggr),\end{eqnarray}$$
where
 $z\in \unicode[STIX]{x1D6FA}_{h}^{I}$
.
The numerical method based on the HJB reformulation seeks a piecewise linear function
 $u_{h}\in X_{h}^{l}$
such that
 $$\begin{eqnarray}\left\{\begin{array}{@{}ll@{}}H_{h}^{k}[u_{h},f]=0\quad & \text{in }\unicode[STIX]{x1D6FA}_{h}^{I},\\ u_{h}=g\quad & \text{on }\unicode[STIX]{x1D6FA}_{h}^{B}.\end{array}\right.\end{eqnarray}$$
Note that the boundary conditions uniquely determine
 $u_{h}$
on
 $\unicode[STIX]{x2202}\unicode[STIX]{x1D6FA}$
, and therefore the problem is well-defined. The scheme (6.6) is a semi-Lagrangian method because the points
 $z\pm ky$
, which are used to evaluate
 $\unicode[STIX]{x1D6FF}_{y,h}^{2}u_{h}(z)$
, may not belong to
 $\bar{\unicode[STIX]{x1D6FA}}_{h}$
. Thus, additional effort is needed to evaluate
 $u_{h}(z\pm ky)$
.
It is straightforward to check that
 $\unicode[STIX]{x1D6FF}_{y,k}^{2}u_{h}(z)$
is monotone for any direction
 $y$
, implying that operator
 $H_{h}^{k}[u_{h},f]$
is monotone. The monotonicity also leads to stability of the method Feng and Jensen (Reference Feng and Jensen2017, Lemmas 6.2 and 6.4).
Lemma 6.17 (stability).
Problem (6.6) is stable in the sense that there exists a unique solution
 $u_{h}\in X_{h}^{l}$
to (6.6) and an
 $h$
-independent constant
 $C>0$
such that
 $\Vert u_{h}\Vert _{L^{\infty }(\unicode[STIX]{x1D6FA})}\leq C$
. Moreover, if we set
 $$\begin{eqnarray}\bar{u}(x):=\limsup _{\substack{ y\rightarrow x \\ h\rightarrow 0^{+}}}u_{h}(y),\quad \text{}\underline{u}(x):=\liminf _{\substack{ y\rightarrow x \\ h\rightarrow 0^{+}}}u_{h}(y),\quad x\in \bar{\unicode[STIX]{x1D6FA}},\end{eqnarray}$$
then
 $\bar{u}(x)=\text{}\underline{u}(x)=g(x)$
for all
 $x\in \unicode[STIX]{x2202}\unicode[STIX]{x1D6FA}$
provided that
 $\unicode[STIX]{x1D6FA}$
is strictly convex.
To show the consistency of the method, we recall that
 $I_{h}^{fe}:C(\bar{\unicode[STIX]{x1D6FA}})\rightarrow X_{h}^{l}$
denotes the nodal interpolant. We then have the following result.
Lemma 6.18 (consistency).
Let
 $\unicode[STIX]{x1D719}\in C^{2,\unicode[STIX]{x1D6FC}}(\unicode[STIX]{x1D6FA})$
. Then there is a constant
 $C$
such that for every
 $z\in \unicode[STIX]{x1D6FA}_{h}^{I}$
we have
 $$\begin{eqnarray}|H(D^{2}\unicode[STIX]{x1D719}(z),f(z))-H_{h}^{k}[I_{h}^{fe}\unicode[STIX]{x1D719},f](z)|\leq C\biggl(k^{\unicode[STIX]{x1D6FC}}+\displaystyle \frac{h^{2}}{k_{\min }^{2}}\biggr),\end{eqnarray}$$
where
 $k_{\min }=\min \{k^{+},k^{-}\}$
. Consequently, the method is consistent if
 $k\rightarrow 0$
and
 $h/k_{\min }\rightarrow 0$
.
Proof. It suffices to show that
 $$\begin{eqnarray}|\unicode[STIX]{x1D6FF}_{y,k}^{2}I_{h}^{fe}\unicode[STIX]{x1D719}(z)-(y\otimes y):D^{2}\unicode[STIX]{x1D719}(z)|\leq C\biggl(k^{\unicode[STIX]{x1D6FC}}+\displaystyle \frac{h^{2}}{k_{\min }^{2}}\biggr).\end{eqnarray}$$
First, by Taylor’s theorem, we have
 $$\begin{eqnarray}|\unicode[STIX]{x1D6FF}_{y,k}^{2}\unicode[STIX]{x1D719}(z)-(y\otimes y):D^{2}\unicode[STIX]{x1D719}(z)|\leq Ck^{\unicode[STIX]{x1D6FC}}\Vert \unicode[STIX]{x1D719}\Vert _{C^{2,\unicode[STIX]{x1D6FC}}(\unicode[STIX]{x1D6FA})}.\end{eqnarray}$$
Recalling that
 $$\begin{eqnarray}\Vert \unicode[STIX]{x1D719}-I_{h}^{fe}\unicode[STIX]{x1D719}\Vert _{L^{\infty }(\unicode[STIX]{x1D6FA})}\leq Ch^{2}\Vert \unicode[STIX]{x1D719}\Vert _{W^{2,\infty }(\unicode[STIX]{x1D6FA})}\end{eqnarray}$$
Ciarlet (Reference Ciarlet2002), we have
 $$\begin{eqnarray}|\unicode[STIX]{x1D6FF}_{y,k}^{2}\unicode[STIX]{x1D719}(z)-\unicode[STIX]{x1D6FF}_{y,k}^{2}I_{h}^{fe}\unicode[STIX]{x1D719}(z)|\leq C\displaystyle \frac{h^{2}}{k_{\min }^{2}}\Vert \unicode[STIX]{x1D719}\Vert _{W^{2,\infty }(\unicode[STIX]{x1D6FA})}.\end{eqnarray}$$
The desired result now follows from (6.7)–(6.8) and the triangle inequality.
Remark 6.19 (discrete controls).
To implement the method (6.6), it remains to specify a discrete set
 $\mathbb{S}_{1,h}^{d}\subset \mathbb{S}_{1}^{d}$
of symmetric positive definite matrices with unit trace. To ensure consistency of the method, we require the discrete set
 $\mathbb{S}_{1,h}^{d}$
to be dense as
 $h\rightarrow 0$
, that is, for any
 $B\in \mathbb{S}_{1}^{d}$
, there exists
 $B_{h}\in \mathbb{S}_{1,h}^{d}$
such that
 $B_{h}\rightarrow B$
as
 $h\rightarrow 0$
.
Since the method is monotone and consistent, the convergence of the numerical solution now follows from the Barles–Souganidis theory; see Theorem 3.8 and Feng and Jensen (Reference Feng and Jensen2017, Theorem 6.5).
Theorem 6.20 (convergence).
Let
 $\unicode[STIX]{x1D6FA}\subset \mathbb{R}^{d}$
be a strictly convex domain. Assume that
 $f\in C(\unicode[STIX]{x1D6FA})$
with
 $f\geq 0$
and
 $g\in C(\unicode[STIX]{x2202}\unicode[STIX]{x1D6FA})$
. Then as
 $h\rightarrow 0$
,
 $h/k_{\min }\rightarrow 0$
, the solutions
 $u_{h}\in X_{h}^{l}$
of (6.6) converge uniformly to the unique viscosity solution on the set of convex functions of the Monge–Ampère problem (6.1).
We conclude the discussion on semi-Lagrangian schemes by commenting that rates of convergence for a general semi-Lagrangian scheme for (5.1) have been obtained by Debrabant and Jakobsen (Reference Debrabant and Jakobsen2013, Corollary 7.3).
6.3 Approximation of Alexandrov solutions
Now we discuss numerical methods based on the Alexandrov solution concept presented in Definition 6.7. Essentially, numerical methods of this class are finite-dimensional analogues of (6.3).
Let
 $\{\unicode[STIX]{x1D714}_{i}\}_{i=1}^{N}$
be an open, disjoint partition of the domain, that is,
 $\unicode[STIX]{x1D714}_{i}\cap \unicode[STIX]{x1D714}_{j}=\emptyset$
for
 $i\neq j$
and
 $\bar{\unicode[STIX]{x1D6FA}}=\cup _{i=1}^{N}\bar{\unicode[STIX]{x1D714}}_{i}$
. Let
 $\unicode[STIX]{x1D6FA}_{h}^{I}:=\{z_{i}\}_{i=1}^{N}$
be a collection of points with the property that
 $z_{i}\in \unicode[STIX]{x1D714}_{j}$
if and only if
 $i=j$
, and let
 $\unicode[STIX]{x1D6FA}_{h}^{B}:=\{z_{i}\}_{i=N+1}^{M+N}$
be a set of distinct points on
 $\unicode[STIX]{x2202}\unicode[STIX]{x1D6FA}$
. As before, we let
 $\bar{\unicode[STIX]{x1D6FA}}_{h}=\unicode[STIX]{x1D6FA}_{h}^{I}\cup \unicode[STIX]{x1D6FA}_{h}^{B}$
and we will call its elements nodes or grid points.
Recall that for a nodal function
 $v_{h}\in X_{h}^{fd}$
, its subdifferential at a grid point
 $z\in \bar{\unicode[STIX]{x1D6FA}}_{h}$
is given by (3.20). Now, a natural generalization of (6.3), and the discrete problem proposed in Oliker and Prussner (Reference Oliker and Prussner1988) reads as follows: find a convex nodal function
 $u_{h}\in X_{h}^{fd}$
satisfying
 $$\begin{eqnarray}\left\{\begin{array}{@{}ll@{}}|\unicode[STIX]{x2202}u_{h}(z_{i})|=\int _{\unicode[STIX]{x1D714}_{i}}f\quad & \text{for all}~z_{i}\in \unicode[STIX]{x1D6FA}_{h}^{I},\\ u_{h}(z_{i})=g(z_{i})\quad & \text{for all}~z_{i}\in \unicode[STIX]{x1D6FA}_{h}^{B}.\end{array}\right.\end{eqnarray}$$
Note that since the partition
 $\{\unicode[STIX]{x1D714}_{i}\}_{i=1}^{N}$
is non-overlapping, for all Borel sets
 $D\subset \unicode[STIX]{x1D6FA}$
we have
 $$\begin{eqnarray}|\unicode[STIX]{x2202}u_{h}(D)|=\mathop{\sum }_{z_{i}\in D}f_{i},\quad f_{i}=\int _{\unicode[STIX]{x1D714}_{i}}f.\end{eqnarray}$$
Thus, the scheme is obtained by replacing
 $f$
in (6.3) with a family of Dirac measures supported at the nodes and by replacing
 $g$
with its nodal interpolant on the boundary.
One special case of this method is when the interior nodal set is a lattice, that is, for some basis
 $\{\tilde{\mathbf{e}}_{j}\}_{j=1}^{d}$
of
 $\mathbb{R}^{d}$
we have
 $$\begin{eqnarray}\unicode[STIX]{x1D6FA}_{h}^{I}=\biggl\{z=h\mathop{\sum }_{j=1}^{d}z^{j}\tilde{\mathbf{e}}_{j}:z^{j}\in \mathbb{Z}\biggr\}\cap \unicode[STIX]{x1D6FA}.\end{eqnarray}$$
We remark that this property applies to interior nodes only. For the boundary nodes, we only require that their spacing is of order
 $h$
, namely,
 $\unicode[STIX]{x2202}\unicode[STIX]{x1D6FA}\subset \cup _{z\in \unicode[STIX]{x1D6FA}_{h}^{B}}B_{h/2}(z)$
. In this case, the partition
 $\{\unicode[STIX]{x1D714}_{i}\}$
of the domain can be taken as parallelotopes
 $$\begin{eqnarray}\unicode[STIX]{x1D714}_{i}=\biggl\{z_{i}+\mathop{\sum }_{j=1}^{d}h^{j}\tilde{\mathbf{e}}_{j}:h^{j}\in \mathbb{R},~|h^{j}|\leq \displaystyle \frac{h}{2}\biggr\}\cap \unicode[STIX]{x1D6FA}.\end{eqnarray}$$
The length of the coordinate vectors
 $\{\tilde{\mathbf{e}}_{j}\}_{j=1}^{d}$
is such that the parallelotope
 $\unicode[STIX]{x1D714}_{i}$
is inside the ball
 $B_{h}(z_{i})$
centred at
 $z_{i}$
and of radius
 $h$
. Note that, by construction,
 $\unicode[STIX]{x1D714}_{j}=z_{j}-z_{i}+\unicode[STIX]{x1D714}_{i}$
; consequently, the radius of the largest ball inscribed in
 $\unicode[STIX]{x1D714}_{i}$
does not depend on
 $i$
and we denote it by
 $\unicode[STIX]{x1D70C}$
. We define the shape-regularity of the nodal set as
 $$\begin{eqnarray}\unicode[STIX]{x1D70E}=h\unicode[STIX]{x1D70C}^{-1}.\end{eqnarray}$$
Remark 6.21 (meshless nodal function).
It is worth mentioning again that the solution
 $u_{h}$
is only defined at the nodes
 $\bar{\unicode[STIX]{x1D6FA}}_{h}$
. Its convex envelope induces a triangulation of the domain
 $\unicode[STIX]{x1D6FA}$
and a piecewise linear function. However, this triangulation is not known a priori. See Remark 3.18 and Examples 3.44–3.45.
In view of Example 3.45, if the solution of the Monge–Ampère equation is nearly degenerate, wide stencils are needed to compute the subdifferential. Thus, method (6.9) may be regarded as a wide-stencil finite difference scheme when the solution is nearly degenerate. On the other hand, if the solution to (6.1) is strictly convex, that is, for
 $0<\unicode[STIX]{x1D706}\leq \unicode[STIX]{x1D6EC}$
we have
 $\unicode[STIX]{x1D706}I\leq D^{2}u\leq \unicode[STIX]{x1D6EC}I$
, then the subdifferential of
 $u_{h}$
at node
 $z$
depends only on the values of
 $u_{h}$
at the adjacent nodes of
 $z$
. To make this last statement rigorous, we state a definition.
Definition 6.22 (adjacent set).
Let
 $u_{h}\in X_{h}^{fd}$
and
 $z\in \unicode[STIX]{x1D6FA}_{h}^{I}$
. The adjacent set
 $A_{z}$
of
 $u_{h}$
at
 $z$
is the collection of nodes
 $z_{i}\in \bar{\unicode[STIX]{x1D6FA}}_{h}$
such that there exists a supporting hyperplane
 $\ell$
of
 $u_{h}$
at
 $z$
and
 $\ell (z_{i})=u_{h}(z_{i})$
.
Note that
 $A_{z}$
is the set of nodes of a star of
 $z$
which is induced by the discrete convex envelope of
 $u_{h}$
; see Figure 3.2. In particular, we have that the subdifferential
 $\unicode[STIX]{x2202}u_{h}(z)$
is determined by the values
 $u(z_{i})$
for
 $z_{i}\in A_{z}$
.
Let us now estimate the size of
 $A_{z}$
.
Lemma 6.23 (size of
$A_{z}$
).

Let
 $v\in C^{2}(\bar{\unicode[STIX]{x1D6FA}})$
be a strictly convex function with
 $\unicode[STIX]{x1D706}I\leq D^{2}v(x)\leq \unicode[STIX]{x1D6EC}I$
for some constants
 $0<\unicode[STIX]{x1D706}\leq \unicode[STIX]{x1D6EC}$
. Assume that
 $E:=\{\tilde{\mathbf{e}}_{j}\}_{j=1}^{d}$
is a basis of
 $\mathbb{R}^{d}$
such that
 $\unicode[STIX]{x1D6FA}_{h}^{I}$
is a lattice spanned by
 $E$
with shape-regularity constant
 $\unicode[STIX]{x1D70E}$
defined in (6.11). Let the nodal function
 $v_{h}\in X_{h}^{fd}$
be defined by
 $v_{h}=I_{h}^{fd}v$
. Then, if
 $A_{z}$
is the adjacent set of
 $v_{h}$
at
 $z\in \unicode[STIX]{x1D6FA}_{h}^{I}$
,
 $$\begin{eqnarray}A_{z}\subset B_{Rh}(z),\end{eqnarray}$$
where
 $$\begin{eqnarray}R\geq \bar{R}:=\displaystyle \frac{\unicode[STIX]{x1D6EC}}{\unicode[STIX]{x1D706}}\unicode[STIX]{x1D70E}^{2}\left|\mathop{\sum }_{j=1}^{d}\tilde{\mathbf{e}}_{j}\right|^{2}.\end{eqnarray}$$
Proof. Without loss of generality, we may assume that
 $z=0$
,
 $v(z)=0$
and
 $Dv(z)=\mathbf{0}$
. Let
 $\hat{z}\in \unicode[STIX]{x1D6FA}_{h}^{I}\cap \unicode[STIX]{x2202}\operatorname{conv}(A_{z})$
and let
 $\unicode[STIX]{x1D714}$
be the parallelotope defined as in (6.10) with centre
 $z=0$
. By convexity of
 $\unicode[STIX]{x1D714}$
, there is a
 $c\in (0,1)$
such that
 $c\hat{z}\in \unicode[STIX]{x2202}\unicode[STIX]{x1D714}$
. Thus, we can express
 $\hat{z}$
as a multiple of a convex combination of
 $\{\unicode[STIX]{x1D701}_{j}\}_{j=1}^{2^{d}}$
, the vertices of
 $\unicode[STIX]{x1D714}$
. In other words, for
 $R=1/c$
we have
 $$\begin{eqnarray}\hat{z}=R\mathop{\sum }_{j=1}^{2^{d}}k_{j}\unicode[STIX]{x1D701}_{j},\quad k_{j}\geq 0,\quad \mathop{\sum }_{j=1}^{2^{d}}k_{j}=1.\end{eqnarray}$$
This representation shows that
 $|\hat{z}|\leq Rh$
; thus, to obtain the result, it remains to estimate
 $R$
.
Since
 $c\hat{z}\in \unicode[STIX]{x2202}\unicode[STIX]{x1D714}$
we have, using (6.11), that
 $|c\hat{z}|\geq \unicode[STIX]{x1D70C}=h\unicode[STIX]{x1D70E}^{-1}$
which can be rewritten as
 $|\hat{z}|\geq Rh\unicode[STIX]{x1D70E}^{-1}$
. Using that
 $D^{2}v\geq \unicode[STIX]{x1D706}I$
we estimate
 $$\begin{eqnarray}v_{h}(\hat{z})=v(\hat{z})\geq \displaystyle \frac{1}{2}\unicode[STIX]{x1D706}R^{2}\unicode[STIX]{x1D70E}^{-2}h^{2}.\end{eqnarray}$$
Let us now obtain an upper bound for
 $v_{h}(\hat{z})$
. To do so, let us introduce
 $\hat{\unicode[STIX]{x1D714}}$
as the (unique) smallest parallelotope with vertices
 $\{\bar{z}_{m}\}_{m=1}^{2^{d}}\subset \unicode[STIX]{x1D6FA}_{h}^{I}$
such that
 $z\in \{\bar{z}_{m}\}_{m=1}^{2^{d}}$
is a vertex and
 $c\hat{z}\in \hat{\unicode[STIX]{x1D714}}$
. This parallelotope can be thought of as belonging to the dual mesh. We now invoke Caratheodory’s theorem Dacorogna (Reference Dacorogna2008, Theorem 2.13) to conclude that there is a subset of
 $\{\bar{z}_{m}\}_{m=1}^{2^{d}}$
, of cardinality
 $d+1$
, for which
 $c\hat{z}$
can be expressed as a convex combination of these vertices. In other words, up to a permutation in
 $\{1,\ldots ,2^{d}\}$
, we have
 $$\begin{eqnarray}\hat{z}=R\mathop{\sum }_{m=1}^{d+1}\unicode[STIX]{x1D6FC}_{m}\bar{z}_{m},\quad \unicode[STIX]{x1D6FC}_{m}\geq 0,\quad \mathop{\sum }_{m=1}^{d+1}\unicode[STIX]{x1D6FC}_{m}=1.\end{eqnarray}$$
We now invoke that
 $\hat{z}\in A_{z}$
. This implies that there is an affine function
 $\ell$
that verifies
 $$\begin{eqnarray}\ell (z)=v_{h}(z)=0,\quad \ell (\hat{z})=v_{h}(\hat{z}),\quad \ell (\bar{z}_{m})\leq v_{h}(\bar{z}_{m}),~m=1,\ldots ,d+1.\end{eqnarray}$$
Using representation (6.13) of
 $\hat{z}$
and that
 $D^{2}v\leq \unicode[STIX]{x1D6EC}I$
we then obtain
 $$\begin{eqnarray}v_{h}(\hat{z})=R\mathop{\sum }_{m=1}^{d+1}\unicode[STIX]{x1D6FC}_{m}\ell (\bar{z}_{m})\leq \displaystyle \frac{1}{2}\unicode[STIX]{x1D6EC}R\mathop{\sum }_{m=1}^{d+1}\unicode[STIX]{x1D6FC}_{m}|\bar{z}_{m}|^{2}.\end{eqnarray}$$
It remains to observe now that
 $$\begin{eqnarray}\bar{z}_{m}=z+\mathop{\sum }_{j=1}^{d}\unicode[STIX]{x1D716}_{j}h\tilde{\mathbf{e}}_{j}\end{eqnarray}$$
with
 $\unicode[STIX]{x1D716}_{j}\in \{-1,0,1\}$
, and therefore
 $$\begin{eqnarray}|\bar{z}_{m}|\leq h\left|\mathop{\sum }_{j=1}^{d}\tilde{\mathbf{e}}_{j}\right|.\end{eqnarray}$$
A combination of the obtained upper and lower bounds for
 $v_{h}(\hat{z})$
yields
 $$\begin{eqnarray}\displaystyle \frac{1}{2}\unicode[STIX]{x1D706}R^{2}h^{2}\unicode[STIX]{x1D70E}^{-2}\leq \displaystyle \frac{1}{2}\unicode[STIX]{x1D6EC}Rh^{2}\left|\mathop{\sum }_{j=1}^{d}\tilde{\mathbf{e}}_{j}\right|^{2},\end{eqnarray}$$
from which (6.12) follows.
Remark 6.24 (Cartesian lattice).
In the setting of Lemma 6.23, if
 $E$
is the canonical basis of
 $\mathbb{R}^{d}$
, then Mirebeau (Reference Mirebeau2015) and Benamou, Collino and Mirebeau (Reference Benamou, Collino and Mirebeau2016) have improved estimate (6.12) to
 $\bar{R}=(\unicode[STIX]{x1D6EC}/\unicode[STIX]{x1D706})\unicode[STIX]{x1D70E}^{2}$
.
If
 $\unicode[STIX]{x1D6FA}_{h}^{I}$
is a lattice, then we are able to show consistency of the method (6.9) in the following sense.
Lemma 6.25 (consistency).
Let
 $E=\{\tilde{\mathbf{e}}_{j}\}_{j=1}^{d}$
be a basis of
 $\mathbb{R}^{d}$
and
 $\unicode[STIX]{x1D6FA}_{h}^{I}$
be a lattice spanned by
 $E$
. Let
 $p$
be a strictly convex quadratic polynomial with
 $\unicode[STIX]{x1D706}I\leq D^{2}p\leq \unicode[STIX]{x1D6EC}I$
. If
 $z\in \unicode[STIX]{x1D6FA}_{h}^{I}$
is such that
 $\operatorname{dist}(z,\unicode[STIX]{x2202}\unicode[STIX]{x1D6FA})\geq \bar{R}h$
, with
 $\bar{R}$
as in (6.12), then we have
 $$\begin{eqnarray}|\unicode[STIX]{x2202}I_{h}^{fd}p(z)|=\det (D^{2}p)|\unicode[STIX]{x1D714}_{z}|,\end{eqnarray}$$
where
 $\unicode[STIX]{x1D714}_{z}$
is the parallelotope defined by (6.10).
Proof. We divide the proof into two steps.
Step 1. We first show that (6.14) holds when the domain is
 $\unicode[STIX]{x1D6FA}=\mathbb{R}^{d}$
. Without loss of generality, we assume that
 $z=0$
and
 $p(x)={\textstyle \frac{1}{2}}x\cdot Mx$
for some
 $M\geq \unicode[STIX]{x1D706}I$
. For a vector
 $\mathbf{q}\in \mathbb{R}^{d}$
we define the norm
 $|\mathbf{q}|_{M}^{2}:=\mathbf{q}\cdot M\mathbf{q}$
, and define the set
 $$\begin{eqnarray}\displaystyle V & := & \displaystyle \{\mathbf{q}\in \mathbb{R}^{d}:|\mathbf{q}|_{M}\leq |\mathbf{q}-z_{j}|_{M},~\forall z_{j}\in \bar{\unicode[STIX]{x1D6FA}}_{h}\}\nonumber\\ \displaystyle & = & \displaystyle \biggl\{\mathbf{q}\in \mathbb{R}^{d}:\mathbf{q}\cdot Mz_{j}\leq \displaystyle \frac{1}{2}z_{j}\cdot Mz_{j},~\forall z_{j}\in \bar{\unicode[STIX]{x1D6FA}}_{h}\biggr\}.\nonumber\end{eqnarray}$$
It can be shown (see Lemma 2.3 of Mirebeau Reference Mirebeau2015 for details) that translations of
 $V$
tile
 $\mathbb{R}^{d}$
and that
 $|V|=|\unicode[STIX]{x1D714}_{z}|$
. Moreover, by a simple algebraic manipulation,
 $$\begin{eqnarray}V=\{M^{-1}\mathbf{q}\in \mathbb{R}^{d}:\mathbf{q}\cdot z_{j}\leq I_{h}^{fd}p(z_{j}),~\forall z_{j}\in \bar{\unicode[STIX]{x1D6FA}}_{h}\}.\end{eqnarray}$$
Thus,
 $V=M^{-1}[\unicode[STIX]{x2202}I_{h}^{fd}p(0)]$
, that is, it is the image of subdifferential
 $\unicode[STIX]{x2202}I_{h}^{fd}p(0)$
under the linear map
 $M^{-1}$
. Taking measures on both sides yields
 $$\begin{eqnarray}|\unicode[STIX]{x1D714}_{z}|=|V|=\det (M)^{-1}|\unicode[STIX]{x2202}I_{h}^{fd}p(0)|.\end{eqnarray}$$
The proof of Step 1 is now completed by rearranging terms.
Step 2. We now consider a bounded domain and show that (6.14) holds for nodes sufficiently far away from the boundary, that is,
 $\operatorname{dist}(z,\unicode[STIX]{x2202}\unicode[STIX]{x1D6FA})\geq \bar{R}h$
. To do so, we observe that the subdifferential
 $\unicode[STIX]{x2202}I_{h}^{fd}p(z)$
is determined only by the function values in the adjacent set
 $A_{z}$
. Since, as shown in Lemma 6.23,
 $A_{z}\subset B_{\bar{R}h}(z)$
, we deduce that if the node
 $z$
is bounded away from the boundary with
 $\operatorname{dist}(z,\unicode[STIX]{x2202}\unicode[STIX]{x1D6FA})\geq \bar{R}h$
, then
 $A_{z}\subset \unicode[STIX]{x1D6FA}$
. Thus, (6.14) holds.
This concludes the proof.
6.3.1 A truncated version
When
 $\unicode[STIX]{x1D6FA}_{h}^{I}$
is a Cartesian lattice, scheme (6.9) is is closely related to the finite difference method of Mirebeau (Reference Mirebeau2015) and Benamou et al. (Reference Benamou, Collino and Mirebeau2016) which we now describe. For simplicity, suppose that
 $d=2$
and that the interior grid points are given by
 $$\begin{eqnarray}\unicode[STIX]{x1D6FA}_{h}^{I}=\unicode[STIX]{x1D6FA}\cap \mathbb{Z}_{h}^{2}.\end{eqnarray}$$
Let
 $S\subset \mathbb{Z}^{2}\backslash \{0\}$
denote a stencil. For any
 $y\in S$
and
 $z\in \unicode[STIX]{x1D6FA}_{h}^{I}$
sufficiently far from
 $\unicode[STIX]{x2202}\unicode[STIX]{x1D6FA}$
, we recall that the second-order difference operator in the direction
 $y$
is given by
 $$\begin{eqnarray}\unicode[STIX]{x1D6FF}_{y,h}^{2}v(z)=\displaystyle \frac{v(z+hy)-2v(z)+v(z-hy)}{h^{2}}.\end{eqnarray}$$
When
 $z\in \unicode[STIX]{x1D6FA}_{h}^{I}$
is close to
 $\unicode[STIX]{x2202}\unicode[STIX]{x1D6FA}$
, the point
 $z\pm hy$
may not belong to
 $\bar{\unicode[STIX]{x1D6FA}}_{h}$
. In such cases, we define
 $$\begin{eqnarray}\unicode[STIX]{x1D6FF}_{y,h}^{2}v(z):=\displaystyle \frac{2}{h^{+}+h^{-}}\biggl(\displaystyle \frac{v(z+h^{+}y)-v(z)}{h^{+}}+\displaystyle \frac{v(z-h^{-}y)-v(z)}{h^{-}}\biggr),\end{eqnarray}$$
where
 $h^{\pm }$
is the only element in
 $[0,h]$
such that
 $z\pm h^{\pm }y\in \unicode[STIX]{x2202}\unicode[STIX]{x1D6FA}$
. This construction implicitly defines the set of boundary points
 $\unicode[STIX]{x1D6FA}_{h}^{B}$
.
We define the set of superbases of
 $S$
as
 $$\begin{eqnarray}Y_{h}:=\{(y_{0},y_{1},y_{2})\in S^{3}:|\text{det}(y_{0},y_{1},y_{2})|=1,~y_{0}+y_{1}+y_{2}=\mathbf{0}\}.\end{eqnarray}$$
Note that for
 $z\in \unicode[STIX]{x1D6FA}_{h}^{I}$
and
 $\mathbf{y}=(y_{0},y_{1},y_{2})\in Y_{h}$
, the convex hull
 ${\mathcal{H}}_{z,\mathbf{y}}=\operatorname{conv}\{z\pm hy_{i}\}_{i=0}^{3}$
is a hexagon. Given a nodal function
 $v_{h}$
, superbasis
 $\mathbf{y}=(y_{0},y_{1},y_{2})\in Y_{h}$
and a point
 $z\in \unicode[STIX]{x1D6FA}_{h}^{I}$
, we let
 $\unicode[STIX]{x1D6E4}_{z,\mathbf{y}}(v_{h})$
denote the maximal convex map bounded above by
 $v_{h}$
at the points
 $z$
and
 $\{z\pm hy_{i}\}_{i=0}^{3}$
. As before,
 $\unicode[STIX]{x1D6E4}_{z,\mathbf{y}}(v_{h})$
, restricted to
 ${\mathcal{H}}_{z,\mathbf{y}}$
, is a piecewise linear function with respect to some triangulation of
 ${\mathcal{H}}_{z,\mathbf{y}}$
, which depends on the values of
 $v_{h}$
on the extreme points of
 ${\mathcal{H}}_{z,\mathbf{y}}$
and
 $z$
.
We define the discrete Monge–Ampère operator
 $$\begin{eqnarray}\unicode[STIX]{x1D6FE}(\unicode[STIX]{x1D6E5}_{y_{0}}^{+}v_{h}(z),\unicode[STIX]{x1D6E5}_{y_{1}}^{+}v_{h}(z),\unicode[STIX]{x1D6E5}_{y_{2}}^{+}v_{h}(z)),\end{eqnarray}$$
with
 $\unicode[STIX]{x1D6E5}_{y}^{+}v(z)=\max \{\unicode[STIX]{x1D6FF}_{y,h}^{2}v_{h}(z),0\}$
and
 $$\begin{eqnarray}\unicode[STIX]{x1D6FE}(\unicode[STIX]{x1D6FF}_{0},\unicode[STIX]{x1D6FF}_{1},\unicode[STIX]{x1D6FF}_{2}):=\left\{\begin{array}{@{}ll@{}}\unicode[STIX]{x1D6FF}_{i+1}\unicode[STIX]{x1D6FF}_{i+2}\quad & \text{if }\unicode[STIX]{x1D6FF}_{i}\geq \unicode[STIX]{x1D6FF}_{i+1}+\unicode[STIX]{x1D6FF}_{i+2},~i=0,\ldots ,2\hspace{0.6em}{\rm mod}\hspace{0.2em}3,\\ \unicode[STIX]{x1D6FE}_{1}(\unicode[STIX]{x1D6FF}_{0},\unicode[STIX]{x1D6FF}_{1},\unicode[STIX]{x1D6FF}_{2})\quad & \text{otherwise},\end{array}\right.\end{eqnarray}$$
with
 $$\begin{eqnarray}\unicode[STIX]{x1D6FE}_{1}(\unicode[STIX]{x1D6FF}_{0},\unicode[STIX]{x1D6FF}_{1},\unicode[STIX]{x1D6FF}_{2}):=\displaystyle \frac{1}{2}(\unicode[STIX]{x1D6FF}_{0}\unicode[STIX]{x1D6FF}_{1}+\unicode[STIX]{x1D6FF}_{1}\unicode[STIX]{x1D6FF}_{2}+\unicode[STIX]{x1D6FF}_{0}\unicode[STIX]{x1D6FF}_{2})-\displaystyle \frac{1}{4}(\unicode[STIX]{x1D6FF}_{0}^{2}+\unicode[STIX]{x1D6FF}_{1}^{2}+\unicode[STIX]{x1D6FF}_{2}^{2}).\end{eqnarray}$$
As shown by Benamou et al. (Reference Benamou, Collino and Mirebeau2016, Remark 1.10), from the definition of subdifferential and some geometric arguments it follows that
 $$\begin{eqnarray}\unicode[STIX]{x1D6FE}(\unicode[STIX]{x1D6E5}_{y_{0}}^{+}v_{h}(z),\unicode[STIX]{x1D6E5}_{y_{1}}^{+}v_{h}(z),\unicode[STIX]{x1D6E5}_{y_{2}}^{+}v_{h}(z))=h^{2}|\unicode[STIX]{x2202}\unicode[STIX]{x1D6E4}_{z,\mathbf{y}}(v_{h})(z)|.\end{eqnarray}$$
The scheme proposed in Benamou et al. (Reference Benamou, Collino and Mirebeau2016) reads as follows: find the nodal function
 $u_{h}\in X_{h}^{fd}$
such that
 $$\begin{eqnarray}\left\{\begin{array}{@{}ll@{}}\min _{\mathbf{y}\in Y_{h}}\unicode[STIX]{x1D6FE}(\unicode[STIX]{x1D6E5}_{y_{0}}^{+}u_{h}(z),\unicode[STIX]{x1D6E5}_{y_{1}}^{+}u_{h}(z),\unicode[STIX]{x1D6E5}_{y_{2}}^{+}u_{h}(z))=f(z)\quad & \text{for all}~z\in \unicode[STIX]{x1D6FA}_{h}^{I},\\ u_{h}(z)=g(z)\quad & \text{for all}~z\in \unicode[STIX]{x1D6FA}_{h}^{B}.\end{array}\right.\end{eqnarray}$$
Lemma 6.26 (consistency).
Let
 $M$
be a positive definite matrix and
 $p(x)={\textstyle \frac{1}{2}}x\cdot Mx$
be a convex quadratic polynomial. Then
 $$\begin{eqnarray}\min _{\mathbf{y}\in Y_{h}}|\unicode[STIX]{x2202}\unicode[STIX]{x1D6E4}_{z,\mathbf{y}}(I_{h}^{fd}p)(z)|=\det (M)\end{eqnarray}$$
if and only if there is an
 $M$
-obtuse superbasis
 $(y_{0},y_{1},y_{2})$
, that is,
 $$\begin{eqnarray}y_{i}\cdot My_{j}\leq 0,\quad \text{for all}~i\neq j.\end{eqnarray}$$
Moreover, if
 $B_{R}\subset \operatorname{conv}S$
with
 $R^{2}=2|M|\,|M^{-1}|$
, then such an
 $M$
-obtuse basis exists in
 $S$
.
We refer to Benamou et al. (Reference Benamou, Collino and Mirebeau2016, Propositions 1.12 and 2.2) for a proof. Note that the previous result shows that if the matrix
 $M$
is anisotropic, that is,
 $|M|\,|M^{-1}|$
is large, then a wide stencil is needed to ensure the existence of an
 $M$
-obtuse superbasis.
Remark 6.27 (three dimensions).
In three space dimensions, to the best of our knowledge, there is no explicit formula to compute
 $|\unicode[STIX]{x2202}\unicode[STIX]{x1D6E4}_{z,\mathbf{y}}(v_{h})(z)|$
. As shown in Mirebeau (Reference Mirebeau2015), if
 $p(x)={\textstyle \frac{1}{2}}x\cdot Mx$
and the stencil
 $S$
is such that
 $B_{R}\subset \operatorname{conv}S$
, for some
 $R$
that depends on
 $|M|\,|M^{-1}|$
, then we have that
 $$\begin{eqnarray}\det (M)=h^{3}|\unicode[STIX]{x2202}\unicode[STIX]{x1D6E4}_{z,\mathbf{y}}(I_{h}^{fd}p)(z)|.\end{eqnarray}$$
This result is consistent with Lemma 6.25.
6.3.2 Stability of (6.9)
While the convergence of monotone and consistent schemes, like (6.9), can be obtained using the framework described in Section 3.1, few results are known on the rate of convergence of such approximations. Here, following Nochetto and Zhang (Reference Nochetto and Zhang2017b
), we discuss some recent results on the
 $L^{\infty }$
-rate of convergence of scheme (6.9).
In addition to the discrete Alexandrov estimates of Lemmas 3.24 and 3.46, the derivation of these error estimates involves a discrete barrier argument as in Section 4.3 and the Brunn–Minkowski inequality, which we now state.
Let
 $D$
and
 $E$
be two non-empty compact subsets of
 $\mathbb{R}^{d}$
. We define their (Minkowski) sum as
 $$\begin{eqnarray}D+E:=\{\mathbf{v}+\mathbf{w}\in \mathbb{R}^{d}:\mathbf{v}\in D,~\mathbf{w}\in E\}.\end{eqnarray}$$
Proposition 6.28 (Brunn–Minkowski).
Let
 $A$
and
 $B$
be two non-empty compact subsets of
 $\mathbb{R}^{d}$
. Then the following inequality holds:
 $$\begin{eqnarray}|A+B|^{1/d}\geq |A|^{1/d}+|B|^{1/d}\end{eqnarray}$$
where
 $|\cdot |$
denotes the Lebesgue measure on
 $\mathbb{R}^{d}$
.
Remark 6.29 (concavity).
The Brunn–Minkowski inequality implies that the function
 $D\rightarrow |D|^{1/d}$
is concave, in the sense that for
 $0\leq t\leq 1$
,
 $$\begin{eqnarray}|tA+(1-t)B|^{1/d}\geq t|A|^{1/d}+(1-t)|B|^{1/d}.\end{eqnarray}$$
The discrete Alexandrov estimate Lemma 3.24 shows that the
 $L^{\infty }$
-norm of nodal or piecewise linear function
 $v_{h}$
is controlled by the measure of the subdifferential
 $|\unicode[STIX]{x2202}v_{h}|$
. Now suppose
 $u_{h}$
and
 $w_{h}$
are two nodal functions. The following stability estimate shows that the difference
 $v_{h}-w_{h}$
measured in the
 $L^{\infty }$
-norm is controlled by the difference of the measure of their subdifferentials. This can be recast as a stability estimate for scheme (6.9).
Proposition 6.30 (stability).
Let
 $v_{h}$
and
 $w_{h}$
be two nodal functions with
 $v_{h}\geq w_{h}$
on
 $\unicode[STIX]{x1D6FA}_{h}^{B}$
. Then
 $$\begin{eqnarray}\sup _{\bar{\unicode[STIX]{x1D6FA}}_{h}}(v_{h}-w_{h})^{-}\leq C\biggl(\mathop{\sum }_{z\in {\mathcal{C}}_{h}^{-}(v_{h}-w_{h})}(|\unicode[STIX]{x2202}v_{h}(z)|^{1/d}-|\unicode[STIX]{x2202}w_{h}(z)|^{1/d})^{d}\biggr)^{1/d}.\end{eqnarray}$$
Proof. Consider the discrete convex envelope of the difference
 $v_{h}-w_{h}$
, which we denote by
 $\unicode[STIX]{x1D6E4}_{h}(v_{h}-w_{h})$
and its lower nodal contact set
 $$\begin{eqnarray}{\mathcal{C}}_{h}^{-}(v_{h}-w_{h})=\{z\in \unicode[STIX]{x1D6FA}_{h}^{I}:\unicode[STIX]{x1D6E4}_{h}(v_{h}-w_{h})(z)=(u_{h}-w_{h})(z)\}.\end{eqnarray}$$
By Lemma 3.24 (finite difference Alexandrov estimate), we have
 $$\begin{eqnarray}\sup _{\bar{\unicode[STIX]{x1D6FA}}_{h}}(v_{h}-w_{h})^{-}\leq C\biggl(\mathop{\sum }_{z\in {\mathcal{C}}_{h}(v_{h}-w_{h})^{-}}|\unicode[STIX]{x2202}\unicode[STIX]{x1D6E4}_{h}(v_{h}-w_{h})(z)|\biggr)^{1/d}.\end{eqnarray}$$
Thus, we only need to estimate
 $|\unicode[STIX]{x2202}\unicode[STIX]{x1D6E4}_{h}(v_{h}-w_{h})(z)|$
for all
 $z$
in the contact set, which we do as follows. We first note that Lemma 3.21 implies that
 $$\begin{eqnarray}\unicode[STIX]{x2202}w_{h}(z)+\unicode[STIX]{x2202}\unicode[STIX]{x1D6E4}_{h}(v_{h}-w_{h})(z)\subset \unicode[STIX]{x2202}v_{h}(z).\end{eqnarray}$$
From this, and the Brunn–Minkowski inequality (Proposition 6.28), we obtain
 $$\begin{eqnarray}\displaystyle & & \displaystyle |\unicode[STIX]{x2202}w_{h}(z)|^{1/d}+|\unicode[STIX]{x2202}\unicode[STIX]{x1D6E4}_{h}(v_{h}-w_{h})(z)|^{1/d}\nonumber\\ \displaystyle & & \displaystyle \qquad \leq |\unicode[STIX]{x2202}w_{h}(z)+\unicode[STIX]{x2202}\unicode[STIX]{x1D6E4}_{h}(v_{h}-w_{h})(z)|^{1/d}\leq |\unicode[STIX]{x2202}v_{h}(z)|^{1/d},\end{eqnarray}$$
which clearly implies that
 $$\begin{eqnarray}|\unicode[STIX]{x2202}\unicode[STIX]{x1D6E4}_{h}(v_{h}-w_{h})(z)|\leq (|\unicode[STIX]{x2202}v_{h}(z)|^{1/d}-|\unicode[STIX]{x2202}w_{h}(z)|^{1/d})^{d}.\end{eqnarray}$$
This is the desired estimate for
 $|\unicode[STIX]{x2202}\unicode[STIX]{x1D6E4}_{h}(u_{h}-w_{h})(z)|$
. Inserting it into (6.16) yields the claimed result.
A direct consequence of this stability result is a maximum principle for nodal functions, which we state below.
Corollary 6.31 (maximum principle).
Let
 $v_{h}$
and
 $w_{h}$
be two nodal functions associated with
 $\bar{\unicode[STIX]{x1D6FA}}_{h}$
. If
 $v_{h}\geq w_{h}$
on
 $\unicode[STIX]{x1D6FA}_{h}^{B}$
and
 $|\unicode[STIX]{x2202}v_{h}(z)|\leq |\unicode[STIX]{x2202}w_{h}(z)|$
for all
 $z\in \unicode[STIX]{x1D6FA}_{h}^{I}$
, then
 $$\begin{eqnarray}w_{h}(z)\leq v_{h}(z),\quad \text{for all}~z\in \bar{\unicode[STIX]{x1D6FA}}_{h}.\end{eqnarray}$$
Proof. By (6.17) and (6.18), we have
 $|\unicode[STIX]{x2202}w_{h}(z)|\leq |\unicode[STIX]{x2202}v_{h}(z)|$
for any
 $z\in {\mathcal{C}}_{h}^{-}(v_{h}-w_{h})$
. Since
 $|\unicode[STIX]{x2202}v_{h}(z)|\leq |\unicode[STIX]{x2202}w_{h}(z)|$
by assumption, we have
 $|\unicode[STIX]{x2202}v_{h}(z)|=|\unicode[STIX]{x2202}w_{h}(z)|$
at contact points. Thus, by Proposition 6.30, we get
 $$\begin{eqnarray}\sup _{\bar{\unicode[STIX]{x1D6FA}}_{h}}(v_{h}-w_{h})^{-}=0.\end{eqnarray}$$
Consequently
 $v_{h}-w_{h}\geq 0$
, which proves the result.
6.3.3 Error estimates for (6.9)
Let us now derive rates of convergence in the
 $L^{\infty }$
-norm for method (6.9). To do so, we will use all the tools we have developed in previous sections, namely the discrete Alexandrov estimate of Proposition 3.24, the Brunn–Minkowski inequality of Proposition 6.28 and the stability result of Proposition 6.30.
Owing to Proposition 6.30 we only need to study the consistency error. Since the method is consistent for convex quadratic polynomials at nodes bounded away from the boundary
 $\unicode[STIX]{x2202}\unicode[STIX]{x1D6FA}$
(see Lemma 6.25), if we expect that
 $u$
can be well approximated by quadratic polynomials, then the consistency error will also be small. Let us make this intuition rigorous.
Lemma 6.32 (interior consistency).
Let
 $E=\{\tilde{\mathbf{e}}_{j}\}_{j=1}^{d}$
be a basis of
 $\mathbb{R}^{d}$
and let
 $\unicode[STIX]{x1D6FA}_{h}^{I}$
be a lattice spanned by
 $E$
. Given
 $u$
, strictly convex, let
 $z\in \unicode[STIX]{x1D6FA}_{h}^{I}$
with
 $\operatorname{dist}(z,\unicode[STIX]{x2202}\unicode[STIX]{x1D6FA})\geq \bar{R}h$
, where
 $\bar{R}$
is defined in (6.12), and set
 $\bar{B}=B_{\bar{R}h}(z)$
. If
 $u\in C^{2,\unicode[STIX]{x1D6FC}}(\bar{B})$
, then we have
 $$\begin{eqnarray}\biggl||\unicode[STIX]{x2202}I_{h}^{fd}u(z)|-\int _{\unicode[STIX]{x1D714}_{z}}\det (D^{2}u)\biggr|\leq Ch^{\unicode[STIX]{x1D6FC}}|\unicode[STIX]{x1D714}_{z}|,\end{eqnarray}$$
where the constant
 $C$
depends on
 $|u|_{C^{2,\unicode[STIX]{x1D6FC}}(\bar{B})}$
, and
 $\unicode[STIX]{x1D714}_{z}$
is defined in (6.10).
Proof. Let us show that
 $$\begin{eqnarray}|\unicode[STIX]{x2202}I_{h}^{fd}u(z)|\leq \int _{\unicode[STIX]{x1D714}_{z}}\det (D^{2}u)+Ch^{\unicode[STIX]{x1D6FC}}|\unicode[STIX]{x1D714}_{z}|.\end{eqnarray}$$
The other inequality can be obtained in a similar fashion.
Since
 $u\in C^{2,\unicode[STIX]{x1D6FC}}(\bar{B})$
, there is a convex quadratic polynomial
 $p\in \mathbb{P}_{2}$
that satisfies
 $p(z)=u(z)$
,
 $Dp(z)=Du(z)$
,
 $D^{2}p=D^{2}u(z)$
and, moreover,
 $$\begin{eqnarray}u(x)\leq p(x)+|u|_{C^{2,\unicode[STIX]{x1D6FC}}(\bar{B})}h^{2+\unicode[STIX]{x1D6FC}},\quad \text{for all}~x\in \bar{B}.\end{eqnarray}$$
Define
 $q(x)=p(x)+h^{\unicode[STIX]{x1D6FC}}|u|_{C^{2,\unicode[STIX]{x1D6FC}}(\bar{B})}|x-z|^{2}$
and note that, by construction,
 $q(z)=u(z)$
and for all nodes
 $z_{j}\in \bar{B}\cap \unicode[STIX]{x1D6FA}_{h}^{I}$
we have
 $u(z_{j})\leq q(z_{j})$
. Since
 $q$
is convex, its nodal interpolant
 $I_{h}^{fd}q$
is also convex (see Definition 3.16). Thus, we can apply Lemma 3.20 (monotonicity), to get
 $|\unicode[STIX]{x2202}I_{h}^{fd}u(z)|\leq |\unicode[STIX]{x2202}I_{h}^{fd}q(z)|$
. From these considerations we see that it is sufficient to show that
 $$\begin{eqnarray}|\unicode[STIX]{x2202}I_{h}^{fd}q(z)|\leq \int _{\unicode[STIX]{x1D714}_{z}}\det (D^{2}u)+Ch^{\unicode[STIX]{x1D6FC}}|\unicode[STIX]{x1D714}_{z}|.\end{eqnarray}$$
Since
 $\unicode[STIX]{x1D706}+Ch^{\unicode[STIX]{x1D6FC}}\leq D^{2}q\leq \unicode[STIX]{x1D6EC}+Ch^{\unicode[STIX]{x1D6FC}}$
and
 $$\begin{eqnarray}\displaystyle \frac{\unicode[STIX]{x1D6EC}+Ch^{\unicode[STIX]{x1D6FC}}}{\unicode[STIX]{x1D706}+Ch^{\unicode[STIX]{x1D6FC}}}\leq \displaystyle \frac{\unicode[STIX]{x1D6EC}}{\unicode[STIX]{x1D706}},\end{eqnarray}$$
we invoke the consistency result of Lemma 6.25 and the regularity
 $u\in C^{2,\unicode[STIX]{x1D6FC}}(\bar{B})$
to obtain
 $$\begin{eqnarray}\displaystyle |\unicode[STIX]{x2202}I_{h}^{fd}q(z)| & = & \displaystyle \det (D^{2}q)|\unicode[STIX]{x1D714}_{z}|\leq (\det (D^{2}p)+Ch^{\unicode[STIX]{x1D6FC}})|\unicode[STIX]{x1D714}_{z}|\nonumber\\ \displaystyle & \leq & \displaystyle \int _{\unicode[STIX]{x1D714}_{z}}\det (D^{2}u)+Ch^{\unicode[STIX]{x1D6FC}}|\unicode[STIX]{x1D714}_{z}|.\nonumber\end{eqnarray}$$
This concludes the proof.
The previous result establishes a consistency error at nodes bounded away from the boundary. For nodes close to the boundary, we have the following estimate.
Lemma 6.33 (boundary consistency).
Let
 $E=\{\tilde{\mathbf{e}}_{j}\}_{j=1}^{d}$
be a basis of
 $\mathbb{R}^{d}$
and let
 $\unicode[STIX]{x1D6FA}_{h}^{I}$
be a lattice spanned by
 $E$
. Given
 $u$
, strictly convex, let
 $z\in \unicode[STIX]{x1D6FA}_{h}^{I}$
satisfy
 $\operatorname{dist}(z,\unicode[STIX]{x2202}\unicode[STIX]{x1D6FA})\leq \bar{R}h$
, where
 $\bar{R}$
is defined in (6.12) and set
 $\bar{B}=B_{\bar{R}h}(z)\cap \unicode[STIX]{x1D6FA}$
. If
 $u\in C^{1,1}(\bar{B})$
, then
 $$\begin{eqnarray}\biggl||\unicode[STIX]{x2202}I_{h}^{fd}u(z)|-\int _{\unicode[STIX]{x1D714}_{z}}\det D^{2}u\biggr|\leq C|\unicode[STIX]{x1D714}_{z}|,\end{eqnarray}$$
where the constant
 $C$
depends only on
 $|u|_{C^{1,1}(\bar{B})}$
.
Proof. As in Lemma 6.32, it suffices to show that
 $$\begin{eqnarray}|\unicode[STIX]{x2202}I_{h}^{fd}u(z)|\leq \int _{\unicode[STIX]{x1D714}_{z}}\det D^{2}u+C|\unicode[STIX]{x1D714}_{z}|.\end{eqnarray}$$
Since
 $\unicode[STIX]{x1D706}I\leq D^{2}u\leq \unicode[STIX]{x1D6EC}I$
, Lemma 6.23 yields
 $A_{z}\subset B_{\bar{R}h}(z)\cap \unicode[STIX]{x1D6FA}$
. Recall now that
 $\unicode[STIX]{x1D6E4}(I_{h}^{fd}u)$
is piecewise linear with respect to a triangulation that has as nodes
 $\bar{\unicode[STIX]{x1D6FA}}_{h}$
. The
 $C^{1,1}$
-regularity assumption of
 $u$
implies that, if
 $K\subset \unicode[STIX]{x1D714}_{z}\subset \bar{B}$
is an element of this triangulation, we have
 $$\begin{eqnarray}D\unicode[STIX]{x1D6E4}(I_{h}^{fd}u)|_{K}=Du(z)+\mathbf{v}_{K}\quad |\mathbf{v}_{K}|\leq Ch|u|_{C^{1,1}(\bar{B})}.\end{eqnarray}$$
Thus, by Lemma 3.22 (characterization of subdifferential), we deduce that the piecewise gradient
 $D\unicode[STIX]{x1D6E4}(I_{h}^{fd}u)|_{K}$
is contained in a ball centred at
 $Du(z)$
and with radius
 $Ch|u|_{C^{1,1}(\bar{B})}$
. Thus, we have
 $$\begin{eqnarray}|\unicode[STIX]{x2202}I_{h}^{fd}u(z)|\leq \int _{\unicode[STIX]{x1D714}_{z}}\det D^{2}u+C|u|_{C^{1,1}(\bar{B})}^{d}|\unicode[STIX]{x1D714}_{z}|.\end{eqnarray}$$
This completes the proof.
To control the
 $L^{\infty }$
-error caused by the
 $O(1)$
error near the boundary, we construct a discrete barrier function below. We refer to Nochetto and Zhang (Reference Nochetto and Zhang2017b
) for a proof.
Lemma 6.34 (discrete barrier).
Let
 $\unicode[STIX]{x1D6FA}$
be uniformly convex and let
 $\unicode[STIX]{x1D6FA}_{h}^{I}$
be a translation-invariant nodal set in
 $\unicode[STIX]{x1D6FA}$
. Given a constant
 $M>0$
, for each node
 $z\in \unicode[STIX]{x1D6FA}_{h}^{I}$
with
 $\operatorname{dist}(z,\unicode[STIX]{x2202}\unicode[STIX]{x1D6FA})\leq \bar{R}h$
, there exists a convex nodal function
 $p_{z}\in X_{h}^{fd}$
such that
 $|\unicode[STIX]{x2202}p_{z}(z_{i})|\geq M|\unicode[STIX]{x1D714}_{z}|$
for all
 $z_{i}\in \bar{\unicode[STIX]{x1D6FA}}_{h}$
,
 $p_{z}(z_{i})\leq 0$
on
 $z_{i}\in \unicode[STIX]{x1D6FA}_{h}^{B}$
and
 $$\begin{eqnarray}|p_{z}(z)|\leq CRM^{1/d}h,\end{eqnarray}$$
for sufficiently small
 $h$
.
Now we are ready to prove the
 $L^{\infty }$
-error estimate.
Theorem 6.35 (rate of convergence I).
Assume that
 $\unicode[STIX]{x1D6FA}$
is uniformly convex, and let
 $u$
be the strictly convex (Alexandrov) solution of Monge–Ampère equation (6.1) with
 $f\geq \unicode[STIX]{x1D706}^{d}>0$
. Suppose that the nodes
 $\unicode[STIX]{x1D6FA}_{h}^{I}$
are translation-invariant, and let
 $u_{h}\in X_{h}^{fd}$
be the solution of (6.9). If
 $\unicode[STIX]{x1D706}I\leq D^{2}u\leq \unicode[STIX]{x1D6EC}I$
and
 $u\in C^{2,\unicode[STIX]{x1D6FC}}(\unicode[STIX]{x1D6FA}),$
then
 $$\begin{eqnarray}\Vert u-\unicode[STIX]{x1D6E4}(u_{h})\Vert _{L^{\infty }(\unicode[STIX]{x1D6FA})}\leq Ch^{\unicode[STIX]{x1D6FC}},\end{eqnarray}$$
where the constant
 $$\begin{eqnarray}C=C(d,\unicode[STIX]{x1D6FA},\unicode[STIX]{x1D706},\unicode[STIX]{x1D6EC})(|u|_{C^{2,\unicode[STIX]{x1D6FC}}(\bar{\unicode[STIX]{x1D6FA}})}+|u|_{C^{1,1}(\bar{\unicode[STIX]{x1D6FA}})}).\end{eqnarray}$$
Proof. We begin by constructing a piecewise linear approximation of
 $u$
. Recall that
 $\unicode[STIX]{x1D6E4}(I_{h}^{fd}u)$
, the convex envelope of the nodal function
 $I_{h}^{fd}u$
, is a piecewise linear function over a mesh that has
 $\bar{\unicode[STIX]{x1D6FA}}_{h}$
as nodes. Thus, classic interpolation theory yields
 $$\begin{eqnarray}\Vert \unicode[STIX]{x1D6E4}(I_{h}^{fd}u)-u\Vert _{L^{\infty }(\unicode[STIX]{x1D6FA})}\leq Ch^{2}|u|_{C^{1,1}(\bar{\unicode[STIX]{x1D6FA}})}.\end{eqnarray}$$
Therefore, we only need to prove that
 $$\begin{eqnarray}\sup _{\bar{\unicode[STIX]{x1D6FA}}_{h}}(I_{h}^{fd}u-u_{h})^{-}\leq Ch^{\unicode[STIX]{x1D6FC}}.\end{eqnarray}$$
A similar inequality, which controls the positive part of
 $I_{h}^{fd}u-u_{h}$
, can be derived in an analogous fashion.
Step 1. We first show that for all
 $z\in \bar{\unicode[STIX]{x1D6FA}}_{h}$
such that
 $\text{dist}(z,\unicode[STIX]{x2202}\unicode[STIX]{x1D6FA})\leq \bar{R}h$
,
 $$\begin{eqnarray}(I_{h}^{fd}u-u_{h})(z)\geq -Ch|u|_{C^{1,1}(\bar{\unicode[STIX]{x1D6FA}})}.\end{eqnarray}$$
Let
 $p_{z}$
be the discrete barrier defined in Lemma 6.34 with free parameter
 $M$
and consider the function
 $u_{h}+p_{z}$
. Since Lemma 3.21 (addition inequality) implies
 $$\begin{eqnarray}\unicode[STIX]{x2202}u_{h}(z_{i})+\unicode[STIX]{x2202}p_{z}(z_{i})\subset \unicode[STIX]{x2202}(u_{h}+p_{z})(z_{i}),\end{eqnarray}$$
by Proposition 6.28 (Brunn–Minkowski inequality), we obtain
 $$\begin{eqnarray}|\unicode[STIX]{x2202}(u_{h}+p_{z})(z_{i})|\geq (|\unicode[STIX]{x2202}u_{h}(z_{i})|^{1/d}+|\unicode[STIX]{x2202}p_{z}(z_{i})|^{1/d})^{d}.\end{eqnarray}$$
Therefore, by Lemmas 6.33 and 6.34, we have
 $$\begin{eqnarray}\displaystyle |\unicode[STIX]{x2202}(u_{h}+p_{z})(z_{i})| & \geq & \displaystyle \biggl(\biggl(\int _{\unicode[STIX]{x1D714}_{z_{i}}}\det (D^{2}u)\biggr)^{1/d}+(M|\unicode[STIX]{x1D714}_{z}|)^{1/d}\biggr)^{d}\nonumber\\ \displaystyle & \geq & \displaystyle |\unicode[STIX]{x2202}I_{h}^{fd}u(z_{i})|,\quad \text{for all}~z_{i}\in \unicode[STIX]{x1D6FA}_{h}^{I}\nonumber\end{eqnarray}$$
provided that
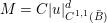 $M=C|u|_{C^{1,1}(\bar{B})}^{d}$
Since
 $p_{z}\leq 0$
on
 $\unicode[STIX]{x1D6FA}_{h}^{B}$
, we have
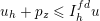 $u_{h}+p_{z}\leq I_{h}^{fd}u$
on
 $\unicode[STIX]{x1D6FA}_{h}^{B}$
. Moreover, because
 $|\unicode[STIX]{x2202}(u_{h}+p_{z})(z_{i})|\geq |\unicode[STIX]{x2202}I_{h}^{fd}u(z_{i})|$
for all
 $z_{i}\in \unicode[STIX]{x1D6FA}_{h}^{I}$
, we have, by the maximum principle of Corollary 6.31,
 $$\begin{eqnarray}u_{h}(z_{i})+p_{z}(z_{i})\leq I_{h}^{fd}u(z_{i}),\quad \text{for all}~z_{i}\in \bar{\unicode[STIX]{x1D6FA}}_{h}.\end{eqnarray}$$
The estimate on the discrete barrier function, given in Lemma 6.34, yields
 $$\begin{eqnarray}u_{h}(z)-Ch|u|_{C^{1,1}(\bar{\unicode[STIX]{x1D6FA}})}\leq u_{h}(z)+p_{z}(z)\leq I_{h}^{fd}u(z),\end{eqnarray}$$
thus proving (6.21).
Step 2. For all nodes
 $z$
with
 $\text{dist}(z,\unicode[STIX]{x2202}\unicode[STIX]{x1D6FA})\geq \bar{R}h$
, thanks to the consistency of the method, Lemma 6.32, we have
 $$\begin{eqnarray}||\unicode[STIX]{x2202}I_{h}^{fd}u(z)|-|\unicode[STIX]{x2202}u_{h}(z)||\leq Ch^{\unicode[STIX]{x1D6FC}}|u|_{C^{2,\unicode[STIX]{x1D6FC}}(\bar{\unicode[STIX]{x1D6FA}})}|\unicode[STIX]{x1D714}_{z}|.\end{eqnarray}$$
We apply the stability result of Proposition 6.30 on a smaller domain,
 $$\begin{eqnarray}\bar{\unicode[STIX]{x1D6FA}}_{\ast ,h}=\{z\in \unicode[STIX]{x1D6FA}_{h}^{I}:\text{dist}(z,\unicode[STIX]{x2202}\unicode[STIX]{x1D6FA})\geq \bar{R}h\},\end{eqnarray}$$
and on the nodal functions
 $I_{h}^{fd}u$
and
 $u_{h}-Ch|u|_{C^{1,1}(\bar{\unicode[STIX]{x1D6FA}})}$
, where
 $C$
is the constant in (6.21) so that
 $I_{h}^{fd}u\geq u_{h}-Ch|u|_{C^{1,1}(\bar{\unicode[STIX]{x1D6FA}})}$
on the boundary nodes of
 $\bar{\unicode[STIX]{x1D6FA}}_{\ast ,h}$
. Letting
 ${\mathcal{C}}_{h,\ast }^{-}$
denote the contact set of
 $I_{h}^{fd}u-(u_{h}-Ch|u|_{C^{1,1}(\bar{\unicode[STIX]{x1D6FA}})})$
with respect to
 $\bar{\unicode[STIX]{x1D6FA}}_{h,\ast }$
, we get
 $$\begin{eqnarray}\displaystyle & & \displaystyle \sup _{\bar{\unicode[STIX]{x1D6FA}}_{\ast ,h}}(I_{h}^{fd}u-(u_{h}-Ch|u|_{C^{1,1}(\bar{\unicode[STIX]{x1D6FA}})}))^{-}\nonumber\\ \displaystyle & & \displaystyle \qquad \leq C\biggl(\mathop{\sum }_{z\in {\mathcal{C}}_{h,\ast }^{-}}(|\unicode[STIX]{x2202}I_{h}^{fd}u(z)|^{1/d}-|\unicode[STIX]{x2202}u_{h}(z)|^{1/d})^{d}\biggr)^{1/d}.\end{eqnarray}$$
Note now that
 $t\rightarrow t^{1/d}$
is a concave function and therefore
 $$\begin{eqnarray}(t+\unicode[STIX]{x1D6FF})^{1/d}\leq t^{1/d}+\displaystyle \frac{1}{d}t^{(1-d)/d}\unicode[STIX]{x1D6FF}.\end{eqnarray}$$
Thus, by setting
 $t=|\unicode[STIX]{x2202}u_{h}(z)|$
,
 $\unicode[STIX]{x1D6FF}=|\unicode[STIX]{x2202}I_{h}^{fd}u(z)|-|\unicode[STIX]{x2202}u_{h}(z)|$
and applying (6.23), we find
 $$\begin{eqnarray}\displaystyle |\unicode[STIX]{x2202}I_{h}^{fd}u(z)|^{1/d}-|\unicode[STIX]{x2202}u_{h}(z)|^{1/d} & & \displaystyle \leq \displaystyle \frac{1}{d}|\unicode[STIX]{x2202}u_{h}(z)|^{(1-d)/d}(|\unicode[STIX]{x2202}u_{h}(z)|-|\unicode[STIX]{x2202}I_{h}^{fd}u(z)|)\nonumber\\ \displaystyle & & \displaystyle \leq Ch^{\unicode[STIX]{x1D6FC}}|u|_{C^{2,\unicode[STIX]{x1D6FC}}(\bar{\unicode[STIX]{x1D6FA}})}|\unicode[STIX]{x1D714}_{z}|\biggl(\int _{\unicode[STIX]{x1D714}_{z}}f\biggr)^{(1-d)/d}\nonumber\\ \displaystyle & & \displaystyle \leq Ch^{\unicode[STIX]{x1D6FC}}|u|_{C^{2,\unicode[STIX]{x1D6FC}}(\bar{\unicode[STIX]{x1D6FA}})}|\unicode[STIX]{x1D714}_{z}|^{1/d}\nonumber\end{eqnarray}$$
because
 $f\geq \unicode[STIX]{x1D706}^{d}>0$
. Inserting this estimate into (6.25) yields
 $$\begin{eqnarray}\displaystyle \sup _{\bar{\unicode[STIX]{x1D6FA}}_{h,\ast }}(I_{h}^{fd}u-(u_{h}-Ch|u|_{C^{1,1}(\bar{\unicode[STIX]{x1D6FA}})}))^{-} & \leq & \displaystyle Ch^{\unicode[STIX]{x1D6FC}}|u|_{C^{2,\unicode[STIX]{x1D6FC}}(\bar{\unicode[STIX]{x1D6FA}})}\biggl(\mathop{\sum }_{z\in {\mathcal{C}}_{h,\ast }^{-}}|\unicode[STIX]{x1D714}_{z}|\biggr)^{1/d}\nonumber\\ \displaystyle & \leq & \displaystyle Ch^{\unicode[STIX]{x1D6FC}}|u|_{C^{2,\unicode[STIX]{x1D6FC}}(\bar{\unicode[STIX]{x1D6FA}})}|\unicode[STIX]{x1D6FA}|^{1/d},\nonumber\end{eqnarray}$$
or equivalently
 $$\begin{eqnarray}\sup _{\bar{\unicode[STIX]{x1D6FA}}_{h,\ast }}(I_{h}^{fd}u-u_{h})^{-}\leq Ch|u|_{C^{1,1}(\bar{\unicode[STIX]{x1D6FA}})}+Ch^{\unicode[STIX]{x1D6FC}}|u|_{C^{2,\unicode[STIX]{x1D6FC}}(\bar{\unicode[STIX]{x1D6FA}})}.\end{eqnarray}$$
This inequality, together with (6.22), proves the lower bound for
 $I_{h}^{fd}u-u_{h}$
. The upper bound can be proved in a similar fashion.
Note that Proposition 6.30 controls the
 $L^{\infty }$
-error by the
 $L^{d}$
-norm of the consistency error. Thus, if large consistency errors occur only in regions with small measure, we may still derive a rate of convergence. This observation may be used for solutions that are not
 $C^{2}(\unicode[STIX]{x1D6FA})$
-regular.
To state the result, we first introduce the Minkowski–Bouligand dimension. Let
 $U$
be a subset of
 $\unicode[STIX]{x1D6FA}$
. Let
 $\{\unicode[STIX]{x1D714}_{i}\}_{z_{i}\in \unicode[STIX]{x1D6FA}_{h}^{I}}$
be a translation-invariant partition covering
 $\unicode[STIX]{x1D6FA}$
where
 $\unicode[STIX]{x1D714}_{i}$
is as in (6.10). Define
 $m=m(h)$
to be the number of elements of
 $\{\unicode[STIX]{x1D714}_{z_{i}}\}$
required to cover
 $U$
. We define the (Minkowski–Bouligand) dimension of
 $U$
as
 $$\begin{eqnarray}\dim U=-\lim _{h\rightarrow 0}\displaystyle \frac{\log m(h)}{\log h}.\end{eqnarray}$$
For example, it is easy to check that
 $\unicode[STIX]{x2202}B_{1}$
, the discontinuity set of
 $D^{2}u$
in Example 6.5, is of dimension one. Note that in this example the solution
 $u\in C^{1,1}(\bar{\unicode[STIX]{x1D6FA}})\setminus C^{2}(\bar{\unicode[STIX]{x1D6FA}})$
.
The next result addresses the rate of convergence for piecewise smooth solutions such that the discontinuity set of
 $D^{2}u$
is of low dimension.
Theorem 6.36 (rate of convergence II).
Let
 $u\in C^{1,1}(\bar{\unicode[STIX]{x1D6FA}})$
be strictly convex with
 $\unicode[STIX]{x1D706}I\leq D^{2}u\leq \unicode[STIX]{x1D6EC}I$
, and solve (6.1). Assume that
 $D^{2}u$
is piecewise Hölder-continuous (with exponent
 $\unicode[STIX]{x1D6FC}>0$
) and its discontinuity set
 $U$
has dimension
 $n<d$
. Let
 $u_{h}$
be the solution of (6.9), over a lattice
 $\unicode[STIX]{x1D6FA}_{h}^{I}$
of translation-invariant nodes. Then
 $$\begin{eqnarray}\Vert \,u-\unicode[STIX]{x1D6E4}(u_{h})\,\Vert _{L^{\infty }(\unicode[STIX]{x1D6FA})}\leq Ch^{\unicode[STIX]{x1D6FC}}|u|_{C^{2,\unicode[STIX]{x1D6FC}}(\bar{\unicode[STIX]{x1D6FA}}\setminus U)}+Ch^{(d-n)/d}|u|_{C^{1,1}(\bar{\unicode[STIX]{x1D6FA}})}.\end{eqnarray}$$
Proof. Following the estimate of Theorem 6.35, we first note that for
 $z\in \bar{\unicode[STIX]{x1D6FA}}_{h}$
with
 $\text{dist}(z,\unicode[STIX]{x2202}\unicode[STIX]{x1D6FA})\leq \bar{R}h$
,
 $$\begin{eqnarray}|(u_{h}-I_{h}^{fd}u)(z)|\leq Ch.\end{eqnarray}$$
Since
 $D^{2}u$
is Hölder-continuous except on the set
 $U$
and the aspect ratio
 $\unicode[STIX]{x1D6EC}/\unicode[STIX]{x1D706}$
of
 $D^{2}u$
is bounded, by Lemmas 6.32 and 6.33 we have that
 $$\begin{eqnarray}|\unicode[STIX]{x2202}I_{h}^{fd}u(z)|\leq \left\{\begin{array}{@{}ll@{}}\int _{\unicode[STIX]{x1D714}_{z}}\det D^{2}u+Ch^{\unicode[STIX]{x1D6FC}}|\unicode[STIX]{x1D714}_{z}|\,|u|_{C^{2,\unicode[STIX]{x1D6FC}}(\bar{\unicode[STIX]{x1D6FA}}\setminus U)}\quad & z\in \bar{\unicode[STIX]{x1D6FA}}_{h,\ast }\setminus U_{\bar{R}h},\\ \int _{\unicode[STIX]{x1D714}_{z}}\det D^{2}u+C|\unicode[STIX]{x1D714}_{z}|\,|u|_{C^{1,1}(\bar{\unicode[STIX]{x1D6FA}})}\quad & z\in U_{\bar{R}h},\end{array}\right.\end{eqnarray}$$
where
 $\bar{\unicode[STIX]{x1D6FA}}_{h,\ast }$
is given by (6.24) and
 $$\begin{eqnarray}U_{\bar{R}h}=\{z\in \bar{\unicode[STIX]{x1D6FA}}_{h,\ast }:\text{dist}(z,U)\leq \bar{R}h\}.\end{eqnarray}$$
Now, the stability estimate of Proposition 6.30 yields
 $$\begin{eqnarray}\displaystyle & & \displaystyle \sup _{\bar{\unicode[STIX]{x1D6FA}}_{h,\ast }}(I_{h}^{fd}u-(u_{h}-Ch|u|_{C^{1,1}(\bar{\unicode[STIX]{x1D6FA}})}))^{-}\nonumber\\ \displaystyle & & \displaystyle \qquad \leq C\biggl(\mathop{\sum }_{z\in {\mathcal{C}}_{h,\ast }^{-}}(|\unicode[STIX]{x2202}I_{h}^{fd}u(z)|^{1/d}-|\unicode[STIX]{x2202}u_{h}(z)|^{1/d})^{d}\biggr)^{1/d},\end{eqnarray}$$
where
 $C>0$
is the constant in (6.26).
For
 $z\in \bar{\unicode[STIX]{x1D6FA}}_{h,\ast }\setminus U_{\bar{R}h}$
, we apply the same arguments as in the proof of Theorem 6.35, to get
 $$\begin{eqnarray}|\unicode[STIX]{x2202}I_{h}^{fd}u(z)|^{1/d}-|\unicode[STIX]{x2202}u_{h}(z)|^{1/d}\leq Ch^{\unicode[STIX]{x1D6FC}}|u|_{C^{2,\unicode[STIX]{x1D6FC}}(\bar{\unicode[STIX]{x1D6FA}}\setminus U)}|\unicode[STIX]{x1D714}_{z}|^{1/d}.\end{eqnarray}$$
For
 $z\in U_{\bar{R}h}$
similar arguments (essentially take
 $\unicode[STIX]{x1D6FC}=0$
) yield
 $$\begin{eqnarray}|\unicode[STIX]{x2202}I_{h}^{fd}u(z)|^{1/d}-|\unicode[STIX]{x2202}u_{h}(z)|^{1/d}\leq C|u|_{C^{1,1}(\bar{\unicode[STIX]{x1D6FA}})}|\unicode[STIX]{x1D714}_{z}|^{1/d}.\end{eqnarray}$$
Inserting these estimates into (6.27), we deduce that
 $$\begin{eqnarray}\displaystyle \sup _{\bar{\unicode[STIX]{x1D6FA}}_{h,\ast }}(I_{h}^{fd}u-u_{h})^{-} & \leq & \displaystyle C\biggl(h^{\unicode[STIX]{x1D6FC}d}|u|_{C^{2,\unicode[STIX]{x1D6FC}}(\bar{\unicode[STIX]{x1D6FA}}\setminus U)}^{d}|\unicode[STIX]{x1D6FA}|+|u|_{C^{1,1}(\bar{\unicode[STIX]{x1D6FA}})}^{d}\mathop{\sum }_{z\in U_{\bar{R}h}}|\unicode[STIX]{x1D714}_{z}|\biggr)^{1/d}\nonumber\\ \displaystyle & \leq & \displaystyle Ch^{\unicode[STIX]{x1D6FC}}|u|_{C^{2,\unicode[STIX]{x1D6FC}}(\bar{\unicode[STIX]{x1D6FA}}\setminus U)}+C|u|_{C^{1,1}(\bar{\unicode[STIX]{x1D6FA}})}\biggl(\mathop{\sum }_{z\in U_{\bar{R}h}}|\unicode[STIX]{x1D714}_{z}|\biggr)^{1/d}.\nonumber\end{eqnarray}$$
Since
 $\dim U=n<d$
, we have
 $$\begin{eqnarray}\mathop{\sum }_{z\in U_{\bar{R}h}}|\unicode[STIX]{x1D714}_{z}|=N|\unicode[STIX]{x1D714}_{z}|\leq CNh^{d}\end{eqnarray}$$
with
 $N\leq Ch^{-n}$
. Thus, we conclude that
 $$\begin{eqnarray}\sup _{\bar{\unicode[STIX]{x1D6FA}}_{h,\ast }}(I_{h}^{fd}u-u_{h})^{-}\leq C(h^{\unicode[STIX]{x1D6FC}}|u|_{C^{2,\unicode[STIX]{x1D6FC}}(\bar{\unicode[STIX]{x1D6FA}}\setminus U)}+h^{(d-n)/d}|u|_{C^{1,1}(\bar{\unicode[STIX]{x1D6FA}})}).\end{eqnarray}$$
This completes the proof.
Remark 6.37 (extensions).
The developments of this section have found the following extensions.
-
(i) Nochetto et al. (Reference Nochetto, Ntogakas and Zhang2017) have recently applied the error analysis developed for method (6.9) to the wide-stencil schemes by Oberman (Reference Oberman2008) and Froese and Oberman (Reference Froese and Oberman2011).
-
(ii) The error estimate stated in Theorems 6.35 and 6.36 applies only to structured nodes (lattices). It remains an open problem how to extend the analysis to unstructured nodes and to the degenerate case, that is, when
$f=0$
in some region. -
(iii) The error analysis of monotone schemes for the Monge–Ampère equation in other norms, such as the
$H^{1}$
-norm, remains an open problem.


7 Discretizations of non-convex second-order elliptic equations
This section is a continuation of the developments of Section 5, where we apply the discretizations and results for uniformly elliptic linear PDEs to fully nonlinear problems. However, in contrast to Section 5, we shall not assume convexity (or concavity) of the differential operator, but rather, only assume it is uniformly elliptic. As explained in Section 1.3, it suffices to consider numerical approximations of the Isaacs equation given in Example 2.13. For simplicity and to communicate the essential points in the discussion, we shall assume that the nonlinear problem does not have lower-order terms, and in addition has homogeneous Dirichlet boundary conditions. Thus we consider numerical approximations for the problem
 $$\begin{eqnarray}\left\{\begin{array}{@{}ll@{}}F(x,D^{2}u):=\inf _{\unicode[STIX]{x1D6FD}\in {\mathcal{B}}}\sup _{\unicode[STIX]{x1D6FC}\in {\mathcal{A}}}[{\mathcal{L}}^{\unicode[STIX]{x1D6FC},\unicode[STIX]{x1D6FD}}u(x)-f^{\unicode[STIX]{x1D6FC},\unicode[STIX]{x1D6FD}}(x)]=0\quad & \text{in }\unicode[STIX]{x1D6FA},\\ u=0\quad & \text{on }\unicode[STIX]{x2202}\unicode[STIX]{x1D6FA},\end{array}\right.\end{eqnarray}$$
with
 ${\mathcal{L}}^{\unicode[STIX]{x1D6FC},\unicode[STIX]{x1D6FD}}u(x)=A^{\unicode[STIX]{x1D6FC},\unicode[STIX]{x1D6FD}}(x):D^{2}u(x)$
, and the coefficient matrices satisfy
 $$\begin{eqnarray}\unicode[STIX]{x1D706}I\leq A^{\unicode[STIX]{x1D6FC},\unicode[STIX]{x1D6FD}}\leq \unicode[STIX]{x1D6EC}I,\quad \text{for all}~\unicode[STIX]{x1D6FC}\in {\mathcal{A}},~\unicode[STIX]{x1D6FD}\in {\mathcal{B}},\end{eqnarray}$$
so that
 $F$
is uniformly elliptic. We assume that for each
 $x\in \unicode[STIX]{x1D6FA}$
, the mapping
 $M\mapsto F(x,M)$
is continuous and locally Lipschitz-continuous on
 $\mathbb{S}^{d}$
, and that
 $f^{\unicode[STIX]{x1D6FC},\unicode[STIX]{x1D6FD}}\in C(\bar{\unicode[STIX]{x1D6FA}})$
for each
 $\unicode[STIX]{x1D6FC}\in {\mathcal{A}}$
and
 $\unicode[STIX]{x1D6FD}\in {\mathcal{B}}$
. Further assumptions may be made in subsequent developments.
As in the convex case, we can roughly classify numerical schemes as finite difference, finite element and semi-Lagrangian methods. The construction and analysis of finite difference schemes as detailed in Section 7.1, in principle, follow the convex case of Section 5 and the Barles–Souganidis theory as presented in Theorems 3.7 and 3.8, but are clouded by numerous technicalities that have for many years prevented researchers from obtaining rates of convergence. In fact – as described in the introduction of Kuo and Trudinger (Reference Kuo and Trudinger1992) – this was considered an important unsolved open problem for several years.
The heart of the issue can be captured by examining the proof of Theorem 5.3. An important step there is the construction of a smooth subsolution to the equation (scheme) which, in the convex case, can be obtained by mollification of a subsolution to a perturbed equation. Convexity of the operator allows us to claim that this is a subsolution to the original problem and can thus be used to carry out the programme detailed at the beginning of Section 5.1. However, without convexity, it is not clear how to construct a smooth approximation to the solution of (7.1), which can be used to invoke the consistency of the scheme. This is particularly important in the non-convex case since, as shown in Example 2.70, one cannot assume smoothness of the solution to (7.1).
For many years, all of the available results were rather specialized. For instance, Jakobsen (Reference Jakobsen2004) considers a one-dimensional problem and clearly shows that the arguments do not extend to more dimensions. A particular case of an Isaacs equation – an obstacle problem for an HJB equation – is discussed in Jakobsen (Reference Jakobsen2006), where this special structure is exploited.
The derivation of rates of convergence for general schemes remained an unsolved problem until Caffarelli and Souganidis (Reference Caffarelli and Souganidis2008) showed how to obtain a rate of convergence, within the Barles–Souganidis framework, for approximations of (7.1) in the case that, for all
 $\unicode[STIX]{x1D6FC}\in {\mathcal{A}}$
and
 $\unicode[STIX]{x1D6FD}\in {\mathcal{B}}$
, the matrices
 $A^{\unicode[STIX]{x1D6FC},\unicode[STIX]{x1D6FD}}$
do not depend on
 $x$
. We detail these results in Section 7.2, where we also comment on extensions and variations to these estimates. Simply put, the estimates assert that there exists an algebraic rate of convergence. An explicit rate, however, is not available at the moment.
Quite recently, Salgado and Zhang (Reference Salgado and Zhang2016) have extended the results of the finite element method in Section 4.3 to the case of (7.1), and obtained an algebraic rate of convergence which, as in the finite difference case, is not explicit. These developments are detailed in Section 7.3.
We also comment that, as of the time of writing, no rates of convergence are available for semi-Lagrangian schemes. The only known result is convergence, as obtained by Debrabant and Jakobsen (Reference Debrabant and Jakobsen2013).
We conclude our discussion on non-convex equations in Section 7.4 by describing how to solve the nonlinear system of equations that results after discretization, by any of the schemes discussed before.
7.1 Finite difference methods
Here, following the framework given in Section 3.2 and in Kuo and Trudinger (Reference Kuo and Trudinger1992), we construct finite difference approximations to the fully nonlinear problem (7.1), and study the stability and convergence of these discretizations. We consider the following problem: find
 $u_{h}\in X_{h}^{fd}$
satisfying
 $$\begin{eqnarray}\left\{\begin{array}{@{}ll@{}}F_{h}[u_{h}]=0\quad & \text{in }\unicode[STIX]{x1D6FA}_{h}^{I},\\ u_{h}=0\quad & \text{on }\unicode[STIX]{x1D6FA}_{h}^{B},\end{array}\right.\end{eqnarray}$$
where the interior and boundary nodes are as in Definition 3.14. We assume that
 $F_{h}$
is consistent and that the scheme is of the form
 $F_{h}[u_{h}](z)={\mathcal{F}}_{h}(z,\unicode[STIX]{x1D6FF}_{h}^{2}u_{h}(z))$
with
 $\unicode[STIX]{x1D6FF}_{h}^{2}u_{h}(z)=\{\unicode[STIX]{x1D6FF}_{y,h}^{2}u_{h}(z):y\in S\}$
. We further assume that
 ${\mathcal{F}}_{h}$
is of positive type in the sense of Definition 3.12, so that
 $F_{h}$
is monotone, and that
 $$\begin{eqnarray}\displaystyle \frac{\unicode[STIX]{x2202}{\mathcal{F}}_{h}}{\unicode[STIX]{x2202}s_{y}}\leq \unicode[STIX]{x1D6EC}_{0},\end{eqnarray}$$
for some
 $\unicode[STIX]{x1D6EC}_{0}>0$
. For example, schemes that satisfy these properties, and the ones that we have in mind, are
 $$\begin{eqnarray}F_{h}[u_{h}]=\inf _{\unicode[STIX]{x1D6FD}\in {\mathcal{B}}}\sup _{\unicode[STIX]{x1D6FC}\in {\mathcal{A}}}({\mathcal{L}}_{h}^{\unicode[STIX]{x1D6FC},\unicode[STIX]{x1D6FD}}u_{h}-f^{\unicode[STIX]{x1D6FC},\unicode[STIX]{x1D6FD}}),\end{eqnarray}$$
where each (linear) discrete operator is given by
 $$\begin{eqnarray}{\mathcal{L}}_{h}^{\unicode[STIX]{x1D6FC},\unicode[STIX]{x1D6FD}}u_{h}(z)=\mathop{\sum }_{y\in S}a_{y}^{\unicode[STIX]{x1D6FC},\unicode[STIX]{x1D6FD}}(z)\unicode[STIX]{x1D6FF}_{y,h}^{2}u_{h}(z),\end{eqnarray}$$
and is of positive type and consistent with
 ${\mathcal{L}}^{\unicode[STIX]{x1D6FC},\unicode[STIX]{x1D6FD}}$
; Section 3.4 describes how to construct linear operators with these properties.
Before discussing the solvability of the finite difference scheme (7.2), let us show first that solutions to the scheme are uniformly bounded. Let
 $v_{h},w_{h}$
be two grid functions, and consider the linearization
 $$\begin{eqnarray}\displaystyle F_{h}[v_{h}](z)-F_{h}[w_{h}](z) & = & \displaystyle {\mathcal{L}}_{h}(v_{h}-w_{h})(z)\nonumber\\ \displaystyle & := & \displaystyle \mathop{\sum }_{y\in S}a_{y}(z)\unicode[STIX]{x1D6FF}_{y,h}^{2}(v_{h}-w_{h})(z),\end{eqnarray}$$
with
 $$\begin{eqnarray}a_{y}(z)=\int _{0}^{1}\displaystyle \frac{\unicode[STIX]{x2202}{\mathcal{F}}_{h}}{\unicode[STIX]{x2202}s_{y}}(z,\unicode[STIX]{x1D6FF}_{h,y}^{2}q_{t}(z))\text{d}t,\quad q_{t}=tv_{h}+(1-t)w_{h}.\end{eqnarray}$$
In particular, if we set
 $v_{h}=u_{h}$
,
 $w_{h}=0$
, and
 $f=-F(x,0)$
, then the solution to (7.2) satisfies
 $$\begin{eqnarray}{\mathcal{L}}_{h,u_{h}}u_{h}=f\quad \text{in }\unicode[STIX]{x1D6FA}_{h}^{I},\end{eqnarray}$$
where the coefficients in the operator
 ${\mathcal{L}}_{h,u_{h}}$
depend on
 $u_{h}$
. Since
 ${\mathcal{L}}_{h,u_{h}}$
is a positive operator, Theorem 3.25 yields the follow stability result.
Theorem 7.1 (uniqueness and stability).
In this setting, solutions to (7.2) are unique, and satisfy
 $$\begin{eqnarray}\Vert u_{h}\Vert _{L^{\infty }(\bar{\unicode[STIX]{x1D6FA}}_{h})}\leq C\biggl(\mathop{\sum }_{z\in \unicode[STIX]{x1D6FA}_{h}^{I}}h^{d}|f(z)|^{d}\biggr)^{1/d}\leq C.\end{eqnarray}$$
In addition to uniqueness and stability, these a priori estimates also imply the existence of solutions.
Theorem 7.2 (existence).
Under these conditions, problem (7.2) has a unique solution.
Proof. Consider the map
 $Q_{h}:X_{h}^{fd}\rightarrow X_{h}^{fd}$
satisfying
 $$\begin{eqnarray}\left\{\begin{array}{@{}ll@{}}{\mathcal{L}}_{h,v_{h}}Q_{h}(v_{h})=f\quad & \text{in }\unicode[STIX]{x1D6FA}_{h}^{I},\\ v_{h}=0\quad & \text{on }\unicode[STIX]{x1D6FA}_{h}^{B}.\end{array}\right.\end{eqnarray}$$
Theorem 3.25 ensures that
 $Q_{h}$
is well-defined and that
 $\Vert Q_{h}(v_{h})\Vert _{L^{\infty }(\bar{\unicode[STIX]{x1D6FA}}_{h})}\leq C$
. Brouwer’s fixed-point theorem shows that
 $Q_{h}$
has a fixed point
 $u_{h}\in X_{h}^{fd}$
, which is a solution to (7.4), and hence (7.2).
Remark 7.3 (other proofs).
Other (constructive) proofs of existence of solutions can be found in Kuo and Trudinger (Reference Kuo and Trudinger1992, Section 4) and in Section 7.4.
Finally we apply Theorem 3.30 to deduce that solutions to (7.2) are Hölder-continuous.
Proposition 7.4 (discrete Hölder continuity).
Suppose that
 $u_{h}\in X_{h}^{fd}$
solves (7.2). Then there exists
 $\unicode[STIX]{x1D702}\in (0,1)$
and
 $C>0$
depending on the data, such that, for
 $z_{1},z_{2}\in \bar{\unicode[STIX]{x1D6FA}}_{h}$
,
 $$\begin{eqnarray}|u_{h}(z_{1})-u_{h}(z_{2})|\leq C|z_{1}-z_{2}|^{\unicode[STIX]{x1D702}}.\end{eqnarray}$$
Proposition 7.4 implies that the sequence of solutions
 $\{u_{h}\}_{h>0}$
is equicontinuous. Thus, applying Theorem 3.8 we obtain convergence to the viscosity solution.

7.2 Rates of convergence for finite difference schemes with constant coefficients
Here we summarize the results regarding rates of convergence of finite difference schemes for fully nonlinear, non-convex PDEs, as originally shown by Caffarelli and Souganidis (Reference Caffarelli and Souganidis2008). As a starting point, we focus on the case where the operator in (7.1) is such that, for every
 $\unicode[STIX]{x1D6FC}\in {\mathcal{A}}$
and
 $\unicode[STIX]{x1D6FD}\in {\mathcal{B}}$
, the matrices
 $A^{\unicode[STIX]{x1D6FC},\unicode[STIX]{x1D6FD}}$
are independent of
 $x$
, and, moreover, we have
 $f^{\unicode[STIX]{x1D6FC},\unicode[STIX]{x1D6FD}}=f\in C^{0,1}(\unicode[STIX]{x1D6FA})$
. Under these conditions, problem (7.1) satisfies a comparison principle (see Theorem 2.52), and there exists a unique viscosity solution with regularity
 $u\in C^{1,s}(\bar{\unicode[STIX]{x1D6FA}})$
for some universal constant
 $s>0$
; see Theorem 2.71.
In order to derive rates, we shall, with an abuse of notation, extend the domain of
 $F_{h}$
to continuous functions and to all
 $$\begin{eqnarray}z\in \unicode[STIX]{x1D6FA}^{I}:=\{x\in \unicode[STIX]{x1D6FA}:\text{dist}\{x,\unicode[STIX]{x2202}\unicode[STIX]{x1D6FA}\}\geq mh\}\supset \unicode[STIX]{x1D6FA}_{h}^{I},\end{eqnarray}$$
where
 $m$
is the stencil size. We also assume, in this section, the following (strengthened) consistency criterion:
 $$\begin{eqnarray}|F(z,D^{2}\unicode[STIX]{x1D719}(z))-F_{h}[\unicode[STIX]{x1D719}](z)|\leq Ch\Vert D^{3}\unicode[STIX]{x1D719}\Vert _{L^{\infty }(\unicode[STIX]{x1D6FA})},\end{eqnarray}$$
for all smooth
 $\unicode[STIX]{x1D719}$
and
 $z\in \unicode[STIX]{x1D6FA}_{h}^{I}$
.
Now, as in the convex case, the key idea to obtain rates of convergence is to construct a smooth function
 $u_{\unicode[STIX]{x1D716}}$
that is a subsolution to (7.1) and then apply the consistency and monotonicity of the finite difference operator to get a one-sided bound of the error; see the proof of Theorem 5.3 for details. However, unlike the convex case, it is not immediate how to construct a sufficiently smooth subsolution to carry out this programme. For example, the standard mollification
 $u^{\unicode[STIX]{x1D716}}=u_{\unicode[STIX]{x1D716}}\star \unicode[STIX]{x1D70C}_{\unicode[STIX]{x1D716}}$
used in Theorem 5.3 is no longer a subsolution due to the lack of convexity of
 $F$
(and
 $F_{h}$
).
Instead, we employ the so-called sup- (inf-) convolutions of the viscosity solution
 $u$
.
Definition 7.6 (sup-convolution).
Let
 $u\in C(\bar{\unicode[STIX]{x1D6FA}})$
and
 $\unicode[STIX]{x1D70F}>0$
, The sup- (inf-) convolution
 $u_{\unicode[STIX]{x1D70F}}^{+}$
of
 $u$
is
 $$\begin{eqnarray}\displaystyle u_{\unicode[STIX]{x1D70F}}^{+}(x) & = & \displaystyle \sup _{y\in \bar{\unicode[STIX]{x1D6FA}}}\biggl[u(y)-\displaystyle \frac{1}{h^{\unicode[STIX]{x1D70F}}}|x-y|^{2}\biggr],\nonumber\\ \displaystyle u_{\unicode[STIX]{x1D70F}}^{-}(x) & = & \displaystyle \inf _{y\in \bar{\unicode[STIX]{x1D6FA}}}\biggl[u(y)+\displaystyle \frac{1}{h^{\unicode[STIX]{x1D70F}}}|x-y|^{2}\biggr].\nonumber\end{eqnarray}$$
Remark 7.7 (alternative definition).
Note that the definition we give here is tied to a mesh size
 $h$
. We do so because this is the scale that suits our needs. In general the literature defines the sup-convolution of a function by
 $$\begin{eqnarray}u_{\unicode[STIX]{x1D71A}}^{+}=\sup _{y\in \bar{\unicode[STIX]{x1D6FA}}}\biggl[u(y)-\displaystyle \frac{1}{2\unicode[STIX]{x1D71A}}|x-y|^{2}\biggr],\quad \unicode[STIX]{x1D71A}>0.\end{eqnarray}$$
The change of variables
 $\unicode[STIX]{x1D71A}={\textstyle \frac{1}{2}}h^{\unicode[STIX]{x1D70F}}$
shows the relation between these two. Similar reasoning can be used for the inf-convolution.
We show two examples of sup-convolution of functions to motivate the introduction of this useful concept.
Example 7.8 (sup-convolution I).
Let
 $u=|x|^{2}$
be defined in
 $\mathbb{R}^{d}$
and consider its sup-convolution
 $$\begin{eqnarray}u_{\unicode[STIX]{x1D70F}}^{+}(x)=\sup _{y\in \mathbb{R}^{d}}\biggl[|y|^{2}-\displaystyle \frac{1}{h^{\unicode[STIX]{x1D70F}}}|x-y|^{2}\biggr].\end{eqnarray}$$
Let
 $y_{\ast }=y_{\ast }(x)$
be a point where the supremum is attained. Then a simple calculation shows that
 $$\begin{eqnarray}2y_{\ast }+2h^{-\unicode[STIX]{x1D70F}}(x-y_{\ast })=0,\end{eqnarray}$$
which implies that
 $y_{\ast }=(1-h^{\unicode[STIX]{x1D70F}})^{-1}x$
. Inserting
 $y_{\ast }$
into the definition of
 $u_{\unicode[STIX]{x1D70F}}^{+}(x)$
, we obtain
 $$\begin{eqnarray}u_{\unicode[STIX]{x1D70F}}^{+}(x)=\biggl(\displaystyle \frac{1}{1-h^{\unicode[STIX]{x1D70F}}}\biggr)^{2}|x|^{2}-h^{-\unicode[STIX]{x1D70F}}\biggl(\displaystyle \frac{h^{\unicode[STIX]{x1D70F}}}{1-h^{\unicode[STIX]{x1D70F}}}\biggr)^{2}|x|^{2}=\displaystyle \frac{|x|^{2}}{(1-h^{\unicode[STIX]{x1D70F}})}.\end{eqnarray}$$
See Figure 7.1 and note that
 $D^{2}u_{\unicode[STIX]{x1D70F}}^{+}>D^{2}u$
.
Next, we consider a function that is less smooth.
Example 7.9 (sup-convolution II).
Let
 $u=-|x|$
be defined in
 $\mathbb{R}^{d}$
. The maximum is attained at
 $y_{\ast }=y_{\ast }(x)$
if and only if
 $$\begin{eqnarray}\mathbf{0}\in -\unicode[STIX]{x2202}|y_{\ast }|+2h^{-\unicode[STIX]{x1D70F}}(x-y_{\ast })\end{eqnarray}$$
or, equivalently,
 $$\begin{eqnarray}x\in y_{\ast }+\displaystyle \frac{h^{\unicode[STIX]{x1D70F}}}{2}\unicode[STIX]{x2202}|y_{\ast }|,\end{eqnarray}$$
where
 $\unicode[STIX]{x2202}|y_{\ast }|$
denotes the subdifferential of
 $|\cdot |$
at
 $y_{\ast }$
. We note that if
 $|x|\leq h^{\unicode[STIX]{x1D70F}}/2$
, then
 $y_{\ast }=\mathbf{0}$
because
 $\unicode[STIX]{x2202}|\mathbf{0}|=B_{1}(0)$
. Otherwise, we have
 $$\begin{eqnarray}x=y_{\ast }+\displaystyle \frac{h^{\unicode[STIX]{x1D70F}}y_{\ast }}{2|y_{\ast }|}\end{eqnarray}$$
because
 $\unicode[STIX]{x2202}|y_{\ast }|=\{y_{\ast }/|y_{\ast }|\}$
for
 $|y_{\ast }|>0$
. Therefore, we conclude that
 $$\begin{eqnarray}u_{\unicode[STIX]{x1D70F}}^{+}(x)=\left\{\begin{array}{@{}ll@{}}-h^{-\unicode[STIX]{x1D70F}}|x|^{2}\quad & |x|\leq \displaystyle \frac{h^{\unicode[STIX]{x1D70F}}}{2},\\ -|x|+\displaystyle \frac{h^{\unicode[STIX]{x1D70F}}}{4}\quad & \text{otherwise}.\end{array}\right.\end{eqnarray}$$
Note that
 $u_{\unicode[STIX]{x1D70F}}^{+}$
is
 $C^{1,1}$
, while
 $u$
is only Lipschitz. Moreover, near the singularity
 $x=0$
,
 $u_{\unicode[STIX]{x1D70F}}^{+}$
behaves like a paraboloid with
 $D^{2}u_{\unicode[STIX]{x1D70F}}^{+}=-2h^{-\unicode[STIX]{x1D70F}}I$
; see Figure 7.2.
Example 7.9 shows that, intuitively speaking, the sup-convolution
 $u_{\unicode[STIX]{x1D70F}}^{+}$
‘opens up’ the kinks of
 $u$
.
The graph of the function
 $u(x)=x^{2}$
(solid blue) and its sup-convolution (dashed red) with parameters
 $h=0.1$
and
 $\unicode[STIX]{x1D70F}=1$
.

The graph of the function
 $u(x)=-|x|$
(solid blue) and its sup-convolution (dashed red) with parameters
 $h=0.1$
and
 $\unicode[STIX]{x1D70F}=1$
.

Figures 7.1 and 7.2 illustrate some of the general properties of sup- and inf-convolutions. To state them concisely, we begin with a definition.
Definition 7.10 (opening
$t$
).

We say that
 $p\in \mathbb{P}_{2}$
is a paraboloid of opening
 $t$
if, for some
 $\ell \in \mathbb{P}_{1}$
, we have
 $$\begin{eqnarray}p(x)=\ell (x)\pm \displaystyle \frac{t}{2}|x|^{2}.\end{eqnarray}$$
The main properties of sup- and inf-convolutions are as follows. To simplify the presentation, we let
 $\bar{\unicode[STIX]{x2202}}u(x)$
denote the superdifferential of
 $u$
at the point
 $x$
, that is,
 $$\begin{eqnarray}\mathbf{v}\in \bar{\unicode[STIX]{x2202}}u(x)\Leftrightarrow -\mathbf{v}\in \unicode[STIX]{x2202}(-u)(x).\end{eqnarray}$$
Proposition 7.11 (properties of
$u_{\unicode[STIX]{x1D70F}}^{+}$
).

Let
 $u\in C^{0,1}(\bar{\unicode[STIX]{x1D6FA}})$
and, for
 $x\in \unicode[STIX]{x1D6FA}$
, let
 $y_{\ast }=y_{\ast }(x)$
denote the point where the supremum in the definition of
 $u_{\unicode[STIX]{x1D70F}}^{+}$
is attained. The following statements hold:
-
(i)
$x=y_{\ast }+{\textstyle \frac{1}{2}}h^{\unicode[STIX]{x1D70F}}\mathbf{v}$
for some vector
$\mathbf{v}\in \bar{\unicode[STIX]{x2202}}u(y_{\ast })$
and, therefore,
$|x-y_{\ast }|\leq Ch^{\unicode[STIX]{x1D70F}}$
, -
(ii)
$\Vert u-u_{\unicode[STIX]{x1D70F}}^{+}\Vert _{L^{\infty }(\unicode[STIX]{x1D6FA})}\leq Ch^{\unicode[STIX]{x1D70F}}$
, -
(iii) there exists a paraboloid of opening
$2h^{-\unicode[STIX]{x1D70F}}$
, that touches
$u_{\unicode[STIX]{x1D70F}}^{+}$
(resp.
$u_{\unicode[STIX]{x1D70F}}^{-}$
) from below (resp. above) at
$x$
, -
(iv) if
$u$
is the viscosity solution to (7.1), then
$|x_{1}-x_{2}|\leq C|y_{\ast }(x_{1})-y_{\ast }(x_{2})|$
.






Proof. Let us prove each statement separately.
(i)
For any fixed
 $x$
, if
 $u(y)-h^{-\unicode[STIX]{x1D70F}}|x-y|^{2}$
attains its maximum at
 $y_{\ast }$
, then
 $$\begin{eqnarray}\mathbf{0}\in \bar{\unicode[STIX]{x2202}}u(y_{\ast })-2h^{-\unicode[STIX]{x1D70F}}(x-y_{\ast }).\end{eqnarray}$$
Thus, we have
 $x=y_{\ast }+{\textstyle \frac{1}{2}}h^{\unicode[STIX]{x1D70F}}\mathbf{v}$
for some
 $\mathbf{v}\in \bar{\unicode[STIX]{x2202}}u(y_{\ast })$
.
(ii)
By definition
 $u_{\unicode[STIX]{x1D70F}}^{+}\geq u$
. Moreover, property (i) implies that
 $$\begin{eqnarray}0\leq u_{\unicode[STIX]{x1D70F}}^{+}(x)-u(x)=u(y_{\ast })-u(x)-h^{-\unicode[STIX]{x1D70F}}\biggl|\displaystyle \frac{1}{2}h^{\unicode[STIX]{x1D70F}}\mathbf{v}\biggr|^{2}\leq |u(x)-u(y_{\ast })|+\displaystyle \frac{1}{4}h^{\unicode[STIX]{x1D70F}}|\mathbf{v}|^{2}\end{eqnarray}$$
for some
 $\mathbf{v}\in \bar{\unicode[STIX]{x2202}}u(y_{\ast })$
. Since
 $u$
is Lipschitz-continuous, we conclude that, for every
 $x\in \unicode[STIX]{x1D6FA}$
,
 $$\begin{eqnarray}|u(x)-u_{\unicode[STIX]{x1D70F}}^{+}(x)|\leq Ch^{\unicode[STIX]{x1D70F}}.\end{eqnarray}$$
(iii)
Since, for any
 $x\in \unicode[STIX]{x1D6FA}$
,
 $y_{\ast }=y_{\ast }(x)$
is the point where the supremum is attained, let us define the paraboloid
 $$\begin{eqnarray}p(z)=u(y_{\ast })-\displaystyle \frac{1}{h^{\unicode[STIX]{x1D70F}}}|z-y_{\ast }|^{2},\end{eqnarray}$$
and note that
 $p(x)=u_{\unicode[STIX]{x1D70F}}^{+}(x)$
. Moreover,
 $$\begin{eqnarray}p(z)\leq \sup _{y\in \bar{\unicode[STIX]{x1D6FA}}}\biggl[u(y)-\displaystyle \frac{1}{h^{\unicode[STIX]{x1D70F}}}|z-y|^{2}\biggr]=:u_{\unicode[STIX]{x1D70F}}^{+}(z),\quad \text{for all}~z\in \bar{\unicode[STIX]{x1D6FA}}.\end{eqnarray}$$
Thus, the paraboloid
 $p$
touches the graph of
 $u_{\unicode[STIX]{x1D70F}}^{+}$
at point
 $x$
from below.
(iv) Since, by definition,
 $$\begin{eqnarray}u_{\unicode[STIX]{x1D70F}}^{+}(x)=u(y_{\ast }(x))-\displaystyle \frac{1}{h^{\unicode[STIX]{x1D70F}}}|x-y_{\ast }(x)|^{2},\end{eqnarray}$$
upon defining the paraboloid
 $$\begin{eqnarray}p(z)=u_{\unicode[STIX]{x1D70F}}^{+}(x)+\displaystyle \frac{1}{h^{\unicode[STIX]{x1D70F}}}|x-z|^{2}\end{eqnarray}$$
we have that
 $$\begin{eqnarray}p(y_{\ast }(x))=u(y_{\ast }(x)),\quad p(z)\geq u(z),\quad \text{for all}~z\in \bar{\unicode[STIX]{x1D6FA}}.\end{eqnarray}$$
In other words, at
 $y_{\ast }(x)$
, the function
 $u$
is touched from below by a paraboloid with opening
 $2h^{-\unicode[STIX]{x1D70F}}$
. On the other hand, since
 $u$
solves (7.1), the Harnack inequality of Theorem 2.63 implies that, at
 $y_{\ast }(x)$
, the function
 $u$
can be touched from above by a paraboloid of opening
 $Ch^{-\unicode[STIX]{x1D70F}}$
with
 $C$
depending only on
 $d$
,
 $\unicode[STIX]{x1D706}$
and
 $\unicode[STIX]{x1D6EC}$
. Invoking Caffarelli and Cabré (Reference Caffarelli and Cabré1995, Proposition 1.2) we conclude that for every
 $x_{1},x_{2}\in \bar{\unicode[STIX]{x1D6FA}}$
the function
 $u$
is differentiable at
 $y_{\ast }(x_{i})$
,
 $i=1,2$
and, moreover,
 $$\begin{eqnarray}|Du(y_{\ast }(x_{1}))-Du(y_{\ast }(x_{2}))|\leq Ch^{-\unicode[STIX]{x1D70F}}|y_{\ast }(x_{1})-y_{\ast }(x_{2})|.\end{eqnarray}$$
We now invoke (i) to obtain that
 $$\begin{eqnarray}|x_{1}-x_{2}|=\biggl|y_{\ast }(x_{1})-y_{\ast }(x_{2})+\displaystyle \frac{1}{2}h^{\unicode[STIX]{x1D70F}}Du(y_{\ast }(x_{1}))-\displaystyle \frac{1}{2}h^{\unicode[STIX]{x1D70F}}Du(y_{\ast }(x_{2}))\biggr|.\end{eqnarray}$$
The previous two inequalities yield the claim.
This completes the proof.
Next we establish a lower bound for
 $F_{h}[u_{\unicode[STIX]{x1D70F}}^{+}](\cdot )$
. We define
 $$\begin{eqnarray}\unicode[STIX]{x1D6FA}_{h}^{I,\unicode[STIX]{x1D70F}}=\{z\in \unicode[STIX]{x1D6FA}_{h}^{I}:\operatorname{dist}(z,\unicode[STIX]{x2202}\unicode[STIX]{x1D6FA})\geq Ch^{\unicode[STIX]{x1D70F}}\},\end{eqnarray}$$
where the constant
 $C>0$
depends on the stencil size
 $m$
and is chosen so that
 $F_{h}[u](x)$
is well-defined for
 $x$
satisfying
 $|x-z|\leq Ch^{\unicode[STIX]{x1D70F}}$
for some
 $z\in \unicode[STIX]{x1D6FA}_{h}^{I,\unicode[STIX]{x1D70F}}$
; see Figure 7.3.
A pictorial description of the set
 $\unicode[STIX]{x1D6FA}_{h}^{I,\unicode[STIX]{x1D70F}}$
. The values
 $F_{h}[u](x)$
are well-defined for
 $x$
within a distance of
 $Ch^{\unicode[STIX]{x1D70F}}$
of this set.

Proposition 7.12 (bound on
$F_{h}[u_{\unicode[STIX]{x1D70F}}^{+}](\cdot )$
).

Assume that
 $u\in C^{0,1}(\bar{\unicode[STIX]{x1D6FA}})$
and that
 $z\in \unicode[STIX]{x1D6FA}_{h}^{I,\unicode[STIX]{x1D70F}}$
. Let
 $y_{\ast }=y_{\ast }(z)\in \unicode[STIX]{x1D6FA}$
be chosen so that
 $$\begin{eqnarray}u_{\unicode[STIX]{x1D70F}}^{+}(z)=u(y_{\ast })-\displaystyle \frac{1}{h^{\unicode[STIX]{x1D70F}}}|z-y_{\ast }|^{2}.\end{eqnarray}$$
We then have
 $$\begin{eqnarray}F_{h}[u_{\unicode[STIX]{x1D70F}}^{+}](z)\geq F_{h}[u](y_{\ast })+(f(y_{\ast })-f(z)).\end{eqnarray}$$
Moreover, for all
 $z\in \unicode[STIX]{x1D6FA}_{h}^{I}$
, we have
 $$\begin{eqnarray}F_{h}[u_{\unicode[STIX]{x1D70F}}^{+}](z)\geq -Ch^{-\unicode[STIX]{x1D70F}}.\end{eqnarray}$$
Proof. First note that, by Proposition 7.11
(i) we have that
 $|z-y_{\ast }|\leq Ch^{\unicode[STIX]{x1D70F}}$
, and therefore
 $F_{h}[u](y_{\ast })$
is well-defined. Now, owing to the monotonicity of
 $F_{h}$
, to show the first estimate it suffices to show that
 $$\begin{eqnarray}\unicode[STIX]{x1D6FF}_{y,h}^{2}u_{\unicode[STIX]{x1D70F}}^{+}(z)\geq \unicode[STIX]{x1D6FF}_{y,h}^{2}u(y_{\ast })\quad y\in S.\end{eqnarray}$$
Define the function
 $$\begin{eqnarray}v(x)=u(x-z+y_{\ast })-\displaystyle \frac{1}{h^{\unicode[STIX]{x1D70F}}}|z-y_{\ast }|^{2},\end{eqnarray}$$
and note that
 $$\begin{eqnarray}v(z)=u(y_{\ast })-\displaystyle \frac{1}{h^{\unicode[STIX]{x1D70F}}}|z-y_{\ast }|^{2}=u_{\unicode[STIX]{x1D70F}}^{+}(z).\end{eqnarray}$$
The change of variables
 $\unicode[STIX]{x1D701}=x-z+y_{\ast }$
reveals that
 $$\begin{eqnarray}v(x)=u(\unicode[STIX]{x1D701})-\displaystyle \frac{1}{h^{\unicode[STIX]{x1D70F}}}|\unicode[STIX]{x1D701}-x|^{2}\leq u_{\unicode[STIX]{x1D70F}}^{+}(x),\end{eqnarray}$$
and therefore we conclude that, for any
 $y\in S$
,
 $\unicode[STIX]{x1D6FF}_{y,h}^{2}v(z)\leq \unicode[STIX]{x1D6FF}_{y,h}^{2}u_{\unicode[STIX]{x1D70F}}^{+}(z)$
. This, together with the fact that, for any
 $y\in S$
,
 $\unicode[STIX]{x1D6FF}_{y,h}^{2}v(z)=\unicode[STIX]{x1D6FF}_{y,h}^{2}u(y_{\ast })$
, yields
 $$\begin{eqnarray}\unicode[STIX]{x1D6FF}_{y,h}^{2}u(y_{\ast })=\unicode[STIX]{x1D6FF}_{y,h}^{2}v(z)\leq \unicode[STIX]{x1D6FF}_{y,h}^{2}u_{\unicode[STIX]{x1D70F}}^{+}(z).\end{eqnarray}$$
Since
 $f$
is independent of
 $\unicode[STIX]{x1D6FC}$
and
 $\unicode[STIX]{x1D6FD}$
, this proves the estimate
 $F_{h}[u_{\unicode[STIX]{x1D70F}}^{+}](z)+f(z)\geq F_{h}[u](y_{\ast })+f(y_{\ast })$
.
To prove (7.7), let
 $$\begin{eqnarray}w(x)=u(y_{\ast })-\displaystyle \frac{1}{h^{\unicode[STIX]{x1D70F}}}|x-y_{\ast }|^{2}.\end{eqnarray}$$
Clearly
 $w(z)=u_{\unicode[STIX]{x1D70F}}^{+}(z)$
and
 $w(x)\leq u_{\unicode[STIX]{x1D70F}}^{+}(x)$
. Therefore, monotonicity and the identity
 $$\begin{eqnarray}\unicode[STIX]{x1D6FF}_{y,h}^{2}w(z)=-\displaystyle \frac{2}{h^{\unicode[STIX]{x1D70F}}}|y|^{2}\end{eqnarray}$$
yields
 $$\begin{eqnarray}F_{h}[u_{\unicode[STIX]{x1D70F}}^{+}](z)\geq F_{h}[w](z)\geq -Ch^{-\unicode[STIX]{x1D70F}},\end{eqnarray}$$
which concludes the proof.
Our goal now is to compare
 $u_{\unicode[STIX]{x1D70F}}^{+}$
with the numerical solution
 $u_{h}$
through
 $F_{h}[u_{h}]$
and
 $F_{h}[u_{\unicode[STIX]{x1D70F}}^{+}]$
and a comparison principle for the discrete operator
 $F_{h}$
. From Proposition 7.12 it follows that
 $F_{h}[u_{\unicode[STIX]{x1D70F}}^{+}]$
at
 $z$
depends on the consistency error of
 $F_{h}[u]$
at
 $y_{\ast }:=y_{\ast }(z)$
. The consistency of
 $F_{h}$
, as stated in (7.5), implies that
 $$\begin{eqnarray}F_{h}[p](y_{\ast })=F(y_{\ast },D^{2}p),\quad \text{for all}~p\in \mathbb{P}_{2}.\end{eqnarray}$$
Consequently, the consistency error
 $F_{h}[u](y_{\ast })$
depends on the quality of the approximation of the solution
 $u$
by a quadratic polynomial at
 $y_{\ast }$
. This, in turn, depends on the regularity of
 $u$
.
The next result asserts that in our setting, outside sets of arbitrarily small measure, viscosity solutions to (7.1) have pointwise second-order Taylor expansions with an error that is controlled by the size of the singular set. For a proof, the reader is referred to Caffarelli and Souganidis (Reference Caffarelli and Souganidis2008, Theorem A).
Theorem 7.13 (quadratic approximation).
Assume that
 $F$
has constant coefficients, is uniformly elliptic with ellipticity constants
 $\unicode[STIX]{x1D706},\unicode[STIX]{x1D6EC}>0$
, and that
 $f\in C^{0,1}(\bar{\unicode[STIX]{x1D6FA}})$
. Let
 $u$
be a Lipschitz-continuous solution of
 $F(x,D^{2}u)=0$
in
 $B_{2r}(x_{0})$
. There exist positive constants
 $\unicode[STIX]{x1D70E}$
,
 $t_{0}$
and
 $C$
that depend on
 $\unicode[STIX]{x1D706}$
,
 $\unicode[STIX]{x1D6EC}$
and
 $d$
such that, for all
 $t>t_{0}$
, it is possible to find an open set
 $A_{t}\subset \unicode[STIX]{x1D6FA}$
such that if
 $x\in A_{t}$
, there exists a quadratic polynomial
 $p_{x}\in \mathbb{P}_{2}$
of opening less than
 $t$
that satisfies
 $$\begin{eqnarray}F(x,D^{2}p_{x}(x))=0.\end{eqnarray}$$
Moreover,
 $$\begin{eqnarray}|u(y)-u(x)-p_{x}(y-x)|\leq Ct|x-y|^{3},\quad \text{for all}~y\in B_{2r}(x_{0}),\end{eqnarray}$$
and
 $$\begin{eqnarray}|\unicode[STIX]{x1D6FA}\backslash A_{t}|\leq Ct^{-\unicode[STIX]{x1D70E}}.\end{eqnarray}$$
This theorem essentially says that, for every
 $t$
, except in a singular set of measure
 $t^{-\unicode[STIX]{x1D70E}}$
, which we denote by
 ${\mathcal{S}}_{t}$
, the function
 $u$
has a second-order Taylor expansion. We define the regular set
 ${\mathcal{R}}_{t}:=\bar{\unicode[STIX]{x1D6FA}}\backslash {\mathcal{S}}_{t}$
.
Let us now explain how Theorem 7.13 can be used to obtain a rate of convergence. By consistency, (7.5), we have that, for every
 $p\in \mathbb{P}_{2}$
,
 $$\begin{eqnarray}F_{h}[p](z)=F(z,D^{2}p(z)),\quad \text{for all}~z\in \unicode[STIX]{x1D6FA}.\end{eqnarray}$$
Therefore, if
 $t>0$
,
 $z\in \unicode[STIX]{x1D6FA}$
and
 $B_{h}(z)\cap {\mathcal{R}}_{t}\neq \emptyset$
, we choose
 $y\in B_{h}(z)\cap {\mathcal{R}}_{t}$
and set
 $p=p_{y}$
, the second-order expansion of
 $u$
at
 $y$
from Theorem 7.13. We then estimate the consistency error as follows:
 $$\begin{eqnarray}|F_{h}[u](z)|\leq |F_{h}[u](z)-F_{h}[p_{y}](z)|+|F_{h}[p_{y}](z)-F_{h}[p_{y}](y)|+|F_{h}[p_{y}](y)|.\end{eqnarray}$$
From estimate (7.8) and the fact that
 $F_{h}[p_{y}](z)-F_{h}[p_{y}](y)=f(y)-f(z)$
and
 $F_{h}[p_{y}](y)=0$
, it follows that
 $$\begin{eqnarray}|F_{h}[u](z)|\leq Cht+|f(z)-f(y)|\leq C_{1}ht+C_{2}h\end{eqnarray}$$
where
 $t>1$
,
 $C_{1}$
depends on the constant in (7.8) and stencil size
 $m$
, and
 $C_{2}$
depends on the Lipschitz constant of
 $f$
. Thus, the consistency error is of the order
 $O(th)$
on
 $\unicode[STIX]{x1D6FA}_{h}^{I}$
except for a set that has measure
 $O(t^{-\unicode[STIX]{x1D70E}})$
. To be more precise, we introduce the discrete regular and singular sets
 $$\begin{eqnarray}\begin{array}{@{}rcl@{}}{\mathcal{R}}_{t,h}\ & :=\ & \{z\in \unicode[STIX]{x1D6FA}_{h}^{I,\unicode[STIX]{x1D70F}}:B_{h}(y_{\ast }(z))\cap {\mathcal{R}}_{t}\neq \emptyset \},\\ {\mathcal{S}}_{t,h}\ & :=\ & \{z\in \unicode[STIX]{x1D6FA}_{h}^{I,\unicode[STIX]{x1D70F}}:z\notin {\mathcal{R}}_{t,h}\}.\end{array}\end{eqnarray}$$
We now estimate the size of the discrete singular set.
Lemma 7.14 (cardinality of
${\mathcal{S}}_{t,h}$
).

Let
 ${\mathcal{S}}_{t,h}$
be defined by (7.9). Then
 $$\begin{eqnarray}\#{\mathcal{S}}_{t,h}\leq C(h^{-d}t^{-\unicode[STIX]{x1D70E}}+h^{1-d}).\end{eqnarray}$$
Proof. Note that
 $$\begin{eqnarray}Ch^{d}(\#{\mathcal{S}}_{t,h})\leq \mathop{\sum }_{z\in {\mathcal{S}}_{t,h}}|B_{h}(y_{\ast }(z))|\leq C\left|\mathop{\bigcup }_{z\in {\mathcal{S}}_{t,h}}B_{h}(z)\right|\leq C(t^{-\unicode[STIX]{x1D70E}}+h).\end{eqnarray}$$
Indeed, the first inequality is obvious. The second one follows from Proposition 7.11
(iv), which shows that, for
 $z_{1},z_{2}\in \bar{\unicode[STIX]{x1D6FA}}_{h}$
with
 $z_{1}\neq z_{2}$
, we have
 $|y_{\ast }(z_{1})-y_{\ast }(z_{2})|\geq Ch$
, so the overlap of the balls can be controlled independently of
 $h$
. Finally, the last inequality follows from Theorem 7.13. Rearranging terms in this last inequality yields the result.
We now estimate the consistency error of
 $F_{h}[u_{\unicode[STIX]{x1D70F}}^{+}]$
and have the following corollary of Proposition 7.12.
Corollary 7.15 (consistency).
For every
 $z\in \unicode[STIX]{x1D6FA}_{h}^{I,\unicode[STIX]{x1D70F}}$
we have
 $$\begin{eqnarray}F_{h}[u_{\unicode[STIX]{x1D70F}}^{+}](z)\geq -C\left\{\begin{array}{@{}ll@{}}(ht+h^{\unicode[STIX]{x1D70F}})\quad & z\in {\mathcal{R}}_{t,h},\\ h^{-\unicode[STIX]{x1D70F}}\quad & z\in {\mathcal{S}}_{t,h}.\end{array}\right.\end{eqnarray}$$
Proof. For
 $z\in {\mathcal{R}}_{t,h}$
, since
 $|z-y_{\ast }|\leq Ch^{\unicode[STIX]{x1D70F}}$
and
 $f$
is Lipschitz-continuous, we have by Proposition 7.12
 $$\begin{eqnarray}F_{h}[u_{\unicode[STIX]{x1D70F}}^{+}](z)\geq F_{h}[u](y_{\ast })-Ch^{\unicode[STIX]{x1D70F}}\geq -C(ht+h^{\unicode[STIX]{x1D70F}}).\end{eqnarray}$$
The estimate on the singular set
 ${\mathcal{S}}_{t,h}$
was already established in (7.7).
The previous result controls the consistency error in the interior of the domain. To obtain a rate of convergence for the scheme, we also need to control this error near the boundary. This is accomplished with the help of the following discrete barrier function.
Lemma 7.16 (discrete barrier).
Let the domain
 $\unicode[STIX]{x1D6FA}$
satisfy an exterior ball condition. If
 $h$
is sufficiently small, then for any point
 $z\in \unicode[STIX]{x1D6FA}_{h}^{I}$
with
 $\operatorname{dist}(z,\unicode[STIX]{x2202}\unicode[STIX]{x1D6FA})\leq \unicode[STIX]{x1D6FF}$
, there exists a discrete function
 $b_{z,h}\in X_{h}^{fd}$
such that
 $$\begin{eqnarray}F_{h}[b_{z,h}](\unicode[STIX]{x1D701})\leq 0,\quad \text{for all}~\unicode[STIX]{x1D701}\in \unicode[STIX]{x1D6FA}_{h}^{I},\qquad b_{z,h}(\unicode[STIX]{x1D701})\geq 0,\quad \text{for all}~\unicode[STIX]{x1D701}\in \unicode[STIX]{x1D6FA}_{h}^{B}.\end{eqnarray}$$
Moreover, we have
 $$\begin{eqnarray}|b_{z,h}(z)|\leq C\unicode[STIX]{x1D6FF},\end{eqnarray}$$
where
 $C$
depends only on
 $\unicode[STIX]{x1D706},\unicode[STIX]{x1D6EC},d$
and
 $\unicode[STIX]{x1D6FA}$
.
Proof. Let
 $z_{\ast }\in \unicode[STIX]{x2202}\unicode[STIX]{x1D6FA}$
such that
 $|z-z_{\ast }|=\operatorname{dist}(z,\unicode[STIX]{x2202}\unicode[STIX]{x1D6FA})$
. Since
 $\unicode[STIX]{x1D6FA}$
satisfies an exterior ball condition, there exists a open ball
 $B_{r}(z^{\prime })$
centred at some point
 $z^{\prime }$
such that
 $$\begin{eqnarray}z_{\ast }\in \unicode[STIX]{x2202}B_{r}(z^{\prime })\quad \text{and}\quad B_{r}(z^{\prime })\cap \unicode[STIX]{x1D6FA}=\emptyset .\end{eqnarray}$$
We construct a barrier function
 $$\begin{eqnarray}b_{z}(x)=B(r^{-q}-|x-z^{\prime }|^{-q}),\end{eqnarray}$$
where
 $B$
and
 $q$
are some positive constant to be determined later. We observe that
 $$\begin{eqnarray}\displaystyle Db_{z}(x) & = & \displaystyle qB|x-z^{\prime }|^{-q-2}(x-z^{\prime }),\nonumber\\ \displaystyle D^{2}b_{z}(x) & = & \displaystyle qB|x-z^{\prime }|^{-q-2}\biggl(I-(2+q)\displaystyle \frac{(x-z^{\prime })}{|x-z^{\prime }|}\otimes \displaystyle \frac{(x-z^{\prime })}{|x-z^{\prime }|}\biggr).\nonumber\end{eqnarray}$$
Note that
 $D^{2}b_{z}(x)$
is a diagonal perturbation of a rank-one matrix that has eigenvalues
 $0$
(with multiplicity
 $d-1$
) and
 $-q(2+q)B|x-z^{\prime }|^{-q-2}$
(with multiplicity
 $1$
). Therefore
 $D^{2}b_{z}$
has eigenvalues
 $qB|x-z^{\prime }|^{-q-2}$
(with multiplicity
 $d-1$
) and
 $-q(1+q)B/|x-z^{\prime }|^{q+2}$
(with multiplicity
 $1$
). In particular the smallest eigenvalue of
 $D^{2}b_{z}(x)$
is
 $-q(1+q)B/|x-z^{\prime }|^{q+2}$
and the largest is
 $qB|x-z^{\prime }|^{-q-2}$
.
Since
 $\unicode[STIX]{x1D706}I\leq A^{\unicode[STIX]{x1D6FC},\unicode[STIX]{x1D6FD}}\leq \unicode[STIX]{x1D6EC}I$
we have
 $$\begin{eqnarray}\inf _{\unicode[STIX]{x1D6FD}\in {\mathcal{B}}}\sup _{\unicode[STIX]{x1D6FC}\in {\mathcal{A}}}[A^{\unicode[STIX]{x1D6FC},\unicode[STIX]{x1D6FD}}:D^{2}b_{z}(x)]\leq \displaystyle \frac{Bq}{|x-z^{\prime }|^{q+2}}[(d-1)\unicode[STIX]{x1D6EC}-(1+q)\unicode[STIX]{x1D706}].\end{eqnarray}$$
Taking
 $$\begin{eqnarray}q=2(d-1)\displaystyle \frac{\unicode[STIX]{x1D6EC}}{\unicode[STIX]{x1D706}}-1,\end{eqnarray}$$
we obtain that
 $$\begin{eqnarray}\displaystyle \inf _{\unicode[STIX]{x1D6FD}\in {\mathcal{B}}}\sup _{\unicode[STIX]{x1D6FC}\in {\mathcal{A}}}[A^{\unicode[STIX]{x1D6FC},\unicode[STIX]{x1D6FD}}:D^{2}b_{z}(x)] & \leq & \displaystyle \displaystyle \frac{Bq}{|x-z^{\prime }|^{q+2}}(1-d)\unicode[STIX]{x1D6EC}\nonumber\\ \displaystyle & \leq & \displaystyle \displaystyle \frac{Bq}{|r+\operatorname{diam}(\unicode[STIX]{x1D6FA})|^{q+2}}(1-d)\unicode[STIX]{x1D6EC}.\nonumber\end{eqnarray}$$
Since the right-hand side of the last inequality is negative, we conclude that, for
 $B$
sufficiently large,
 $$\begin{eqnarray}\inf _{\unicode[STIX]{x1D6FD}\in {\mathcal{B}}}\sup _{\unicode[STIX]{x1D6FC}\in {\mathcal{A}}}[A^{\unicode[STIX]{x1D6FC},\unicode[STIX]{x1D6FD}}:D^{2}b_{z}(x)]\leq -2\Vert f\Vert _{L^{\infty }(\unicode[STIX]{x1D6FA})}.\end{eqnarray}$$
The discrete barrier function is then defined as
 $b_{h,z}=I_{h}^{fd}b_{z}$
. It is easy to check that
 $$\begin{eqnarray}b_{h,z}(\unicode[STIX]{x1D701})\geq 0,\quad \text{for all}~\unicode[STIX]{x1D701}\in \unicode[STIX]{x1D6FA}_{h}^{B},\quad |b_{h,z}(z)|\leq C\unicode[STIX]{x1D6FF},\end{eqnarray}$$
so that it remains to verify that
 $F_{h}[b_{h}](\unicode[STIX]{x1D701})\leq 0$
for all
 $\unicode[STIX]{x1D701}\in \unicode[STIX]{x1D6FA}_{h}^{I}$
.
Since
 $b_{z}$
is a smooth function, the consistency condition (7.5) implies
 $$\begin{eqnarray}F_{h}[b_{h,z}](\unicode[STIX]{x1D701})-F(\unicode[STIX]{x1D701},D^{2}b_{z})(\unicode[STIX]{x1D701})=O(h).\end{eqnarray}$$
Finally, because
 $F(\unicode[STIX]{x1D701},D^{2}b_{z})(\unicode[STIX]{x1D701})\leq -\Vert f\Vert _{L^{\infty }(\unicode[STIX]{x1D6FA})}$
we deduce that, for
 $h$
sufficiently small,
 $$\begin{eqnarray}F_{h}[b_{h,z}](\unicode[STIX]{x1D701})\leq 0,\quad \text{for all}~\unicode[STIX]{x1D701}\in \unicode[STIX]{x1D6FA}_{h}^{I}.\end{eqnarray}$$
This completes the proof.
Remark 7.17 (bound on
$u_{h}$
).

Corollary 7.15 implies that for any
 $z\in \unicode[STIX]{x1D6FA}_{h}^{I}$
with
 $\operatorname{dist}(z,\unicode[STIX]{x2202}\unicode[STIX]{x1D6FA})\leq \unicode[STIX]{x1D6FF}$
, we have
 $$\begin{eqnarray}|u_{h}(z)|\leq C\unicode[STIX]{x1D6FF}.\end{eqnarray}$$
Indeed, since
 $b_{z,h}\geq u_{h}=0$
on
 $\unicode[STIX]{x1D6FA}_{h}^{B}$
and
 $F_{h}[b_{z,h}](z)\leq F_{h}[u_{h}](z)$
for all
 $z\in \unicode[STIX]{x1D6FA}_{h}^{I}$
, invoking a comparison principle for
 $F_{h}$
, we obtain
 $$\begin{eqnarray}u_{h}(z)\leq b_{z,h}(z)\leq C\unicode[STIX]{x1D6FF}.\end{eqnarray}$$
Similarly we can show that
 $u_{h}(z)\geq -C\unicode[STIX]{x1D6FF}$
.
Combining Corollary 7.15 and Lemma 7.14, we obtain a rate of convergence for the finite difference scheme (7.2).
Theorem 7.18 (rate of convergence).
Let the domain
 $\unicode[STIX]{x1D6FA}$
satisfy an exterior ball condition and
 $f\in C^{0,1}(\bar{\unicode[STIX]{x1D6FA}})$
. Let
 $u_{h}\in X_{h}^{fd}$
be the solution to (7.2) and
 $u\in C^{0,1}(\bar{\unicode[STIX]{x1D6FA}})$
the viscosity solution to (7.1). Then we obtain
 $$\begin{eqnarray}\Vert I_{h}^{fd}u-u_{h}\Vert _{L^{\infty }(\bar{\unicode[STIX]{x1D6FA}}_{h})}\leq Ch^{\unicode[STIX]{x1D70E}/(2d+\unicode[STIX]{x1D70E})},\end{eqnarray}$$
where
 $\unicode[STIX]{x1D70E}$
is the exponent in Theorem 7.13.
Proof. By Proposition 7.11
(ii) we have that
 $\Vert u-u_{\unicode[STIX]{x1D70F}}^{+}\Vert _{L^{\infty }(\unicode[STIX]{x1D6FA})}\leq Ch^{\unicode[STIX]{x1D70F}}$
. Thus it is sufficient to bound
 $v_{h}=u_{h}-I_{h}^{fd}u_{\unicode[STIX]{x1D70F}}^{+}$
. We shall show that
 $\sup _{\bar{\unicode[STIX]{x1D6FA}}_{h}}v_{h}^{-}\leq Ch^{\unicode[STIX]{x1D70E}/(2d+\unicode[STIX]{x1D70E})}$
; the proof of the complementary estimate is similar. We divide the proof into two steps.
Step 1 (boundary estimate). We first show that, for any
 $z\in \bar{\unicode[STIX]{x1D6FA}}_{h}\backslash \unicode[STIX]{x1D6FA}_{h}^{I,\unicode[STIX]{x1D70F}}$
,
 $$\begin{eqnarray}|v_{h}(z)|\leq Ch^{\unicode[STIX]{x1D70F}}\end{eqnarray}$$
for some constant
 $C>0$
. By the definition of
 $v_{h}$
, we have
 $$\begin{eqnarray}\displaystyle |v_{h}(z)| & \leq & \displaystyle |u_{h}(z)-u(z)|+|u(z)-I_{h}^{fd}u_{\unicode[STIX]{x1D70F}}^{+}(z)|\nonumber\\ \displaystyle & \leq & \displaystyle |u_{h}(z)|+|u(z)|+|u(z)-I_{h}^{fd}u_{\unicode[STIX]{x1D70F}}^{+}(z)|.\nonumber\end{eqnarray}$$
Since
 $u$
is Lipschitz-continuous and
 $u=0$
on
 $\unicode[STIX]{x2202}\unicode[STIX]{x1D6FA}$
, we have that
 $|u(z)|\leq Ch^{\unicode[STIX]{x1D70F}}$
. In addition, owing to Remark 7.17 and Proposition 7.11
(ii), we conclude that
 $$\begin{eqnarray}|v_{h}(z)|\leq Ch^{\unicode[STIX]{x1D70F}}.\end{eqnarray}$$
Step 2 (interior estimate). Now
 $$\begin{eqnarray}-F_{h}[u_{\unicode[STIX]{x1D70F}}^{+}](z)=F_{h}[u_{h}](z)-F_{h}[u_{\unicode[STIX]{x1D70F}}^{+}](z)\geq {\mathcal{L}}_{h}(u_{h}-I_{h}^{fd}u_{\unicode[STIX]{x1D70F}}^{+})(z)={\mathcal{L}}_{h}v_{h}(z),\end{eqnarray}$$
where
 ${\mathcal{L}}_{h}$
is the linear(ized) operator (7.3) with coefficients that depend on
 $u_{\unicode[STIX]{x1D70F}}^{+}$
and
 $u_{h}$
. Thus, setting
 $t=h^{\unicode[STIX]{x1D70F}-1}$
, we have by Corollary 7.15
 $$\begin{eqnarray}{\mathcal{L}}_{h}v_{h}(z)\leq C\left\{\begin{array}{@{}ll@{}}h^{\unicode[STIX]{x1D70F}}\quad & z\in {\mathcal{R}}_{h^{\unicode[STIX]{x1D70F}-1},h},\\ h^{-\unicode[STIX]{x1D70F}}\quad & z\in {\mathcal{S}}_{h^{\unicode[STIX]{x1D70F}-1},h},\end{array}\right.\end{eqnarray}$$
and, by Lemma 7.14,
 $$\begin{eqnarray}\#{\mathcal{S}}_{h^{\unicode[STIX]{x1D70F}-1},h}\leq C(h^{-d+\unicode[STIX]{x1D70E}(1-\unicode[STIX]{x1D70F})}+h^{1-d})\leq Ch^{-d+\unicode[STIX]{x1D70E}(1-\unicode[STIX]{x1D70F})}.\end{eqnarray}$$
Applying the ABP estimate given in Theorem 3.25 to (7.10) (with
 $\unicode[STIX]{x1D6FA}_{h}^{I}$
replaced with
 $\unicode[STIX]{x1D6FA}_{h}^{I,\unicode[STIX]{x1D70F}}$
) yields
 $$\begin{eqnarray}\displaystyle \sup _{\unicode[STIX]{x1D6FA}_{h}^{I,\unicode[STIX]{x1D70F}}}v_{h}^{-} & \leq & \displaystyle C\biggl(\mathop{\sum }_{z\in {\mathcal{R}}_{h^{\unicode[STIX]{x1D70F}-1},h}}h^{d+d\unicode[STIX]{x1D70F}}+\mathop{\sum }_{z\in {\mathcal{S}}_{h^{\unicode[STIX]{x1D70F}-1},h}}h^{d-d\unicode[STIX]{x1D70F}}\biggr)^{1/d}\nonumber\\ \displaystyle & \leq & \displaystyle C(h^{d\unicode[STIX]{x1D70F}}+h^{-d\unicode[STIX]{x1D70F}+\unicode[STIX]{x1D70E}(1-\unicode[STIX]{x1D70F})})^{1/d}.\nonumber\end{eqnarray}$$
Thus, setting
 $\unicode[STIX]{x1D70F}$
so that
 $d\unicode[STIX]{x1D70F}=-d\unicode[STIX]{x1D70F}+\unicode[STIX]{x1D70E}(1-\unicode[STIX]{x1D70F})$
, that is,
 $\unicode[STIX]{x1D70F}=\unicode[STIX]{x1D70E}/(2d+\unicode[STIX]{x1D70E}),$
we obtain
 $$\begin{eqnarray}\sup _{\unicode[STIX]{x1D6FA}_{h}^{I,\unicode[STIX]{x1D70F}}}v_{h}^{-}\leq Ch^{\unicode[STIX]{x1D70E}/(2d+\unicode[STIX]{x1D70E})},\end{eqnarray}$$
and therefore
 $$\begin{eqnarray}\sup _{\unicode[STIX]{x1D6FA}_{h}^{I,\unicode[STIX]{x1D70F}}}(u_{h}-I_{h}^{fd}u_{\unicode[STIX]{x1D70F}}^{+})^{-}\leq Ch^{\unicode[STIX]{x1D70E}/(2d+\unicode[STIX]{x1D70E})}.\end{eqnarray}$$
Gathering the obtained bounds implies the result.
Remark 7.19 (extensions).
The works by Krylov (Reference Krylov2015) and Turanova (Reference Turanova2015) have obtained rates of convergence for finite difference schemes for non-convex PDEs with variable coefficients and low-order terms.
7.3 Finite element methods
Now, following Salgado and Zhang (Reference Salgado and Zhang2016), let us focus on the development of a finite element scheme for (7.1) based on the integro-differential approximation presented in Section 4.3. The idea is that after choosing an
 $\unicode[STIX]{x1D716}>0$
, we replace each of the operators
 ${\mathcal{L}}^{\unicode[STIX]{x1D6FC},\unicode[STIX]{x1D6FD}}$
with their integro-differential approximations
 ${\mathcal{L}}_{\unicode[STIX]{x1D716}}^{\unicode[STIX]{x1D6FC},\unicode[STIX]{x1D6FD}}$
, as defined in (4.27). In so doing we obtain – according to Caffarelli and Silvestre (Reference Caffarelli and Silvestre2010b
) – a smooth approximation
 $u^{\unicode[STIX]{x1D716}}$
of
 $u$
, the solution to (7.1). Moreover, the difference
 $u-u^{\unicode[STIX]{x1D716}}$
can be controlled in terms of
 $\unicode[STIX]{x1D716}$
. We can now proceed to approximate
 $u^{\unicode[STIX]{x1D716}}$
by simply taking the inf-sup over discrete problems of the form (4.28), thus obtaining a discrete function
 $u_{h}^{\unicode[STIX]{x1D716}}\in X_{0,h}^{l}$
. Using the regularity of
 $u^{\unicode[STIX]{x1D716}}$
, we can control the difference
 $u^{\unicode[STIX]{x1D716}}-u_{h}^{\unicode[STIX]{x1D716}}$
in terms of the mesh size and, possibly, negative powers of
 $\unicode[STIX]{x1D716}$
. Optimizing with respect to
 $\unicode[STIX]{x1D716}$
yields a rate of convergence.
Let us now proceed with the details. To set ideas we will assume that for every
 $\unicode[STIX]{x1D6FC}\in {\mathcal{A}}$
and
 $\unicode[STIX]{x1D6FD}\in {\mathcal{B}}$
we have
 $f^{\unicode[STIX]{x1D6FC},\unicode[STIX]{x1D6FD}}=f\in C^{0,1}(\bar{\unicode[STIX]{x1D6FA}})$
and that the matrices
 $A^{\unicode[STIX]{x1D6FC},\unicode[STIX]{x1D6FD}}$
are constant. The approximate problem is then
 $$\begin{eqnarray}\left\{\begin{array}{@{}ll@{}}\displaystyle \frac{\unicode[STIX]{x1D706}}{2}\unicode[STIX]{x1D6E5}u^{\unicode[STIX]{x1D716}}+\inf _{\unicode[STIX]{x1D6FD}\in {\mathcal{B}}}\sup _{\unicode[STIX]{x1D6FC}\in {\mathcal{A}}}I_{\unicode[STIX]{x1D716}}^{\unicode[STIX]{x1D6FC},\unicode[STIX]{x1D6FD}}u^{\unicode[STIX]{x1D716}}=f\quad & \text{in }\unicode[STIX]{x1D6FA}_{\unicode[STIX]{x1D716}},\\ u=0\quad & \text{on }\unicode[STIX]{x1D714}_{\unicode[STIX]{x1D716}},\end{array}\right.\end{eqnarray}$$
where, in analogy to (4.26), the integral operators are defined by
 $$\begin{eqnarray}I_{\unicode[STIX]{x1D716}}^{\unicode[STIX]{x1D6FC},\unicode[STIX]{x1D6FD}}w(x)=\displaystyle \frac{1}{\unicode[STIX]{x1D716}^{d+2}\det A_{\unicode[STIX]{x1D706}}^{\unicode[STIX]{x1D6FC},\unicode[STIX]{x1D6FD}}}\int _{\mathbb{R}^{d}}|y|^{2}\unicode[STIX]{x1D6FF}_{\unicode[STIX]{x1D703}y,\unicode[STIX]{x1D703}}^{2}w(x)\unicode[STIX]{x1D711}\biggl(\displaystyle \frac{1}{\unicode[STIX]{x1D716}}(A_{\unicode[STIX]{x1D706}}^{\unicode[STIX]{x1D6FC},\unicode[STIX]{x1D6FD}})^{-1}y\biggr),\end{eqnarray}$$
with
 $$\begin{eqnarray}A_{\unicode[STIX]{x1D706}}^{\unicode[STIX]{x1D6FC},\unicode[STIX]{x1D6FD}}=\biggl(A^{\unicode[STIX]{x1D6FC},\unicode[STIX]{x1D6FD}}-\displaystyle \frac{\unicode[STIX]{x1D706}}{2}I\biggr)^{1/2},\end{eqnarray}$$
and the domains
 $\unicode[STIX]{x1D6FA}_{\unicode[STIX]{x1D716}}$
and
 $\unicode[STIX]{x1D714}_{\unicode[STIX]{x1D716}}$
are given by (4.25).
Let us now state the existence, uniqueness and smoothness properties of
 $u^{\unicode[STIX]{x1D716}}$
and its rate of convergence to
 $u$
. For a proof see Theorem 3.5, Theorem 4.8 and Theorem 6.1 of Caffarelli and Silvestre (Reference Caffarelli and Silvestre2010b
).
Proposition 7.20 (properties of
$u^{\unicode[STIX]{x1D716}}$
).

Problem (7.11) has a unique classical solution
 $u^{\unicode[STIX]{x1D716}}$
. Moreover, there exists
 $s\in (0,1)$
that depends on
 $\unicode[STIX]{x1D706}$
,
 $\unicode[STIX]{x1D6EC}$
and
 $d$
but not on
 $\unicode[STIX]{x1D716}$
such that, for every
 $\unicode[STIX]{x1D714}\Subset \unicode[STIX]{x1D6FA}$
, we have
 $$\begin{eqnarray}\Vert u^{\unicode[STIX]{x1D716}}\Vert _{C^{1,s}(\unicode[STIX]{x1D714})}+\Vert u^{\unicode[STIX]{x1D716}}\Vert _{C^{0,1}(\bar{\unicode[STIX]{x1D6FA}})}\leq C(\Vert u^{\unicode[STIX]{x1D716}}\Vert _{L^{\infty }(\unicode[STIX]{x1D6FA})}+\Vert f\Vert _{L^{\infty }(\unicode[STIX]{x1D6FA})}),\end{eqnarray}$$
where the constant
 $C>0$
depends on the distance between
 $\unicode[STIX]{x1D714}$
and
 $\unicode[STIX]{x2202}\unicode[STIX]{x1D6FA}$
. Additionally, there exists a
 $\unicode[STIX]{x1D6FE}>0$
such that
 $$\begin{eqnarray}\Vert u-u^{\unicode[STIX]{x1D716}}\Vert _{L^{\infty }(\unicode[STIX]{x1D6FA})}\leq C\unicode[STIX]{x1D716}^{\unicode[STIX]{x1D6FE}}\Vert f\Vert _{C^{0,1}(\unicode[STIX]{x1D6FA})},\end{eqnarray}$$
where the constant
 $C>0$
depends only on
 $\unicode[STIX]{x1D706}$
,
 $\unicode[STIX]{x1D6EC}$
,
 $d$
and
 $\unicode[STIX]{x1D6FA}$
.
With the properties of
 $u^{\unicode[STIX]{x1D716}}$
at hand we introduce a finite element scheme to approximate it. Namely, given a quasi-uniform triangulation for which (3.42) holds, we seek
 $u_{h}^{\unicode[STIX]{x1D700}}\in X_{0,h}^{l}$
such that (compare with (4.28))
 $$\begin{eqnarray}F_{h}^{\unicode[STIX]{x1D716}}[u_{h}^{\unicode[STIX]{x1D716}}](z_{i}):=\displaystyle \frac{\unicode[STIX]{x1D706}}{2}\unicode[STIX]{x1D6E5}_{h}u_{h}^{\unicode[STIX]{x1D716}}(z_{i})+\inf _{\unicode[STIX]{x1D6FD}\in {\mathcal{B}}}\sup _{\unicode[STIX]{x1D6FC}\in {\mathcal{A}}}I_{\unicode[STIX]{x1D716}}^{\unicode[STIX]{x1D6FC},\unicode[STIX]{x1D6FD}}u_{h}^{\unicode[STIX]{x1D716}}(z_{i})-f_{i}=0,\quad \text{for all}~z_{i}\in \unicode[STIX]{x1D6FA}_{h}^{I},\end{eqnarray}$$
where, as in (4.28),
 $f_{i}=\int _{\unicode[STIX]{x1D6FA}}f\unicode[STIX]{x1D719}_{i}$
and
 $\unicode[STIX]{x1D719}_{i}$
are the normalized hat functions.
Let us now address the existence, uniqueness and approximation properties of
 $u_{h}^{\unicode[STIX]{x1D716}}$
. We begin by noting that, since each one of the operators
 $$\begin{eqnarray}w_{h}\mapsto \displaystyle \frac{\unicode[STIX]{x1D706}}{2}\unicode[STIX]{x1D6E5}_{h}w_{h}+I_{\unicode[STIX]{x1D716}}^{\unicode[STIX]{x1D6FC},\unicode[STIX]{x1D6FD}}w_{h}\end{eqnarray}$$
is monotone (see Lemma 4.19), the same holds for
 $F_{h}^{\unicode[STIX]{x1D716}}$
. This is the content of the next result.
Corollary 7.21 (monotonicity).
Assume that
 ${\mathcal{T}}_{h}$
is such that
 $\unicode[STIX]{x1D6E5}_{h}$
is monotone. Then the operator
 $F_{h}^{\unicode[STIX]{x1D716}}$
, defined in (7.12) is monotone.
Remark 7.22 (flexibility).
Note that, in Corollary 7.21, all that is necessary is a comparison principle for the finite element Laplacian
 $\unicode[STIX]{x1D6E5}_{h}$
. A sufficient condition for this is given in Lemma 3.42. This is in stark contrast with the methods of Section 5.2, where either a restrictive mesh condition is needed (see Remark 5.8) or the coefficients are assumed to be isotropic as in (5.16).
In addition to monotonicity we must also consider the consistency of the scheme which, owing to the consistency of
 $\unicode[STIX]{x1D6E5}_{h}$
(see Lemma 3.41), reduces to the study of the consistency of the inf-sup of integral transforms when applied to Lipschitz functions (recall that
 $u^{\unicode[STIX]{x1D716}}\in C^{0,1}(\bar{\unicode[STIX]{x1D6FA}})$
uniformly in
 $\unicode[STIX]{x1D716}$
). To measure this we define, for
 $z_{i}\in \unicode[STIX]{x1D6FA}_{h}^{I}$
,
 $$\begin{eqnarray}{\mathcal{R}}_{h,\unicode[STIX]{x1D716}}[w](z_{i})=\int _{\unicode[STIX]{x1D6FA}}\biggl[\inf _{\unicode[STIX]{x1D6FD}\in {\mathcal{B}}}\sup _{\unicode[STIX]{x1D6FC}\in {\mathcal{A}}}I_{\unicode[STIX]{x1D716}}^{\unicode[STIX]{x1D6FC},\unicode[STIX]{x1D6FD}}I_{h}^{ep}w(z_{i})-\inf _{\unicode[STIX]{x1D6FD}\in {\mathcal{B}}}\sup _{\unicode[STIX]{x1D6FC}\in {\mathcal{A}}}I_{\unicode[STIX]{x1D716}}^{\unicode[STIX]{x1D6FC},\unicode[STIX]{x1D6FD}}w(x)\biggr]\unicode[STIX]{x1D719}_{i}(x).\end{eqnarray}$$
The consistency of the scheme is then encoded in the following result, whose proof mainly follows Lemma 4.18 and Theorem 4.23 but must take into account the reduced regularity of the functions. This is the reason for the reduced rate.
Lemma 7.23 (consistency).
Let
 $w\in C^{0,1}(\bar{\unicode[STIX]{x1D6FA}})$
. Then for every
 $z\in \unicode[STIX]{x1D6FA}_{h}^{I}$
we have
 $$\begin{eqnarray}|{\mathcal{R}}_{h,\unicode[STIX]{x1D716}}[w](z)|\leq C\displaystyle \frac{h}{\unicode[STIX]{x1D716}^{2}}\,|\text{log}\,h|\Vert w\Vert _{C^{0,1}(\bar{\unicode[STIX]{x1D6FA}})},\end{eqnarray}$$
where the constant
 $C>0$
is independent of
 $z$
,
 $h$
,
 $\unicode[STIX]{x1D716}$
and
 $w$
.
Monotonicity and consistency allow us to conclude existence and uniqueness of solutions. The proof of the following result is either a corollary of Proposition 7.27 below or follows from a discrete version of Perron’s method.
Theorem 7.24 (existence and uniqueness).
Let the family of meshes be such that
 $\unicode[STIX]{x1D6E5}_{h}$
is monotone. Then, for every
 $h>0$
and
 $\unicode[STIX]{x1D716}>0$
, the scheme (7.12) has a unique solution.
To conclude, we study the rates of convergence. Since Proposition 7.20 provides a rate for
 $\Vert u-u^{\unicode[STIX]{x1D716}}\Vert _{L^{\infty }(\unicode[STIX]{x1D6FA})}$
and Proposition 3.40 provides one for
 $\Vert u^{\unicode[STIX]{x1D716}}-I_{h}^{ep}u^{\unicode[STIX]{x1D716}}\Vert _{L^{\infty }(\unicode[STIX]{x1D6FA})}$
, it remains to compare the discrete solution
 $u_{h}^{\unicode[STIX]{x1D716}}$
to the Galerkin projection
 $I_{h}^{ep}u^{\unicode[STIX]{x1D716}}$
. Upon denoting
 $e_{h}=I_{h}^{ep}u^{\unicode[STIX]{x1D716}}-u_{h}^{\unicode[STIX]{x1D716}}\in X_{0,h}^{l}$
, and after some manipulations, it turns out that the error
 $e_{h}$
satisfies, for every
 $z\in \unicode[STIX]{x1D6FA}_{h}^{I}$
,
 $$\begin{eqnarray}\displaystyle \frac{\unicode[STIX]{x1D706}}{2}\unicode[STIX]{x1D6E5}_{h}e_{h}(z)+\inf _{\unicode[STIX]{x1D6FD}\in {\mathcal{B}}}\sup _{\unicode[STIX]{x1D6FC}\in {\mathcal{A}}}I_{\unicode[STIX]{x1D716}}^{\unicode[STIX]{x1D6FC},\unicode[STIX]{x1D6FD}}I_{h}^{ep}u^{\unicode[STIX]{x1D716}}(z)-\inf _{\unicode[STIX]{x1D6FD}\in {\mathcal{B}}}\sup _{\unicode[STIX]{x1D6FC}\in {\mathcal{A}}}I_{\unicode[STIX]{x1D716}}^{\unicode[STIX]{x1D6FC},\unicode[STIX]{x1D6FD}}u_{h}^{\unicode[STIX]{x1D716}}(z)={\mathcal{R}}_{h,\unicode[STIX]{x1D716}}[u^{\unicode[STIX]{x1D716}}](z).\end{eqnarray}$$
With this equation at hand we are ready to establish a rate of convergence.
Theorem 7.25 (rate of convergence).
Let
 $u\in C^{1,s}(\unicode[STIX]{x1D6FA})\cap C^{0,1}(\bar{\unicode[STIX]{x1D6FA}})$
be the solution of problem (7.1) and let
 $u_{h}^{\unicode[STIX]{x1D716}}\in X_{0,h}^{l}$
be the solution to scheme (7.12) with
 $\unicode[STIX]{x1D716}\geq Ch^{1/2}\,|\text{log}\,h|$
. There exists
 $\unicode[STIX]{x1D6FE}>0$
such that
 $$\begin{eqnarray}\Vert u-u_{h}^{\unicode[STIX]{x1D716}}\Vert _{L^{\infty }(\unicode[STIX]{x1D6FA})}\leq C\biggl(\unicode[STIX]{x1D716}^{\unicode[STIX]{x1D6FE}}+\displaystyle \frac{h}{\unicode[STIX]{x1D716}^{2}}\,|\text{log}\,h|\biggr)\Vert f\Vert _{C^{0,1}(\bar{\unicode[STIX]{x1D6FA}})},\end{eqnarray}$$
where the constant
 $C>0$
depends only on
 $\unicode[STIX]{x1D706}$
,
 $\unicode[STIX]{x1D6EC}$
,
 $\unicode[STIX]{x1D6FA}$
and
 $d$
.
Proof. As already discussed, the rates of convergence reduce to estimating the difference
 $e_{h}$
. To do so we employ the error equation (7.13) and note that, if
 $z$
belongs to
 ${\mathcal{C}}_{h}^{-}(e_{h})$
, the contact set of
 $e_{h}$
, then we must have
 $$\begin{eqnarray}\inf _{\unicode[STIX]{x1D6FD}\in {\mathcal{B}}}\sup _{\unicode[STIX]{x1D6FC}\in {\mathcal{A}}}I_{\unicode[STIX]{x1D716}}^{\unicode[STIX]{x1D6FC},\unicode[STIX]{x1D6FD}}I_{h}^{ep}u^{\unicode[STIX]{x1D716}}(z)\geq \inf _{\unicode[STIX]{x1D6FD}\in {\mathcal{B}}}\sup _{\unicode[STIX]{x1D6FC}\in {\mathcal{A}}}I_{h}^{\unicode[STIX]{x1D6FC},\unicode[STIX]{x1D6FD}}u_{h}^{\unicode[STIX]{x1D716}}(z).\end{eqnarray}$$
In other words, for
 $z\in {\mathcal{C}}_{h}^{-}(e_{h})$
, the error
 $e_{h}$
satisfies the inequality
 $$\begin{eqnarray}\displaystyle \frac{\unicode[STIX]{x1D706}}{2}\unicode[STIX]{x1D6E5}_{h}e_{h}(z)\leq {\mathcal{R}}_{h,\unicode[STIX]{x1D716}}[u^{\unicode[STIX]{x1D716}}](z).\end{eqnarray}$$
The discrete ABP estimate of Theorem 4.20 then implies that
 $$\begin{eqnarray}\sup _{\unicode[STIX]{x1D6FA}}e_{h}^{-}\leq C\biggl(\mathop{\sum }_{z\in {\mathcal{C}}_{h}^{-}(e_{h})}|\unicode[STIX]{x1D714}_{z}|\,|{\mathcal{R}}_{h,\unicode[STIX]{x1D716}}[u^{\unicode[STIX]{x1D716}}](z)|^{d}\biggr)^{1/d}.\end{eqnarray}$$
We must now invoke the consistency estimates of Lemma 7.23 to obtain an upper bound for
 $e_{h}^{-}$
. A similar argument will yield the reverse bound. The theorem is thus proved.
Remark 7.26 (algebraic rate).
If the actual value of
 $\unicode[STIX]{x1D6FE}>0$
is known, then one can choose
 $\unicode[STIX]{x1D716}^{\unicode[STIX]{x1D6FE}+2}=h\,|\text{log}\,h|$
to obtain
 $$\begin{eqnarray}\Vert u-u_{h}^{\unicode[STIX]{x1D716}}\Vert _{L^{\infty }(\unicode[STIX]{x1D6FA})}\leq Ch^{\unicode[STIX]{x1D6FE}/(\unicode[STIX]{x1D6FE}+2)}\,|\text{log}\,h|^{\unicode[STIX]{x1D6FE}/(\unicode[STIX]{x1D6FE}+2)},\end{eqnarray}$$
which in the best scenario,
 $\unicode[STIX]{x1D6FE}=1$
, would yield
 $O(h^{1/3}\,|\text{log}\,h|^{1/3})$
.
7.4 Solution of the discrete problems
Having discussed discretization schemes for Isaacs equations (7.1) and detailed their convergence properties, to finalize our discussion we will focus on how to solve the ensuing nonlinear systems of equations. We will see – as should by now be clear to the reader – that the approaches are extensions of the convex case, which we discussed in Section 5.3, but the results are much more modest.
After discretization, in complete analogy to (5.22), we must solve the following problem: find
 $\mathbf{x}\in \mathbb{R}^{N}$
, such that
 $$\begin{eqnarray}\mathbf{F}(\mathbf{x})=\inf _{\unicode[STIX]{x1D6FD}\in {\mathcal{B}}}\sup _{\unicode[STIX]{x1D6FC}\in {\mathcal{A}}}[\mathbf{K}^{\unicode[STIX]{x1D6FC},\unicode[STIX]{x1D6FD}}\mathbf{x}-\mathbf{f}^{\unicode[STIX]{x1D6FC},\unicode[STIX]{x1D6FD}}]=\mathbf{0},\end{eqnarray}$$
where the inf-sup is computed component-wise,
 $\{\mathbf{K}^{\unicode[STIX]{x1D6FC},\unicode[STIX]{x1D6FD}}:\unicode[STIX]{x1D6FC}\in {\mathcal{A}},\unicode[STIX]{x1D6FD}\in {\mathcal{B}}\}$
and
 $\{\mathbf{f}^{\unicode[STIX]{x1D6FC},\unicode[STIX]{x1D6FD}}:\unicode[STIX]{x1D6FC}\in {\mathcal{A}},\unicode[STIX]{x1D6FD}\in {\mathcal{B}}\}$
are, respectively, discretizations of
 $\{{\mathcal{L}}^{\unicode[STIX]{x1D6FC},\unicode[STIX]{x1D6FD}}:\unicode[STIX]{x1D6FC}\in {\mathcal{A}},\unicode[STIX]{x1D6FD}\in {\mathcal{B}}\}$
and
 $\{f^{\unicode[STIX]{x1D6FC},\unicode[STIX]{x1D6FD}}:\unicode[STIX]{x1D6FC}\in {\mathcal{A}},\unicode[STIX]{x1D6FD}\in {\mathcal{B}}\}$
. Once again, the dimension
 $N$
equals the number of degrees of freedom in the discretization.
One would be tempted, following Algorithm 5.1, to define, for
 $\mathbf{y}\in \mathbb{R}^{N}$
, the indices
 $\unicode[STIX]{x1D736}(\mathbf{y})$
and
 $\unicode[STIX]{x1D737}(\mathbf{y})$
by conditions similar to those that led to (5.23) and use them in each iteration of a possible extension of Howard’s algorithm. However, this will not produce a convergent method; see, for instance, Bokanowski et al. (Reference Bokanowski, Maroso and Zidani2009, Remark 5.8). The reason for this, simply put, is that the map
 $\mathbf{y}\mapsto \min \{\mathbf{g},\max \{\mathbf{y},\mathbf{h}\}\}$
is not slantly differentiable and, moreover, since the map
 $\mathbf{F}$
, defined in (7.14), is neither convex nor concave, any generalized notion of derivative for this function will not possess any monotonicity properties.
For the reasons outlined above, we now describe, following Bokanowski et al. (Reference Bokanowski, Maroso and Zidani2009, Section 5), a convergent scheme that cannot be cast as a Newton-type method but can be understood as a two-level Howard’s algorithm. We begin by defining, for
 $\mathbf{y}\in \mathbb{R}^{N}$
and
 $i\in \{1,\ldots ,N\}$
, the element
 $\unicode[STIX]{x1D6FD}(\mathbf{y},i)\in {\mathcal{B}}$
by the condition
 $$\begin{eqnarray}\mathbf{F}(\mathbf{y})_{i}=\sup _{\unicode[STIX]{x1D6FC}\in {\mathcal{A}}}[\mathbf{K}^{\unicode[STIX]{x1D6FC},\unicode[STIX]{x1D6FD}(\mathbf{y},i)}\mathbf{y}-\mathbf{f}^{\unicode[STIX]{x1D6FC},\unicode[STIX]{x1D6FD}(\mathbf{y},i)}]_{i}.\end{eqnarray}$$
With this at hand, we define
 $\unicode[STIX]{x1D737}(\mathbf{y})\in {\mathcal{B}}^{N}$
by
 $\unicode[STIX]{x1D737}(\mathbf{y})_{i}=\unicode[STIX]{x1D737}(\mathbf{y},i)$
, and the mapping
 $\mathbf{F}^{\unicode[STIX]{x1D737}(\mathbf{y})}:\mathbb{R}^{N}\rightarrow \mathbb{R}^{N}$
is such that
 $$\begin{eqnarray}\mathbf{F}^{\unicode[STIX]{x1D737}(\mathbf{y})}(\mathbf{w})_{i}=\sup _{\unicode[STIX]{x1D6FC}\in {\mathcal{A}}}[\mathbf{K}^{\unicode[STIX]{x1D6FC},\unicode[STIX]{x1D6FD}(\mathbf{y},i)}\mathbf{w}-\mathbf{f}^{\unicode[STIX]{x1D6FC},\unicode[STIX]{x1D6FD}(\mathbf{y},i)}]_{i},\quad i=1,\ldots ,N.\end{eqnarray}$$
The generalization of Howard’s method is described in Algorithm 7.1.

Note that, owing to the definition of
 $\mathbf{F}^{\unicode[STIX]{x1D737}(\mathbf{y})}$
given in (7.15)–(7.16), every step of Algorithm 7.1 requires the solution of a discrete Hamilton–Jacobi–Bellman equation (7.17). This can be done by applying Algorithm 5.1 and justifies calling this method a two-level one. The convergence properties of Algorithm 7.1 are described below.
Proposition 7.27 (convergence of two-level Howard).
Let
 ${\mathcal{A}}$
and
 ${\mathcal{B}}$
be finite sets. Assume that, for every
 $\unicode[STIX]{x1D737}\in {\mathcal{B}}^{N}$
, the map
 $\mathbf{F}^{\unicode[STIX]{x1D737}}$
is monotone in the sense of Definition 3.5. Then the sequence of iterates, given by Algorithm 7.1 satisfies
 $\mathbf{x}_{k}\geq \mathbf{x}_{k+1}$
and converges, in a finite number of steps, to
 $\mathbf{x}$
, the solution of (7.14).
Proof. Using equations (7.15)–(7.16), line 3 of Algorithm 7.1 and identity (7.17), we observe that the iterates
 $\{\unicode[STIX]{x1D737}_{k}\}_{k\in \mathbb{N}}$
and
 $\{\mathbf{x}_{k}\}_{k\in \mathbb{N}}$
satisfy
 $$\begin{eqnarray}\mathbf{F}^{\unicode[STIX]{x1D737}_{k+1}}(\mathbf{x}_{k})=\mathbf{F}^{\unicode[STIX]{x1D737}(\mathbf{x}_{k})}(\mathbf{x}_{k})=\mathbf{F}(\mathbf{x}_{k})\leq \mathbf{F}^{\unicode[STIX]{x1D737}_{k}}(\mathbf{x}_{k})=\mathbf{0}=\mathbf{F}^{\unicode[STIX]{x1D737}_{k+1}}(\mathbf{x}_{k+1}),\end{eqnarray}$$
so that, from the monotonicity of
 $\mathbf{F}^{\unicode[STIX]{x1D737}_{k+1}}$
, we conclude that
 $\mathbf{x}_{k}\geq \mathbf{x}_{k+1}$
.
As in Theorem 5.31, the fact that
 $\#{\mathcal{B}}$
is finite together with the monotonicity of iterates imply that Algorithm 7.1 converges in a finite number of steps.
We conclude the discussion on Algorithm 7.1 by commenting that the case when
 ${\mathcal{A}}$
and
 ${\mathcal{B}}$
are compact spaces and when equation (7.17) is only solved approximately are also discussed by Bokanowski et al. (Reference Bokanowski, Maroso and Zidani2009).
In addition to Algorithm 7.1, we present the Richardson-type iterative scheme of Kuo and Trudinger (Reference Kuo and Trudinger1992, Section 4.2). Starting from
 $\mathbf{x}_{0}\in \mathbb{R}^{N}$
, the iterates are computed via
 $$\begin{eqnarray}\mathbf{x}_{k+1}=\mathbf{G}(\mathbf{x}_{k}):=\mathbf{x}_{k}-\displaystyle \frac{1}{\unicode[STIX]{x1D6EC}_{N}}\mathbf{F}(\mathbf{x}_{k}),\end{eqnarray}$$
where
 $\unicode[STIX]{x1D6EC}_{N}>0$
is a sufficiently large constant that depends on
 $N$
. It is shown there that, for
 $\unicode[STIX]{x1D6EC}_{N}\geq CN^{2/d}$
, the mapping
 $\mathbf{G}$
is a contraction, that is, there is a constant
 $C>0$
such that
 $$\begin{eqnarray}|\mathbf{G}(\mathbf{v})-\mathbf{G}(\mathbf{w})|\leq \biggl(1-\displaystyle \frac{N^{-2/d}}{C}\biggr)|\mathbf{v}-\mathbf{w}|,\end{eqnarray}$$
so that (7.18) is convergent. Some strategies that combine Algorithm 7.1 and (7.18) are suggested in González and Tidball (Reference González and Tidball1992).
8 Outlook
Overall we know too much about linear PDE and too little about nonlinear PDE. L. C. Evans
In this paper we have summarized some of the recent trends and advances in the discretizations and convergence analysis for strongly nonlinear PDEs, with an emphasis on convex and non-convex fully nonlinear equations. While these two classes of equations and discretization types have fundamentally different structure conditions, common themes permeate the analysis; for example, consistency, monotonicity and comparison principles, Alexandrov–Bakelman–Pucci estimates, wide stencils and smooth approximations. It is also evident from our discussion that, due to the pointwise definition of viscosity solutions and, correspondingly, the monotonicity criterion given in the Barles–Souganidis framework, there is a stark contrast between finite difference schemes and finite element methods for such problems; only within the last 10 years have any significant advances been made in the convergence analysis of finite element-type methods.
Despite the recent flurry of results for numerical fully nonlinear PDEs, there still remain fundamental open problems in the field. Probably the most pressing, at least on the finite element front, is an alternative framework that bypasses or relaxes the monotonicity requirement found in the Barles–Souganidis theory. Other completely open problems include, but are not limited to:
-
(i) derivation of sharp rates of convergence for non-convex fully nonlinear equations,
-
(ii) rates of convergence for finite difference schemes on unstructured grids,
-
(iii) rates of convergence of finite element methods for convex and non-convex PDEs in other norms, for example Sobolev norms such as
$H^{1}$
, -
(iv) a posteriori error estimation and adaptive methods for fully nonlinear problems,
-
(v) rates of convergence for non-convex degenerate problems.

In light of these questions we feel that the quote from the preface of Evans (Reference Evans2010) given above nicely summarizes the current state of numerical PDEs. We hope that this overview will motivate current and future researchers to work on the numerical approximation of nonlinear problems.
Acknowledgements
The authors are grateful that they were given the opportunity to write this review.
The first two authors were supported in part by the US National Science Foundation grants DMS-1417980 (Neilan) and DMS-1418784 (Salgado), and the Alfred Sloan Foundation (Neilan). This work was initiated at the conference ‘Nonlinear PDEs, Numerical Analysis, and Applications’ at the University of Pittsburgh, which was supported by NSF grant DMS-1541585, an IMA conference grant, and the Mathematical Research Center, University of Pittsburgh.