1 Introduction
Hopf bifurcations and the ensuing dynamics are ubiquitous throughout physics. In fluid dynamics, the interest in Hopf bifurcations is motivated by both practical and theoretical considerations. From a practical perspective, Hopf bifurcations are inherent features of many fluid dynamic systems with engineering significance, such as vortex-induced vibrations, wake dynamics and instabilities (Provansal, Mathis & Boyer Reference Provansal, Mathis and Boyer1987; Sreenivasan, Strykowski & Olinger Reference Sreenivasan, Strykowski, Olinger and Ghia1987; Huerre & Monkewitz Reference Huerre and Monkewitz1990). Theoretical investigations are of interest due to the impact on a variety of nonlinear dynamical systems phenomena, including theories of the onset of turbulence (Ruelle & Takens Reference Ruelle and Takens1971; Landau & Lifshitz Reference Landau and Lifshitz1987). In fluid dynamics, the near-wake dynamics of a stationary cylinder subjected to a sufficiently large steady streamwise flow Reynolds number (the bifurcation parameter) is a well-established physical realization of a Hopf bifurcation (Sreenivasan et al. Reference Sreenivasan, Strykowski, Olinger and Ghia1987).
In order to understand the development of Hopf bifurcation dynamics when subjected to external influences, it is informative to study systems with applied forcing. The forcing could represent a controller input or it could result from coupling between the fluid dynamics and another dynamical system such as in fluid–structure interaction problems. Correspondingly, flows over oscillating cylinders have been the subject of several numerical and experimental studies (Provansal et al.
Reference Provansal, Mathis and Boyer1987; Cetiner & Rockwell Reference Cetiner and Rockwell2001; Konstantinidis & Balabani Reference Konstantinidis and Balabani2007; Leontini, Jacono & Thompson Reference Leontini, Jacono and Thompson2011, Reference Leontini, Jacono and Thompson2013). Typically, these studies have been motivated by the fluid–structure interaction vortex-induced vibration (VIV) problem. Although a variety of oscillation (forcing) amplitudes have been investigated, much of the streamwise oscillating cylinder studies have focused on VIV relevant frequency conditions in which a prescribed cylinder oscillation frequency,
 $f$
, corresponds to a low-order harmonic of the stationary cylinder natural shedding frequency,
 $f_{0}$
. The
 $1\leqslant f/f_{0}\leqslant 2$
regime has been thoroughly investigated (Leontini et al.
Reference Leontini, Jacono and Thompson2011, Reference Leontini, Jacono and Thompson2013). Synchronization between the vortex shedding dynamics and
 $f$
, as well as quasi-periodicity for non-synchronized conditions, are well-established phenomena that can occur in this regime.
However, the simple harmonically forced cylinder system is not limited to synchronization or quasi-periodic dynamics. Two-dimensional simulations by Perdikaris, Kaiktsis & Triantafyllou (Reference Perdikaris, Kaiktsis and Triantafyllou2009) have indicated the presence of chaos at certain amplitudes when
 $f/f_{0}=1$
. Perdikaris et al. (Reference Perdikaris, Kaiktsis and Triantafyllou2009) attributed aperiodic behaviour observed in the lift force as a manifestation of chaos caused by competition between the spatial structures of the natural shedding mode (spatially anti-symmetric) and the forced mode (spatially symmetric). These results from Perdikaris et al. (Reference Perdikaris, Kaiktsis and Triantafyllou2009) demonstrate the rich and potentially complex dynamical states that can be achieved from simple harmonic forcing of the canonical cylinder flow problem. It is interesting to note that the explanation offered for aperiodicity in the observable functional (i.e. lift force) was based on the underlying Navier–Stokes system states (i.e. velocity mode shapes), rather than through a direct mathematical expression of the observable dynamics that exhibited chaotic symptoms. In this study, a dynamics-of-observables perspective is taken in which an equation directly describing the evolution of the functional of interest (lift force) is used to provide theoretical understanding for the observed phenomena.
Although lock-on and synchronization regimes of systems forced near resonances are well understood, the underlying chaotic or quasi-periodic dynamics when forcing far away from a natural frequency is not. This behaviour can be critical for systems of practical significance, such as oscillating airfoils undergoing dynamic stall (McCroskey Reference McCroskey1982) where
 $f$
can be at least one order of magnitude lower than the separated flow shedding frequency of the stationary airfoil. Therefore, study of canonical systems such as the oscillating cylinder for
 $f\ll \,f_{0}$
can lend insight into unexplored periodically forced bifurcation parameter regimes that may advance fundamental understanding of more complex practical situations.
As discussed, periodically forced Hopf bifurcation flows such as oscillating cylinders can exhibit a variety of dynamical phenomena, ranging from lock-on/synchronization to chaos. Typically, a spectral perspective corresponding to a local measurement (i.e. velocity at a particular location in the wake) or an integrated measurement (i.e. lift force) has been utilized to characterize the dynamics. The spectral perspective is ideal for cylinder wake shedding dynamics given that much of Hopf bifurcation theory deals with parametric changes in eigenvalues in the vicinity of a critical value, e.g. Wiggins (Reference Wiggins1990). Therefore, a spectral approach seems appropriate for extension to forced bifurcation flows in which we seek to track the development of dynamically relevant post-bifurcation features, such as the shedding mode, as forcing is applied. However, typically the transition from the nonlinear, infinite-dimensional Navier–Stokes description to a reduced-order set of equations considered in Hopf bifurcation normal form theory is difficult. Detailed theoretical treatments of forced flows involving natural Hopf bifurcations based on spectral decompositions of the velocity field and application of multi-scale analysis have yielded insight into some interactions between the bifurcation mode and the forcing that are possible (Luchtenburg et al.
Reference Luchtenburg, Gunther, Noack, King and Tadmor2009; Sipp Reference Sipp2012; Brunton & Noack Reference Brunton and Noack2015). These theoretical treatments have led to insight into important phenomena, particularly those that can be attributed to discrete spectral interactions associated with
 $f_{0}\pm f$
, as well as stability considerations when forcing is applied.
Recently, modal decomposition methods for the analysis of both finite and infinite-dimensional nonlinear systems based on spectral properties of evolution operators have emerged (Mezić Reference Mezić2005, Reference Mezić2013; Rowley et al. Reference Rowley, Mezić, Bagheri, Schlatter and Henningson2009; Budisic & Mezić Reference Budisic and Mezić2012). This framework has the remarkable capability of capturing the full nonlinear dynamics by merging applied ergodic theory with operator theory to identify key spectral properties of an evolution operator attributed to Koopman (Koopman Reference Koopman1931; Mezić Reference Mezić2005). These operators are defined for any nonlinear system, and modal decompositions of nonlinear systems based on spectral analysis of the Koopman operator can be derived from measured data without the need for linearization (Rowley et al. Reference Rowley, Mezić, Bagheri, Schlatter and Henningson2009) and when expansion-based theoretical treatments such as those in Luchtenburg et al. (Reference Luchtenburg, Gunther, Noack, King and Tadmor2009) and Sipp (Reference Sipp2012) are not possible because one does not have access to governing equations. Moreover, spectral decompositions derived from the Koopman operator lead to spatial modes valid in all of phase space, not just locally, and the modes correspond to specific frequencies and growth/decay rates (Koopman Reference Koopman1931; Mezić Reference Mezić2013). Thus, these so-called ‘Koopman modes’ provide a qualitative fully nonlinear analogue to the familiar notion of global modes (see the discussion in Huerre & Monkewitz (Reference Huerre and Monkewitz1990) on linearized global modes). While recent progress illuminating the spectral properties of the Koopman operators show considerable promise, there remain a number of fundamental research issues. For instance, the important effects of periodic excitation of bifurcation parameters have not been studied.
Various approaches for computing Koopman modes are summarized in Mezić (Reference Mezić2013). The interpretation of the dynamic mode decomposition (DMD) method (Schmid Reference Schmid2010) as an approximate approach for calculating Koopman modes was established in Rowley et al. (Reference Rowley, Mezić, Bagheri, Schlatter and Henningson2009). Koopman and DMD analysis have recently been applied to post-bifurcation wake dynamics of flow past a stationary cylinder (Chen, Tu & Rowley Reference Chen, Tu and Rowley2011; Bagheri Reference Bagheri2013, Reference Bagheri2014; Wynn et al. Reference Wynn, Pearson, Ganapathisubramani and Goulart2013). Chen et al. (Reference Chen, Tu and Rowley2011) and Wynn et al. (Reference Wynn, Pearson, Ganapathisubramani and Goulart2013) introduced improved numerical methods to generalize DMD and obtain more accurate approximations of the Koopman modes, while Bagheri (Reference Bagheri2013) established the linkages between the complex-valued Landau equation (i.e. first-order normal form) describing Hopf bifurcations and the Koopman operator. The effects of noise on the Koopman decompositions of stationary cylinder flow were later treated in Bagheri (Reference Bagheri2014). However, Koopman-theoretic analyses of periodically forced bifurcation systems have not been pursued – neither within the context of fluid dynamics nor outside of it – and we do that here. By considering a separation in scale between the forcing and natural frequencies, we find a physical realization of a novel dynamics regime that we dub the quasi-periodic intermittency due to the interchange of quiescent and oscillatory regimes of flow. This regime is interesting since it combines the properties of quasi-periodicity with intermittency, and presents us with a novel type of an attractor in a simple form that reflects more complex attractors responsible for a variety of transition regimes from laminar to turbulent flows. Methodologically, we develop a procedure for deriving normal forms in nonlinear field theories, such as the Navier–Stokes equations, by utilizing the Koopman mode decomposition.
In this paper, we utilize Koopman decompositions of cylinder flow fields due to prescribed streamwise velocity oscillations superimposed on a steady flow component to gain understanding of dynamics for the separation-of-scale regime
 $f\ll \,f_{0}$
. The cylinder flow problem, two-dimensional computational fluid dynamics (CFD) implementation and the connections to Hopf bifurcation dynamics are briefly described in § 2. A summary of Koopman-operator-based theory and numerical implementation is provided in § 3. In § 4, the effect of forcing is derived from a dynamics-of-observables perspective where it is shown that oscillating the streamwise Reynolds number is equivalent to exciting the Hopf bifurcation parameter. A centre-manifold reduction using Koopman modes is described next, followed by further simplification of nonlinearities using normal form theory. Finally, results are presented in § 5 which establish the accuracy of the reduced-order normal form mathematical models and provide theoretically grounded evidence of a new dynamical systems phenomenon that occurs in the
 $f\ll \,f_{0}$
regime.
2 Cylinder flow
Two-dimensional CFD simulations of a streamwise oscillating circular cylinder are considered. For the stationary cylinder, the system can be expressed in the general dynamical systems form given by
 $$\begin{eqnarray}\dot{\boldsymbol{z}}=\boldsymbol{F}(\boldsymbol{z}),\end{eqnarray}$$
where
 $\boldsymbol{z}$
is the vector of streamwise and transverse velocity components in the discretized domain and
 $\boldsymbol{F}$
are the discretized incompressible Navier–Stokes equations. When the oncoming streamwise flow is oscillated, the forced Navier–Stokes equations can be written in the following format:
 $$\begin{eqnarray}\dot{\boldsymbol{z}}=\boldsymbol{F}(\boldsymbol{z})+B\boldsymbol{u}(t).\end{eqnarray}$$
The external forcing applied to the system is represented by
 $u(t)$
, while the linear operator
 $B$
allows us to take into account the fact that forcing (i.e. prescribed oscillation of the cylinder) can enter via boundary conditions, like in our problem, and thus the forcing does not necessarily affect all the states in structurally the same way. Similar to the implementation described in Perdikaris et al. (Reference Perdikaris, Kaiktsis and Triantafyllou2009), at the domain inlet and lateral boundary, the elements of
 $B\boldsymbol{u}$
are
 $2q\sin (\unicode[STIX]{x1D714}_{f}t)$
for the streamwise velocity components, and 0 for the transverse components. Furthermore,
 $\boldsymbol{F}(\boldsymbol{z})=0$
is at the inlet boundary. At all other locations in the domain away from the inlet boundary,
 $B=0$
. The amplitude of the oscillation is controlled by
 $q$
, and the prescribed frequency is
 $\unicode[STIX]{x1D714}_{f}=2\unicode[STIX]{x03C0}f$
.
As in Leontini et al. (Reference Leontini, Jacono and Thompson2013), the CFD equations are solved in a frame of reference attached to the moving cylinder. Therefore, the resultant oncoming streamwise flow velocity
 $u_{\infty }$
over the cylinder is
 $$\begin{eqnarray}u_{\infty }(t)=u_{0}-\frac{2q}{\unicode[STIX]{x1D714}_{f}}\cos (\unicode[STIX]{x1D714}_{f}t),\end{eqnarray}$$
where
 $u_{0}$
is the steady component of the free stream. Since sinusoidal cylinder motions are prescribed, the oscillatory Reynolds number
 $Re$
is
 $$\begin{eqnarray}Re(t)=Re_{0}-Re_{q}\sin (\unicode[STIX]{x1D714}_{f}t),\end{eqnarray}$$
where
 $Re_{0}=u_{0}D/\unicode[STIX]{x1D708}$
,
 $Re_{q}=2qD/(\unicode[STIX]{x1D714}_{f}\unicode[STIX]{x1D708})$
,
 $\unicode[STIX]{x1D708}$
is the kinematic viscosity which is held fixed and
 $D$
is the cylinder diameter. The commercial software package, CFD
 $++$
was used for all CFD solutions of (2.1) and (2.2). The CFD
 $++$
framework is a finite-volume-based solver and is second-order accurate in space. Implicit, dual time stepping was employed.
The connections between Hopf bifurcation dynamics and flow past a stationary cylinder are well known (Sreenivasan et al.
Reference Sreenivasan, Strykowski, Olinger and Ghia1987). In such systems, a critical Hopf bifurcation parameter
 $\unicode[STIX]{x1D707}$
exists such that:
-
(i) For
 $\unicode[STIX]{x1D707}<0$
: perturbations to the system decay,
-
(ii) For
$\unicode[STIX]{x1D707}=0$
: the system is neutrally stable and initial perturbations induce oscillations that neither decay nor grow, -
(iii) For
$\unicode[STIX]{x1D707}>0$
: initial perturbation amplitudes grow in a transient manner until reaching a saturation value; the system is characterized by limit cycle oscillations for long time.


The Hopf bifurcation limit cycle frequency corresponds to the von Kármán wake shedding mode and
 $\unicode[STIX]{x1D707}$
is proportional to
 $(Re_{0}-Re_{c})$
, where
 $Re_{c}$
is the critical value at which vortex shedding initiates (Sreenivasan et al.
Reference Sreenivasan, Strykowski, Olinger and Ghia1987). Without loss of generality, we consider the critical bifurcation value to be
 $\unicode[STIX]{x1D707}=\unicode[STIX]{x1D707}_{0}=0$
. This dynamics can be expressed by the classical Landau equation (i.e. first-order normal form equation),
 $$\begin{eqnarray}\dot{\unicode[STIX]{x1D702}}=\unicode[STIX]{x1D706}_{1}(\unicode[STIX]{x1D707})\unicode[STIX]{x1D702}+\unicode[STIX]{x1D6FD}(\unicode[STIX]{x1D707})\unicode[STIX]{x1D702}^{2}\bar{\unicode[STIX]{x1D702}},\end{eqnarray}$$
where
 $\unicode[STIX]{x1D702}$
represents a time-dependent state governed by the bifurcation dynamics (e.g. velocity in the cylinder wake, integrated lift force, etc.),
 $\unicode[STIX]{x1D706}_{1}(\unicode[STIX]{x1D707})$
is complex valued such that
 $\text{Im}[\unicode[STIX]{x1D706}_{1}(\unicode[STIX]{x1D707})]$
corresponds to the von Kármán wake shedding frequency,
 $\text{Re}[\unicode[STIX]{x1D706}_{1}(\unicode[STIX]{x1D707})]$
is the associated growth/decay rate and
 $\unicode[STIX]{x1D6FD}(\unicode[STIX]{x1D707})$
is a complex-valued parameter that affects the limit cycle saturation amplitude and frequency. Identification of the parameters in (2.5) as functions of
 $Re_{0}$
for stationary cylinder wake shedding was established by Sreenivasan et al. (Reference Sreenivasan, Strykowski, Olinger and Ghia1987). In the following sections, we extend the standard Hopf bifurcation normal form (2.5) to account for the effects of forcing,
 $B\boldsymbol{u}(t)$
.
3 Koopman mode decomposition
A summary of Koopman modal analysis is provided in this section. The modal analysis stems from a decomposition of an infinite linear dimensional operator that captures the dynamics of an arbitrary observable functional, even if the observable is a nonlinear function of a dynamical system state. By utilizing such an approach, the dynamics of some measurable quantity can be described directly and without linearization of the underlying dynamical system. Additional details can be found in Mezić (Reference Mezić2013).
3.1 Continuous time
For the general dynamical system (2.1) defined on a state space
 $A$
(i.e.
 $\boldsymbol{z}\in A$
), where
 $\boldsymbol{z}$
is a
 $\mathbb{R}^{N}$
vector and
 $\boldsymbol{F}$
is a possibly nonlinear vector-valued function of the same dimension as its argument
 $\boldsymbol{z}$
. We denote by
 $\boldsymbol{S}^{t}(\boldsymbol{z}_{0})$
the position at time
 $t$
of a trajectory corresponding to (2.1) that starts at initial condition
 $\boldsymbol{z}_{0}$
.
An arbitrary vector-valued observable from
 $A$
to
 $\mathbb{R}^{p}$
is denoted by
 $\boldsymbol{g}$
. The value of
 $\boldsymbol{g}$
at time
 $t$
starting from the system trajectory initial condition
 $\boldsymbol{z}_{0}$
is
 $$\begin{eqnarray}\boldsymbol{g}(t,\boldsymbol{z}_{0})=\boldsymbol{g}(\boldsymbol{S}^{t}(\boldsymbol{z}_{0})).\end{eqnarray}$$
Note that the space of observables
 $\boldsymbol{g}$
is a vector space. The family of operators
 $U^{t},$
acting on the space of observables parameterized by time
 $t$
is defined by
 $$\begin{eqnarray}U^{t}\boldsymbol{g}(\boldsymbol{z}_{0})=\boldsymbol{g}(\boldsymbol{S}^{t}(\boldsymbol{z}_{0})).\end{eqnarray}$$
Thus, for a fixed time
 $\unicode[STIX]{x1D70F}$
,
 $U^{\unicode[STIX]{x1D70F}}$
maps the vector-valued observable
 $\boldsymbol{g}(\boldsymbol{z}_{0})$
to
 $\boldsymbol{g}(\unicode[STIX]{x1D70F},\boldsymbol{z}_{0})$
. With some abuse of language we will call the family of operators
 $U^{t}$
the Koopman operator of the continuous-time system given by (2.1). This operator was defined for the first time in Koopman (Reference Koopman1931), for Hamiltonian systems. In operator theory, such operators, when defined for general dynamical systems, are often called composition operators, since
 $U^{t}$
acts on observables by composing them with the mapping
 $\boldsymbol{S}^{t}$
(Singh & Manhas Reference Singh and Manhas1993).
The operator
 $U^{t}$
is linear as can be easily seen from its definition by (3.2), and thus it makes sense to consider its spectral properties in the context of analysing (2.1). In this direction, we will be looking for special observables
 $\unicode[STIX]{x1D719}(\boldsymbol{z}):A\rightarrow \mathbb{C}$
on the state space that have the evolution in time given by
 $$\begin{eqnarray}U^{t}\unicode[STIX]{x1D719}(\boldsymbol{z}_{0})=\unicode[STIX]{x1D719}(\boldsymbol{S}^{t}(\boldsymbol{z}_{0}))=\exp (\unicode[STIX]{x1D706}t)\unicode[STIX]{x1D719}(\boldsymbol{z}_{0}).\end{eqnarray}$$
Such observables (functions)
 $\unicode[STIX]{x1D719}$
are the eigenfunctions of
 $U^{t}$
, and the associated complex numbers
 $\unicode[STIX]{x1D706}$
are the eigenvalues of
 $U^{t}$
.
For quasi-periodic attractors, the observables can be expanded onto a basis system spanned by the Koopman eigenfunctions as (Mezić Reference Mezić2005, Reference Mezić2013)
 $$\begin{eqnarray}\boldsymbol{g}(t,\boldsymbol{z}_{0})=\mathop{\sum }_{j=1}^{\infty }\unicode[STIX]{x1D719}_{j}(\boldsymbol{z})\boldsymbol{s}_{j}=\mathop{\sum }_{j=1}^{\infty }U^{t}\unicode[STIX]{x1D719}_{j}(\boldsymbol{z}_{0})\boldsymbol{s}_{j}=\mathop{\sum }_{j=1}^{\infty }\text{e}^{\unicode[STIX]{x1D706}_{j}t}\boldsymbol{v}_{j}(\boldsymbol{z}_{0})+\text{e}^{\bar{\unicode[STIX]{x1D706}}_{j}t}\bar{\boldsymbol{v}}_{j}(\boldsymbol{z}_{0}),\end{eqnarray}$$
where
 $\boldsymbol{s}_{j}$
are the Koopman modes and represent the projections of the observables onto the eigenfunctions,
 $\boldsymbol{v}(\boldsymbol{z}_{0})=\unicode[STIX]{x1D719}_{j}(\boldsymbol{z}_{0})\boldsymbol{s}_{j}$
and
 $\bar{\unicode[STIX]{x1D706}}_{j}$
,
 $\bar{\boldsymbol{v}}_{j}$
are the complex conjugates of
 $\unicode[STIX]{x1D706}_{j}$
and
 $\boldsymbol{v}_{j}$
respectively.
3.2 Discrete time and computation of Koopman modes
Due to the discrete nature of numerical simulations or experimental data, the dynamical system can be described by a discrete sequence of state values or observables:
 $$\begin{eqnarray}\boldsymbol{z}_{k+1}=\boldsymbol{F}(\boldsymbol{z}_{k})\end{eqnarray}$$
and a discrete sequence of
 $U^{k\unicode[STIX]{x0394}t};k=0;\cdots \,;N$
is obtained. It is easy to show that the discrete version of (3.4) is (Mezić Reference Mezić2005, Reference Mezić2013)
 $$\begin{eqnarray}\boldsymbol{g}(\boldsymbol{z}_{k})=\mathop{\sum }_{j=1}^{\infty }\unicode[STIX]{x1D719}_{j}(\boldsymbol{z}_{k})\boldsymbol{s}_{j}=\mathop{\sum }_{j=1}^{\infty }U^{k}\unicode[STIX]{x1D719}_{j}(\boldsymbol{z}_{0})\boldsymbol{s}_{j}=\mathop{\sum }_{j=1}^{\infty }\unicode[STIX]{x1D706}_{j}^{k}\boldsymbol{v}_{j}(\boldsymbol{z}_{0})+\bar{\unicode[STIX]{x1D706}}_{j}^{k}\bar{\boldsymbol{v}}_{j}(\boldsymbol{z}_{0}).\end{eqnarray}$$
Koopman modes can in principle be computed directly based on snapshots of the flow, using the generalized Laplace analysis (Mezić Reference Mezić2013). The Koopman modes can also be approximated by using an Arnoldi-like algorithm (Schmid & Sesterhenn Reference Schmid and Sesterhenn2008; Rowley et al. Reference Rowley, Mezić, Bagheri, Schlatter and Henningson2009) which computes eigenvalues based on the so-called companion matrix.
Given a sequence of equispaced in time snapshots from numerical simulations or physical experiments, with
 $\unicode[STIX]{x0394}t$
being the time interval between snapshots, a data matrix is formed, columns of which represent the individual data samples
 $u_{j}\in \mathbb{R}^{n}$
,
 $j=0;\cdots \,;m$
with
 $j$
representing time
 $j\unicode[STIX]{x0394}t$
. The companion matrix is then defined as:
 $$\begin{eqnarray}\unicode[STIX]{x1D63E}=\left(\begin{array}{@{}ccccc@{}}0 & 0 & \cdots \, & 0 & c_{0}\\ 1 & 0 & & 0 & c_{1}\\ 0 & 1 & & 0 & c_{2}\\ \vdots & & \ddots & & \vdots \\ 0 & 0 & \cdots \, & 1 & c_{m-1}\end{array}\right),\end{eqnarray}$$
where
 $c_{i},i=0,\ldots ,m-1$
are such that:
 $$\begin{eqnarray}u_{m}=\mathop{\sum }_{j=0}^{m-1}c_{i}u_{i}+\boldsymbol{r}\end{eqnarray}$$
and
 $\boldsymbol{r}$
is the residual vector.
The spectrum of the Koopman operator restricted to the subspace spanned by
 $u_{j}$
is equal to the spectrum of the infinite-dimensional companion matrix and the associated Koopman modes are given by
 $\unicode[STIX]{x1D646}\boldsymbol{a}$
(provided that
 $\boldsymbol{a}$
does not belong to the null space of
 $\unicode[STIX]{x1D646}$
), where
 $\unicode[STIX]{x1D646}=[u_{0};u_{1}\cdots \,;u_{m-1}]$
is the column matrix (vector valued) of observables snapshots at times
 $0;\unicode[STIX]{x0394}t;\cdots \,;(m-1)\unicode[STIX]{x0394}t$
and
 $\boldsymbol{a}$
is an eigenvector of the shift operator restricted to Krylov subspace spanned by
 $u_{i}$
which the companion matrix is an approximation of. The approximate Koopman eigenvalues and eigenvectors obtained by the Arnoldi’s algorithm are sometimes called Ritz eigenvalues and eigenvectors.
The standard Arnoldi-type algorithm to calculate the Ritz eigenvalues
 $\unicode[STIX]{x1D6FD}_{j}$
and eigenfunctions
 $v_{j}$
is as follows:
-
(i) Define
$\unicode[STIX]{x1D646}=[u_{0},u_{1},\ldots ,u_{m-1}]$
. -
(ii) Find constants
$c_{j}$
such that: (3.9)This can be done by defining
$$\begin{eqnarray}\boldsymbol{r}=u_{m}-\mathop{\sum }_{j=0}^{m-1}c_{j}u_{j}=u_{m}-\unicode[STIX]{x1D646}c,\quad \boldsymbol{r}\bot \text{span}\{u_{0},\ldots ,u_{m-1}\}.\end{eqnarray}$$
$c=K^{+}u_{m}$
where
$K^{+}$
is the pseudo inverse of
$\unicode[STIX]{x1D646}$
.
-
(iii) Define the companion matrix
$\unicode[STIX]{x1D63E}$
by (3.7) and find its eigenvalues and eigenvectors: (3.10)where eigenvectors are columns of
$$\begin{eqnarray}\unicode[STIX]{x1D63E}=T^{-1}\unicode[STIX]{x1D6FC}T,\quad \unicode[STIX]{x1D6FC}=\text{diag}(\unicode[STIX]{x1D6FC}_{1},\ldots ,\unicode[STIX]{x1D6FC}_{m}),\end{eqnarray}$$
$T^{-1}$
. Note that the Vandermonde matrix,
$\tilde{\unicode[STIX]{x1D64F}}$
: (3.11)diagonalizes the companion matrix
$$\begin{eqnarray}\tilde{\unicode[STIX]{x1D64F}}=\left(\begin{array}{@{}ccccc@{}}1 & \unicode[STIX]{x1D6FC}_{1} & \unicode[STIX]{x1D6FC}_{1}^{2} & \cdots \, & \unicode[STIX]{x1D6FC}_{1}^{m-1}\\ 1 & \unicode[STIX]{x1D6FC}_{2} & \unicode[STIX]{x1D6FC}_{2}^{2} & \cdots \, & \unicode[STIX]{x1D6FC}_{2}^{m-1}\\ \vdots & \vdots & \vdots & \ddots & \vdots \\ 1 & \unicode[STIX]{x1D6FC}_{m} & \unicode[STIX]{x1D6FC}_{m}^{2} & \cdots \, & \unicode[STIX]{x1D6FC}_{m}^{m-1}\end{array}\right)\end{eqnarray}$$
$\unicode[STIX]{x1D63E}$
, as long as the eigenvalues
$\unicode[STIX]{x1D6FC}_{1},\ldots ,\unicode[STIX]{x1D6FC}_{m}$
are distinct.
-
(iv) Define
$v_{j}$
to be the columns of
$V=\unicode[STIX]{x1D646}\tilde{\unicode[STIX]{x1D64F}}^{-1}$
.



Then, the Arnoldi-type Koopman mode decomposition gives:
 $$\begin{eqnarray}\forall k=[0,1,\ldots ,m],\quad u_{k}=\mathop{\sum }_{j=1}^{m}\unicode[STIX]{x1D6FC}_{j}^{k}V(:,j).\end{eqnarray}$$
To fairly compare the contribution of all the Koopman modes, the eigenvectors of the companion matrix
 $\unicode[STIX]{x1D63E}$
can be normalized to be unitary i.e. the column of
 $T^{-1}$
are normalized to have norm 1. Let
 $N_{j}=\Vert T^{-1}(:,j)\Vert$
and
 $V_{N}(:,j)=\unicode[STIX]{x1D646}T^{-1}(:,j)/N_{j}$
, then:
 $$\begin{eqnarray}\forall k=[0,1,\ldots ,m],\quad u_{k}=\mathop{\sum }_{j=1}^{m}\unicode[STIX]{x1D6FC}_{j}^{k}V_{N}(:,j)N_{j}.\end{eqnarray}$$
4 Dynamics of observables with applied forcing
The evolution of an observable function of interest subject to applied forcing is developed in this section. The full-order representations are derived first, which explicitly show how forcing effects appear in the dynamics-of-observables equations. In order to obtain a lower-order representation that can be used to understand phenomena observed in the forced bifurcation systems, projections onto the unforced system Koopman shedding mode basis are described. This basis corresponds to the centre manifold of the unforced system. Finally, the nonlinearity in the reduced-order equations are simplified further for
 $f\ll \,f_{0}$
to obtain remarkably simple mathematical model equations that explain the salient features of the seemingly complex dynamical states.
4.1 Full-order equations
Considering the observables evolved by the Koopman operator as in (3.2), we denote
 $$\begin{eqnarray}\boldsymbol{g}(t,\boldsymbol{z}_{0})=\boldsymbol{g}(S^{t}\boldsymbol{z}_{0}).\end{eqnarray}$$
Note that
 $\boldsymbol{g}(t,\boldsymbol{z}_{0})$
depends on the initial condition
 $\boldsymbol{z}_{0}$
so we can think of it as a function in the Lagrangian frame – but in the state space, not in the physical space! We have
 $$\begin{eqnarray}\displaystyle \frac{\unicode[STIX]{x2202}\boldsymbol{g}(t,\boldsymbol{z}_{0})}{\unicode[STIX]{x2202}t} & = & \displaystyle \frac{\unicode[STIX]{x2202}\boldsymbol{g}(S^{t}\boldsymbol{z}_{0})}{\unicode[STIX]{x2202}t}=\unicode[STIX]{x1D735}\boldsymbol{g}(S^{t}\boldsymbol{z}_{0})\boldsymbol{\cdot }\frac{\unicode[STIX]{x2202}S^{t}\boldsymbol{z}_{0}}{\unicode[STIX]{x2202}t}\nonumber\\ \displaystyle & = & \displaystyle \dot{\boldsymbol{z}}\boldsymbol{\cdot }\unicode[STIX]{x1D735}\boldsymbol{g}(t,\boldsymbol{z}_{0})=\boldsymbol{F}(\boldsymbol{z})\boldsymbol{\cdot }\unicode[STIX]{x1D735}\boldsymbol{g}(t,\boldsymbol{z}_{0}),\end{eqnarray}$$
where (2.1) has been substituted for
 $\dot{\boldsymbol{z}}$
and the gradient operator corresponds to the state space. Equation (4.2) describes the evolution of observables starting from a smooth initial condition given by
 $\boldsymbol{g}(0,\boldsymbol{z}_{0})$
. In operator form, equation (4.2) can be written as
 $$\begin{eqnarray}\frac{\unicode[STIX]{x2202}\boldsymbol{g}}{\unicode[STIX]{x2202}t}=(\boldsymbol{F}\boldsymbol{\cdot }\unicode[STIX]{x1D735})\boldsymbol{g}=L\boldsymbol{g},\end{eqnarray}$$
where
 $L$
is the linear infinite-dimensional operator – the generator of Koopman operator evolution – that fully characterizes the evolution of
 $\boldsymbol{g}$
, which can be a nonlinear function of
 $\boldsymbol{z}$
. From (4.3), the Koopman operator is given by
 $$\begin{eqnarray}U^{t}=\text{e}^{Lt}.\end{eqnarray}$$
The linkages between the Landau equation (2.5) and the Koopman operator (4.4) for post-critical flow past a stationary cylinder were established in Bagheri (Reference Bagheri2013).
Now, an applied forcing
 $B\boldsymbol{u}(t),$
where
 $B$
is a linear operator and
 $\boldsymbol{u}$
is a vector in the same space as
 $\boldsymbol{z}$
, can be added to the Navier–Stokes equations, as in (2.2). Substituting the forced system (2.2) into (4.2) leads to
 $$\begin{eqnarray}\frac{\unicode[STIX]{x2202}\boldsymbol{g}(t,\boldsymbol{z}_{0})}{\unicode[STIX]{x2202}t}=(\boldsymbol{F}(\boldsymbol{z})+B\boldsymbol{u}(t))\boldsymbol{\cdot }\unicode[STIX]{x1D735}\boldsymbol{g}(t,\boldsymbol{z}_{0})=L\boldsymbol{g}+(B\boldsymbol{u}\boldsymbol{\cdot }\unicode[STIX]{x1D735})\boldsymbol{g}.\end{eqnarray}$$
Although the external forcing in the underlying system (2.2) appears as an additive term, it is clear from (4.5) that forcing appears as a bi-linear term in
 $\boldsymbol{g}$
and
 $\boldsymbol{u}$
when considering the time evolution of a general observable. Similarly, it is clear from (4.5) that additive forcing can only occur when considering dynamics of observables in the special case when
 $\boldsymbol{g}$
is a linear function of
 $\boldsymbol{z}$
. Therefore, the original additive forcing will lead to a parametric-type excitation in the observable evolution equation for the general case when
 $\boldsymbol{g}$
is a nonlinear function of
 $\boldsymbol{z}$
. Note that the forcing
 $\boldsymbol{u}$
could also be thought of as a control input; thus (4.5) also demonstrates that control studies involving dynamics-of-observables models based on additive forcing in the underlying system must involve a term multiplicative in control
 $\boldsymbol{u}$
, which in the simplest case reduces to a bi-linear term.
4.2 Koopman modes and the unforced system reduced-order model
In the vicinity of a non-hyperbolic fixed point in state space, the long-time behaviour can be accurately represented by the dynamics on the lower-dimensional centre manifold (Wiggins Reference Wiggins1990). Therefore, we truncate the projection in (3.4) by considering a subspace spanned by the Koopman eigenfunction and eigenvalue corresponding to
 $\text{Re}[\unicode[STIX]{x1D706}_{j}(\unicode[STIX]{x1D707}_{0})]=0$
and
 $\text{Im}[\unicode[STIX]{x1D706}_{j}(\unicode[STIX]{x1D707}_{0})]=\unicode[STIX]{x1D714}_{0}(\unicode[STIX]{x1D707}_{0})\neq 0$
. For flow over a stationary cylinder, this is the well-known von Kármán wake shedding (bifurcation) mode. If the Koopman eigensolutions are ordered such that
 $j=1$
is the bifurcation mode, then (3.4) is approximated by the truncated expansion
 $$\begin{eqnarray}\boldsymbol{g}(t,\boldsymbol{z}_{0})\approx \unicode[STIX]{x1D6FE}_{1}(t)\boldsymbol{v}_{1}(\boldsymbol{z}_{0})+\bar{\unicode[STIX]{x1D6FE}_{1}}(t)\bar{\boldsymbol{v}}_{1}(\boldsymbol{z}_{0})=\boldsymbol{V}\unicode[STIX]{x1D71E},\end{eqnarray}$$
where
 $\boldsymbol{V}=[\boldsymbol{v}_{1},\bar{\boldsymbol{v}}_{1}]\in \mathbb{C}^{p\times 2}$
, and
 $\unicode[STIX]{x1D71E}=[\unicode[STIX]{x1D6FE}_{1},\bar{\unicode[STIX]{x1D6FE}}_{1}]^{\text{T}}\in \mathbb{C}^{2\times 1}$
contains the complex-valued time-dependent coefficients
 $\unicode[STIX]{x1D6FE}_{1}$
and
 $\bar{\unicode[STIX]{x1D6FE}}_{1}$
which replace the exponential terms when considering reduced-order approximations (Susuki & Mezić Reference Susuki and Mezić2012). Substituting (4.6) into (4.2) and noting that
 $\boldsymbol{z}=\boldsymbol{g}^{-1}(\boldsymbol{g}(\boldsymbol{z}))$
leads to the reduced-order model,
 $$\begin{eqnarray}\dot{\unicode[STIX]{x1D71E}}=(\boldsymbol{V}^{\dagger }\boldsymbol{V})^{-1}\boldsymbol{V}^{\dagger }[\boldsymbol{F}\circ \boldsymbol{g}^{-1}(\boldsymbol{g}(\boldsymbol{V}\unicode[STIX]{x1D71E}))\boldsymbol{\cdot }\unicode[STIX]{x1D735}(\boldsymbol{V}\unicode[STIX]{x1D71E})].\end{eqnarray}$$
This two-dimensional reduced-order model can be re-written as
 $$\begin{eqnarray}\left[\begin{array}{@{}c@{}}\dot{\unicode[STIX]{x1D6FE}_{1}}\\ \dot{\bar{\unicode[STIX]{x1D6FE}_{1}}}\end{array}\right]=\left[\begin{array}{@{}cc@{}}\unicode[STIX]{x1D706}_{1}(\unicode[STIX]{x1D707}) & 0\\ 0 & \bar{\unicode[STIX]{x1D706}}_{1}(\unicode[STIX]{x1D707})\end{array}\right]\left[\begin{array}{@{}c@{}}\unicode[STIX]{x1D6FE}_{1}\\ \bar{\unicode[STIX]{x1D6FE}_{1}}\end{array}\right]+\hat{\boldsymbol{F}}(\unicode[STIX]{x1D6FE}_{1},\bar{\unicode[STIX]{x1D6FE}_{1}},\unicode[STIX]{x1D707}),\end{eqnarray}$$
where the right-hand side of (4.7) has been expressed as a linear term plus a nonlinear term, i.e.
 $$\begin{eqnarray}(\boldsymbol{V}^{\dagger }\boldsymbol{ V})^{-1}\boldsymbol{ V}^{\dagger }[\boldsymbol{F}\circ \boldsymbol{g}^{-1}(\boldsymbol{g}(\boldsymbol{V}\unicode[STIX]{x1D71E}))\boldsymbol{\cdot }\unicode[STIX]{x1D735}(\boldsymbol{V}\unicode[STIX]{x1D71E})]=\left[\begin{array}{@{}cc@{}}\unicode[STIX]{x1D706}_{1}(\unicode[STIX]{x1D707}) & 0\\ 0 & \bar{\unicode[STIX]{x1D706}}_{1}(\unicode[STIX]{x1D707})\end{array}\right]\left[\begin{array}{@{}c@{}}\unicode[STIX]{x1D6FE}_{1}\\ \bar{\unicode[STIX]{x1D6FE}_{1}}\end{array}\right]+\hat{\boldsymbol{F}}(\unicode[STIX]{x1D6FE}_{1},\bar{\unicode[STIX]{x1D6FE}_{1}},\unicode[STIX]{x1D707}).\end{eqnarray}$$
Equation (4.8) can be thought of as the projection of (4.2) onto the centre manifold spanned by the basis corresponding to the primary Koopman shedding (bifurcation) mode at
 $\unicode[STIX]{x1D707}=\unicode[STIX]{x1D707}_{0}$
. Since
 $\unicode[STIX]{x1D6FE}_{1}$
and
 $\bar{\unicode[STIX]{x1D6FE}}_{1}$
in (4.8) correspond to complex conjugate states, it is sufficient to solve one of the complex-valued differential equations,
 $$\begin{eqnarray}\dot{\unicode[STIX]{x1D6FE}}_{1}=\unicode[STIX]{x1D706}_{1}(\unicode[STIX]{x1D707})\unicode[STIX]{x1D6FE}_{1}+\hat{F}_{1}(\unicode[STIX]{x1D6FE}_{1},\bar{\unicode[STIX]{x1D6FE}}_{1},\unicode[STIX]{x1D707}),\end{eqnarray}$$
where
 $\hat{F}_{1}$
is the first element of the vector
 $\hat{\boldsymbol{F}}$
. It is important to note that, equations (4.8)–(4.10) are expressed as functions of the bifurcation parameter
 $\unicode[STIX]{x1D707}$
, even though the reduced order projections are based on the Koopman modes at
 $\unicode[STIX]{x1D707}=\unicode[STIX]{x1D707}_{0}$
. This is valid for values of
 $\unicode[STIX]{x1D707}$
in the vicinity of
 $\unicode[STIX]{x1D707}_{0}$
for dynamics projected onto the centre manifold; i.e. the Koopman modes at
 $\unicode[STIX]{x1D707}=\unicode[STIX]{x1D707}_{0}$
are a valid projection basis for all values of
 $\unicode[STIX]{x1D707}$
in the vicinity of
 $\unicode[STIX]{x1D707}_{0}$
since the orbit of the full-order system (4.3) near
 $\unicode[STIX]{x1D707}_{0}$
is determined by the solution restricted to the centre manifold (Wiggins Reference Wiggins1990).
4.3 Koopman modes and the forced system reduced-order model
The appropriate basis for model order reduction of the forced Hopf bifurcation system is considered next. We make the argument that the unforced Koopman modes at the Hopf bifurcation value of the Reynolds number (i.e.
 $\unicode[STIX]{x1D707}=\unicode[STIX]{x1D707}_{0}$
) can be used as the projection bases, even for the forced system. From (4.5), the dynamics of the forced system is described by the unforced linear operator
 $L$
plus an additional time-variant forcing term that is bi-linear in
 $\boldsymbol{u}$
and
 $\boldsymbol{g}$
. We know that the unforced Koopman eigenvalues and eigenfunctions satisfy
 $$\begin{eqnarray}L\unicode[STIX]{x1D719}_{i}(\boldsymbol{z})=\unicode[STIX]{x1D706}_{i}\unicode[STIX]{x1D719}_{i}(\boldsymbol{z}),\quad i=0,1,2,\ldots ,\infty .\end{eqnarray}$$
As a result, if we select a basis spanned by unforced system Koopman eigenfunctions, as in (3.4), then the full action of
 $L$
on
 $\boldsymbol{g}$
in (4.5) will be captured. If the forcing term is properly projected onto the new basis, then
 $\dot{\boldsymbol{g}}$
will be represented without any approximation. Therefore, the modes computed from the unforced system can be used as an appropriate basis for model order reduction of the forced system. As we will show to be the case in § 5.1.2, this implies that the spatial modal structures of the unforced bifurcation system persist into the forced case, though the corresponding time dependence
 $\unicode[STIX]{x1D6FE}_{1}(t)$
will differ between the two cases. However, just as in the case for the unforced reduced-order model, truncation to a finite number of modes will introduce error. Therefore, one would still need to be careful to include modes that may not be significant in unforced conditions, but become relevant when the forcing is applied. Since we are primarily interested in the shedding dynamics under forcing, we restrict our projection to just the primary bifurcation mode (and its complex conjugate), just as in the unforced case.
Proceeding with the reduced-order model development for the forced system, the expansion (4.6) is substituted into (4.5), which leads to
 $$\begin{eqnarray}\left[\begin{array}{@{}c@{}}\dot{\unicode[STIX]{x1D6FE}_{1}}\\ \dot{\bar{\unicode[STIX]{x1D6FE}_{1}}}\end{array}\right]=\left[\begin{array}{@{}cc@{}}\unicode[STIX]{x1D706}_{1}(\unicode[STIX]{x1D707}) & 0\\ 0 & \bar{\unicode[STIX]{x1D706}}_{1}(\unicode[STIX]{x1D707})\end{array}\right]\left[\begin{array}{@{}c@{}}\unicode[STIX]{x1D6FE}_{1}\\ \bar{\unicode[STIX]{x1D6FE}_{1}}\end{array}\right]+\hat{\boldsymbol{F}}(\unicode[STIX]{x1D6FE}_{1},\bar{\unicode[STIX]{x1D6FE}_{1}},\unicode[STIX]{x1D707})+(\boldsymbol{V}^{\dagger }\boldsymbol{V})^{-1}\boldsymbol{V}^{\dagger }[\boldsymbol{u}\boldsymbol{\cdot }\unicode[STIX]{x1D735}(\boldsymbol{V}\unicode[STIX]{x1D71E})].\end{eqnarray}$$
In this study, we assume simple harmonic time dependence for
 $\boldsymbol{u}$
with frequency
 $\unicode[STIX]{x1D714}_{f}=2\unicode[STIX]{x03C0}f$
. When the elements of
 $\boldsymbol{u}$
corresponding to the streamwise velocity components equal
 $2q\sin (\unicode[STIX]{x1D714}_{f}t)$
, and all other elements equal zero, then
 $$\begin{eqnarray}\dot{\unicode[STIX]{x1D6FE}}_{1}=\unicode[STIX]{x1D706}_{1}(\unicode[STIX]{x1D707})\unicode[STIX]{x1D6FE}_{1}+\hat{F}_{1}(\unicode[STIX]{x1D6FE}_{1},\bar{\unicode[STIX]{x1D6FE}},\unicode[STIX]{x1D707})+2q\sin (\unicode[STIX]{x1D714}_{f}t)[\unicode[STIX]{x1D6FE}_{1}a+\bar{\unicode[STIX]{x1D6FE}}_{1}\bar{a}],\end{eqnarray}$$
where
 $a(\boldsymbol{z}_{0})$
corresponds to the first element of the vector
 $(\boldsymbol{V}^{\dagger }\boldsymbol{V})^{-1}\boldsymbol{V}^{\dagger }\sum _{i=1}^{N}\unicode[STIX]{x2202}\boldsymbol{v}_{1}/\unicode[STIX]{x2202}z_{i}$
and
 $\bar{a}(\boldsymbol{z}_{0})$
is its complex conjugate. The coefficients
 $a$
and
 $\bar{a}$
represent in-phase and out-of-phase components of the observable; i.e.
 $a$
accounts for contributions of the Koopman mode corresponding to
 $\unicode[STIX]{x1D706}_{1}$
to the observable of interest, while
 $\bar{a}$
accounts for the contribution from the out-of-phase component of the Koopman mode corresponding to
 $\bar{\unicode[STIX]{x1D706}}_{1}$
. Furthermore, we replace the explicit time dependence in the forcing term by an additional state,
 $\unicode[STIX]{x1D701}=\text{e}^{\text{i}\unicode[STIX]{x1D714}_{f}t}$
such that (4.13) becomes
 $$\begin{eqnarray}\dot{\unicode[STIX]{x1D6FE}}_{1}=\unicode[STIX]{x1D706}_{1}(\unicode[STIX]{x1D707})\unicode[STIX]{x1D6FE}_{1}+\hat{F}_{1}(\unicode[STIX]{x1D6FE}_{1},\bar{\unicode[STIX]{x1D6FE}}_{1},\unicode[STIX]{x1D707})-\text{i}q(\unicode[STIX]{x1D701}-\bar{\unicode[STIX]{x1D701}})(\unicode[STIX]{x1D6FE}_{1}a+\bar{\unicode[STIX]{x1D6FE}}_{1}\bar{a}).\end{eqnarray}$$
Note the bi-linear terms involving
 $\unicode[STIX]{x1D701}$
and
 $\unicode[STIX]{x1D6FE}_{1}$
originate from
 $\boldsymbol{u}\boldsymbol{\cdot }\unicode[STIX]{x1D735}\boldsymbol{g}$
in (4.5).
4.4 Normal form theory
It is possible to gain theoretical insight into the first-order behaviour of (4.14) by using normal form theory in order to understand when the forcing can induce more complex spectral content beyond the classical
 $\unicode[STIX]{x1D714}_{0}\pm \unicode[STIX]{x1D714}_{f}$
-type interactions that are well known, in both general nonlinear dynamics phenomena and forced cylinder flow contexts. Normal form theory allows one to eliminate terms from nonlinear dynamics equations such as (4.14) that do not have first-order effects on the evolution variable of interest, i.e.
 $\unicode[STIX]{x1D6FE}_{1}$
. In normal form theory, only the resonant terms proportional to
 $\text{e}^{\text{i}\unicode[STIX]{x1D714}_{0}t}$
and near-resonant terms proportional to
 $\text{e}^{\text{i}(\unicode[STIX]{x1D714}_{0}\pm \unicode[STIX]{x1D714}_{f}\approx \unicode[STIX]{x1D714}_{0})t}$
must be retained in the differential equation. Otherwise, they can be removed from the differential equation to simplify the nonlinearity, and then added later to the response of interest. Details on normal form theory and its application can be found in Guckenheimer & Holmes (Reference Guckenheimer and Holmes1983), Wiggins (Reference Wiggins1990) and Nayfeh (Reference Nayfeh2011). Clearly, the near-resonant condition is satisfied for terms proportional to
 $\unicode[STIX]{x1D701}\unicode[STIX]{x1D6FE}_{1}$
and
 $\bar{\unicode[STIX]{x1D701}}\unicode[STIX]{x1D6FE}_{1}$
when the forcing frequency is much less than the natural frequency,
 $f\ll \,f_{0}$
. This regime is the focus of this study.
In Bagheri (Reference Bagheri2013), it was shown that the reduced-order model obtained by projecting onto the Koopman mode corresponding to post-critical shedding past a stationary cylinder is equivalent to the classical Landau equation (2.5) for a Hopf bifurcation. Therefore, when
 $q=0$
, equation (4.14) reduces to (2.5), where
 $\unicode[STIX]{x1D702}(t)$
is interpreted as the first-order approximation of
 $\unicode[STIX]{x1D6FE}_{1}(t)$
(Bagheri Reference Bagheri2013). It is clear that both the linear and cubic terms in (2.5) are proportional to
 $\text{e}^{\text{i}\unicode[STIX]{x1D714}_{0}t}$
to a first order, and thus the Landau equation is a normal form equation for a Hopf bifurcation. Although the cubic structure of (2.5) is universal to any Hopf bifurcation problem, explicit expressions for
 $\unicode[STIX]{x1D6FD}$
as a function of
 $\unicode[STIX]{x1D707}$
must be estimated empirically when explicit expressions for
 $\hat{F}_{1}$
are not available.
For any values of
 $f$
such that
 $f\ll \,f_{0}$
it is clear that the forcing term in (4.14) results in near-resonant terms. If we define
 $Q\equiv Q_{R}+\text{i}Q_{I}\equiv qa$
, then the normal form approximation for the forced system is
 $$\begin{eqnarray}\dot{\unicode[STIX]{x1D702}}=\unicode[STIX]{x1D706}_{1}(\unicode[STIX]{x1D707})\unicode[STIX]{x1D702}+\unicode[STIX]{x1D6FD}(\unicode[STIX]{x1D707})\unicode[STIX]{x1D702}^{2}\bar{\unicode[STIX]{x1D702}}-\text{i}Q(\unicode[STIX]{x1D701}-\bar{\unicode[STIX]{x1D701}})\unicode[STIX]{x1D702},\end{eqnarray}$$
which is valid for
 $f\ll \,f_{0}$
. The normal form equation provides theoretical insight into when the forcing can induce broadly distributed spectral content. When there is no separation in scale between
 $f$
and
 $f_{0}$
, the spectrum corresponding to
 $\unicode[STIX]{x1D702}(t)$
– and thus
 $\boldsymbol{g}(t,\boldsymbol{z}_{0})$
to a first order – would be narrowly concentrated about
 $f$
,
 $f_{0}$
and
 $f_{0}\pm f$
. This is because the forcing term in (4.15) could be eliminated from (4.15), leading to (2.5) which has a solution corresponding to the limit cycle frequency
 $f_{0}$
. Then, the non-resonant terms discarded from (4.15) would be added to the solution of (2.5), thus accounting for discrete spectral content at
 $f$
and
 $f_{0}\pm f$
. Therefore, the full normal form approximation shows that
 $f\ll \,f_{0}$
is a necessary (though not sufficient) condition for the simple harmonic forcing to induce broadly distributed spectra as leading-order phenomena in the observable since their occurrence could not be ruled out a priori from (4.15) when
 $f\ll \,f_{0}$
. It should be noted that the forcing term in (4.15) can also be viewed as adding harmonic oscillation to the eigenvalue
 $\unicode[STIX]{x1D706}_{1}$
, which is physically intuitive since the applied forcing corresponds to harmonic excitation of the Reynolds number and thus harmonic variation of the bifurcation parameter
 $\unicode[STIX]{x1D707}$
.
Replacing the complex variable
 $\unicode[STIX]{x1D702}$
by the polar coordinate representation
 $\unicode[STIX]{x1D702}=r(t)\text{e}^{\text{i}\unicode[STIX]{x1D703}(t)}$
and
 $-\text{i}(\unicode[STIX]{x1D701}-\bar{\unicode[STIX]{x1D701}})=2\sin (\unicode[STIX]{x1D714}_{f}t)$
in (4.15) gives
 $$\begin{eqnarray}{\dot{r}}=\unicode[STIX]{x1D70E}(\unicode[STIX]{x1D707})r+\unicode[STIX]{x1D6FD}_{R}(\unicode[STIX]{x1D707})r^{3}+2rQ_{R}\sin (\unicode[STIX]{x1D714}_{f}t)\end{eqnarray}$$
and
 $$\begin{eqnarray}\dot{\unicode[STIX]{x1D703}}=\unicode[STIX]{x1D714}_{0}(\unicode[STIX]{x1D707})+\unicode[STIX]{x1D6FD}_{I}r^{2}+2Q_{I}\sin (\unicode[STIX]{x1D714}_{f}t),\end{eqnarray}$$
where
 $\unicode[STIX]{x1D6FD}_{R}$
and
 $\unicode[STIX]{x1D6FD}_{I}$
are the real and imaginary parts of
 $\unicode[STIX]{x1D6FD}$
. It can be shown that this normal form system is analogous to a nonlinear mechanical oscillator with a parametrically excited damper corresponding to
 $Q_{R}\sin (\unicode[STIX]{x1D714}_{f}t)$
and a parametrically driven spring stiffness associated with
 $Q_{I}\sin (\unicode[STIX]{x1D714}_{f}t)$
. Furthermore, for the range of parameters corresponding to cylinder flow considered in this study,
 $\unicode[STIX]{x1D714}_{0}+\unicode[STIX]{x1D6FD}_{I}r^{2}\gg Q_{I}$
. Thus, the forcing primarily affects the dynamics through the parametrically excited damping. Note that if
 $\boldsymbol{g}$
is linear in
 $\boldsymbol{z}$
, then the forcing would not appear as a radial excitation in (4.16).
Interestingly, a similar set of equations as (4.16) and (4.17) were studied by Wang & Young (Reference Wang and Young2003) and Lin & Young (Reference Lin and Young2008) in which it was shown that shear-induced chaos could be induced. However, a fundamental difference between the shear induced chaos attractor and (4.16) and (4.17) is that the equation governing
 ${\dot{r}}$
in Lin & Young (Reference Lin and Young2008) contained functional dependence on
 $\unicode[STIX]{x1D703}$
in the bi-linear forcing term. Clearly, this is not the case for (4.16) and leads to different behaviour compared to the shear-induced chaos attractor. As we will show, equations (4.16) and (4.17) do not lead to chaos, and in fact describe a fundamentally different phenomena.
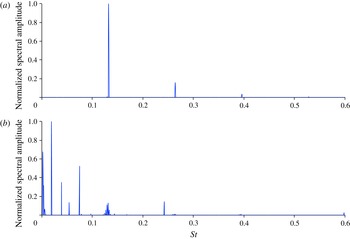
Imaginary components of Koopman eigenvalues corresponding to streamwise velocity field for flow over a stationary cylinder; the mean is removed for clarity and spectral amplitudes are normalized such that the maximum value is 1. (a) Using normalization; (b) direct data.

5 Results
5.1 Koopman decompositions
5.1.1 Stationary cylinder
For the CFD simulations, the cylinder diameter was
 $D=0.002$
m and the steady component of the free-stream velocity was
 $u_{0}=0.4~\text{m}~\text{s}^{-1}$
. The simulation time step normalized by the convective time scale was
 $\unicode[STIX]{x0394}tu_{0}/D=0.028$
. The simulation was run for 60 000 time steps, which was sufficient to allow the near-wake dynamics to settle into the well-known post-bifurcation limit cycle behaviour. The oncoming free stream was
 $Re_{0}=53$
. A low free-stream Reynolds number was selected so that turbulence could be neglected. The CFD data corresponding to the first 525 time steps were discarded in order to eliminate numerical transients. The remaining data record was used to conduct the Koopman modal analysis. Note that the CFD cylinder simulation exhibited the von Kármán vortex instability at
 $Re_{c}=46$
, which is in good agreement with experimental results presented in the literature (Sreenivasan et al.
Reference Sreenivasan, Strykowski, Olinger and Ghia1987). In addition, the calculated vortex shedding frequency at
 $Re_{0}=53$
was
 $f_{0}D^{2}/\unicode[STIX]{x1D708}=7$
, which is consistent with the empirical relationship from Sreenivasan et al. (Reference Sreenivasan, Strykowski, Olinger and Ghia1987) in which
 $f_{0}D^{2}/\unicode[STIX]{x1D708}=5.46+0.21(Re_{0}-Re_{c})=7$
.
The generalized harmonic analysis – approximated by finite-time fast Fourier transforms – gives projections that enable computation of Koopman modes. In addition, DMD yields such projections as well, so the two approaches are compared along with the effects of normalization. Koopman decomposition spectra calculated using normalization, and directly from the CFD data are compared in figures 1(a) and 1(b) respectively. The dominant mode at the von Kármán shedding Strouhal number (
 $f_{0}D/u_{0}$
) of
 $St=0.13$
is captured when using normalization. We have also verified that the normalization recovers a spectrum closer to that predicted by Fourier analysis at local probe locations in the wake. However, the spectrum computed from the direct data is somewhat contaminated by low frequency content and predicts maximum spectral content at a
 $St=0.02$
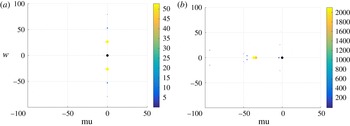
. The Koopman eigenvalues computed from the direct data set and using normalization are shown in figure 2. The eigenvalues are coloured and sized by the magnitude of each mode; i.e. larger magnitude modes appear as larger circles. The dominant eigenvalues computed using normalization are on the imaginary axis and consist with the base frequency and harmonics. In contrast, the eigenvalues computed from the direct data set show significant contributions from non-periodic modes close to
 $St=0$
. Even if all Koopman modes are on the attractor, i.e.
 $\text{Re}[\unicode[STIX]{x1D706}]=0$
, the numerical computation will give values slightly different than 0, as shown in figure 2. This is amplified for the Koopman modes based on the direct data because the normalized Koopman modal analysis diminishes the importance of the non-periodic modes. The results in figures 1 and 2 indicate that Koopman modal decompositions based on normalization is better suited for analysing dynamics on an attractor, while utilizing the direct data set may yield better results for transient dynamics. Normalization is used throughout the remainder of the paper since long-time dynamics is of interest.
Koopman eigenvalues in the complex plane for the streamwise velocity component;
 $\text{Re}[\unicode[STIX]{x1D706}]$
on the horizontal axis and
 $\text{Im}[\unicode[STIX]{x1D706}]$
on the vertical axis (Hz). (a) Using normalization; (b) direct data.

Streamwise velocity Koopman modes corresponding to the mean (
 $St=0$
), the von Kármán shedding Strouhal number (
 $St=0.13$
), and higher harmonics of the shedding mode (
 $St=0.27$
and
 $St=0.4$
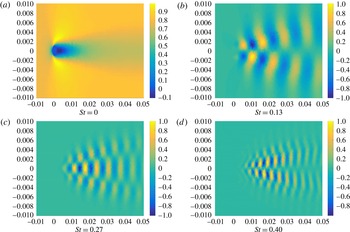
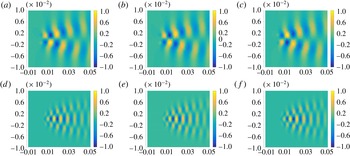
) are shown in figure 3. The modes were normalized. The
 $St=0.13$
Koopman mode clearly reproduces the anti-symmetric character associated with von Kármán wake vortex shedding, while the higher harmonic shedding modes exhibit finer scale spatial structure. Note that only the real parts of the Koopman modes are shown since the imaginary parts exhibit similar spatial structure. The spatial structures shown in figure 3 match with previously reported Koopman decompositions of the stationary cylinder wake (Chen et al.
Reference Chen, Tu and Rowley2011; Bagheri Reference Bagheri2013).
Real parts of Koopman modes corresponding to streamwise velocity for the stationary cylinder. Axes correspond to spatial coordinates in metres; the 0.002 m diameter cylinder is centred at (0, 0) and the flow moves from left to right. All mode shapes are normalized such that the maximum value is 1.

5.1.2 Oscillating cylinder
The streamwise velocity oscillations were prescribed at
 $St_{f}=0.0025$
for
 $Re_{0}=53$
, which is two orders of magnitude slower than the shedding frequency for the stationary cylinder. As a result of the separation of scales associated with
 $f\ll \,f_{0}$
, we focus on dynamical states other than lock-on/synchronization phenomena that occur when
 $f\sim f_{0}$
. Oscillation amplitudes from
 $Re_{q}=1$
to
 $Re_{q}=20$
were considered in order to compare large amplitude cases which oscillate through
 $Re_{c}$
, and smaller amplitude cases which are above
 $Re_{c}$
throughout the oscillation. The oscillating cylinder cases were computed for a total time record of twelve forcing periods.
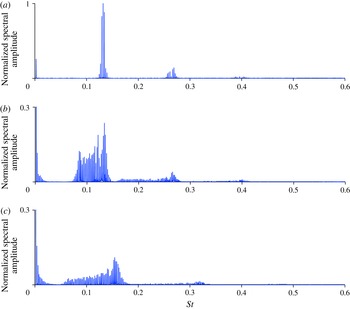
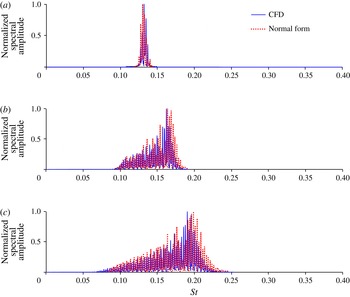
The spectra corresponding to various oscillation amplitudes are provided in figure 4. Progressive broadening of the wake spectral content with increasing amplitude is apparent from figure 4. At low amplitude
 $Re_{q}=1$
oscillations, the spectrum becomes quasi-periodic with narrow bands of discrete spectral content centred about the natural shedding frequency
 $f_{0}$
and its harmonics. In figure 4(a), the two largest spikes surrounding
 $f_{0}$
and its
 $n$
th harmonic are due to interactions with the applied forcing and correspond to
 $nf_{0}\pm f$
. This follows from the algebraic properties of the Koopman eigenfunctions discussed in Mezić (Reference Mezić2013) where it was shown that if
 $\unicode[STIX]{x1D719}_{1}$
is an eigenfunction of the Koopman operator associated with
 $\unicode[STIX]{x1D706}_{1}$
, and
 $\unicode[STIX]{x1D719}_{2}$
is an eigenfunction associated with
 $\unicode[STIX]{x1D706}_{2}$
, then
 $\unicode[STIX]{x1D706}=\unicode[STIX]{x1D706}_{1}+\unicode[STIX]{x1D706}_{2}$
is also an eigenvalue and is associated with eigenfunction
 $\unicode[STIX]{x1D719}=\unicode[STIX]{x1D719}_{1}\unicode[STIX]{x1D719}_{2}$
. Thus if we have an eigenvalue
 $\unicode[STIX]{x1D706}_{f}$
associated with the forcing frequency
 $f$
, and
 $\unicode[STIX]{x1D706}_{0}$
associated with
 $f_{0}$
, then
 $\unicode[STIX]{x1D706}_{0}+n\unicode[STIX]{x1D706}_{f}$
is an eigenvalue with frequency
 $f_{0}+nf$
. A similar argument applies to
 $2f_{0}+f$
,
 $3f_{0}+f$
, etc. As the oscillation amplitude is increased to
 $Re_{q}=20$
, the spectral broadening increases while still remaining discrete since the spacing between each frequency spike is
 $\unicode[STIX]{x0394}St=St_{f}=0.0025$
.
Imaginary components of Koopman eigenvalues for streamwise velocity components corresponding to the oscillating cylinder. The mean is removed for clarity and spectral amplitudes are scaled by the amplitude of the prescribed
 $St_{f}=0.0025$
mode; vertical axes are adjusted in order to emphasize the wake shedding spectral content. (a)
 $Re_{q}=1$
; (b)
 $Re_{q}=10$
and (c)
 $Re_{q}=20$
.

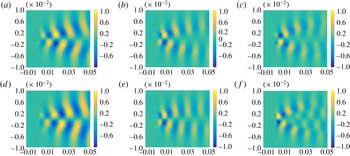
Figure 5 shows Koopman modes for
 $Re_{q}=1$
. The modes correspond to
 $f_{0}-f$
,
 $f_{0}$
,
 $f_{0}+f$
,
 $2f_{0}-f$
,
 $2f_{0}$
and
 $2f_{0}+f$
; these are prevalent frequencies in figure 4(a). The modes shown in figure 5(a–c) exhibit similar coherent asymmetric spatial structure as the primary shedding mode shown in figure 3(b), while those shown in figure 5(d–f) are similar to figure 3(c). Therefore, while the spectral content is beginning to broaden even for low amplitude forcing, the mode shapes of the unforced system are still underlying features of the forced system.
Koopman modes (real parts) corresponding to streamwise velocity for the oscillating cylinder (
 $Re_{q}=1$
). (a)
 $f_{0}-f$
; (b)
 $f_{0}$
; (c)
 $f_{0}+f$
; (d)
 $2f_{0}-f$
; (e)
 $2f_{0}$
; (f)
 $2f_{0}+f$
.

Interestingly, similar behaviour is observed for the Koopman modes even as oscillation amplitude is increased and the spectral content broadens. The prevalence of the primary antisymmetric shedding mode shape across multiple amplitudes and frequencies is illustrated in figure 6. In figure 6, panels (b,e) correspond to the frequency of maximum amplitude from figure 4(b,c), while (a,d) and (c,f) approximately align with the minimum and maximum frequencies respectively at which the primary shedding modal spatial structure could be clearly discerned. As the oscillation amplitude is increased, the shedding mode appears across a wider range of frequencies. For instance, the shedding mode appears throughout
 $St=0.1{-}0.17$
for
 $Re_{q}=10$
and
 $0.075{-}0.21$
for
 $Re_{q}=20$
. Note that only the primary shedding mode is shown in figure 6; occurrences of the second modal structure similar to figure 3(c) were found at higher frequencies but are not shown. These results also support the selection of the unforced shedding Koopman mode as an appropriate basis for reduced-order modelling, as this bifurcation mode clearly remains a dynamically relevant feature of the forced system. The theoretical underpinnings of Koopman operators provide the underlying theoretical justification for using unforced Koopman modes, even for modelling forced Hopf bifurcation dynamics. This is because the action of the unforced operator
 $L$
is still prevalent in the forced dynamics in (4.5).
Real parts of representative Koopman modes corresponding to streamwise velocity for various oscillation amplitudes and frequencies. (a)
 $Re_{q}=10$
;
 $St=0.1$
; (b)
 $Re_{q}=10$
;
 $St=0.165$
; (c)
 $Re_{q}=10$
;
 $St=0.17$
; (d)
 $Re_{q}=20$
;
 $St=0.075$
; (e)
 $Re_{q}=20$
;
 $St=0.19$
; (f)
 $Re_{q}=20$
;
 $St=0.21$
.

Figures 4–6 indicate the potential for the wake shedding dynamics to progress from narrowly banded quasi-periodicity to spectrally broad dynamics, while still maintaining some of the spatial coherency associated with the unforced bifurcation case. The fundamental mechanism for the spectral broadening, along with the seemingly contradictory prevalence of the modal/spatial coherency, are explained next using normal form mathematical models from § 4.4.
5.2 Normal forms
Before proceeding to provide theoretical underpinnings for the numerical Koopman mode results using simplified normal form mathematical models, the reduced-order normal form approximations presented in § 4 are verified by comparing with full-order CFD solutions. To demonstrate the concepts associated with dynamics of observables, we select the integrated transverse force coefficient on the cylinder,
 $c_{y}$
, as the observable of interest since it is a convenient, and commonly used, representation of cylinder wake dynamics, e.g. Cetiner & Rockwell (Reference Cetiner and Rockwell2001) and Perdikaris et al. (Reference Perdikaris, Kaiktsis and Triantafyllou2009),
 $$\begin{eqnarray}\boldsymbol{g}(t,\boldsymbol{z}_{0})=c_{y}(t).\end{eqnarray}$$
Using the methodology outlined by Sreenivasan et al. (Reference Sreenivasan, Strykowski, Olinger and Ghia1987), explicit quantitative functions for the normal form parameters,
 $\unicode[STIX]{x1D706}_{1}$
and
 $\unicode[STIX]{x1D6FD}$
in (4.15), expressed in terms of the bifurcation parameter
 $\unicode[STIX]{x1D707}=(Re-Re_{c})\unicode[STIX]{x1D708}/D^{2}$
are estimated from the stationary cylinder CFD solutions. By using the methodology outlined by Sreenivasan et al. (Reference Sreenivasan, Strykowski, Olinger and Ghia1987), the normal form parameters can be easily estimated from time-signal response data corresponding to the observable,
 $c_{y}(t)$
. Following the procedure from Sreenivasan et al. (Reference Sreenivasan, Strykowski, Olinger and Ghia1987), we obtain the following expressions estimated from CFD time-signal solutions of
 $c_{y}(t)$
:
 $$\begin{eqnarray}\displaystyle \unicode[STIX]{x1D706}_{1}=0.17\unicode[STIX]{x1D707}+\text{i}(38.6\unicode[STIX]{x1D708}/D^{2}+0.7\unicode[STIX]{x1D707}), & & \displaystyle\end{eqnarray}$$
 $$\begin{eqnarray}\displaystyle \text{Re}[\unicode[STIX]{x1D6FD}]=-0.2/(c_{y,max})^{2};\quad \text{Im}[\unicode[STIX]{x1D6FD}]=-3\,\text{Re}[\unicode[STIX]{x1D6FD}]. & & \displaystyle\end{eqnarray}$$
Note that all parameters are estimated from the stationary cylinder case, except for
 $\text{Re}[\unicode[STIX]{x1D6FD}]$
, in which the maximum value of the observable time signal,
 $c_{y,max}$
for each applied forcing amplitude of interest is needed to match quantitatively with the saturation amplitude of the response. Qualitatively similar behaviour is possible by simply estimating
 $\text{Re}[\unicode[STIX]{x1D6FD}]$
from the unforced cylinder flow case value for
 $c_{y,max}$
, but quantitatively accurate matches require that this parameter be varied with the applied forcing amplitude.
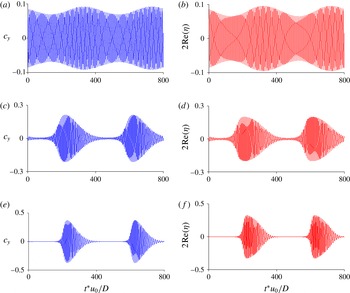
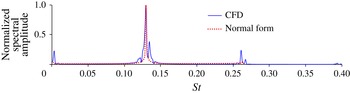
Spectral and time-signal comparisons between normal form theory and CFD results are presented in figures 7 and 8 for
 $f\ll \,f_{0}$
. The normal form (4.15) was used for the comparisons due to the separation in scale between the forcing and natural frequencies. For simplicity, it was assumed that
 $Q_{I}=0$
since
 $\unicode[STIX]{x1D714}_{0}+\unicode[STIX]{x1D6FD}_{I}r^{2}\gg Q_{I}$
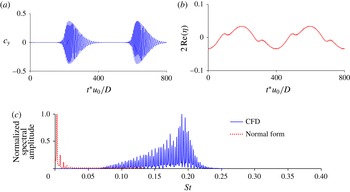
for the range of parameters that were considered. The leading-order normal form approximations accurately capture the spectral broadening exhibited by the CFD solutions as oscillation amplitude is increased. These results indicate that the forcing effects acting on only the primary bifurcation mode are responsible for the similar behaviour observed in figure 4 for the streamwise velocity fields.
Transverse force spectra for
 $St=0.0025$
oscillating cylinder cases at various oscillation amplitudes; normal form solutions based on (4.15). (a)
 $Re_{q}=1$
; (b)
 $Re_{q}=10$
; (c)
 $Re_{q}=20$
.

The transverse force time-signal comparisons corresponding to figure 7 are provided in figure 8. The similarities between full order and approximate time signals further illustrate the excellent agreement between the normal forms based on just one mode. The accuracy of the normal form approximations derived from centre manifold reductions support the finding that using the unforced bifurcation mode as the basis can lead to an accurate first-order approximation of a forced Hopf bifurcation system. So while the broad spectral content associated with the CFD would indicate a complicated high-dimensional system, the ‘complexity’ can be simplified quite nicely into a low-order representation when viewed from the correct perspective; in this case, the appropriate perspective is a basis spanned by the unforced Koopman bifurcation mode. Perhaps one of the most prevalent features of the time signals as forcing amplitude is increased is the emergence of quiescent behaviour that interrupts the oscillatory potions. This is most clearly observed in figure 8(e,f). This occurs for high amplitude cases because the applied forcing amplitude is sufficiently large such that the Reynolds number oscillates above and below the critical bifurcation value of the stationary cylinder.
Transverse force coefficient time signals for
 $St=0.0025$
oscillating cylinder cases at various oscillation amplitudes; normal form solutions based on (4.15). (a) CFD,
 $Re_{q}=1$
; (b) Normal form,
 $Re_{q}=1$
; (c) CFD,
 $Re_{q}=10$
; (d) Normal form,
 $Re_{q}=10$
; (e) CFD,
 $Re_{q}=20$
; (f) Normal form,
 $Re_{q}=20$
.

To demonstrate that
 $f\ll \,f_{0}$
is a necessary condition for spectral broadening due to simple harmonic forcing of a bifurcation mode, CFD and normal form results for a case when
 $f=f_{0}$
are shown in figure 9. Figure 9 can be contrasted with the
 $f\ll \,f_{0}$
cases in figure 7(b). As discussed in § 4.4, when
 $f$
is not much less than
 $f_{0}$
the forcing terms can be removed from the ordinary differential equation, resulting in (2.5) governing the first-order response of the observable. This normal form differential equation, which is equivalent to the unforced bifurcation system, accurately approximates the full system first-order dynamics, as shown in figure 9. Note, that in contrast to figure 7(b), the spectral content of figure 9 is narrowly distributed around a few noticeable spikes. In addition to the primary frequency at
 $f_{0}$
, the CFD solution also exhibits spectral content at
 $2f_{0}$
and 0. Whereas in the
 $f\ll \,f_{0}$
case the
 $\unicode[STIX]{x1D702}\unicode[STIX]{x1D701}$
and
 $\unicode[STIX]{x1D702}\bar{\unicode[STIX]{x1D701}}$
terms are retained in the normal form differential equation, when
 $f$
is not much less than
 $f_{0}$
these terms can be eliminated from the differential equation and thus do not affect the leading-order approximation of the observable. Instead, they are recovered by adding as higher-order effects to the solution of (2.5); see Nayfeh (Reference Nayfeh2011) for details on application of normal form theory. As such,
 $\unicode[STIX]{x1D702}\unicode[STIX]{x1D701}$
corresponds to the
 $2f_{0}$
spectral content and
 $\unicode[STIX]{x1D702}\bar{\unicode[STIX]{x1D701}}$
produces the steady content observed in the CFD. Therefore, the leading-order effects of the forcing will enter as additive terms to the expression for
 $\unicode[STIX]{x1D6FE}_{1}$
– rather than terms in the ordinary differential equation governing
 $\unicode[STIX]{x1D702}$
– and thus will always appear as narrowly banded discrete spectral content. The results in figure 9 using (2.5) demonstrate that it is not necessary to retain the leading-order forcing effects in the differential equation for all frequency regimes. By proceeding with the full normal form simplifications using assumptions on
 $f$
, we are able to show explicitly that
 $f\ll \,f_{0}$
is a necessary condition for leading-order forcing effects to appear in the differential equation, and thus other scenarios for
 $f$
are precluded from inducing spectral broadening or chaos as a leading-order phenomena spanned by the wake shedding mode.
Transverse force spectra for
 $St_{f}=St_{0}=0.13$
,
 $Re_{q}=10$
oscillating cylinder case; normal form solutions based on (2.5).

Transverse force coefficients for (a) CFD and (b) normal form with additive forcing term for a
 $St_{f}=0.0025$
oscillating cylinder case; (c) corresponding spectral content.

Finally, we use normal form theory to demonstrate the importance of the dynamics-of-observables formalism that leads to a bi-linear structure of forcing/excitation terms when
 $\boldsymbol{g}$
is a nonlinear function of
 $\boldsymbol{z}$
; see (4.5). Without undertaking the formal development in § 4, one may be tempted to treat the effects of
 $\boldsymbol{u}$
by adding a simple harmonic forcing term to the unforced normal form equation, i.e.
 $$\begin{eqnarray}\dot{\unicode[STIX]{x1D702}}=\unicode[STIX]{x1D706}_{1}(\unicode[STIX]{x1D707})\unicode[STIX]{x1D702}+\unicode[STIX]{x1D6FD}(\unicode[STIX]{x1D707})\unicode[STIX]{x1D702}^{2}\bar{\unicode[STIX]{x1D702}}-\text{i}Q(\unicode[STIX]{x1D701}-\bar{\unicode[STIX]{x1D701}}),\end{eqnarray}$$
rather than the correct bi-linear parametric excitation appearing in (4.15). Similar analogies have been suggested to describe oscillating cylinder wake dynamics, e.g. Provansal et al. (Reference Provansal, Mathis and Boyer1987). However, as shown in this study, such an approach is only valid when
 $\boldsymbol{g}$
is a linear function of
 $\boldsymbol{z}$
. For the more general dynamics-of-observables case, equation (5.4) is incorrect. In essence, the additive forcing is appropriate when considering the system states
 $\boldsymbol{z}$
as the observable of interest, while the parametric system is appropriate for the dynamics of nonlinear functions of
 $\boldsymbol{z}$
, such as the force coefficient considered in this study. To illustrate this, we reconsider the oscillating cylinder case for
 $St_{f}=0.0025$
and
 $Re_{q}=20$
. Except, we now compare with the incorrect additive normal from (5.4), instead of the correct parametrically excited normal form whose solutions are shown in figures 7(b) and 8(d). From figure 10, it is clear that adding the forcing term to the unforced normal form equation in an ad hoc manner will lead to incorrect results when considering dynamics of a generic observable. This finding has significant implications for development of control strategies based on reduced-order models of observables since the proper way to introduce control inputs will be through bi-linear terms. The dynamics-of-observables approach can be viewed as a generalization of the additive normal form approaches, e.g. Tsarouhas & Ross (Reference Tsarouhas and Ross1987, Reference Tsarouhas and Ross1988), Vance, Tsarouhas & Ross (Reference Vance, Tsarouhas and Ross1989), Gabale & Sinha (Reference Gabale and Sinha2009), since the correct normal form structure would be recovered if the observable of interest is a linear function of the underlying state
 $\boldsymbol{z}$
. It is also worth noting that while parametrically excited Hopf bifurcation studies such as Bajaj (Reference Bajaj1986) include a bi-linear term, resonant phenomena (e.g.
 $f\sim 2f_{0}$
) have typically been studied. In contrast, the dynamics of (4.15) for
 $f\ll \,f_{0}$
has, to the best of our knowledge, not been presented previously. Note that other observable and forcing combinations may result in non-parametric forcing. For example, in Gal, Nadim & Thompson (Reference Gal, Nadim and Thompson2001) where cross-flow oscillations were considered, the forcing is not parametric which implies that the observable of interest was linear with respect to the state vector components in the direction of the forcing.
5.3 Quasi-periodic intermittency
Having verified the two-dimensional reduced-order normal form equations with respect to the full-order CFD solutions, we now proceed with determining the underlying nature of the spectral broadening that can manifest in the wake dynamics when
 $f\ll \,f_{0}$
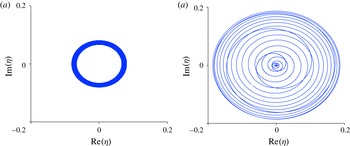
; i.e. is the dynamics quasi-periodic, chaotic or something else? First, it is useful to visualize the attractor in state space. From figure 8, it appears that the trajectories pass near
 $r=|\unicode[STIX]{x1D702}|=0$
as the oscillatory forcing amplitude
 $Re_{q}$
is increased. This is confirmed in figure 11.
Normal form state-space trajectories for one period corresponding to the forcing frequency
 $f$
. (a)
 $Re_{q}=1$
; (b)
 $Re_{q}=20$
.

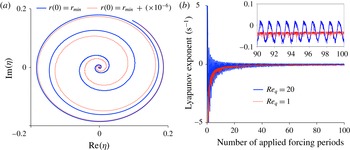
(a) Comparison of state-space trajectories beginning from perturbed initial conditions on the attractor in the regime where
 $\unicode[STIX]{x1D6FD}_{R}r^{3}\ll (\unicode[STIX]{x1D70E}+2Q_{R}\sin \unicode[STIX]{x1D714}_{f}t)r$
for
 $Re_{q}=20$
; note that the plot corresponds to 1000 forcing periods after the initial perturbation and only the portions of the trajectories corresponding to
 ${\dot{r}}>0$
are shown for clarity. (b) The development of the finite-time Lyapunov exponent for
 $Re_{q}=20$
and
 $Re_{q}=1$
over 100 forcing periods; the inset shows a zoomed in view.

How closely the attractor passes near
 $r=0$
is a critical delineator between classical quasi-periodic dynamics and what we will later define as quasi-periodic intermittency. This can be shown analytically by considering (4.16) which is decoupled from
 $\unicode[STIX]{x1D703}$
. When
 $r$
is sufficiently small,
 $\unicode[STIX]{x1D6FD}_{R}r^{3}\ll (\unicode[STIX]{x1D70E}+2Q_{R}\sin \unicode[STIX]{x1D714}_{f}t)r$
, leading to
 $$\begin{eqnarray}{\dot{r}}=(\unicode[STIX]{x1D70E}+2Q_{R}\sin \unicode[STIX]{x1D714}_{f}t)r.\end{eqnarray}$$
If
 $\unicode[STIX]{x1D6FD}_{R}r^{3}\ll (\unicode[STIX]{x1D70E}+2Q_{R}\sin \unicode[STIX]{x1D714}_{f}t^{\ast })r$
at some time
 $t=t^{\ast }$
, then the solution to (5.5) at
 $t=t^{\ast }+\unicode[STIX]{x0394}t$
is
 $$\begin{eqnarray}r(t^{\ast }+\unicode[STIX]{x0394}t)=r(t^{\ast })\text{e}^{\unicode[STIX]{x1D706}_{L}\unicode[STIX]{x0394}t},\end{eqnarray}$$
where
 $$\begin{eqnarray}\unicode[STIX]{x1D706}_{L}=\unicode[STIX]{x1D70E}+2Q_{R}(\sin \unicode[STIX]{x1D714}_{f}t^{\ast }+\unicode[STIX]{x1D714}_{f}\unicode[STIX]{x0394}t\cos \unicode[STIX]{x1D714}_{f}t^{\ast })\end{eqnarray}$$
and the approximation
 $\sin \unicode[STIX]{x1D714}_{f}(t^{\ast }+\unicode[STIX]{x0394}t)\approx \sin \unicode[STIX]{x1D714}_{f}t^{\ast }+\unicode[STIX]{x1D714}_{f}\unicode[STIX]{x0394}t\cos \unicode[STIX]{x1D714}_{f}t^{\ast }$
has been used. Now we consider the evolution of two trajectories: the first
 $r_{1}(t^{\ast }+\unicode[STIX]{x0394}t)$
which is the solution beginning from
 $r(t^{\ast })$
, and the second
 $r_{2}(t^{\ast }+\unicode[STIX]{x0394}t)$
beginning from a perturbed initial condition
 $r(t^{\ast })+\unicode[STIX]{x1D6FF}_{0}$
. After substituting these initial conditions into (5.6), it is easy to show that the separation between the two trajectories,
 $\unicode[STIX]{x1D6FF}_{r}(t^{\ast }+\unicode[STIX]{x0394}t)\equiv r_{2}(t^{\ast }+\unicode[STIX]{x0394}t)-r_{1}(t^{\ast }+\unicode[STIX]{x0394}t)$
, is
 $$\begin{eqnarray}\unicode[STIX]{x1D6FF}_{r}(t^{\ast }+\unicode[STIX]{x0394}t)=\unicode[STIX]{x1D6FF}_{0}\text{e}^{\unicode[STIX]{x1D706}_{L}\unicode[STIX]{x0394}t}.\end{eqnarray}$$
Furthermore, if
 ${\dot{r}}>0$
, then
 $\unicode[STIX]{x1D706}_{L}>0$
. Therefore, the separation between the trajectories exponentially diverges for finite time when
 ${\dot{r}}>0$
, until
 $r$
increases sufficiently for
 $\unicode[STIX]{x1D6FD}_{R}r^{3}$
to become significant. This behaviour is consistent with chaos since the difference between two nearby trajectories on the attractor exponentially diverges. In this context,
 $\unicode[STIX]{x1D706}_{L}$
in (5.8) can be interpreted as a finite-time Lyapunov exponent. Note that the system is only susceptible to exponential divergence of nearby trajectories at points on the attractor corresponding to small
 $r$
and
 ${\dot{r}}>0$
. The exponential divergence of nearby trajectories is illustrated in figure 12(a) where the two trajectories diverge as they spiral radially outwards (
 ${\dot{r}}>0$
) until reaching a sufficiently large value of
 $r$
. In figure 12(a), the deviating trajectories are shown after 1000 forcing periods from the initial instant at which perturbation is introduced. Even though the system was only perturbed at one instant in time, the two trajectories will differ for all time due to the periodic occurrence of exponential divergence. Thus, the system exhibits the sensitive dependence on initial conditions on the attractor typically associated with chaotic systems. We have verified (not shown) that introducing similar perturbations elsewhere on the attractor away from small
 $r$
, or for smaller forcing amplitudes, will not induce exponential divergence and the two nearby trajectories will eventually coalesce and become indistinguishable after sufficient time from the initial perturbation.
The development of the finite-time Lyapunov exponent as the number of iterations is increased is shown in figure 12(b). Although the system exhibits the classically chaotic feature of sensitive dependence on initial conditions for some points on the attractor, the Lyapunov exponent approaches 0 as
 $t\rightarrow \infty$
. So in contrast to classically chaotic systems, the Lyapunov exponent is not positive over infinite time. Instead, as shown in the figure 12(b) inset, the divergence of nearby trajectories for
 $Re_{q}=20$
is maintained for all time due to transiently positive finite-time Lyapunov exponents as the system periodically passes by
 $r=0$
. For systems that do not pass near
 $r=0$
, as shown for the
 $Re_{q}=1$
case in figure 12(b), the Lyapunov exponent never becomes positive even within finite-time windows.
The effects of forcing amplitude on the susceptibility to exponential divergence over finite time is shown in figure 13, where the critical parameter for exponential divergence is
 $$\begin{eqnarray}A=\frac{\unicode[STIX]{x1D6FD}_{R}r_{min}^{2}}{(\unicode[STIX]{x1D70E}+2Q_{R}\sin \unicode[STIX]{x1D714}_{f}t_{min})}\end{eqnarray}$$
in which
 $r_{min}$
is the minimum value of
 $r(t)$
and
 $t_{min}$
is the time at which
 $r_{min}$
occurs. The horizontal line in figure 13 indicates when
 $A\ll 1$
and the system is sensitive to perturbation at certain points on the attractor. Note that the value of
 $10^{-3}$
was chosen arbitrarily as a small value for illustrative purposes. It is clear from figure 13 that the oscillatory forcing amplitude must be sufficiently large to drive the system near the fixed point. If
 $2Q_{R}$
is not
 ${\geqslant}\unicode[STIX]{x1D70E}$
, then the system will never decay (although it will saturate due to the cubic term). As a result,
 $2Q_{R}\geqslant \unicode[STIX]{x1D70E}$
is a condition on the amplitude that is required for finite-time exponential divergence to be possible. Otherwise, such behaviour can be ruled out a priori. For
 $Re_{q}=20$
,
 $r_{min}\sim \mathit{O}(1e^{-8})$
. Therefore, for larger oscillatory Reynolds numbers, the dynamics for the transverse force coefficient
 $c_{y}$
would have finite-time exponential divergence under realistic experimental conditions since very small perturbations (or lack of measurement precision for small numbers) are realities.
Variation of the critical parameter delineating the onset of chaos,
 $A$
, with oscillatory Reynolds number amplitude.

Interestingly, the system also exhibits quasi-periodic characteristics even after transitioning to exponential divergence for sufficient forcing amplitude. As shown in figure 14(a), the normal form solution corresponding to
 $Re_{q}=20$
exhibits a discrete spectrum, as opposed to a continuous spectrum conventionally associated with chaos. The corresponding Poincaré section is shown in figure 14(b). The Poincaré section points are obtained by recording solutions at integer multiples of the forcing period
 $1/f$
. The intersection points fill in a curve in the Poincaré plane, i.e. a drift ring, which is a clear indication of quasi-periodic dynamics (Hilborn Reference Hilborn1994). Due to the described nature of this physical phenomenon – featuring finite-time exponential leading to the bursts shown in figure 8(e), and quasi-periodic dynamics – we call it the quasi-periodic intermittency.
Discrete spectrum (a) and Poincaré section (b) corresponding to the normal form solution for
 $Re_{q}=20$
; both are computed from 1000 periods of forcing frequency
 $St_{f}=0.0025$
.

The quasi-periodic intermittency attractor (yellow) plotted on the torus. The toroidal grid (grey) is shown for reference. Rotation around the large diameter of the torus corresponds to the radial growth/decay that occurs over the slow forcing frequency, while rotation around the smaller diameter (i.e. phase velocity as the attractor spins around cross-sections of the torus) correspond to the faster natural frequency of the system. The figure corresponds to
 $Re_{q}=20$
and 24 periods of motion corresponding to the forcing frequency
 $f$
.

Further insight can be gained by viewing a three-dimensional representation of the quasi-periodic intermittency attractor obtained by plotting in toroidal coordinates, which is a common approach to visualizing quasi-periodic and multi-scale behaviour – see Hilborn (Reference Hilborn1994, § 4.7) for example. In figure 15, the slower forcing scale (i.e.
 $f$
) is represented by rotation around the larger diameter of the torus. It can be observed that the radial growth/decay (i.e.
 ${\dot{r}}$
) corresponds to rotation around the torus, which is consistent with the fact that the forcing term manifests as a parametric excitation of the bifurcation parameter. Similarly, rotation around the cross-section (i.e.
 $\dot{\unicode[STIX]{x1D703}}$
) corresponds to the faster natural frequency
 $f_{0}$
. Note that if one were to unfold the torus in figure 15 into a cylinder, the cross-sectional view of the cylinder would resemble figure 11(b).
6 Conclusions
Parametrically excited Hopf bifurcation flows were studied using Koopman mode analysis of the canonical oscillating cylinder system when there is a separation of scale between the forcing and natural frequencies, i.e.
 $f\ll \,f_{0}$
. Koopman decompositions indicate transition from narrowly distributed discrete spectra for the stationary cylinder case, to more broadly distributed discrete spectra as the oscillation amplitude is increased, even though only a single forcing frequency is applied. Furthermore, the Koopman mode shapes for the forced case indicate that the unforced shedding mode is still a dynamically relevant feature of the forced system. The use of unforced Hopf bifurcation modes as a projection basis for forced bifurcation normal form-based reduced-order modelling was also justified in the context of Koopman-operator theory as the unforced Koopman operator was shown to be a prevalent feature of the forced system. In contrast, this may not be appropriate for reduced-order modelling control studies based on other approaches, such as proper-orthogonal decomposition, which cannot be theoretically interpreted as spanning the action of a linear operator associated with the unforced system that remains a part of the equation governing the evolution of observables under forcing.
When considering a dynamics-of-observables perspective, it was shown that the effect of forcing (or a control input) appears as a bi-linear excitation term if the observable is a nonlinear function of the underlying state vector. To verify this finding, model order reduction was conducted by projecting onto the unforced Koopman shedding mode, i.e. the centre manifold. This system was then further simplified using normal form theory. It was demonstrated that the two-dimensional bi-linear normal form approximation accurately captures the leading-order effect of the prescribed forcing on the shedding dynamics of the full-order high-dimensional CFD solutions. These findings will inform future development of control-based reduced-order modelling studies using Koopman theory, and are generally applicable to forced Hopf bifurcation systems. More complex fluid dynamics applications that may benefit directly from the methods and theory presented here could include dynamic stall and some combustion blow-out problems where the interplay between multi-scale dynamics produces complex behaviour. Applications of Koopman-based decompositions may provide improved understanding of such systems, including when the scales/modes interact in manner that cannot be explained by classical
 $f_{0}\pm f$
effects.
Normal form mathematical models were used to explicitly establish
 $f\ll \,f_{0}$
as a necessary condition for the applied forcing to induce spectral broadening in the shedding mode dynamics. It was shown that the normal form equations for forced cylinder wake shedding dynamics are a physical realization of a phenomenon that we call quasi-periodic intermittency. The phenomenon exhibits finite-time exponential divergence of nearby trajectories, while maintaining a discrete spectrum as in quasi-periodic systems. Given the prevalence of Hopf bifurcation systems throughout physics, the interaction between disparate scales described by the quasi-periodic intermittency theory may underpin a variety of multi-scale dynamics phenomena. Potential applications where such quasi-periodic intermittency phenomena may be relevant include, turbulence, combustion, biological inspired soft robotic control/motion and bursting phenomena in neurosciences and are the subjects of current study.
Acknowledgements
This work was supported by a U.S. Army Research Laboratory Director’s Research Initiative award for B.G. Support for I.M., M.F. and S.L. under U.S. Army Research Office project W911NF-14-C-0102, U.S. Army Research Office project W911NF-16-1-0312 (Program Manager Dr S. Stanton), and U.S. Air Force Office of Scientific Research project FA9550-12-1-0230 (Program Manager Dr F. Fahroo and Dr F. Leve) are gratefully acknowledged.