I. INTRODUCTION
Aluminum (Al) and iron (Fe) are two most abundant metals in the earth's crust and have been widely used in various applications due to their excellent physical and chemical properties. The dissimilar metal joints between Al and Fe present potential prospects because such joints provide a perfect combination of a higher strength-to-weight ratio, an extraordinary corrosion resistance and an excellent thermal conductivity. Reference Szczepaniak, Fan, Kostka and Raabe1 A precondition for realizing perfect aluminum coating of iron (or steel) is to obtain an effective bonding between aluminum alloys and iron at the initial stage of hot dipping. The metallurgical diffusion layer between Al and Fe has been proved to play a fundamental role in material properties during the process of manufacture and assembling. However, it is generally believed that interfaces are weaker in comparison to matrix in terms of shearing and bending, since atoms within interfaces usually have low coordination bonds Reference Li, Mara, Wang, Dickerson, Huang and Misra2 and brittle intermetallic phases are commonly formed at the interfaces. Reference Li, Wang, Liu, Li and He3,Reference Savitskii4 During the solidification of Al/Fe joints, owing to the differences in the thermal expansion coefficients among Al substrate, intermetallic phases, and Fe substrate, a mass of microcracks appear in the intermetallic phases, which are detrimental to the mechanical properties of Al/Fe joints formed in welding and coating procedures. Reference Coelho, Kostka, dos Santos and Kaysser-Pyzalla5,Reference Springer, Kostka, dos Santos and Raabe6 Apparently, it is essential to investigate the formation and growth mechanism of intermetallic phases between solid Fe and liquid Al alloys.
Previous works have confirmed the role of Al5Fe2 phase (dominant reaction product) at the interface between solid Fe and liquid Al and the existence of a thin layer of Al13Fe4 phase. Reference Bouche, Barbier and Coulet7–Reference Kobayashi and Yakou10 Although the addition of Si into Al has been reported to make a difference in decelerating the reaction layer's growth during solid Fe/liquid Al–Si interdiffusion experiments and the nearly flat growth front has been observed at the reaction layers/Fe substrate interface, the mechanism controlling the phenomena is still not completely understood. Reference Eggeler, Auer and Kaesche11,Reference An, Liu, Zhang and Yang12 Recent work Reference Springer, Kostka, Payton, Raabe, Kaysser-Pyzalla and Eggeler13,Reference Springer14 has systematically studied the reactions between solid Fe and liquid Al–Si alloys and the ones between solid Fe and semisolid Al–Si alloys by scanning electron microscopy (SEM), x-ray diffraction (XRD), transmission electron microscopy, and electron backscattered diffraction. It has affirmed the existence of the τ5 phase (Al8Fe2Si), θ phase (Al13Fe4), and η phase (Al5Fe2) at the Al/Fe interface and also revealed that the dispersed particles of τ1 phase (Al2Fe3Si3) appear irregularly in the η phase. In the interdiffusion process of solid Fe/semisolid Al–Si alloys, the Si element accelerates the growth of reaction layers at 600 °C, which is in contradictory with the view that Si atoms reduce the atomic mobility in the η phase through occupying structural vacancies on the C-axis of the η phase. Reference Nicholls15 Although the work of Springer et al. Reference Springer, Kostka, Payton, Raabe, Kaysser-Pyzalla and Eggeler13 presented a detailed analysis about the identification of the intermetallic phases and the growth kinetics of reaction layers, it has not been elucidated whether the suppression mechanism of the effect of Si additions into Al on the reaction layers' growth is related to the formation of τ1 phase and what the underlying mechanism is in controlling the growth of the reaction layer. References Reference Akdeniz, Mekhrabov and Yilmaz16 and Reference Akdeniz and Mekhrabov17 calculated the activity coefficient of Al atoms in Fe0.95(Al1−n Si n )0.05 alloys in terms of interfacial interaction potentials, and concluded that Si atoms can decrease the activity coefficient of Al atoms and reduce the diffusion rate of Al atoms which leads to the inhibition in the growth of the Al–Fe intermetallic diffusion layer. The Ge element has been considered as an effective additional element in Al alloys, which shows a similar behavior to Si elements and enhances the mechanical properties of Al alloys. Reference Zheng, Liu, Liao, Ringer and Sha18 Accordingly, it is necessary to explore the effect of Ge atoms on the formation of the Al/Fe reaction layer.
To date, most diffusion studies are concentrated on the analysis of diffusion kinetics of different intermetallic phases formed between solid Fe and liquid Al as well as liquid Al–Si alloys, Reference Shahverdi, Ghomashchi, Shabestari and Hejazi19 and the investigation of the effect of microalloying elements on the diffusion layer, Reference Nazari and Shabestari20,Reference Jacome21 but an indispensable understanding of reactive wetting and interfacial chemistry before diffusion growth of intermetallic layers remains urgent. Moreover, the study on the relative mobilities of the species is very important to identify the related mechanism. Thus, it is essential to resolve these problems during interacting, particularly during the early stages of reactive diffusion.
II. EXPERIMENTS SECTION
Galvanized iron bar with a cylindrical dimension of 100 × 3 mm was used to perform the dip experiments. Prior to hot dipping, the iron samples were cleaned ultrasonically for 10 min in a mixed bath of ethanol and acetone. Then the iron specimens were immersed in the Al–Si melts at 690 °C for 10 min, in the Al–Ge melts at different temperatures and time, respectively. For simplicity, the detailed experiment conditions have been shown in the figure captions. After hot dipping, the iron bar was transferred into a mold in which the process of casting involving Al-based alloys was carried out. Finally, the melts were cooled down to room temperature in air. The cross sections of bimetal composites were ground and polished by standard preparation procedures. The morphology and microstructure of the as-prepared specimen were characterized using an optical microscope (OM), a field emission gun-SEM (FE-SEM) in secondary electron mode and backscattered electron mode. In addition, the chemical composition of reaction layers was detected by energy-dispersive spectrometry (EDS) in the FE-SEM system. The phase constitution of the as-prepared Fe/Al bimetal composites was characterized by XRD (Rigaku D/max-rB, Tokyo, Japan) with Cu Kα radiation. We detected the phase composition through a layer-by-layer method by which each layer with a thickness of around 5 μm has been polished before the following XRD test.
III. RESULTS AND DISCUSSION
A. Morphology characteristic of the diffusion layer
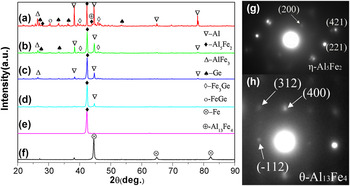
Figure 1 shows the XRD patterns of the as-prepared Fe/Al–20 at.% Ge bimetal composites. There are multiple diffraction peaks in the (a) pattern, corresponding to the diffraction peaks of different reflections for Al, eutectic Ge, η-Al5Fe2, and a small amount of AlFe3, Fe3Ge, FeGe, θ-Al13Fe4 phase. With subsequent polishing, the intensity of diffraction peaks for Al, Ge, AlFe3, Fe3Ge, FeGe, θ-Al13Fe4 phase gradually decreased. It should be noted that the diffraction peak of η-Al5Fe2 phase is still dominating after being polished. Finally, there are three major diffraction peaks (2θ = 44.66, 65.01, and 82.31°) in the (f) pattern, which can be indexed to the (110), (200), and (211) reflections of a body centered cubic Fe (PDF No. 65-4899), respectively. Meanwhile, as shown in Figs. 1(g) and 1(h), the electron diffraction results further verify the existence of η-Al5Fe2 and θ-Al13Fe4 phase at the interface adjacent to the Fe substrate. Therefore, the diffusion layer of as-obtained Fe/Al–Ge bimetal is mainly composed of η-Al5Fe2 phase according to the relative intensities of all phases.
XRD patterns of the as-prepared Fe/Al–20 at.% Ge bimetal composites obtained through hot-dipping for 30 min at 690 °C: (a)–(f) corresponding to the XRD patterns of different positions from the surface to the Fe substrate, respectively. (g, h) corresponding to the selected-area electron diffraction (SAED) patterns of η-Al5Fe2 phase and θ-Al13Fe4 phase, respectively.

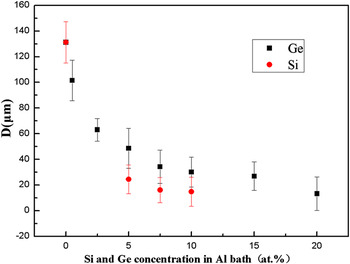
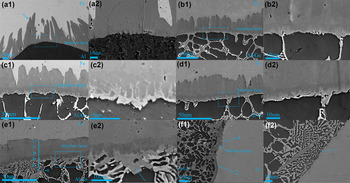
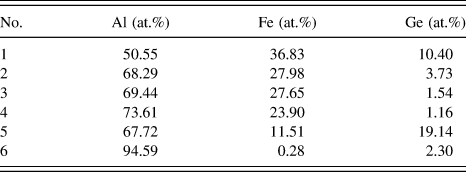
Figure 2 summarizes the relationship between the measured thickness values of diffusion layers and the Si/Ge concentration in Al bath at 690 °C for 10 min. With the measurement method of the reaction layer thickness mentioned in Ref. Reference Bouche, Barbier and Coulet7, the thickness values for each sample were measured and averaged from at least 10 measurements through the results of SEM and OM observations. With increasing Ge concentration in Al–Ge melts, the thickness of diffusion layers evidently decreases exponentially. Figure 3 shows the corresponding morphology of diffusion layers after a 10 min reaction at 690 °C between solid Fe and Al–Ge alloys with Ge atomic ratio ranging from 0 to 20 %. Figure 3(a) presents the results of the reaction of pure liquid Al with solid Fe. As marked by the blue arrow in a1, a well-known tongue-like morphology of the interface between the intermetallic layer and the Fe matrix can be clearly observed. It should be noted that the interface between the intermetallic layer and the solidified Al substrate is relatively flat. As can be seen in Figs. 3(b) and 3(c), during the reactions with the melts containing 5 at.% Ge and 7.5 at.% Ge, the thickness of the diffusion layer has a conspicuous decrease, and the front interface toward the Fe substrate becomes relatively flat, merely along with a few discontinuous valley. The reaction layers adjacent to the Al–Ge substrate show two types of intermetallic phases based on the difference of gray level. In terms of the chemical composition analyses of EDS, a representative phase composition obtained along the blue arrow in Fig. 3(e1) is given in Table I.
Si and Ge concentration dependence of the reaction layer thickness formed at 690 °C for 10 min.

FE-SEM micrographs of reaction layers between solid Fe and liquid Al–Ge alloys at 690 °C for 10 min: (a) 0 at.% Ge, (b) 5 at.% Ge, (c) 7.5 at.% Ge, (d) 10 at.% Ge, (e) 20 at.% Ge, and (f) 20 at.% Ge. (a2), (b2), (c2), (d2), and (e2) are higher-magnification views of (a1), (b1), (c1), (d1), and (e1), respectively.

Element content of different positions along the blue arrow in Fig. 3(e1).

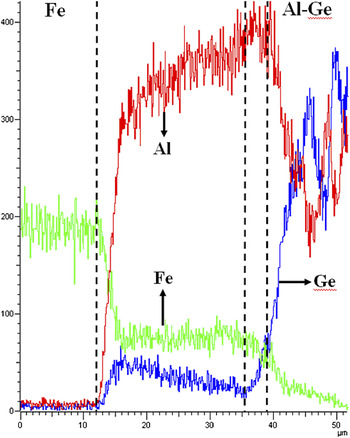
Interestingly, the EDS results presented in Table I show an abnormal trend of change in the content of Ge, i.e., a gradual increase of Ge content from the Al–Ge side of reaction layers to the Fe side of reaction layers. As shown in Fig. 4, the EDS line scan results indicate that the abnormal change behavior is apparent, where the EDS lines of Al, Fe, and Ge are colored red, green, and blue, respectively. Figures 3(d)–3(f) show representative SEM micrographs from the reaction with Al–10 at.% Ge melts and Al–20 at.% Ge melts, respectively. The thickness of reaction layers obviously decreased, and the interface at the Fe side of reaction layers is not tongue-shaped but flat. Meanwhile, some dissociative ternary Al x Fe y Ge z phases, such as the one marked with the blue arrow (solid line) in Fig. 3(e2), are observed in the Al matrix, which are presumed to originate from the reaction product of dissolved Fe with Al–Ge melts. In addition, with increasing Ge content in Al–Ge melts, some unreacted interfaces marked with blue arrow can be observed in Fig. 3(f2), which are not observed in the above-mentioned conditions, for example, the reaction with pure Al. The relationship among thickness, diffusion temperature, and diffusion time has been further analyzed according to the reactive diffusion kinetics later.
EDS line scan results obtained along the blue arrow in Fig. 3(e1).

B. Effect of melt environment on the diffusion layer
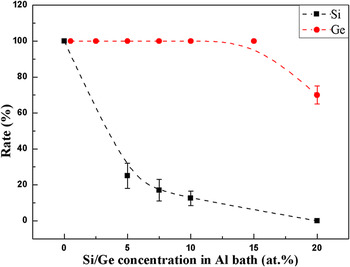
In the present work, additions of Ge into Al melts can effectively reduce the thickness of reaction layers, as shown in Figs. 3(b)–3(f), where Ge plays a similar role to Si that inhibits the growth of reaction layers. Reference Eggeler, Auer and Kaesche11,Reference Akdeniz, Mekhrabov and Yilmaz16,Reference Song, Lin, Yang and Fan22 A lot of investigations have been performed to probe the suppression mechanism of the effect of Si additions into Al on the reaction layers since Si is a common alloying element in Al-based alloys. But from the present results given in Figs. 2 and 5, Si not only evidently decreases the thickness of reaction layers during the diffusion growth stage of reaction layers but also reduces metallurgical bonding rate between solid Fe and liquid Al–Si alloy during the early reaction stage, where we define the metallurgical bonding rate as the percent of reaction interface to the whole interface. As for the metallurgical bonding rate between solid Fe and liquid Al–Ge alloy, it will decrease remarkably until the content of Ge reaches 20%, whereas the addition of a small amount of Si can lead to the remarkable decrease of the metallurgical bonding rate.
Composition dependence of metallurgical bonding rate between solid Fe and liquid Al–Si alloy and the one between solid Fe and liquid Al–Ge alloy at 690 °C for 10 min.

Based on the above analysis, we proposed that the Al melt conditions play a significant role in the triggering of reaction between Fe and Al melts. Here, we take the reaction between solid Fe and liquid Al–Si alloy as an example to explain the reaction mechanism based on the similarity of the effect of Si and Ge on the reaction layer growth. In view of the formation of η phase, θ phase, and ternary Al1−x−y Fe x Si y phase, Reference Springer, Kostka, Payton, Raabe, Kaysser-Pyzalla and Eggeler13 the following reactions at the interface are put forward:
 $${\rm{5[Al]}} + {\rm{2Fe(s)}} \leftrightarrow {\rm{A}}{{\rm{l}}_{\rm{5}}}{\rm{F}}{{\rm{e}}_{\rm{2}}}\quad ,$$
 $${\rm{3[Al]}} + {\rm{Fe(s)}} \leftrightarrow {\rm{A}}{{\rm{l}}_{\rm{3}}}{\rm{Fe}}\quad {\rm{,}}$$
 $$\!\!\!{\rm{(}}1 - x - y)[{\rm{Al}}] + y[{\rm{Si}}] + x{\rm{Fe(s)}} \leftrightarrow {\rm{A}}{{\rm{l}}_{1 - x - y}}{\rm{F}}{{\rm{e}}_x}{\rm{S}}{{\rm{i}}_y}\quad .$$
According to ∆G r < 0, which is the necessary condition for a chemical reaction to take place, the changes in the Gibbs free energy (∆G r) for reactions (1–3) can be expressed as:
 $$\Delta {G_{\rm{r}}}{\rm{(1)}} = {\Delta _{\rm{f}}}G{\rm{(A}}{{\rm{l}}_{\rm{5}}}{\rm{F}}{{\rm{e}}_{\rm{2}}}{\rm{)}} - {\rm{5}} \times RT\,{\rm{ln}}{{\rm{\alpha }}_{{\rm{Al}}}}\quad ,$$
 $$\Delta {G_{\rm{r}}}{\rm{(2)}} = {\Delta _{\rm{f}}}G{\rm{(A}}{{\rm{l}}_{\rm{3}}}{\rm{Fe)}} - {\rm{3}} \times RT\,{\rm{ln}}{{\rm{\alpha }}_{{\rm{Al}}}}\quad ,$$
 $$\Delta {G_{\rm{r}}}(3) = \,{\Delta _{\rm{f}}}G({\rm{A}}{{\rm{l}}_{1 - x - y}}{\rm{F}}{{\rm{e}}_x}{\rm{S}}{{\rm{i}}_y}) - (1 - x - y) \times RT\ln {{\rm{\alpha }}_{{\rm{Al}}}} - y \times RT\,\ln {{\rm{\alpha }}_{{\rm{Si}}}}\quad ,$$
where αAl and αSi are the activity values of Al and Si, respectively. The activity values for pure Al and pure Si are 1, which are less than 1 for Al and Si in Al–Si melts. To the best of our knowledge, reports about the activity values of Al and Si in Al–Si melts were scanty, and only a few of researches were reported. Reference Desai23 However, according to an approximate calculation, we note that the involvement of the activity values of Al and Si in Al–Si melts leads to a considerable increase in ∆G r for reactions (4) and (5). As far as we know, the reaction with a more negative value of ∆G r is more likely to be activated. Therefore, the addition of Si into Al melts results in a decrease in the activity values of Al and Si in Al–Si melts, which leads to a remarkable increase in the ∆G r, therefore the interfacial reaction between solid Fe and liquid Al–Si alloys can be suppressed. Consequently, the effect of the activity values of Al and Si in Al–Si melts on the interfacial reaction should not be neglected.
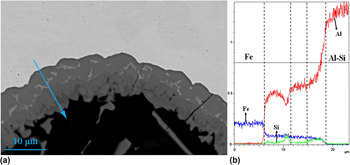
With respect to the effect of Si on inhibiting reaction layer growth, two dominant assumptions have been proposed in which Si atoms occupy the structural vacancies along the C-axis of η-Al5Fe2 phase Reference Nicholls15 and the Al1−x−y Fe x Si y phase immediately adjacent to the Al–Si alloy can impede the diffusion of Al atoms. Reference Kurakin24 However, recent work conducted by Springer et al. Reference Springer, Kostka, Payton, Raabe, Kaysser-Pyzalla and Eggeler13 reported that Si can accelerate the growth of the reaction layer formed between a low-carbon steel and semisolid Al–5 wt% Si at 600 °C and found that the Si content in the η phase is approximately equal to that in solid/liquid reactions with Al–Si melts at 675 °C (1–2 at.%). This directly challenges the first assumption mentioned above because a higher Si concentration in the η phase will be observed in case of the first assumption. Cheng and Wang Reference Cheng and Wang25 compared the thickness of intermetallic layers after mild steel was hot-dipped in aluminum baths with various silicon additions at 700 °C for 180 s. Results have shown that the increasing Si content in Al baths led to an enhanced ratio of the thickness of Fe–Al–Si layer to that of the Fe–Al layer. In the present work, a representative SEM micrograph of the reaction layer formed between solid Fe and liquid Al–5 at.% Si is shown in Fig. 6, according to the identification of different intermetallic phases in Ref. Reference Springer, Kostka, Payton, Raabe, Kaysser-Pyzalla and Eggeler13. The η, θ, τ1, and τ5 phase can be observed in Fig. 6. The corresponding SEM-EDS line scan result obtained along the blue arrow in Fig. 6(a) is shown in Fig. 6(b), where the EDS lines of Al, Fe, and Si are colored red, blue, and green, respectively.
(a) FE-SEM micrograph of the reaction layer between solid Fe and liquid Al–5 at.% Si at 690 °C for 10 min and (b) the corresponding EDS line scan result obtained along the blue arrow in (a).

C. Peculiar roles of Si and Ge atoms in the growth of the diffusion layer
Based on the results of solid Fe/liquid Al–Ge reaction and solid Fe/liquid Al–Si reaction mentioned above, both Si and Ge can restrict the growth of the intermetallic phase, with obviously different diffusion behaviors in the intermetallic phase. In the two cases, with increasing Si or Ge content in Al melts, the thickness of the reaction layer gradually decreases, and the interface between the reaction layer and the Fe substrate becomes flat, a ternary Al x Fe y Si z or Al x Fe y Ge z phase can be seen at the reaction layer in contact with Al alloy substrate, and some dissolved Al x Fe y Si z or Al x Fe y Ge z phases are observed in the Al substrate immediately adjacent to the reaction layer. Therefore, it is concluded that the suppressing mechanism of the effect of Si or Ge additions to Al on reaction layer growth can be ascribed to the inhibition of the ternary Al x Fe y Si z or Al x Fe y Ge z compound on diffusion of Al atoms. To further investigate the controlling mechanisms of Si and Ge, the formation mechanism of the interfacial layer can be deduced as follows. When Fe is dipped into Al–Si or Al–Ge melts, after the spreading wetting of Fe by Al melts, the η-Al5Fe2 phase, θ-Al13Fe4 phase, and ternary Al x Fe y Si z or Al x Fe y Ge z phases rapidly form at the original Al/Fe interface during which the formation and growth of reaction layers are dominated by the chemical reaction of solid Fe and Al–Si or Al–Ge melts. According to a previous study, Reference Bouche, Barbier and Coulet7 the reaction stage is very transient due to the high activity of reaction elements at elevated temperature. Then, a mass of Al atoms and Si or Ge atoms migrate toward the interface between Al alloys melts and reaction layers to balance the concentration of Al atoms and Si or Ge atoms consumed by the chemical reaction. The η-Al5Fe2, θ-Al13Fe4, and ternary Al x Fe y Si z or Al x Fe y Ge z phases continue to grow by means of volume diffusion. Meanwhile, the formed ternary Al x Fe y Si z or Al x Fe y Ge z phase dissolves into the Al melts due to the phase transformation at high temperature. Reference Du, Schuster, Liu, Hu, Nash and Sun26,Reference Marker, Skolyszewska-Kühberger, Effenberger, Schmetterer and Richter27
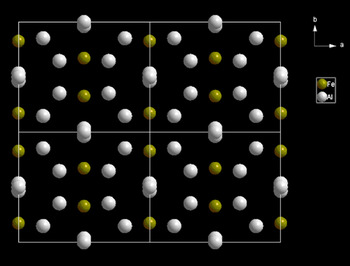
In fact, the Si or Ge atoms in ternary Al x Fe y Si z or Al x Fe y Ge z phase decrease the activity values of Al atoms, resulting in weakening the diffusion rate of Al atoms from Al melts to η-Al5Fe2 phase. Once the Al atoms pass through the ternary Al x Fe y Si z or Al x Fe y Ge z phase, the Al atoms will immediately diffuse along the C-axis of η-Al5Fe2 phase to form a new η-Al5Fe2 phase. The Si atoms will also simultaneously diffuse along the C-axis of η-Al5Fe2 phase to form τ1 phase, then irregularly precipitate in the η phase. At present, no direct relationship between the suppressing mechanism of Si atoms on reaction layer growth and the formation of τ1 phase was observed. In the case of the dipping experiments with Al–Ge melts, Ge atoms diffuse along the C-axis of η-Al5Fe2 phase but no longer form ternary Al x Fe y Ge z phase. Moreover, it is considered to occupy the crystal lattice position of the η-Al5Fe2 phase. It is known that the C-axis of the η-Al5Fe2 phase has a high open structural arrangement of atoms, Reference Burkhardt, Grin, Ellner and Peters28–Reference Hirata, Mori, Ishimaru and Koyama30 as shown in Fig. 7.
Quadruple cell structure of the Al5Fe2 crystal.

The content of Ge decreases linearly from the Fe side of the reaction layer to the Al–Ge side of the reaction layer as shown by the EDS line scan result in Fig. 4. Analyses of diffusion behaviors of Si atoms and Ge atoms in the η-Al5Fe2 phase confirm that Si and Ge atoms show different diffusion rates in the η-Al5Fe2 phase compared with the growth rate of the η-Al5Fe2 phase, but both impede the growth of Al–Fe reaction layers, which further verify that the decrease in thickness of the reaction layer is not related to the controlling mechanism that Si or Ge atoms occupy the structural vacancy of the η-Al5Fe2 phase. In addition, it is concluded that the diffusion rate of Ge atoms in the η-Al5Fe2 phase is higher than the growth rate of the η-Al5Fe2 phase. Hence, Ge atoms can diffuse without any obstacles toward the front growing interface of the η-Al5Fe2 phase, which results in a higher Ge content at the Fe side of the reaction layer than that at the Al substrate of the reaction layer.
D. Underlying mechanism of the morphology of diffusion layer
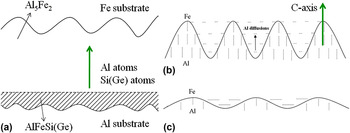
With respect to the morphology of the front growing interface, as shown in Fig. 8(a), the interface becomes relatively flat with increasing Si or Ge content in Al melts, similar to those observed in interdiffusion experiments for solid Fe/solid Al, solid Fe/solid Al–Si alloys, and solid Fe/semisolid Al–Si alloys. Reference Springer, Kostka, Payton, Raabe, Kaysser-Pyzalla and Eggeler13,Reference Naoi and Kajihara31 As shown in Fig. 8(b), when sufficient Al atoms are provided to form the reaction layer, compared with the diffusion rate along the A-axis and B-axis of the η-Al5Fe2 phase, the Al atoms diffuse preferentially along the C-axis of the η-Al5Fe2 phase, i.e., the growth of the reaction layer is mainly controlled by diffusion of Al atoms along the C-axis. Thus, the η-Al5Fe2 phase shows heterogeneous growth due to the different diffusion rates of Al atoms. Reference Tanaka and Kajihara32 Nevertheless, once the diffusion rates of Al atoms are suppressed by the effect of lower temperature such as the solid/solid interdiffusion experiments, or by the hindering effect of ternary Al x Fe y Si z or Al x Fe y Ge z phases adjacent to the Al substrate, the Al atoms show homogeneous diffusion rate along the A-axis, B-axis, and C-axis of the η-Al5Fe2 phase. Consequently, the frontier morphology of the η-Al5Fe2 phase becomes relatively flat, as shown in Fig. 8(c). Comparison of morphology formed at different experiment conditions suggests that the morphology feature of the reaction layer is closely related to the diffusion rate of Al atoms at different conditions.
(a) Schematic illustration of the growth of the reaction layer between solid Fe and liquid Al–Si or Al–Ge alloys; (b) and (c) indicate the morphology illustration of intermetallic phases under the conditions of sufficient Al atoms and insufficient Al atoms, respectively. The length of the line shows the diffusion rate of the atom, i.e., a longer line corresponds to a higher diffusion rate of the atom.

E. Kinetics of interdiffusion reaction
As described above, during the initial formation stage of the reaction layer, the layer thickness is mainly controlled by the reaction rate at a transient time. During the growth stage of the reaction layer, the total layer thickness is attributed to the result of diffusion and dissolution for the reaction layer and follows parabolic rate laws. Reference Kajihara33–Reference Portavoce and Treglia35 For the reaction diffusion controlled by diffusion with a constant diffusion source, Reference Kajihara33,Reference Wang, Wang and Lu36,Reference Zhe, Dezellus, Gardiola, Braccini and Viala37 the growth of the reaction layer can be perfectly expressed by the parabolic rate law as follows:
 $$D = K \cdot \sqrt t \quad ,$$
where D is the thickness of the reaction layer, K is a temperature dependence rate constant, and t represents the reaction time.
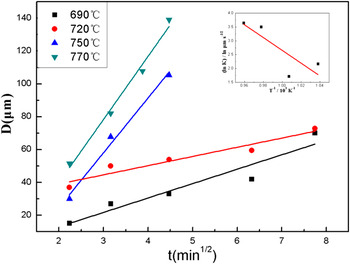
Figure 9 indicates the time dependence of the layer thickness at different temperatures. A good agreement between the measured data points and the fitting lines verifies that growth of the intermetallic layer is mainly controlled by the diffusion rate instead of the reaction rate. The reaction layer growth kinetics, as a function of temperature, was studied. The Q reveals the activation energy needed for a reaction to be excited, which can be determined from the Arrhenius relationship for rate constant K and temperature T, as shown in Formula 8.
 $$K = {K_0} \cdot \exp \left( { - {Q \over {R \cdot T}}} \right)\quad .$$
Diffusion time dependence of thickness of the reaction layer between solid Fe and liquid Al–15 at.% Ge at different temperatures. The inset shows an Arrhenius plot of the parabolic growth rate constant K for the corresponding diffusion layer.

A value of 23 kJ/mol is obtained for the overall reaction layer growth in the case of the reaction of solid Fe with liquid Al–Ge alloys, which is similar to the value (17 kJ/mol) obtained with respect to the reaction with liquid Al–Si alloys. Reference Springer, Kostka, Payton, Raabe, Kaysser-Pyzalla and Eggeler13
IV. CONCLUSIONS
The growth behaviors of diffusion layers have been investigated for the reactions between solid Fe and liquid Al–Si alloy and between solid Fe and liquid Al–Ge alloy, respectively. Comparison of diffusion layers formed in the two conditions shows that the Al–Si and Al–Ge melt conditions play a decisive role in triggering the reaction between Al melts and solid Fe. In other words, the Si and Ge elements decrease the corresponding reaction probability. Moreover, the present results further confirm the previous hypothesis that the ternary Al x Fe y Si z or Al x Fe y Ge z phase immediately adjacent to the Al substrate can inhibit the diffusion of Al atoms by decreasing the activity values of Al atoms. The phase transformations happened at the interface promote the development of the diffusion layer simultaneously accompanying its dissolution. Furthermore, in comparison with the growth rate of η-Al5Fe2 phase, the higher diffusion rate of Ge element results in a linear concentration gradient for Ge in η-Al5Fe2 phase, which has not been found during the interdiffusion between solid Fe and liquid Al–Si alloys.
ACKNOWLEDGMENTS
The authors are grateful to Xiangzhen Zhu, Tianyi Kou, Chi Zhang, Yaokun Pan, and Shulong Ye for technical assistance and enlightening discussions. The work was supported by the National Natural Science Foundation of China (Grant Nos. 51371107 and 51241007) and Science and Technology Development Project of Shandong Province (Grant No. 2013GGX10217).