Introduction
The Atlantic Forest is the second largest tropical forest on the American continent, presents the greatest latitudinal variation among the Brazilian biomes and supports high levels of biodiversity and endemism (Costa et al. Reference Costa, Leite, Da Fonseca and Da Fonseca2000, Sigrist & Carvalho Reference Sigrist and Carvalho2008, Silva et al. Reference Silva, de Sousa and Castelletti2004). However, this biodiversity has been threatened by human use (e.g. Pardini et al. Reference Pardini, Faria, Accacio, Laps, Mariano-Neto, Paciencia, Dixo and Baumgarten2009, Paviolo et al. Reference Paviolo, De Angelo, Ferraz, Morato, Pardo, Srbek-Araujo, Beisiegel, Lima, Sana, da Silva, Velázquez, Cullen, Crawshaw, Jorge, Galetti, Di Bitetti, de Paula, Eizirik, Aide, Cruz, Perilli, Souza, Quiroga, Nakano, Pinto, Fernández, Costa, Moraes and Azevedo2016, Silva & Tabarelli Reference Silva and Tabarelli2000, Souza & Alves Reference Souza and Alves2014), especially after European colonization (Dean Reference Dean1996). As a result of this anthropization, this biome has been reduced mainly to small forest fragments with only 12% of the original biome area remaining as forested (Ribeiro et al. Reference Ribeiro, Metzger, Martensen, Ponzoni and Hirota2009). Factors such as hunting, habitat loss and degradation have put Atlantic forest in a difficult situation with approximately 428 endemic endangered species (ICMBIO 2016) and countless populations collapsing (Ribeiro et al. Reference Ribeiro, Martensen, Metzger, Tabarelli, Scarano, Fortin, Zachos and Habel2011). Evidence in the literature indicates that fragmented areas also suffer indirect effects of fragmentation, such as the edge effect (Banks-Leite et al. Reference Banks-Leite, Ewers and Metzger2010, Pfeifer et al. Reference Pfeifer, Lefebvre, Peres, Banks-Leite, Wearn, Marsh, Butchart, Arroyo- Rodríguez, Barlow, Cerezo, Cisneros, D’Cruze, Faria, Hadley, Harris, Klingbeil, Kormann, Leans, Medina-Rangel, Morante-Filho, Olivier, Peters, Pidgeon, Ribeiro, Scherber, Schneider-Maunory, Struebig, Urbina-Cardona, Watlling, Willig, Wood and Ewers2017), the effects of fragment isolation (Haddad et al. Reference Haddad, Brudvig, Clobert, Davies, Gonzalez, Holt, Lovejoy, Sexton, Austin, Collins, Cook, Damschen, Ewers, Foster, Jenkins, King, Laurance, Levey, Margules, Melbourne, Nicholls, Orrock, Song and Townshend2015, Pardini et al. Reference Pardini, de Souza, Braga-Neto and Metzger2005, Vieira et al. Reference Vieira, Olifiers, Delciellos, Antunes, Bernardo, Grelle and Cerqueira2009) and the effects of the surrounding matrix (Driscoll et al. Reference Driscoll, Banks, Barton, Lindenmayer and Smith2013, Prevedello & Vieira Reference Prevedello and Vieira2010). Despite intensive study, the effect of fragmentation is still controversial, leading to recent discussions in the literature (Fahrig Reference Fahrig2017, Fahrig et al. Reference Fahrig, Arroyo-Rodríguez, Bennett, Boucher-Lalonde, Cazetta, Currie, Eigenbrod, Ford, Harrison, Jaeger, Koper, Martin, Martin, Metzger, Morrison, Rhodes, Saunders, Simberloff, Smith, Tischendorf, Vellend and Watling2019, Fletcher et al. Reference Fletcher, Didham, Banks-Leite, Barlow, Ewers, Rosindell, Holt, Gonzalez, Pardini, Damschen, Melo, Ries, Prevedello, Tscharntke, Laurance, Lovejoy and Haddad2018). These controversies show that there are still major gaps within our knowledge. Here, we evaluate the effects of field methods used in fragmentation studies to help fill this gap.
The Atlantic Forest has a great diversity of small mammals and these animals have been extensively used to understand the effects of fragmentation on this biome. It has been shown that forest specialist small mammals in fragmented landscapes have lower body condition (Delciellos et al. Reference Delciellos, Barros, Prevedello, Ferreira, Cerqueira and Vieira2018), lower abundances (Püttker et al. Reference Püttker, Pardini, Meyer-Lucht and Sommer2008, Reference Püttker, Bueno, Barros, Sommer and Pardini2013) and lower rates of immigration (Pires et al. Reference Pires, Lira, Fernandez, Schittini and Oliveira2002, Püttker et al. Reference Püttker, Bueno, Barros, Sommer and Pardini2011). These processes have contributed to a non-random pattern of species extinctions in fragments (Castro & Fernandez Reference Castro and Fernandez2004, Pardini et al. Reference Pardini, Bueno, Gardner, Prado and Metzger2010). Specialist small mammals are affected by habitat fragmentation because they are unable to use most of the matrix areas, such as croplands and pasturelands (Castro & Fernandez Reference Castro and Fernandez2004). They are therefore replaced by generalist species more capable of using these habitats (Feliciano et al. Reference Feliciano, Fernandez, Freitas and Figueiredo2002, Pardini et al. Reference Pardini, Faria, Accacio, Laps, Mariano-Neto, Paciencia, Dixo and Baumgarten2009, Reference Pardini, Bueno, Gardner, Prado and Metzger2010). Although the main effects of fragmentation on small mammals are well known, the intensity of those effects depends on many factors, such as the fragmentation pattern, the permeability of the matrix to species movements and the spatial scale evaluated (Hill & Hamer Reference Hill and Hamer2004, Olifiers et al. Reference Olifiers, Gentile and Fiszon2005, Pardini Reference Pardini2004, Prevedello & Vieira Reference Prevedello and Vieira2010, Vieira et al. Reference Vieira, Olifiers, Delciellos, Antunes, Bernardo, Grelle and Cerqueira2009). The effect of fragmentation and the resulting species-area relationship can be accentuated by ecological patterns not related to human changes, such as the effect of latitudinal variation on species richness (Meixler et al. Reference Meixler, Fisher and Sanderson2019). Knowledge on the responses of small mammals to fragmentation is particularly important as it has been used as a surrogate for environmental quality (Pardini et al. Reference Pardini, Bueno, Gardner, Prado and Metzger2010) and to support conservation decisions (Banks-Leite et al. Reference Banks-Leite, Pardini, Tambosi, Pearse, Bueno, Bruscagin, Condez, Dixo, Igari, Martensen and Metzger2014) in Atlantic Forest biome.
To have a clear understanding of how fragmentation affects small mammals and, consequently, to be able to make informed conservation decisions from sound environmental quality assessments it is critical to use appropriate survey methods (Bovendorp et al. Reference Bovendorp, McCleery and Galetti2017). An adequate sample protocol can diminish the effect of imperfect detection of both large and small-bodied mammals (Banks-Leite et al. Reference Banks-Leite, Pardini, Tambosi, Pearse, Bueno, Bruscagin, Condez, Dixo, Igari, Martensen and Metzger2014). However, to conduct an efficient trapping sample can be difficult. Methods vary in terms of trapping effort, the type of trap used, the bait attractant, where the traps are placed in the forest microhabitats and a combination of these effects. Additionally, different species in a community respond differently to trapping methods (De Bondi et al. Reference De Bondi, White, Stevens and Cooke2010, Gaston Reference Gaston2000, Karp et al. Reference Karp, Rominger, Zook, Ranganathan, Ehrlich and Daily2012, Umetsu et al. Reference Umetsu, Naxara and Pardini2006) and the same method can lead to confounding results regarding community and population studies (Barros et al. Reference Barros, Puttker, Pinotti and Pardini2015). Several authors agree that further investigations on the performance of different sampling methods are still necessary (Ardente et al. Reference Ardente, Ferreguetti, Gettinger, Leal, Martins-Hatano and Bergallo2017, Balieiro et al. Reference Balieiro, Behs, Graipel, Dornelles, Tiepolo and Cremer2015, Barros et al. Reference Barros, Puttker, Pinotti and Pardini2015, Grazzini et al. Reference Grazzini, Mochi-Junior, De Oliveira, Pontes, Gatto-Almeida and Tiepolo2015). Although previous studies have analysed which sampling methods maximize observed small mammal richness in the Atlantic forest biome (Bovendorp et al. Reference Bovendorp, McCleery and Galetti2017, Moura et al. Reference Moura, Grelle and Bergallo2008), they did not analyse to what extent this sampling bias can mask important ecological patterns in forest fragments, such as the effects of the surrounding matrix and the effect of the still unclear species-area relationship (Fahrig Reference Fahrig2017, Fahrig et al. Reference Fahrig, Arroyo-Rodríguez, Bennett, Boucher-Lalonde, Cazetta, Currie, Eigenbrod, Ford, Harrison, Jaeger, Koper, Martin, Martin, Metzger, Morrison, Rhodes, Saunders, Simberloff, Smith, Tischendorf, Vellend and Watling2019, Fletcher et al. Reference Fletcher, Didham, Banks-Leite, Barlow, Ewers, Rosindell, Holt, Gonzalez, Pardini, Damschen, Melo, Ries, Prevedello, Tscharntke, Laurance, Lovejoy and Haddad2018).
Our aim in this study was two-fold: we tested for the effects of methods and for the effects of the main environmental variables on observed small mammal richness on fragments of Atlantic forest. We predicted that methods will have an important role in explaining species richness variation among fragments. We also predicted that the environmental variables will be important to explain species richness variation. Our specific predictions related to each tested variable on methods were: (i) small mammal richness will be higher in fragments sampled with greater sampling effort; (ii) small mammal richness will be higher in fragments sampled with pitfall traps along with live-traps; (iii) small mammal richness will be higher in fragments sampled in all forest strata; (iv) sampling during all climatic seasons will be important to record more species; and (iv) more diverse baits will attract more species. Regarding the environmental variables, our specific predictions were: (i) fragments in higher latitudes will have lower small mammal richness; (ii) bigger fragments will have higher small mammal richness and (iii) fragments surrounded by matrix types that are similar in vegetation structure with the original forest will have higher species richness.
Methods
Literature search and data preparation
To identify studies for our analysis, we searched for scientific publications in Portuguese and English using the search tools on Scopus (www.scopus.com), Google Scholar (scholar.google.com.br) and the core catalogue of Web of Science (www.isiknowledge.com), using the following keywords: ‘small mammals’ AND ‘fragmentation’ AND ‘Atlantic Forest’ AND ‘Brazil’, and the Portuguese version: ‘pequenos mamíferos’ AND ‘fragmentação’ AND ‘Mata Atlântica’ AND ‘Brasil’. We considered only papers and theses conducted in the domains of the Atlantic Forest biome and published until 2016. Additionally, we used the data set presented by Figueiredo et al. (Reference Figueiredo, Barros, Delciellos, Guerra, Cordeiro-Estrela, Kajin, Alvarez, Asfora, Astúa, Bergallo, Cerqueira, Geise, Gentile, Grelle, Iack-Ximenes, Oliveira, Weksler and Vieira2017) on the abundance of small mammals in the Atlantic Forest.
Papers were searched considering each studied fragment for the following information: small mammals species richness; fragment latitude; fragment size; matrix composition; trapping effort (number of traps × night in each fragment); type of traps used (pitfalls or live-traps); type of baits used (where a non-meat based bait refers to bait composed only of vegetables, i.e. corn flour or peanut butter, while meat-based bait contains vegetables along with meat products or fish oil); vertical stratification of the forest where the traps were placed (ground level, understorey and/or canopy) and seasons sampled (if the sampling was carried out in all climatic seasons – winter, summer, spring and autumn, or not). Some papers failed to present some of the necessary data and the authors were contacted and asked if they could provide the missing information. Even after writing to the authors, some studies could not be used in our analysis, as they presented only summarized information; especially when they sampled several fragments and showed only the mean species richness among the fragments (e.g. Pardini Reference Pardini2004, Umetsu & Pardini Reference Umetsu and Pardini2007). Additionally, as the description of the fragments sampled varied between accurate to more general ones, fragment sizes were categorized in four classes: SS: between 1–9 hectares, S: between 10–99 ha, M: between 100–999 ha and L: larger than 1000 ha.
The main matrix types reported by the authors in the analysed studies were croplands, pasturelands, water bodies and urban areas. Prior to the analysis, these data on matrix composition were summarized using a Principal component analysis (PCA). The first two axes of this PCA (PC1 and PC2) were used on the analyses and together they represented 68.8% of the original data variation (Table 1).
Eigenvalues of the first two axes (PC1 and PC2) of a Principal component analysis (PCA) of the matrix composition around 122 forest fragments in the Atlantic Forest biome. Together these axes represent 68.8% of the original data variation.

Statistical models
We analysed the effects of methodological and environmental variables separately using multiple linear regression models. To analyse the importance of each variable related to methods, we created 32 models using the combinations of the five variables (trapping effort, vertical stratification, type of trap, seasons sampled and type of bait) and a null model (see Supplementary Materials). Considering the environmental variables, we created 16 models with the combinations of the four analysed variables (latitude, fragment size, and the two PCA axes for matrix composition) and a null model (see Supplementary Material).
Models were compared using the Akaike information criteria, corrected (AICc) for small sample sizes (Burnham & Anderson Reference Burnham and Anderson2002). The model with the smallest value of AICc was considered the best supported model and all models with ΔAICc less than two were considered important models to explain the variation of small mammal richness. The selected models were validated by checking their residual plots. The importance of each variable was evaluated by using the sum of the models’ weight that included each variable. The model weight (wi) represents the relative likelihood of a model considering the set of models created. The importance analysis output consists of values ranging between zero and one, where zero represents a variable with no importance and a value of one represents a variable that is very important.
Additionally, we used a regression tree analysis to investigate how the methodological and the environmental variables interact among themselves to determine small mammal species richness in the analysed fragments. The regression tree is a recursively branching tree that describes the direct relationships between the response variable (small mammal species richness) and the predictor variables (methodological and environmental variables). The regression tree analysis starts from the root, which contains the whole dataset, species richness variation considering all fragments. From the root, tree analysis creates a series of dichotomous classifications, attempting to split the response variable into more homogeneous groups as it progresses into the smaller branches and finally into the leaves. All methodological and environmental variables are included as possible predictors, and each predictor variable can be used to split the data more than once. A full saturated tree would only contain single observations in each leaf, with no classification error. However, to avoid over-fitting the data with too many splits, the tree must be pruned. To inform the optimal levels to prune the tree, we use a 10-fold cross validation where the data is split into 10 randomly selected folds and fits each sub-tree on each training fold. We pruned the tree choosing the one with the smallest number of branches that had a cross-validation error within one standard error of the minimum error recorded in the sequence of trees (Zhang & Singer Reference Zhang and Singer2010).
All the analyses were performed in the R environment, version 3.5.1 (R Core Team 2018); the MuMIn package was used for model selection procedures (Barton Reference Barton2018) and Rpart (Therneau et al. Reference Therneau, Atkinson, Ripley and Ripley2018) and Rpart.plot (Milborrow Reference Milborrow2017) packages for the regression tree analysis.
Results
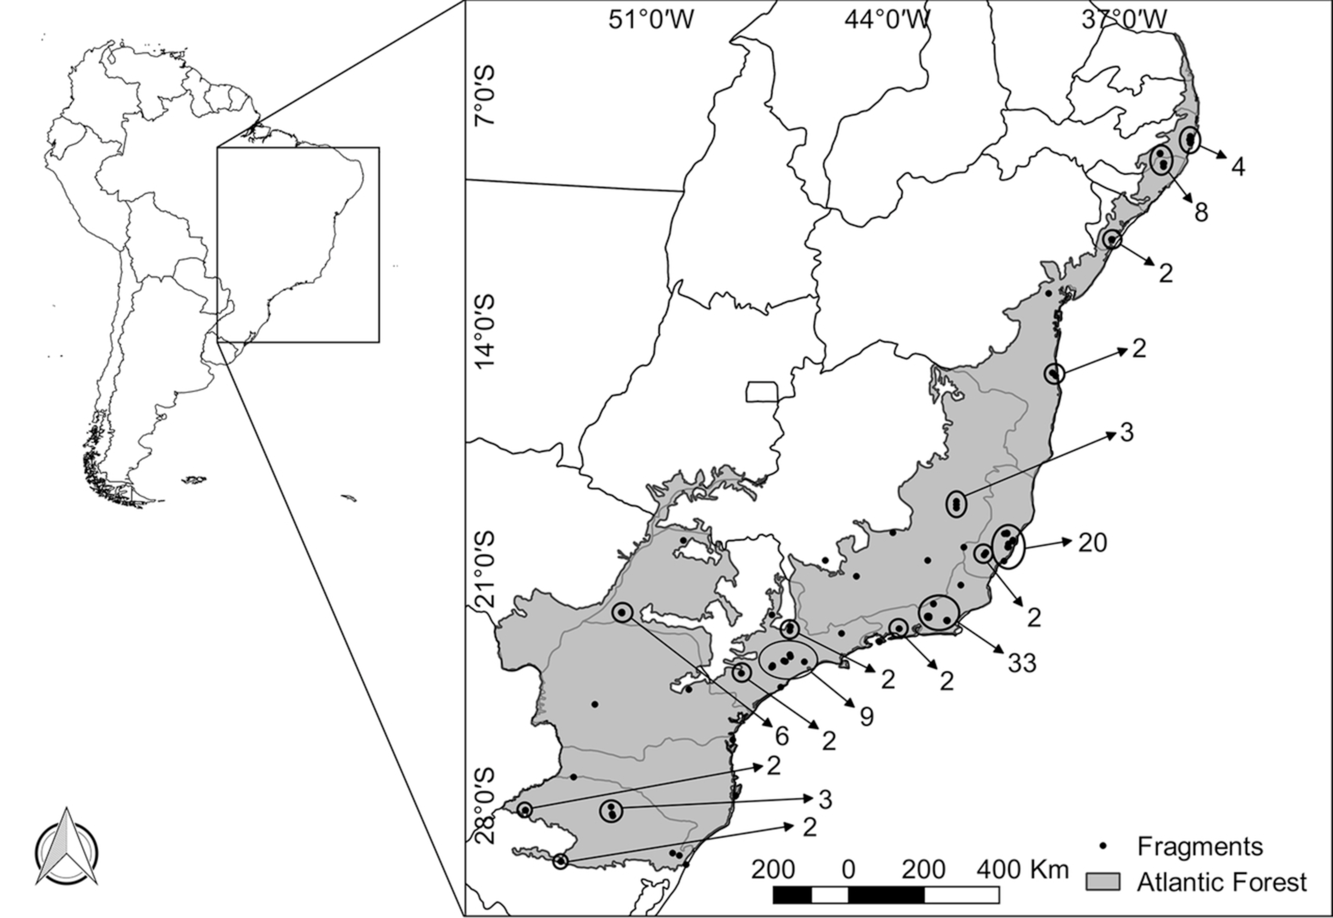
The literature search resulted in 51 studies (peer-reviewed papers and theses that were available online) from which we obtained data for 122 fragments (detailed information is available in the Supplementary Material). Mean species richness was 8.26 and varied between 0 and 23 species in each fragment; fragment latitude varied from −8.30° to −29.75° (Figure 1); we had 16 very small fragments – SS; 42 small fragments – S; 36 medium fragments – M; and 18 large fragments – L; trapping effort varied between 168–20 200 trap × nights per fragment with a mean of 3588 and median of 1680 trap × nights; 43 fragments used non-meat based baits and 77 used meat-based baits, while two papers did not report the bait composition; all fragments were sampled with live-traps and 30 were also sampled with pitfall traps; all fragments were sampled at ground level, 80 also sampled the understorey, and 14 sampled the ground level, the understorey and the canopy; 62 fragments were studied in all climatic seasons.
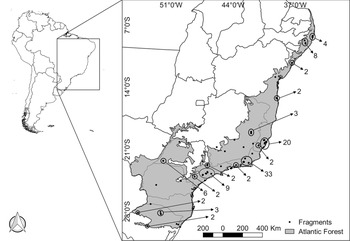
Locations of the 122 forest fragments in the Atlantic Forest that had their small mammal richness observed. The number of fragments studied is shown apart when they are too close to be identified on the map.
Among the 32 candidate methodological models (including all possible combinations of the five methodological variables and one null model), only one top model was identified with a ΔAICc < 2 (Table 2 and Supplementary Material 2). This model included all variables and it indicates that studies with greater trapping effort recorded more species; studies that used pitfall traps along with live-traps recorded more species than fragments sampled only with live-traps; fragments sampled in all vertical strata recorded more species than fragments sampled only on ground level (Figure 2 and Figure 3); fragments that were sampled during all climatic seasons recorded fewer species and studies that used meat-based baits recorded more species (Figure 2).
Fit and selection statistics of models affecting small mammal richness in the 122 forest fragments studied in Atlantic forest biome. Model selection was conducted separately for environmental and methodological variables. Δ = difference between the AICc of model i and the model with the lowest AICc. wAICc = Akaike weight. Also presented is the R2 – the percentage of the variance explained by each model. Models with ΔAICc > 2 are shown in the Supplementary Material.

Trap. Effort = trapping effort; Vert. Strat = vertical stratification; Frag. Size = Fragment size; PC1m = first axis of the PCA for matrix composition; PC2m = second axis of the PCA for matrix composition.
Variables coefficient and their confidence interval in (a) the best methodological model and in (b) the three best environmental models (models with ΔAICc < 2) to explain the variation of small mammal richness among the 122 forest fragments studied in the Atlantic Forest biome. Also presented (in parentheses) are the variables’ importance values, which refer to the sum of the Akaike weight of all the models that contain each variable; variables’ importance values closer to 1.0 indicate great importance of this variable. Met.model = Methodological model; Trap. Effort = trapping effort; VS.GU = vertical stratification of traps sampling the ground level and the understorey; VS.GUC = vertical stratification of traps sampling the ground level, the understorey and the canopy; Env.model 1 to 3 = Environmental models in order of increasing AIC values; Frag. Size.M = fragments of medium size; Frag. Size.S = fragments of small size; Frag. Size.SS = fragments of super small size; PC1matrix = first axis of the PCA for matrix composition; PC2matrix = second axis of the PCA for matrix composition.

Effect of trapping effort and type of trap on small mammal richness detected in 122 forest fragments in the Atlantic Forest biome. Filled symbols indicate fragments studied with pitfall traps and live-traps; unfilled symbols indicate fragments studied only with live-traps. The solid line indicates the effect of trapping effort on species richness considering only studies that used pitfall traps; the dashed line indicates the effect of trapping effort on species richness considering only studies that did not use pitfall traps. Also indicated is the vertical stratification regarding where the traps were placed inside the forest: G – ground level; GU – ground level and understorey; GUC – ground level, understorey and canopy.

Among the 16 environmental candidate models, three models had a ΔAICc < 2 (Table 2). The effect of latitude was present in the three models and it indicates that fragments at lower latitudes had higher species richness (Figure 2). The effect of fragment size was also present in the three models and it indicates that the small fragments had lower species richness (Figure 2). The first axis of the PCA for matrix composition and the second axis of this PCA were presented in two models each (see Table 2). The relationships found for matrix composition in both cases indicate that fragments with matrix composed by croplands had higher species richness than fragments with matrix composed by pasturelands (see Table 1 for PCA eigenvalues and Figure 2 for its effects on small mammal richness).
The residual plot showed that the variation in the original data that was not predicted by our models is uniformly distributed across the original variation in the response variable (small mammal richness).
The final cross-validated regression tree had five nodes and six leaves (Figure 4). This was the optimal size considering the cross-validated error and each leaf created increased the explanation of the tree by at least 2% (cp = 0.02; see Supplementary Material). The regression tree showed that the trapping effort was the most important variable, being the first root node. Fragments with smaller trapping effort recorded fewer species. After considering the importance of the trapping effort, the tree was divided into two decision nodes. For fragments with smaller sampling effort, the second and third most important variable was latitude. For fragments with greater sampling effort, the second most important variable was the use of pitfall traps and the third was latitude. When considering the fragments with smaller trapping effort, the effect of latitude is unclear; the highest values of species richness were found in intermediate latitude.
Cross-validated regression tree indicating the most important methodological and environmental variables associated with small mammal richness in 122 fragments of Atlantic forest. The values of each splitting variable indicate the threshold used to create each decision node and are shown on the branch they created. Each leaf (the terminal nodes) contains their expected values of small mammal species richness and the percentage of the data related to this leaf. Latitude values are shown as negative values as they refer to the southern hemisphere.

Discussion
Observed small mammal species richness within the endangered Atlantic Forest biome was found to be influenced by both methodological and the environmental variables. However, even though the methodological and environmental models were important to explain the variation in small mammal richness among fragments, the regression tree demonstrated that trapping effort was the most important variable when considering methods and environment together. This highlights the importance of adequate methods when studying the effects of fragmentation on small mammals. This is a major issue, especially when considering that the sampling protocols used in the analysed fragments were highly variable. For instance, trapping effort analysed here varied by two orders of magnitude, varying between 168–20 200 trap × nights. If we consider the median values of each methodological variable, a standard sampling method would have only 1680 trap × nights, trapping would be conducted only with live-traps and they would not sample the canopy of the forest. In fact, they would fail to attend to all of the most influential variables on the methodological model, i.e. to have a great trapping effort, to use pitfall traps and to sample the canopy as well as the understorey and the ground level. Therefore, even though there are a considerable number of small mammal studies in Atlantic Forest fragments, the methods of most of the studies were not able to accurately characterize the local biodiversity and their results might be severely affected by sampling bias. This should be especially noted in species surveys for environmental assessments, where the rarest and the specialist species have great importance.
Bovendorp et al. (Reference Bovendorp, McCleery and Galetti2017) indicated the importance of pitfall traps for small mammals when analysing both Atlantic Forest fragments and continuous forest sites, emphasizing the importance of this method for environmental impact studies, which in general use only live-traps. Pitfall traps are largely considered as an efficient method in community studies with small mammals (e.g. Barros et al. Reference Barros, Puttker, Pinotti and Pardini2015, Bovendorp et al. Reference Bovendorp, McCleery and Galetti2017, Lyra-Jorge & Pivello Reference Lyra-Jorge and Pivello2001, Ribeiro-Júnior et al. Reference Ribeiro-Júnior, Rossi, Miranda and Ávila-Pires2011, Santos-Filho et al. Reference Santos-Filho, Lázari, Sousa and Canale2015, Umetsu et al. Reference Umetsu, Naxara and Pardini2006). They are less selective, do not use baits, and can trap more than one individual per trap and capture species rarely recorded in live-traps (Barros et al. Reference Barros, Puttker, Pinotti and Pardini2015, Bovendorp et al. Reference Bovendorp, McCleery and Galetti2017, Umetsu et al. Reference Umetsu, Naxara and Pardini2006). Our results agreed with these previous studies, indicating the use of pitfall traps is an important factor that influences small mammal species richness. For the same trapping effort, fragments that were sampled with pitfall traps had 1.7 species more than studies that sampled only with live-traps. Despite this, pitfall traps are still rarely used in small mammal studies as they are hard to implement and most researchers in developing countries do not have the available funds to hire field assistants, relying on researchers and volunteers. Additionally, most of the remnants in Atlantic Forest are on mountainsides with shallow soil, which makes it almost impossible to dig and install pitfall traps. As a method that is hard to implement, the sampling effort of studies that used pitfall traps had smaller trapping efforts than studies that used only live-traps. The mean trapping effort for pitfall and live-traps combined was 2480 trap × nights and the mean trapping effort for live-traps only was 4000 trap × nights; no study with pitfall traps had more than 7420 trap × nights (see Figure 2). However, this difference in the trapping effort when sampling only with live-traps was not enough to compensate for the importance of the pitfall traps. According to our methodological model, if a research budget, workforce or soil type do not allow the use of pitfall traps, at least 4100 trap × nights of live-traps would need to be added to obtain comparable results.
Our results also indicated two additional variables that would increase the recorded species richness: sampling all vertical strata of the forest and use of meat-based baits. However, the confidence interval of the estimated effect of the bait composition on small mammal richness did overlap zero and therefore this minor positive effect might not have a great influence on observed small mammal richness. On the other hand, sampling the canopy and the understorey of the forest along with the ground seems to be very important to record more species, with comparable effects to trapping effort. Our result regarding sampling all vertical forest strata corroborates previous studies that found an increased probability of capturing species with different habitat requirements when sampling the canopy and the understorey, especially strictly arboreal species (Abreu & Oliveira Reference Abreu and Oliveira2014, Graipel et al. Reference Graipel, Cherem, Monteiro-Filho and Glock2006). Vertical segregation in the use of space by small mammals occurs because it reduces interspecific competition and favours the coexistence of a higher number of species (Dalmagro & Vieira Reference Dalmagro and Vieira2005, Passamani Reference Passamani1995, Vieira & Monteiro-Filho Reference Vieira and Monteiro-Filho2003) and, as a consequence, some species become specialist in using the highest strata of the forest.
Sampling small mammals during all seasons – winter, spring, summer and autumn – was found to reduce the number of species recorded at the site. However, this result needs to be interpreted cautiously; it is unlikely that sampling all seasons will reduce the recorded species richness. Additionally, the confidence interval of this mean effect did overlap zero and this effect might not be relevant. What is relevant is that, contrary to our hypothesis, sampling all seasons did not increase the number of recorded species. Therefore, considering the difficulties of conducting fieldwork in tropical and developing countries discussed above, it is more important to have a bigger trap effort, to use pitfall traps and to sample the understorey and the canopy, regardless of the climatic seasons sampled for small mammals in Atlantic forest fragments.
The latitudinal gradient assumes that species diversity increases as the latitude decreases and this gradient is cited in the literature as a key factor in species richness determination (e.g. Pianka Reference Pianka1966, Pyron & Wiens Reference Pyron and Wiens2013, Rohde Reference Rohde1992, Stevens Reference Stevens1989, Willig et al. Reference Willig, Kaufman and Stevens2003). Our results confirmed this ecological gradient, as they indicated that fragments nearer to the Brazilian north-east had higher species richness than areas further south. Although the latitudinal gradient is a well-known ecological pattern, our results are the first to confirm this pattern for tropical fragmented areas. Studies focused on true islands have found an important co-effect of latitude in the species-area relationship (Sólymos & Lele Reference Sólymos and Lele2012). The same was found in a multi-taxa study considering several protected areas in the East Coast of the USA (Meixler et al. Reference Meixler, Fisher and Sanderson2019). Fragmented landscapes are not true islands but they are subject to a series of anthropization effects that impoverish their biodiversity (Haddad et al. Reference Haddad, Brudvig, Clobert, Davies, Gonzalez, Holt, Lovejoy, Sexton, Austin, Collins, Cook, Damschen, Ewers, Foster, Jenkins, King, Laurance, Levey, Margules, Melbourne, Nicholls, Orrock, Song and Townshend2015, Krauss et al. Reference Krauss, Bommarco, Guardiola, Heikkinen, Helm, Kuussaari, Lindborg, Ockinger, Partel, Pino, Poyry, Raatikainen, Sang, Stefanescu, Teder, Zobel and Steffan-Dewenter2010, Pardini et al. Reference Pardini, Bueno, Gardner, Prado and Metzger2010) and it is remarkable that this biodiversity impoverishment was not enough to negate the effects of latitude, a ubiquitous effect. Considering our results, we suggest that future studies should take into account the possible effects of latitude, especially in a biome such as the Atlantic Forest, which has a latitudinal range of 29° (Ribeiro et al. Reference Ribeiro, Metzger, Martensen, Ponzoni and Hirota2009).
Our results also confirmed the effect of fragment size on observed small mammal richness, corroborating previous studies (Bregman et al. Reference Bregman, Sekercioglu and Tobias2014, Fahrig Reference Fahrig2003, Magioli et al. Reference Magioli, Ribeiro, Ferraz and Rodrigues2015, Pardini et al. Reference Pardini, de Souza, Braga-Neto and Metzger2005, Pires et al. Reference Pires, Fernandez, Barros, Rocha, Bergallo, Rocha, Bergallo, Van-Sluys and Alves2006, Vieira et al. Reference Vieira, Olifiers, Delciellos, Antunes, Bernardo, Grelle and Cerqueira2009). Fragment size and/or habitat amount is considered one of the most important drivers of richness and composition of mammals within fragmented areas (e.g. Andren Reference Andren1994, Chiarello Reference Chiarello1999, Magioli et al. Reference Magioli, Ribeiro, Ferraz and Rodrigues2015, Pardini et al. Reference Pardini, de Souza, Braga-Neto and Metzger2005, Vieira et al. Reference Vieira, Olifiers, Delciellos, Antunes, Bernardo, Grelle and Cerqueira2009). It is considered that bigger forest areas will have more habitat availability and quality (Passamani & Fernandez Reference Passamani and Fernandez2011), thus food availability will be higher, reducing competition and predation risk for small mammal species (Vieira et al. Reference Vieira, Grelle and Gentile2004). However, the effects of fragment size and habitat amount are hard to separate and are the main cause of the most recent disagreements in landscape ecology (see Fahrig Reference Fahrig2017, Fahrig et al. Reference Fahrig, Arroyo-Rodríguez, Bennett, Boucher-Lalonde, Cazetta, Currie, Eigenbrod, Ford, Harrison, Jaeger, Koper, Martin, Martin, Metzger, Morrison, Rhodes, Saunders, Simberloff, Smith, Tischendorf, Vellend and Watling2019, Fletcher et al. Reference Fletcher, Didham, Banks-Leite, Barlow, Ewers, Rosindell, Holt, Gonzalez, Pardini, Damschen, Melo, Ries, Prevedello, Tscharntke, Laurance, Lovejoy and Haddad2018). However, whether the effects of fragmentation per se exist or not, the situation of the Atlantic forest biome, which is highly fragmented and has a small portion of its original area forested (Ribeiro et al. Reference Ribeiro, Metzger, Martensen, Ponzoni and Hirota2009), is critical for the conservation of the native small mammal species.
The effect of the matrix on fragmented biodiversity is well documented (e.g. Dauber et al. Reference Dauber, Hirsch, Simmering, Waldhardt, Otte and Wolters2003, Kupfer et al. Reference Kupfer, Malanson and Franklin2006, Prevedello & Vieira Reference Prevedello and Vieira2010) and species resistance to extinction in fragmented landscapes may be determined mostly by their matrix tolerance (Castro & Fernandez Reference Castro and Fernandez2004, Gascon et al. Reference Gascon, Lovejoy, Bierregaard, Malcolm, Stouffer, Vasconcelos, Laurance, Zimmerman, Tocher and Borges1999, Umetsu & Pardini Reference Umetsu and Pardini2007). The relationship of the PCA axes with species richness indicated that fragments surrounded by croplands would have higher richness than fragments surrounded by pasturelands. However, the confidence intervals of the effect of both axes of the PCA did overlap zero and their importance values were the smallest among all variables. Therefore, in our analyses, where matrix composition was only analysed in coarse categories, its effect on determining species richness was not as important as the effect of latitude and the effect of fragment size. Additionally, our main hypothesis regarding matrix composition, which was that matrix types more similar in vegetation structure to the fragments will be more beneficial to native species (Prevedello & Vieira Reference Prevedello and Vieira2010), could not be properly tested, as none of the analysed matrix types were similar in vegetation structure to the Atlantic Forest fragments.
Conclusion
We analysed important issues related to fragmented landscapes, analysing 122 fragments in one of the most fragmented biomes in the world. Our environmental analysis confirmed important biological patterns in fragmented landscapes: fragments in lower latitudes and bigger fragments were the ones with higher species richness, where the latitudinal effect on fragmented tropical biodiversity was first evaluated. Our results reinforce that the Atlantic Forest biodiversity is under severe threat, especially when considering that most of the forest remnants of Atlantic forest are small fragments. Therefore, it is necessary to guarantee the conservation of the last forest remnants, especially enforcing the protection of large forested areas that are still not legally protected. Nonetheless, our analysis revealed that recorded species richness in fragmented areas largely depends on the methods used: it is necessary to have intense trapping effort, use pitfall traps and sample all vertical strata of the forest to obtain a reliable richness estimate of small mammals in Atlantic Forest fragments. Otherwise, inadequate sampling may fail to detect the real richness in fragments and increase the noise on further analysis, such as the effect of fragment size versus habitat amount and the effects of habitat quality.
Supplementary material
To view supplementary material for this article, please visit https://doi.org/10.1017/S0266467420000048
Acknowledgements
We are thankful to Camila Barros, Anthony Rendall and Calvin Lee for reviewing this manuscript.
Financial support
Personal grants were given by FAPERGS – Fundação de Amparo à Pesquisa do Estado do Rio Grande do Sul for DPR and JOS, and by PET/SESu/MEC – Programa de Educação Tutorial for FLS.