I. INTRODUCTION
The properties of solid compounds aroused the interest of many researchers in various areas of human knowledge. One class of these solids, the nitrides, is important particularly due to its application in industry and science. Understanding how the nitrides are constructed and obtained is scientifically interesting because they are used in the high technology equipment industry which is growing every year. There are many experimental ways of obtaining these compounds which are expensive and harmful to the environment. Recently, some methods of electronic structure calculation were successful in describing the ground state properties of the solids, allowing the understanding of few macroscopic properties.Reference Rahnamaye Aliabad, Fathabadi and Ahmad1–Reference Reshak, Lakshminarayana, Ebothe, Fedorchuk, Fedyna, Kamarudin, Mandracci and Auluck3
Among nitrides there is a special group: substituted iron nitrides type MxFe4–xN, which have the advantage of having a simple structure and, like other nitrides, having many applications in industry. In this work, the substituted iron iridium nitrides (M = Ir) will be studied. In the literature, we found some theoretical and experimental worksReference Paduani4–Reference von Appen and Dronskowiski6 where the iridium nitrides share space with other nitrides. In this article, we will focus on the substituted nitride IrFe3N, Fe3IrN, and the binary alloys of Fe–Ir with respect to modifications caused in its electronic and magnetic structure with the introduction of the interstitial nitrogen in the IrFe3 and Ir3Fe alloys. The motivation is primarily to answer questions that other studies have not: What is the equilibrium cohesive energy? What are the structural and magnetic changes caused by the introduction of a nitrogen atom in the Fe–Ir alloys?
With the development of ab initio methods and the emergence of new increasingly sophisticated computer technologies, the study of ground state properties of materials is rapidly advancing and allowing resource saving and use of more environmentally friendly methods, since they allow the obtainment of properties of compounds before they are synthesized.
This study is divided as follows: the first part of the paper discusses the computational method used, showing the most relevant parameters necessary to achieve the proposed objectives. The second section discusses the results, starting with the discussion on the cohesive energy and the formation of alloys and nitrides where the parameters at steady state are obtained. After that the influence of pressure on the electronic and magnetic structure and on the hyperfine properties is discussed. The next step is to understand the properties at the equilibrium state: density of states (DOS) and band structure. Finally, the most important conclusions and the possible use of this type of work to design new and better compounds in the near future are shown.
II. COMPUTATIONAL METHOD AND CRYSTAL STRUCTURE USED
Understanding the distribution of electrons in solids allows the understanding of some of their physical properties. This implies that the basic problem is to calculate the steady states of a system of interacting electrons in motion subjected to a periodic electrostatic field originated by fixed nucleus, i.e., to obtain the electronic structure of solids. When the fixed nucleuses are referred, the Born-Oppenheimer approximation is used, i.e., electrons and nucleuses are treated separately. This enables the calculation of the ground state energy depending on the nucleuses positions, and that can be used at a later stage for the calculation of the energy of formation. To determine the electronic structure of solids, it is necessary to consider an infinite number of interacting fermions.Reference Skriver7 In actual calculation, we are led to make some approximations, such as the approach of an electron. In this case, as a first step, the Schrödinger equation is solved using an electron, which is moving through a medium field of other electrons plus the field of nucleuses. This medium field is determined by the distribution of electronic charge plus the correction by exchange and correlation effects, being usually self-consistently calculated using Hartree–Fock theory.Reference Andersen8 The calculations are based on the density functional theory with generalized gradient approximation (GGA) and the potential for exchange and correlation.Reference Andersen8 The radius of Wigner–Seitz spheres was 1.70 Å for all atoms. Within the Muffin-Tin spheres, the densities of charge, the potential and wave functions are expanded in terms of spherical harmonics. To ensure convergence for the Brillouin zone, 1000 k-points were used. The linearized augmented plane waves (LAPW) method is an augmented plane wave (APW – method of Slater) modification.Reference Slater9 The basic idea that motivated the construction of the LAPW basis is the fact that the crystalline potential is approximately flat in distant regions of the nucleus and therefore, the solution for the Schrödinger equation can be expressed as a linear combination of a reasonable number of plane waves. The potential suffers large oscillations in the regions close to the nucleuses and the solution requires the combination of a very large number of plane waves. Therefore, the electronic wave functions are best represented by the product of two factors: a radial function equivalent to the solution of the radial Schrödinger equation with the spherical part of crystalline potential and another that describes the dependence of the angles through the spherical harmonics. As a result, the crystalline space is divided into two distinct regions, where the different basis sets are used. This adaptation is achieved by dividing the unit cell into nonoverlapping atomic spheres (centered at the atomic sites) and an interstitial region.Reference Blaha, Schwarz and Luitz10 The total energy in the LAPW method is attained when we solve the Hamiltonian [Eq. (1)]:
 $$H = - \mathop \sum \limits_i^N \left( {{{{h^2}\nabla _i^2} \over {2m}} + {{Z{e^2}} \over {\overrightarrow {{r_i}} - \vec R}}} \right) + \mathop \sum \limits_i^N {{{q^2}} \over {\overrightarrow {{r_i}} - \overrightarrow {{r_j}} }}\quad .$$
The terms of the equation are in the order as follows: kinetic energy of electrons, coulombic potential energy – nucleus–electron and electron–electron and the terms at the end are the nonclassical effects of exchange and correlation. The sum is performed over all the electrons in the unit cell considering the interactions of an i-th electron with the j-th electron of the same or other atom. This energy will be used to calculate the energy of formation of alloys and nitrides.
We utilized four different crystalline structures. The Ir3Fe alloys were modeled with Ir atoms at the face site and iron atoms at the corner site. The IrFe3 were modeled with Fe atoms at the face site and Ir atoms at the corner site. The nitrides (Ir3FeN) were modeled with Ir atoms at the face site, Fe atoms at the corner site, and N atom at the interstitial site. The IrFe3N were modeled with the Ir atom at the corner site, the Fe atoms at the face site, and the N atom at the interstitial site.
III. RESULTS AND DISCUSSION
A. Energy of formation and cohesive energy
The discussion begins with calculating the total energy of compounds Ir, N, and Fe (in bulk) and the atoms composing the nitrides and alloys depending on the volume to find the ground state. From the calculations of the total energy of the compounds, the energy of formation at equilibrium (or enthalpy of formation) is obtained by Eq. (2):
 $${E_{\rm{F}}} = {E_{{\rm{tot}}}} - \sum {E_x^i} {\rm{\quad,}}$$
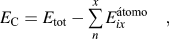
where  $E_x^i$ is the total energy of each constituent atom of the compound in equilibrium in its bulk structure; E tot is the compound's total energy.Reference Wei, Krakauer and Weinert11,Reference Tyuterev and Vast12 To discuss the compounds' stability, it is necessary to calculate the cohesive energy in the equilibrium volumes, which is defined as the energy needed to disassemble the compound into its constituent parts.Reference Aschcroft and Mermin13 The cohesive energy varies with the distance among atoms of a solid (unitary cell volume) and reaches a minimum value. The cohesive energy value corresponding to this minimum value is termed cohesive energy at equilibrium and the minimum volume is the equilibrium volume. Thus, the equilibrium lattice parameter is found and the cohesive energy can be calculated using Eq. (3):
 $${E_{\rm{C}}} = {E_{{\rm{tot}}}} - \mathop\sum\limits_n^x {E_{ix}^{{{\'{\rm{a}} {\rm{tomo}}}}}} {\rm{\quad,}}$$
where E tot is the compound total energy and  $E_{ix}^{{{\'{\rm{a}} {\rm{tomo}}}}}$ is the energy of each atom constituting the compound in its free state, here used per unit cell, unlike Refs. Reference Song, Guo, Yang and Li14,Reference Sahu15 where it was used per atom.
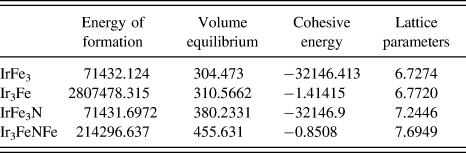
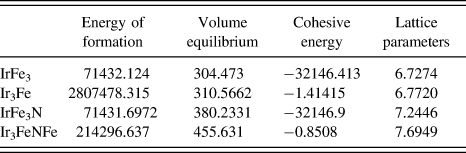
Table I shows the values of energy of formation, equilibrium volumes, cohesive energy, and equilibrium lattice parameter. The current literature does not show articles about cohesive energy of alloys and Ir3Fe, IrFe3, Ir3FeN, and IrFe3N. The results of this study were compared with the calculation of the IrFe3N nitride total energy.Reference Paduani4,Reference von Appen and Dronskowiski6 The compound that requires more energy for its formation is the Ir3Fe and the one that requires less energy is IrFe3N nitride. The nitride which has the highest cohesive energy (the most stable) is also the one requiring less energy for its formation. Initially, the results of lattice parameters were compared with those of у-Fe4N a = 7.1644 a.u.,Reference Jacobs, Rechenbach and Zachwieja16 compared with the parameter of nitrides Ir3FeN and IrFe3N. As expected, there was an increase in the equilibrium lattice parameter, because the atom Ir is larger than that of Fe. Comparing with calculations performed using the total energy to find the equilibrium lattice parameter of IrFe3N nitride, the following values were found: 7.4102 a.u.Reference von Appen and Dronskowiski6 and 7.22 a.u.Reference Paduani4 These discrepancies were due to our calculations better reflecting the nitride stability once the calculation of cohesive energy of atoms was performed. The other compounds were not found in the literature for comparison purposes, but the calculations of this study are quite consistent with others.
Energy of formation in Rydberger (Ry); equilibrium volume (a.u.); cohesive energy (Ry); lattice parameters (a.u.).
B. Electronic and magnetic structure under pressure
The calculation of the electronic structure is a very effective tool in the investigation of the electrons distribution in a given solid, because it provides an understanding of various properties in their ground state. The electronic and magnetic properties are closely linked to the distance between atoms; therefore, the pressure in the compounds was simulated by performing the calculations with 2% variation in the volume of each calculation.
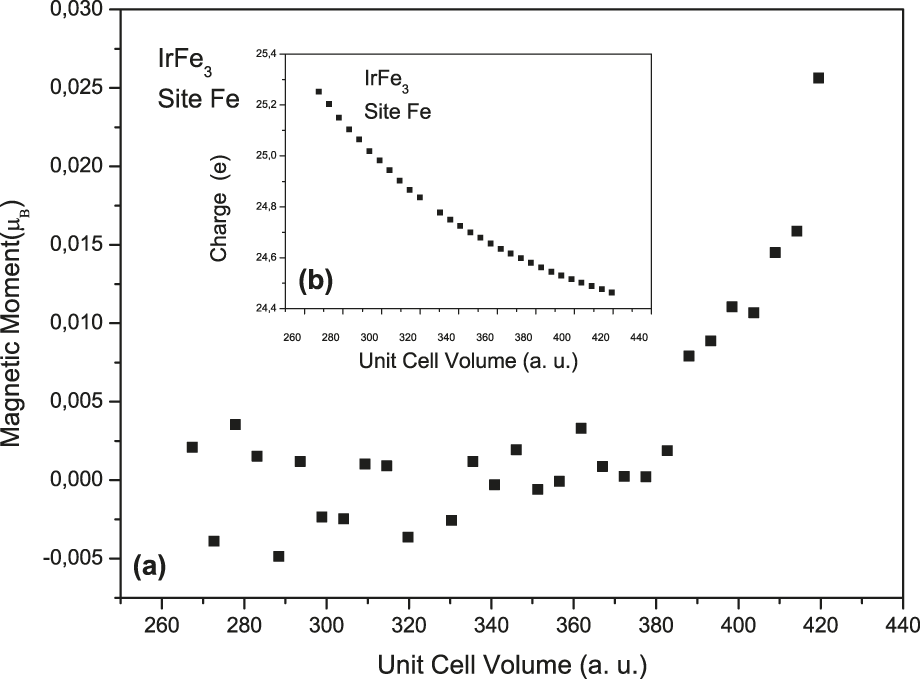
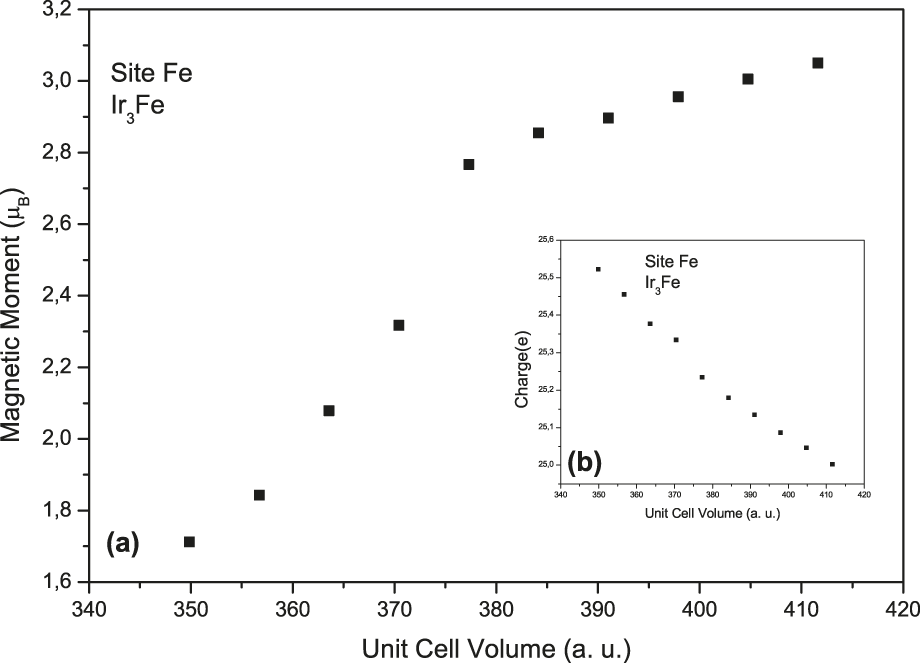
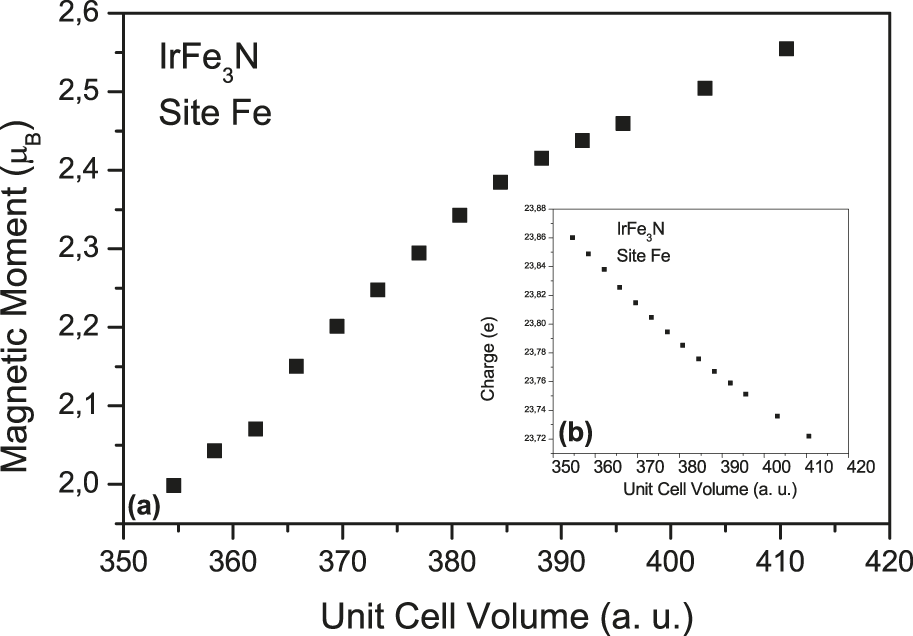
This session starts discussing the transfer charge and magnetic moment at sites of the four compounds when subjected to pressure. Figure 1(a) shows the magnetic moment of the iron site depending on the unit cell volume. Figure 1(b) shows the charge on the iron sphere depending on the unit cell volume in the IrFe3 compound. The lower magnetic moment is noted in that binary alloy, lowering even further with decreasing volume. Instead, the charge increases when the volume is decreased. The charges will pair the electrons up and down even more in the iron site showing the strong dependence of the magnetic moment on the system's geometry. The bulk iron magnetic moment is 2.2 μB,Reference Billas, Becker, Châtelain and de Heer17 but the disruption of the iron magnetic structure occurs in this alloy. Figure 2(a) shows the magnetic moment of the iron site depending on the unit cell volume. Figure 2(b) shows the charge depending on the unit cell volume in the alloy Ir3Fe. The magnetic moment decreases when the lattice parameter is decreased and the charge within the iron site is increased, but there is considerable magnetic moment at this site showing that the atoms position in the alloy influences the atoms magnetization. The electrons transferred to the iron sphere will populate the minority spin states promoting a sharp drop in the magnetic moment at this site, also indicating a reversal of spins, but not leading to total moment annihilation. Figure 3(a) shows the magnetic moment of the iron site depending on the unit cell volume. Figure 3(b) shows the charge on the iron sphere depending on the unit cell volume in the Ir3FeN nitride.
(a) Magnetic moment of iron site in magneton Bohr (μB) in function of the unit cell volume in atomic units (a.u.) in the compound Fe3Ir. (b) Charge of iron site in the electron (e) in function of the unit cell volume in atomic units (a.u.) in the compound Fe3Ir.

(a) Magnetic moment of iron site in magneton Bohr (μB) in function of the unit cell volume in atomic units (a.u.) in the compound Ir3Fe. (b) Charge of iron site in the electron (e) in function of the unit cell volume in atomic units (a.u.) in the compound Ir3Fe.
(a) Magnetic moment of iron site in magneton Bohr (μB) in function of the unit cell volume in atomic units (a.u.) in the compound Ir3FeN. (b) Charge of iron site in the electron (e) in function of the unit cell volume in atomic units (a.u.) in the compound Ir3FeN.
The Ir3FeN nitride behavior is similar to the alloy Ir3Fe, when the unit cell volume is increased with increase in load and decrease in magnetic moment.
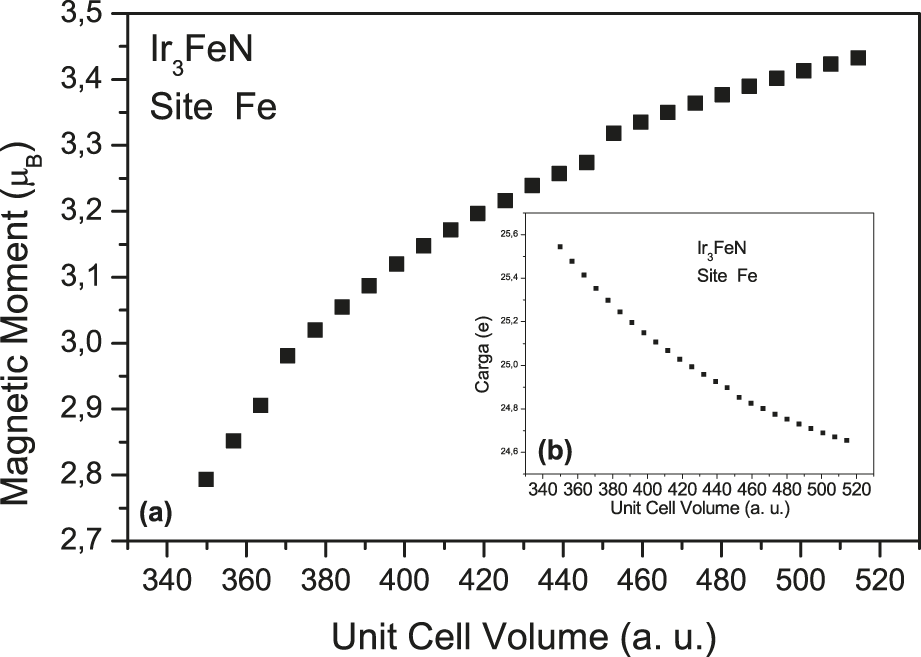
Finally, Fig. 4(a) shows the magnetic moment of the iron site depending on the unit cell volume. Figure 4(b) shows the charge in the iron site depending on the unit cell volume for the IrFe3N nitride. This nitride shows a similar behavior to the other Ir3FeN nitride, a monotonous curve.
(a) Magnetic moment of iron site in magneton Bohr (μB) in function of the unit cell volume in atomic units (a.u.) in the compound Fe3IrN. (b) Charge of iron site in the electron (e) in function of the unit cell volume in atomic units (a.u.) in the compound Fe3IrN.
Figures 2(a), 3(a), and a4(a) show the magnetic moment behavior at the Fe site in the compounds Ir3Fe, Ir3FeN, and IrFe3N, respectively. As can be observed, the calculations predict that the magnetic moment decreases at low volumes (high pressure) in agreement with calculationsReference de Figueiredo, Kuhnen and dos Santos18,Reference Kuhnen and dos Santos19 that behave like Invar alloy leading to magnetic collapse. The calculations show this drop, but not the collapse, agreeing with the experimental results on thermal expansion. The forced magnetostrictionReference Matar, Demazeau, Hagenmuller, Armitage and Riedi20,Reference Yang, Abd-Elmeguid, Micklitz, Michels, Otto, Kong, Xue and Li21 and the Mössbauer spectroscopyReference Lord, Armitage, Riedi, Matar and Demazeau22 in iron nitrides just show a drop in magnetization and not the magnetization annihilation.
C. Hyperfine properties
The Mössbauer effect is an effective tool to study the nuclear magnetic structure and its interaction with the neighborhood. The hyperfine properties related only to the iron site, the hyperfine field (in kG), the isomer shift (in mm/s), and the electric field gradient (EFG) in 1021 V/m2 are discussed.
The magnetic field acting on the nucleus is defined in Eq. (4):
 $$H = {H_{{\rm{ext}}}} + {H_{{\rm{FC}}}} + {H_{{\rm{orb}}}} + {H_{{\rm{dip}}}}\quad ,$$
where H ext is the external magnetic field applied to the nucleus. H FC is the hyperfine interaction (or Fermi contact term), which originates from unbalanced spin density of the s electronsReference Longworth23,Reference Gutlich, Link and Trautwein24 [Eq. (5)]:
 $${H_{{\rm{FC}}}} = - {8 \over 3}\pi {{\rm{\gamma }}_{\rm{N}}}\left[ {{{\left| {{{\rm{\Psi }}_{ \uparrow (0)}}} \left|}^2} - \left| {{\rm{\Psi }}_{ \downarrow (0)}^2} \right|} \right]\quad.$$
Here: γN is the nuclear gyromagnetic ratio and  ${{\rm{\Psi }}_{ \uparrow \downarrow (0)}}$ is the wave function in the nucleus for spin-up and spin-down of s electrons. The other two contributions of the H include the fields arising from the orbital magnetic moment (which is small for 3d-metals) and from the dipole interaction surrounding the atoms. These contributions are often small even in the case of ordered alloys. For example, for ordered transition of metal alloys, the orbital contribution is of the order of 2.0 T (which obviously must be considered in accurate calculations). Hence, since the present goal is to obtain an idea about trends of the hyperfine field, these contributions cannot be neglected.
Figure 5(a) shows the hyperfine field in compounds which have appreciable magnetic moment: IrFe3N, Ir3FeN, and Ir3Fe. Figure 5(b) shows the hyperfine field (in Tesla) versus volume (in bohr3) for IrFe3 compound. The theoretical results indicate a strong dependence of the hyperfine field with the unit cell volume as shown in Figs. 5(a) and 5(b), whose absolute values of the hyperfine field decrease with the decreased unit cell volume. This decrease of the absolute value relates to the reduced difference between the s electrons up and down in the iron nucleuses in all compounds. The hyperfine field behavior is very similar to that of substituted iron nitrides from gold and silverReference de Figueiredo, Foct, dos Santos and Kuhnen25 as well as substituted metal nitrides in γ-Fe4N by PaduaniReference Paduani26 and experimental articles.Reference Matar, Demazeau, Hagenmuller, Armitage and Riedi20,Reference Lord, Armitage, Riedi, Matar and Demazeau22 The sharpest drop in IrFe3 occurs where there is greater sensitivity to the variation of lattice spacing.
(a) Hyperfine Field HF in kilo Gauss (kG) in function of the volume in atomic units (a.u.) for compounds Fe3IrN, FeIr3N, and FeIr3. (b) Hyperfine Field HF in kilo Gauss (kG) in function of the unit cell volume in atomic units (a.u.) IrFe3.
To understand the electron density in the nucleus, the isomer shift of a given atom is calculated, comparing the nucleus electronic density ρ (0) with a reference nucleus: α-Fe (bcc) in this case. Fe bcc with lattice parameters of a = 2.865 Å calculated with a muffin-tin radius of 0.95 Å was used with the GGA as 10000-K with polarization spin.Reference Duff27,Reference Wdowikand and Ruebenbauer28 Thus, the isomer shift is calculated by Eq. (6):
 $${\rm{IS}} = [{{\rm{\rho }}_{\rm{a}}}\left( 0 \right) - {{\rm{\rho }}_{\rm{s}}}(0){\rm{\alpha }}\quad ,$$
where ρα is the density of electrons in the nucleus; ρs is the density of electrons in the reference nucleus; and α is the constant of proportionality. The constant α can be estimated by calibration. There are already some references on calibration and calculations using the constant α.Reference Duff27–Reference Dufek, Blaha and Schwarz29Figures 6(a) and 6(b) show the isomer shift that depends on the volume in compounds Ir3Fe, Ir3Fe, IrFe3N, and Ir3FeN. As in other magnetic properties, there is a strong relationship with the lattice spacing. Thus, when increasing the pressure, the densities of s decrease in the nucleus causing the decrease in the isomer shift. This occurs because the energy is supplied to the system, sending the s electrons from the nucleus to the outer orbitals. This phenomenon occurs in all compounds calculated in this study (AuFe3N and CuFe3N nitrides) when calculated using the Linear Muffin-Tin Orbital method (LMTO).Reference de Figueiredo, Kuhnen and dos Santos18
(a) and (b) show the isomer shift (in mm/s) in function of the unit cell volume in atomic units (a.u.) in the compounds FeIr3, Ir3Fe and Fe3IrN, FeIr3N, respectively.
The calculation of the electric-field gradients (EFG) indicates that atomic nucleus can introduce quadrupole electric moment, which indicates the nature of the forces between the nucleus particles and the different formats of the nucleus. This moment can interact with the gradient of the local electric field and cause the split of energy levels described in Refs. Reference Dufek, Blaha and Schwarz29,Reference Peltzer y Blancá, Desimoni, Christensen, Emmerich and Cottenier30. Figure 7 shows the EFG depending on the unit cell volume in compounds Ir3Fe, Ir3Fe, IrFe3N, and Ir3FeN. Only the results of site 2 (face) are shown, as the atoms in sites 1 (corner) and 3 (interstitial) are high-symmetry, where the EFG is zero or very close to zero. The EFG dependence with the lattice spacing is strong, increasing in a modulus with increased pressure. This is most noticed in the case of Ir3FeN, where a subtle variation in the interatomic space causes a sharp drop in EFG. Regarding the alloy IrFe3, this presents little variation, since the magnetic moment of the iron is very low in this compound. In other cases, when the pressure is increased, the gradient signal is reversed. This also causes change in the shape of iron nucleuses, a result of electrical charges that transfer to the iron site when pressure increases (Figs. 1–4). Overall, as the material is pressed in the compounds FeIr3, Ir3Fe, Fe3IrN, FeIr3N, there is a reduced difference between the densities of states s up and down causing decreased HFC. It is the same with the IS, indicating that the densities of s electrons in the nucleus are similar to the densities of electrons in the reference nucleus of α-Fe. The EFG shows the distortion in the electric field of the nucleus when the interstitial space is reduced, showing greater interaction of the electric field of the nucleus with the other fields around it.
EFG (1021 V/m2) in function of the unit cell volume in atomic units (a.u.) in the compounds FeIr3, Ir3Fe, Fe3IrN, and FeIr3N.
D. Electronic and magnetic structures in equilibrium
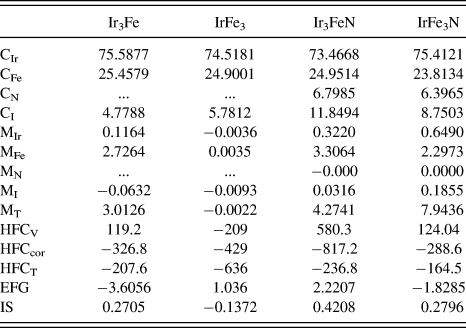
Based on the calculations of the minimum cohesive energy, the equilibrium volume is calculated for all compounds to calculate the properties of the ground state shown in Table II. The charge loss is closely linked to the atomic position at the unit cell. It is clear in Table II that the face site in the structure has the highest charge loss that will become lodged in the interstitial space thereby changing the electronic and magnetic structure of the compounds. Regarding the magnetic moment, bulk materials exhibit a different behavior in iridium and the magnetic moment is substantially zero in the nitrogen and, in case of α-Fe, bcc was found 2.27 μB. Compared with the alloys, there is increased magnetic moment of iron at the corner site compared to α-Fe in the case of alloy Ir3Fe, the emergence of a magnetic moment at the Ir site (face). Since the magnetic moment is defined as the difference between spin-up and spin-down, the charges that left the site of iron came out from the down states increasing the magnetic moment. The same happens at the Ir site (face), primarily the unbalanced electrons came out from the down states and a magnetic moment emerged at that site. In alloy IrFe3, the magnetic moment is virtually zero at all sites, i.e., the charge exits from the iron site where there were primarily up electrons pairing the electrons up and down. When it comes to alloys, the magnetic structure strongly depends on the atomic positions, and in the case of nitrides, a new electronic structure emerges and not just a mere average of states. The charges transferred to the interstitial region increase with the increased charge transferred from all sites. The charges transferred to the interstitial region contribute to the increasing of the local magnetic moment of the iron sites, but it does not occur with the FeIr3 where the magnetic moment goes to zero. Other calculations, using different methods, detect the increasing of the magnetic moment of the iron sites using substituted iron nitrides.Reference Paduani4,Reference Andriamandroso, Matar, Demazeau and Fournès5,Reference de Figueiredo, Kuhnen and dos Santos18,Reference de Figueiredo, Foct, dos Santos and Kuhnen25,Reference Paduani and Krause31
Properties of the ground state: C in electrons; M in Magneton the Bohr (μB); HFC in kilo Gauss (kG); EFG in 1021 V/m2; IS (mm/s).
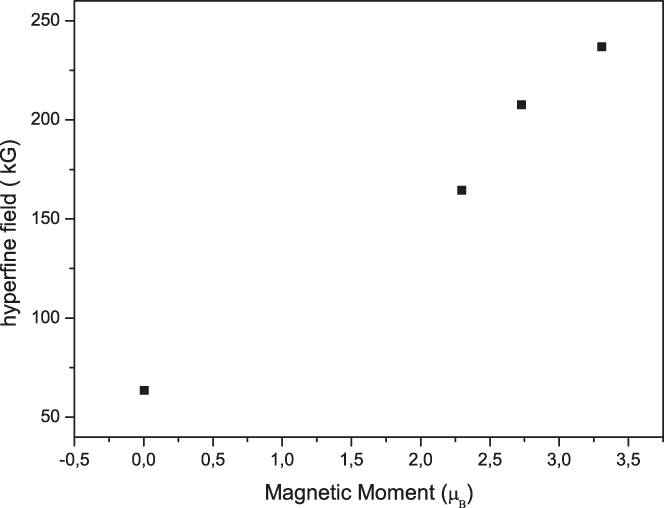
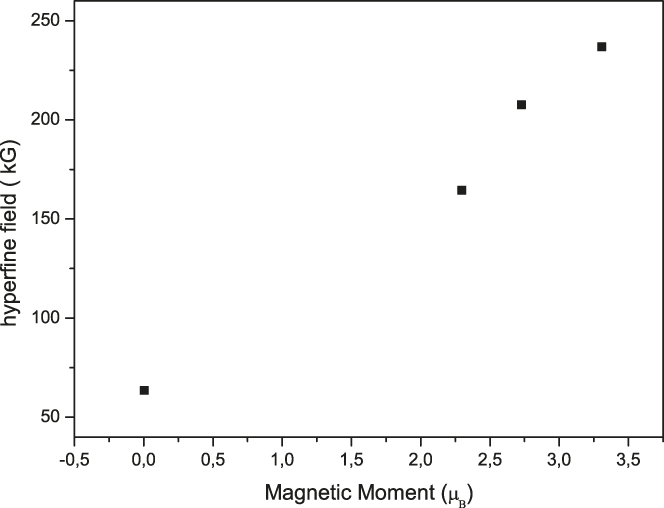
Table II also shows the calculations of hyperfine properties at steady state in all compounds: valence hyperfine fields, core hyperfine fields, and total hyperfine fields for the iron site are shown. The EFG and the amount of iridium are proportional, influencing the distribution of the EFG in the iron nucleus since the two largest EFG are those of Ir3Fe and IrFe3N. This shows the influence of the electron cloud in the nucleus electrical properties. It is observed that the influence on the density of s electrons happens when nitrogen atoms are placed in the system, since these electrons are concentrated in s states. The total of calculated hyperfine field at the iron site is proportional to the magnetic moment, and it also happens with other nitrides, theoretically and experimentallyReference de Figueiredo, Kuhnen and dos Santos18,Reference de Figueiredo, Foct, dos Santos and Kuhnen25 (Fig. 8).
Magnetic moment at the Fe site in magneton Bohr (μB) in function of the hyperfine field HFC in kilo Gauss (kG).
E. Equilibrium DOS
1. Equilibrium DOS of Ir3Fe and IrFe3 alloys
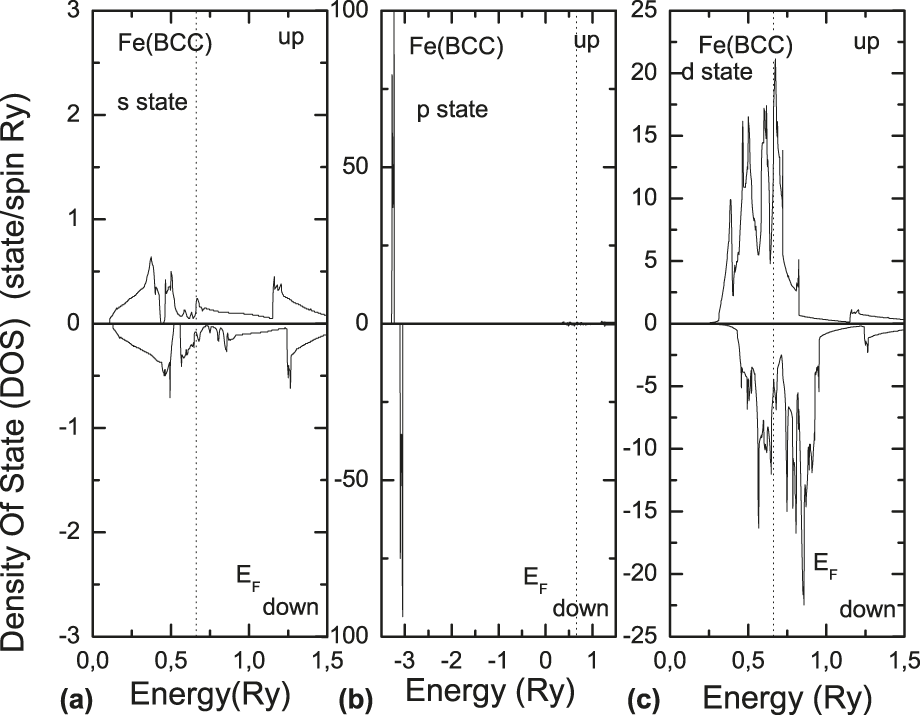
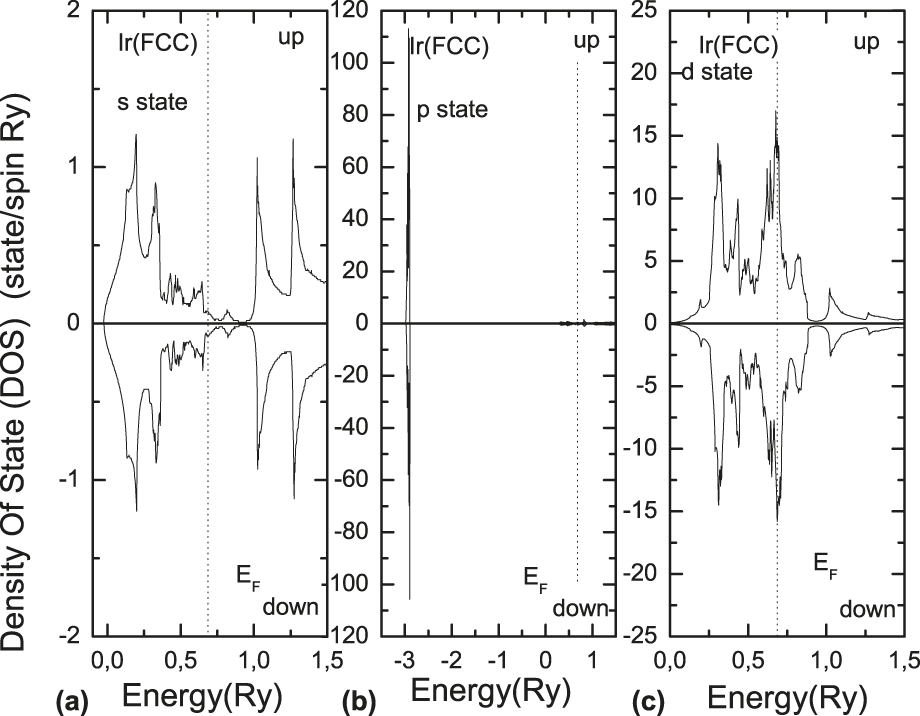
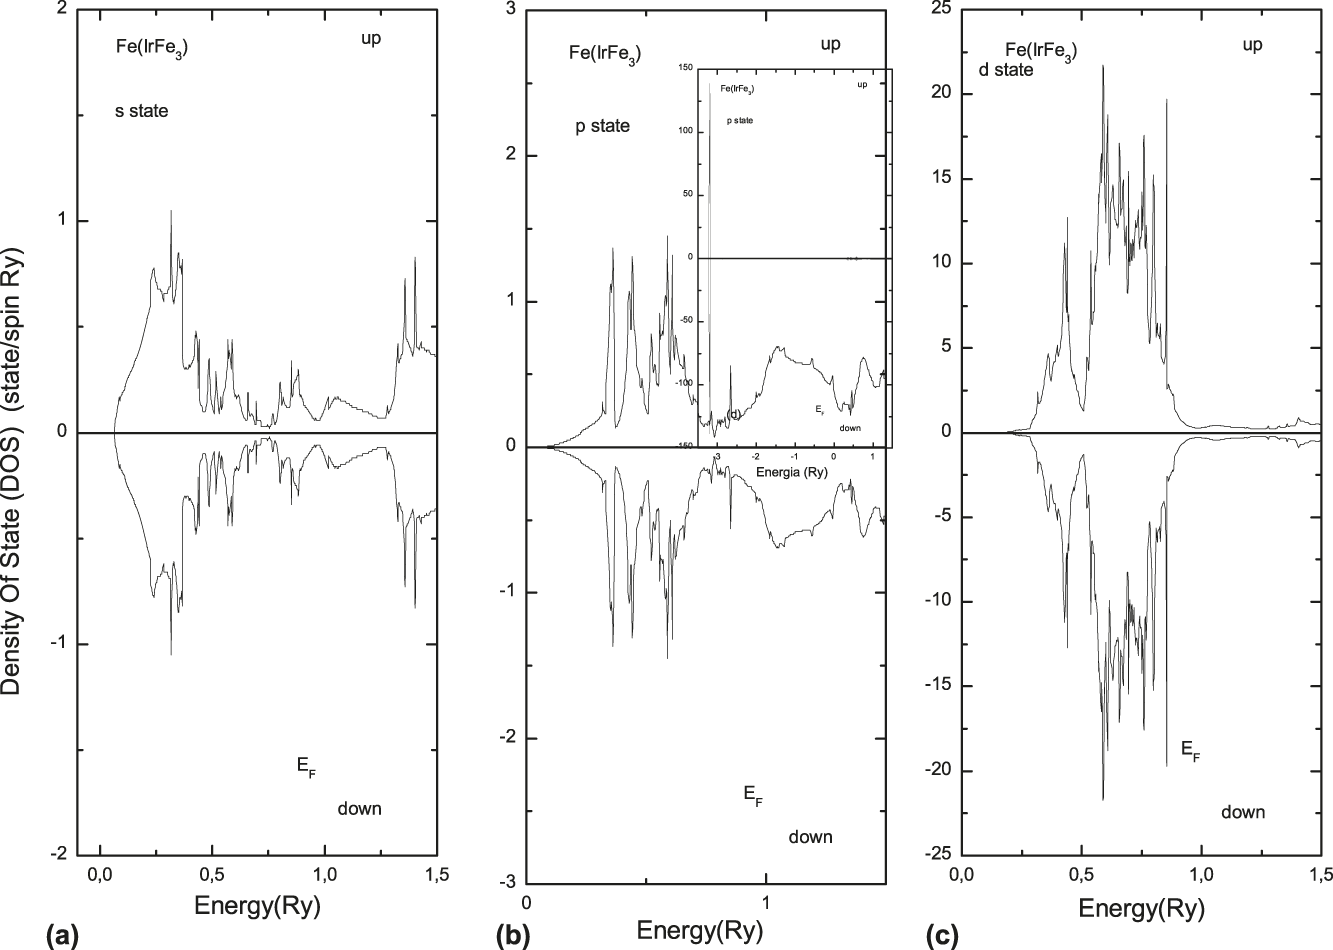
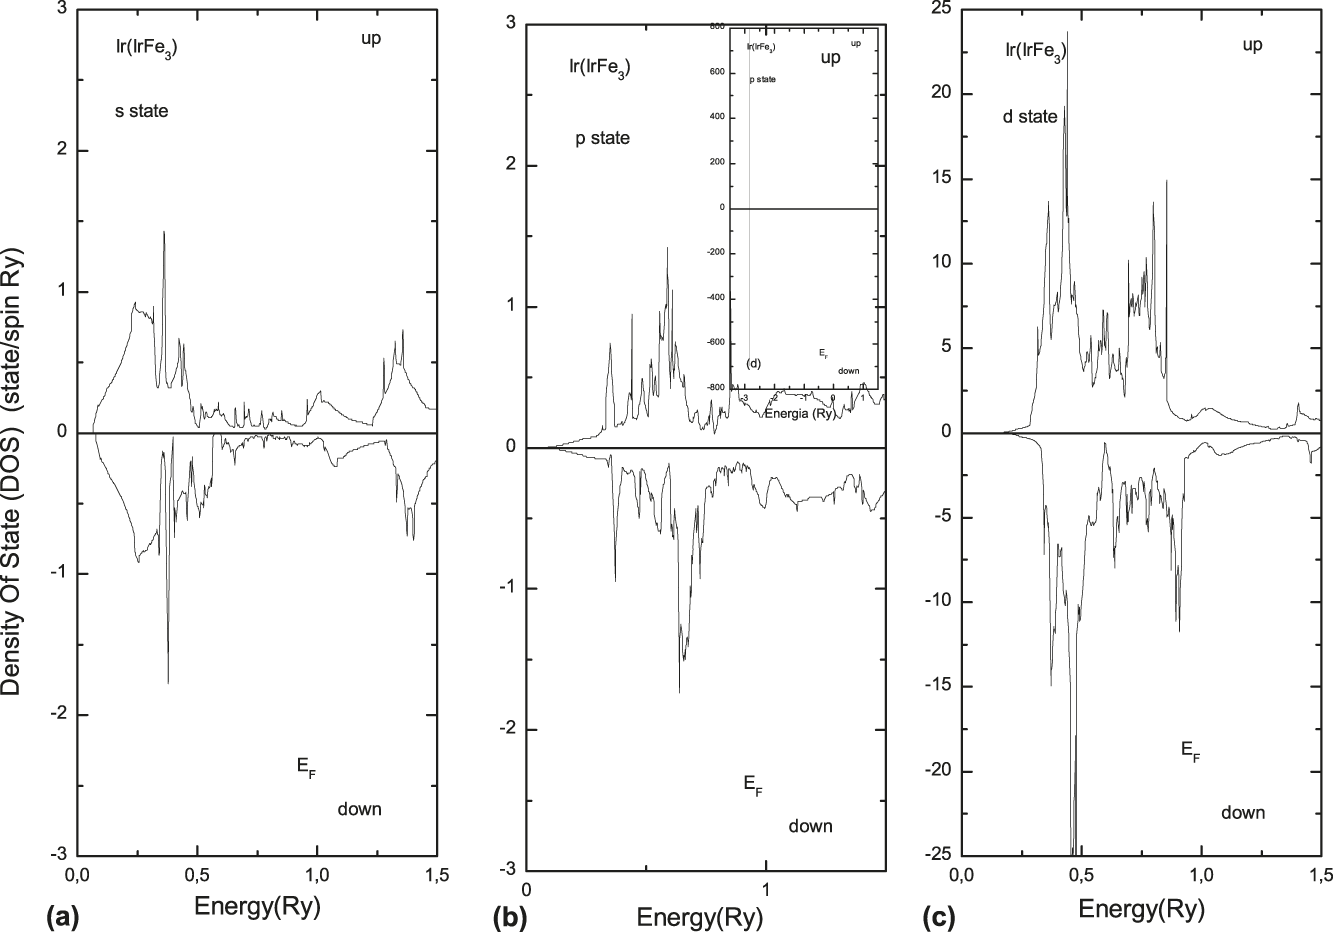
The calculation of the DOS provides valuable information about the intimate structure of the compounds. The study of DOS in states s, p, and d of bulk iron in the bcc structure shows a magnetic material with a 2.1976 μB magnetic moment, an 83.869 kG valence hyperfine field, a −265.900 kG core and a total of 182.000 kG, connecting these results with the DOS in Figs. 9(a)–9(c) and the states s, p, and d in the iron atom. There is a difference between the states up and down in the s states, thus justifying the hyperfine field. Figure 9(c) shows that the d states up and down are unequal, thus justifying the magnetic moment of the iron atom being largely due to their d electrons. Figure 9(b) shows the p states, where there is a peak centered in the energy region near −3Ry, thus showing pure states of iron in this region. Figures 10(a)–10(c) show the DOS of the Ir atom in bulk (fcc), a totally paramagnetic DOS contrary to the iron in bulk. In common, it features peaks well concentrated near the region's energy −3Ry. Figures 11(a)–11(c) and Figs. 12(a)–12(c) show the DOS at the sites of Fe and Ir in the IrFe3 alloy.
The DOS of s, p, and d electrons for spin-up and spin-down at Fe site for Fe (bcc).
The DOS of s, p, and d electrons for spin-up and spin-down at Fe site for Ir (fcc).
The DOS of s, p, and d electrons for spin-up and spin-down at Fe site for IrFe3.
The DOS of s, p, and d electrons for spin-up and spin-down at iridium site for IrFe3.
There was interaction between the p states of iron and iridium, because peaks emerge in the p states of Ir in the energy region between 0.5 Ry and 0.7 Ry. In the s states of iron peaks appeared in the energy region between 0.3 Ry and 0.4 Ry, which did not happen earlier, reflecting the interactions with s states of iridium. These peaks are present in the s states of iridium when in bulk. In the d states of Ir well-located peaks emerged in the energy region 0.5 Ry. These peaks reflect the interactions with the d states of iron, as they are present and localized in the d states of Fe [Fig. 10(c)]. Figures 11 and 12 show the peaks well centered in the p states in the energy region close to −3Ry. Figures 13(a)–13(c) show the DOS at the iron site of the Ir3Fe compound. Figure 14 shows the DOS at the iridium site in the Ir3Fe compound in states s, p, and d. The iron site shows a typical ferromagnetic DOS, where there is a considerable difference between up and down states below the Fermi energy. Figure 14 shows the DOS well located in the p states at the iridium site. According to Fig. 10(b), these states have not changed, as the p states at the iridium site show. Figure 13(b) shows the p state at the iron site, which is reduced when compared to the bulk iron in Fig. 9(b).
The DOS of s, p, and d electrons for spin-up and spin-down at Fe site for Ir3Fe.
The DOS of s, p, and d electrons for spin-up and spin-down at iridium site for Ir3Fe.
2. Equilibrium DOS of nitrides Ir3FeN and IrFe3N
The DOS of substituted iron nitrides shows the changes in electronic structure caused by the introduction of a nitrogen atom in the interstitial site. We began discussing the DOS at the nitrogen site shown in Fig. 15. In states s and p in both directions of spin in nitride IrFe3N, the s states are pure, focused on the energy region between 0.5 Ry-and-0.3 Ry and the p states in the region between 0.0 Ry and 0.5 Ry. There were no considerable d states. The DOS has tiny peaks in the p states around the region −3Ry, reflecting the interactions with states p up of the iridium and p down of iron. Figure 16 shows the DOS for states s, p, and d up and down at the iron site in the IrFe3N nitride. The inclusion of the nitrogen states changed the iron DOS substantially, with quite apparent peaks emerging in the states s and p in the energy region between −0.5 Ry and −0.3 Ry, and showing s–s and s–p interactions between these two atoms. There are also interactions of nitrogen p states with the iron p states in the energy region between 0.2 Ry and 0.3 Ry, featuring a p–p interaction. There are some articles using the LMTO and LAPW methods that describe these interactions when interstitial carbonsReference dos Santos32,Reference dos Santos33 or nitrogen are placed in substituted iron nitridesReference Kuhnen and dos Santos34–Reference dos Santos36 or multilayer.Reference Kuhnen, Krause and Santos37 Comparing with Fig. 9, the most affected states are the iron s, which are localized in the energy region 0.25 Ry. Figure 16 also shows the p states at low energies in the region −0.3 Ry. This figure shows the predominance of down states that will interact with the states s and p of nitrogen in the same energy region. Figure 17 shows the DOS at the site of iridium atom in the IrFe3N nitride. Unlike the iron atom, the iridium has a strong interaction with nitrogen atoms, and only the states s and p became more localized. This is due to the iridium site being located in the geometrically farthest corner from the iron located on the faces. Figure 16 shows the p states for low-energy regions with well-pronounced peaks only in the up states. In the case of iron, as well as iridium, a strong modification occurred in p states where there was a reverse spin with only one direction.
The DOS of s, p, and d electrons for spin-up and spin-down at Fe site for IrFe3N.
The s, p, and d-projected DOS for spin-up and spin-down electrons at Fe sites for IrFe3N.
The s, p, and d-projected DOS for spin-up and spin-down electrons at Ir sites for IrFe3N.
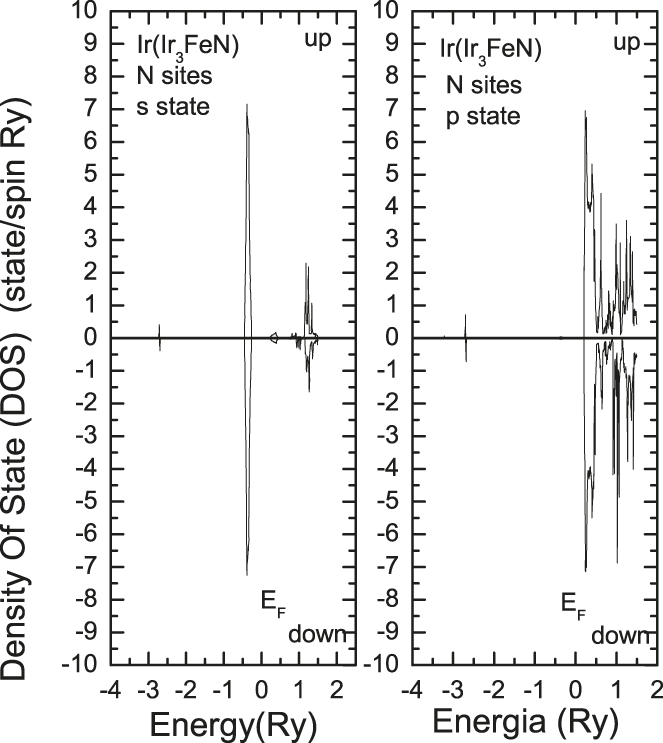
Focusing now on the Ir3FeN nitride, we analyze the changes caused by the introduction of interstitial nitrogen. Figure 18 shows the DOS in states s and p up and down at the nitrogen site. The d states are not relevant as in the previous case, and the s states are centered in the energy region between −0.5Ry and −0.3Ry and the p states are between 0.0 Ry and 0.5 Ry. There are also the interactions, as they present peaks in the energy region −3Ry, which are the interactions with the p states of iridium. Figure 19 shows the DOS in the iron states on the corner for states s, p, and d for the two spin directions. Since this is on the corner, the interaction with the nitrogen decreases, showing little interaction, but retaining the high magnetic moment. This is observed in d states where the difference between up and down states is large compared to other states; it shows a typical DOS of sites with high magnetic moment. The atomic position in the crystal lattice strongly influences the magnetic moment. Even though there is no interaction with other atoms, the geometric position modifies the DOS of the iron atom. In Fig. 9, the DOS of iron is in bulk mainly in the p states at low energies, where the peaks practically disappear. Figure 20 shows the DOS of the iridium atom located on the structure face nearest to the nitrogen atom, as a consequence of increased interaction. The DOS has very pronounced peaks in the energy region between 0.5Ry-and-0.3Ry both in the states s and p, thus demonstrating the interaction with the nitrogen s states. The interactions with the p states of nitrogen appear in peaks in the energy region between 0.0 Ry and 0.5 Ry in the states s, p, and d of the iridium atom. The changes caused in the nitrides DOS are shown and we do not have a mere average of states, but a new electronic structure caused by the introduction of nitrogen in the Fe–Ir alloys.
The s, p, and d-projected DOS for spin-up and spin-down electrons at N sites for Ir3FeN.
The s, p, and d-projected DOS for spin-up and spin-down electrons at Fe sites for Ir3FeN.
The s, p, and d-projected DOS for spin-up and spin-down electrons at Ir sites for Ir3FeN.
IV. CONCLUSION
The theory is not often seen by the means of production as an integral part of the sector, but works like this aim to combine the theoretical methods for predicting the alloy's stabilities, with the experimental research and production of new materials. Regarding the results, the calculation model of formation energy and cohesive energy was very efficient. The compound that most requires energy for its formation is the Ir3Fe and the one that requires less energy is the IrFe3N nitride. The nitride also has the highest cohesive energy, i.e., it is the most stable and also requires less energy in its formation.
The magnetic moment behavior at the iron site in the compounds Ir3Fe, Ir3FeN, and IrFe3N shows that the magnetic moment decreases at low volumes (high pressure) agreeing with the other nitrides, using other methods of first principles that have an Invar-like behavior leading to a magnetic collapse. The calculations show a decrease, but not a collapse, agreeing with the experimental results on thermal expansion. The forced magnetostriction and Mössbauer spectroscopy in iron nitrides show just drop in magnetization, and not annihilation.
The theoretical results indicate a strong dependence of the hyperfine field H F on the unit cell volume, whose absolute hyperfine field H F values decrease when the unit cell volume decreases. This decrease of the absolute value relates to reducing the difference between up and down of s electrons in the iron nucleus on all compounds. The GFS shows the distortion in the electric field of the nucleus, when the interstitial space decreases due to an increase in the module and shows greater interaction of the electric field of the nucleus with the other fields around it.
In alloys, the bands located near the Fermi energy are mostly of d electrons at the sites of iron and iridium. When nitrogen is introduced into the interstitial matrix of the alloys, there is a change in the DOS, leading to new interactions mainly with s electrons between the nitrogen and the atom located at the site of the fcc structure face. When the pressure increases, the density of s electrons in the nucleus decreases causing the decrease in the isomer shift. This occurs because energy is supplied to the system, sending the s electrons from the nucleus to the outer orbitals, a phenomenon that occurs in all compounds calculated in this article. In nitrides, the influence of nitrogen is demonstrated by the electronic emergence in the energy region −0.5 Ry that is not present in the alloys.