Introduction
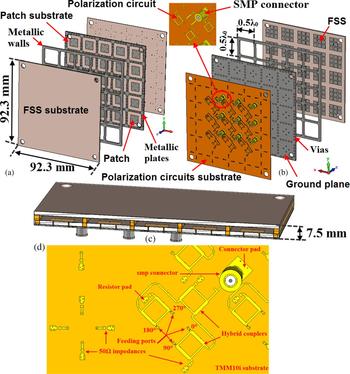
Future nanosatellite missions, especially with LEO satellites, require a wide-angle Earth coverage with a long-time visibility, implying an isoflux radiation pattern called “isoflux mode”. Furthermore, this pattern is usually associated with a directive beam (“directive mode”) to maintain the gain around the axial direction (nadir). Usually, the choke horn antenna is a good candidate to perform an isoflux radiation pattern [Reference Geyer1–Reference Arnaud, Menudier, Fouany, Monediere and Thevenot6]. Unfortunately, its physical size is not compliant with a nanosatellite application and the bi-mode radiation is not achievable. Planar solutions like patch array antennas [Reference Maldonadoa, Panduroa, del Rio Bociob and Mendez7–Reference Roy and Balbin12] are interesting but they often suffer from large dimensions to obtain a directive pattern relatively to the platform size. To overcome these limitations, the proposed solution generates both beams by using a new agile low profile antenna called “Agile Radiating Matrix Antenna” (ARMA) [Reference Jecko, Arnaud, Abou Taam and Siblini13]. It is more efficient than the usual Active Electronically Scanned Array, particularly for beam steering up to 60°. To obtain these two different radiation patterns, an X band ARMA [Reference Siblini, Jecko and Arnaud14, Reference Siblini, Taam, Jecko, Ramma, Bellion and Arnaud15] was designed with nine active feeding ports inside a matrix built with 5 × 5 circularly polarized pixels. The weighting functions are applied to the pixels in order to work alternatively in isoflux or directive mode. This paper presents a comparison between theory and experiment on the isoflux mode. Since the directive mode is realized with the same amplitudes and phases, it does not introduce manufacturing problems. Therefore, the demonstrator is only manufactured for the isoflux mode planar antenna as shown in Fig. 1. The article is organized as follows. Section “Antenna” contains a brief antenna description, the S ij measurement setup and a comparison between the simulation and measurement results of the antenna [S] parameters. Section “Experimental device for radiation pattern measurements” describes the experimental device used to feed the antenna with the appropriated weighting functions. This section also presents the [S] parameters measurement of this device. The comparison between simulations and measurements of the whole system (antenna + experimental device) is presented in section “Measurement of the whole device (antenna + experimental device)”. Finally, a conclusion is given.
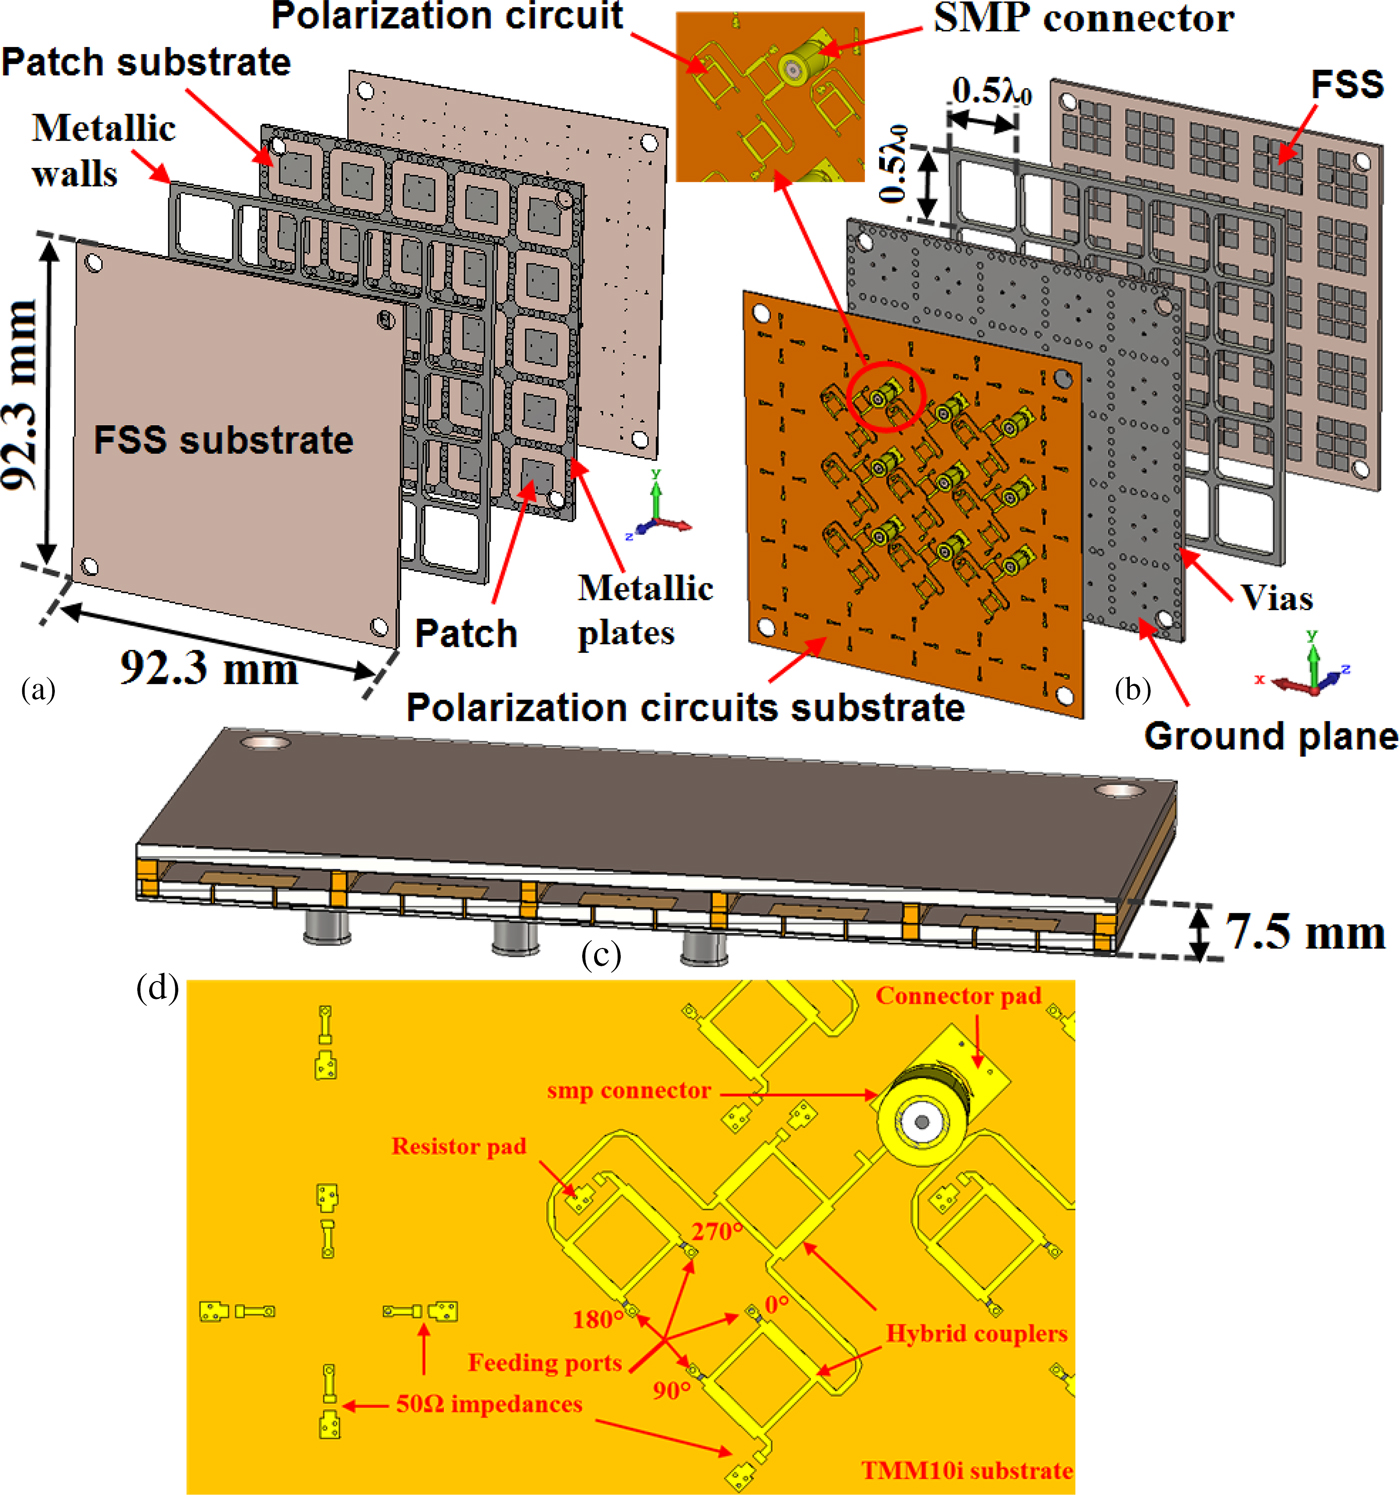
Low profile circularly polarized ARMA: (a) exploded view of the top to show the radome where the FSS is printed, (b) exploded view of the bottom with the nine polarization circuits, (c) side view to see the low-profile shape, (d) detail of the polarization circuit.
Antenna
Antenna description
The antenna is simulated using CST Microwave Studio and it is depicted in Fig. 1. A square low profile ARMA antenna was built containing 25 pixels [Reference Siblini, Taam, Jecko, Ramma, Bellion and Arnaud15] with 0.5λ 0 spacing. Only nine are fed by the experimental device. The other ones, located at the edges of the antenna and connected to 50 Ω impedances are not fed. They are only used to maintain a good axial ratio for the whole matrix antenna. Each pixel includes a microstrip patch with four feeding ports, associated with a 90° phase shift, to obtain a circularly polarized field. The polarization circuit is printed on a TMM10i substrate (0.381 mm height) designed to generate these phase shifts. The main challenge to tackle this design is the small area behind the pixel surface (0.5λ 0 × 0.5λ 0 = 18.29 mm × 18.29 mm). It must be enough to integrate three hybrid couplers, three resistor pads, and a connector pad (Fig. 1(d)). Each of these three hybrid couplers needs one port connected to a 50 Ω resistor with grounded pads. These pads are designed and optimized separately to minimize their dimensions. SMP connectors are used. The connector pad for grounding and the microstrip line to solder the circuit-connector pin were also optimized to reduce the size. The patches are printed on the top of another substrate (RO6002 laminate, 1.524 mm). They are connected to the outputs of the polarization circuits by plated through holes (PTH). The ground plane is common for both the polarization circuit and the feeding patch substrates. Both substrates are stuck together by a Cuclad 6250 bonding film after removing the bottom metallization of the patch substrate. To connect the metallic walls and the ground plane, metallic plates and PTH are made on the patch layer. The other parts of the metallic walls (2 mm height, 1.5 mm thickness) are connected from the top of the patches substrate to the bottom of the FSS substrate (RO6002 laminate, 1.524 mm).
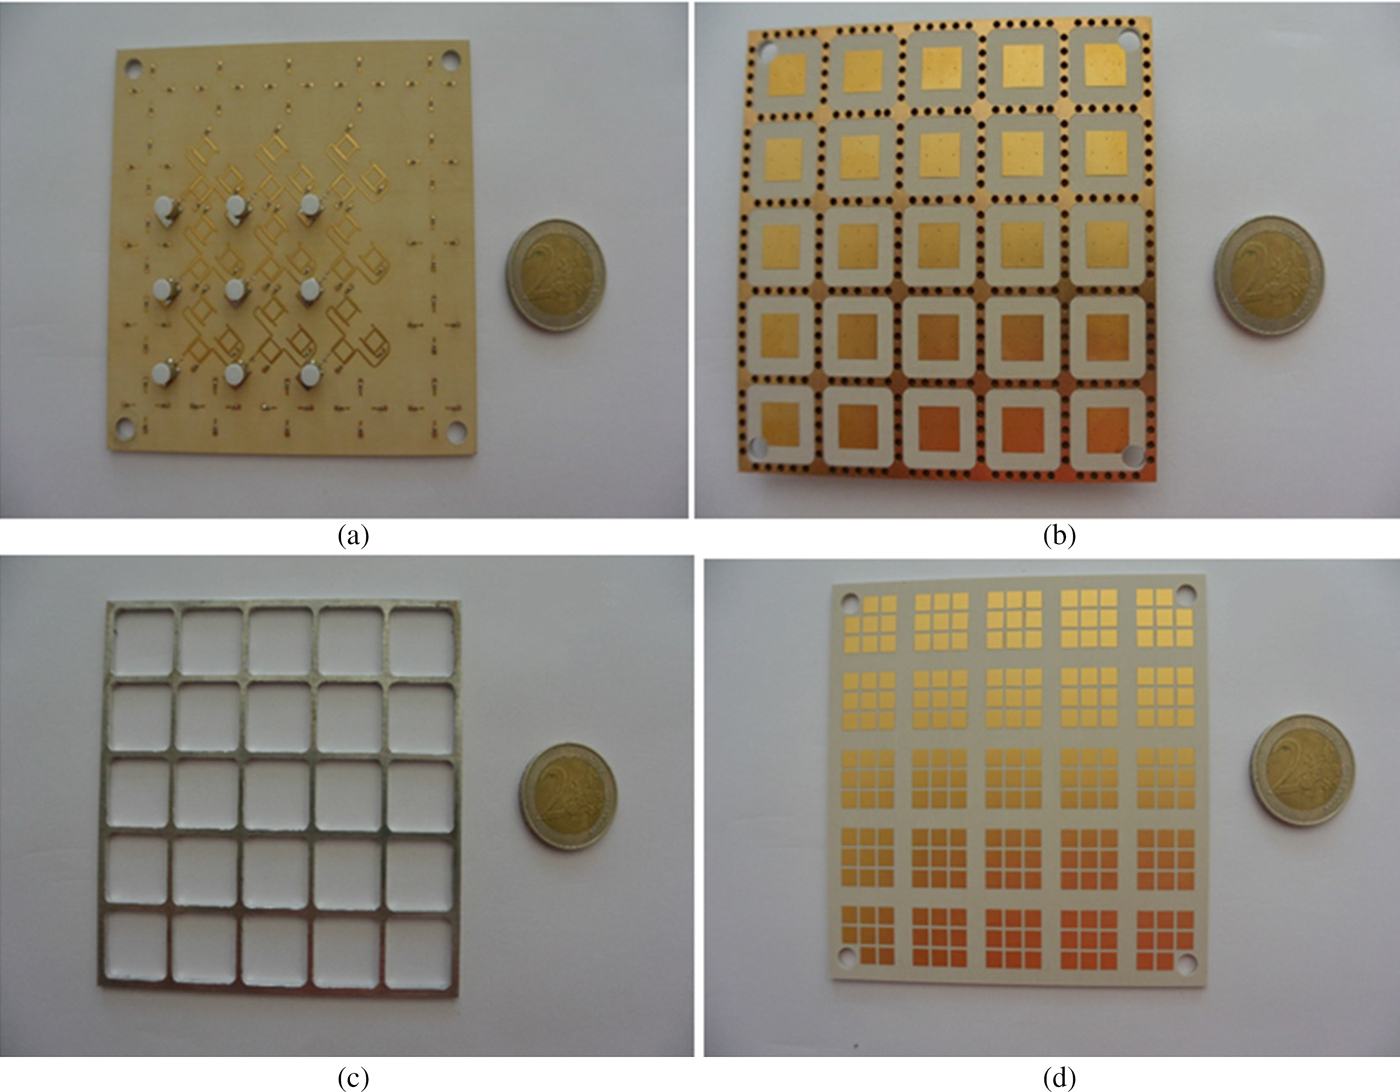
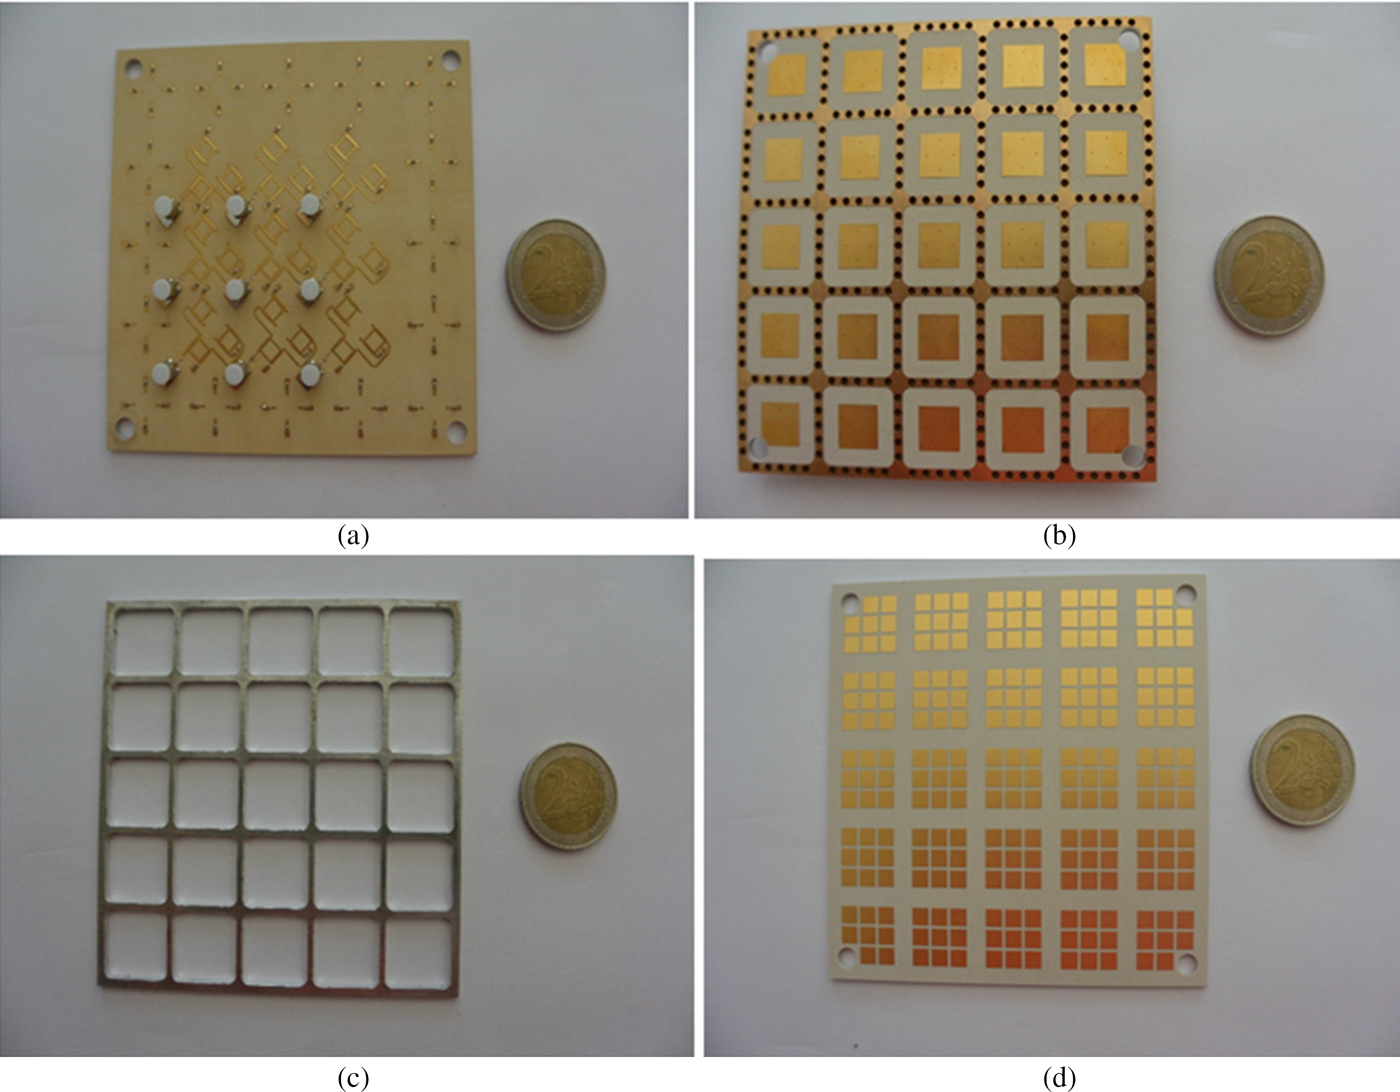
The manufactured planar antenna is therefore a multilayered structure built with four layers. Figure 2(a) shows the TMM10i substrate used to print the circuit with the nine elements of the RF polarization circuits. The feeding patches are printed on the top of the RO6002 laminate (Fig. 2(b)). Figure 2(c) shows the grid to obtain metallic walls. The FSS printed on the radome is presented in Fig. 2(d).
Multilayer structure: (a) PCB with the nine polarization circuits [Reference Siblini, Jecko and Arnaud14], (b) feeding patches printed on the dielectric substrate, (c) the grid, (d) FSS printed on the radome.
Scattering matrix measurement setup
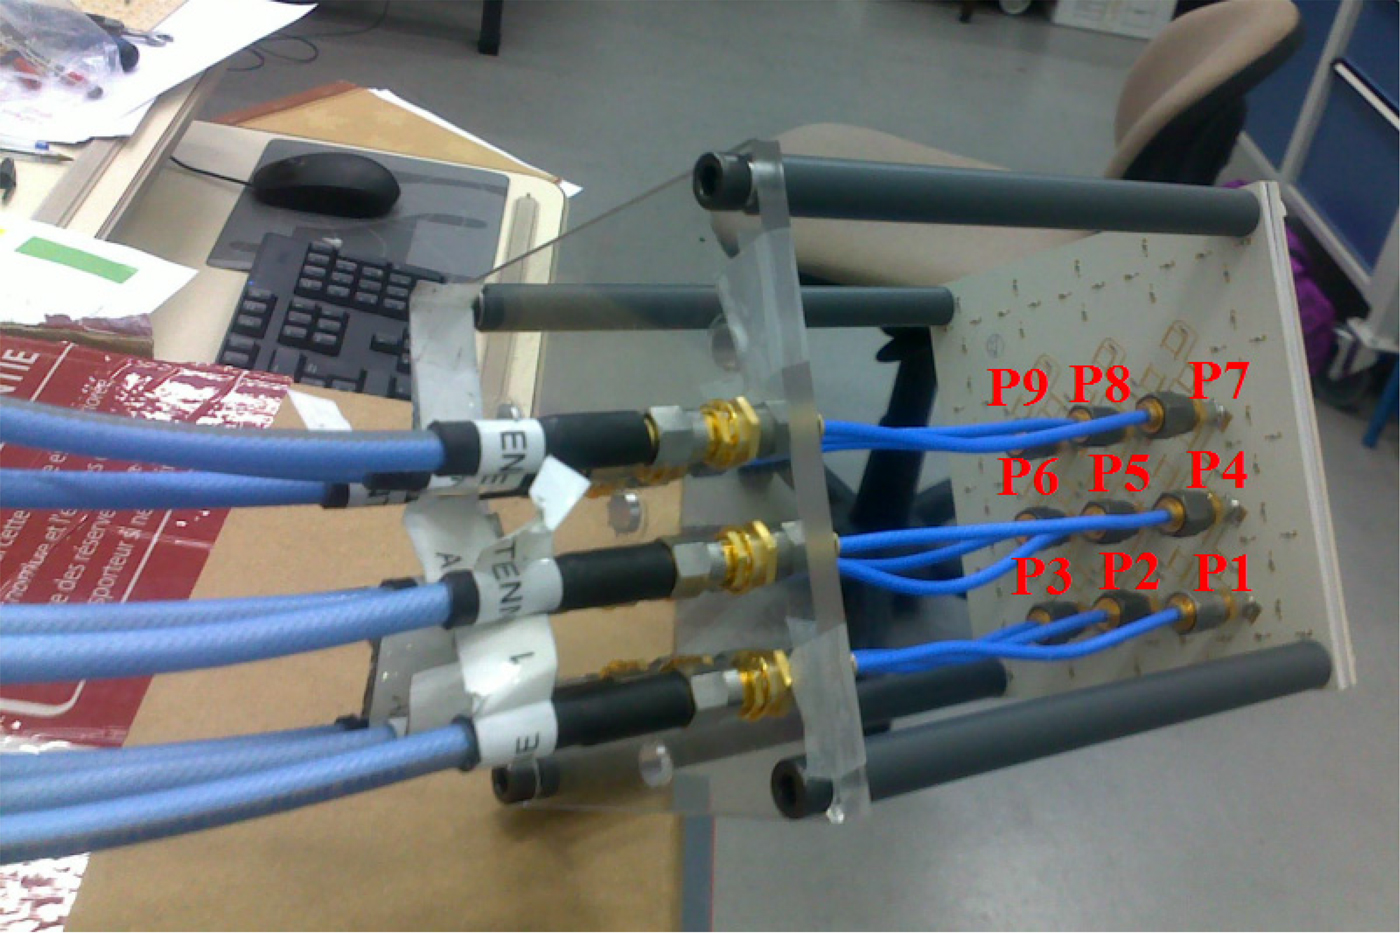
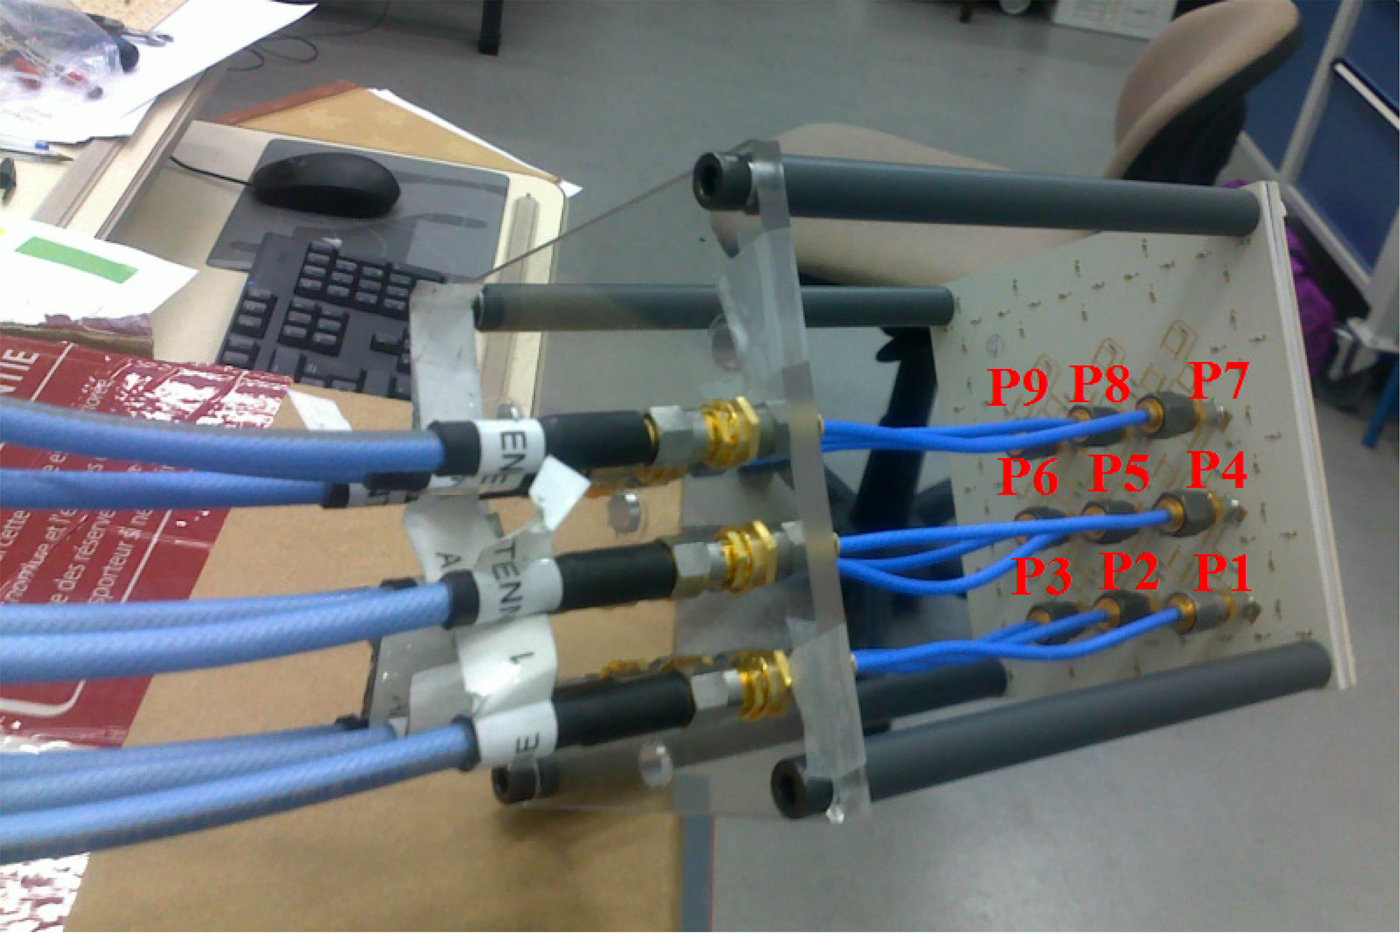
A measurement test bench for multi-element antenna, previously described in [Reference Menudier, Arnaud, Thevenot, Fezai, Oueslati, Chevalier, Reynaud and Monediere16], has been used as shown in Fig. 3. It is equivalent to a multiway VNA (up to 49 ways).
Experimental setup for S ij measurements.
S ii parameters
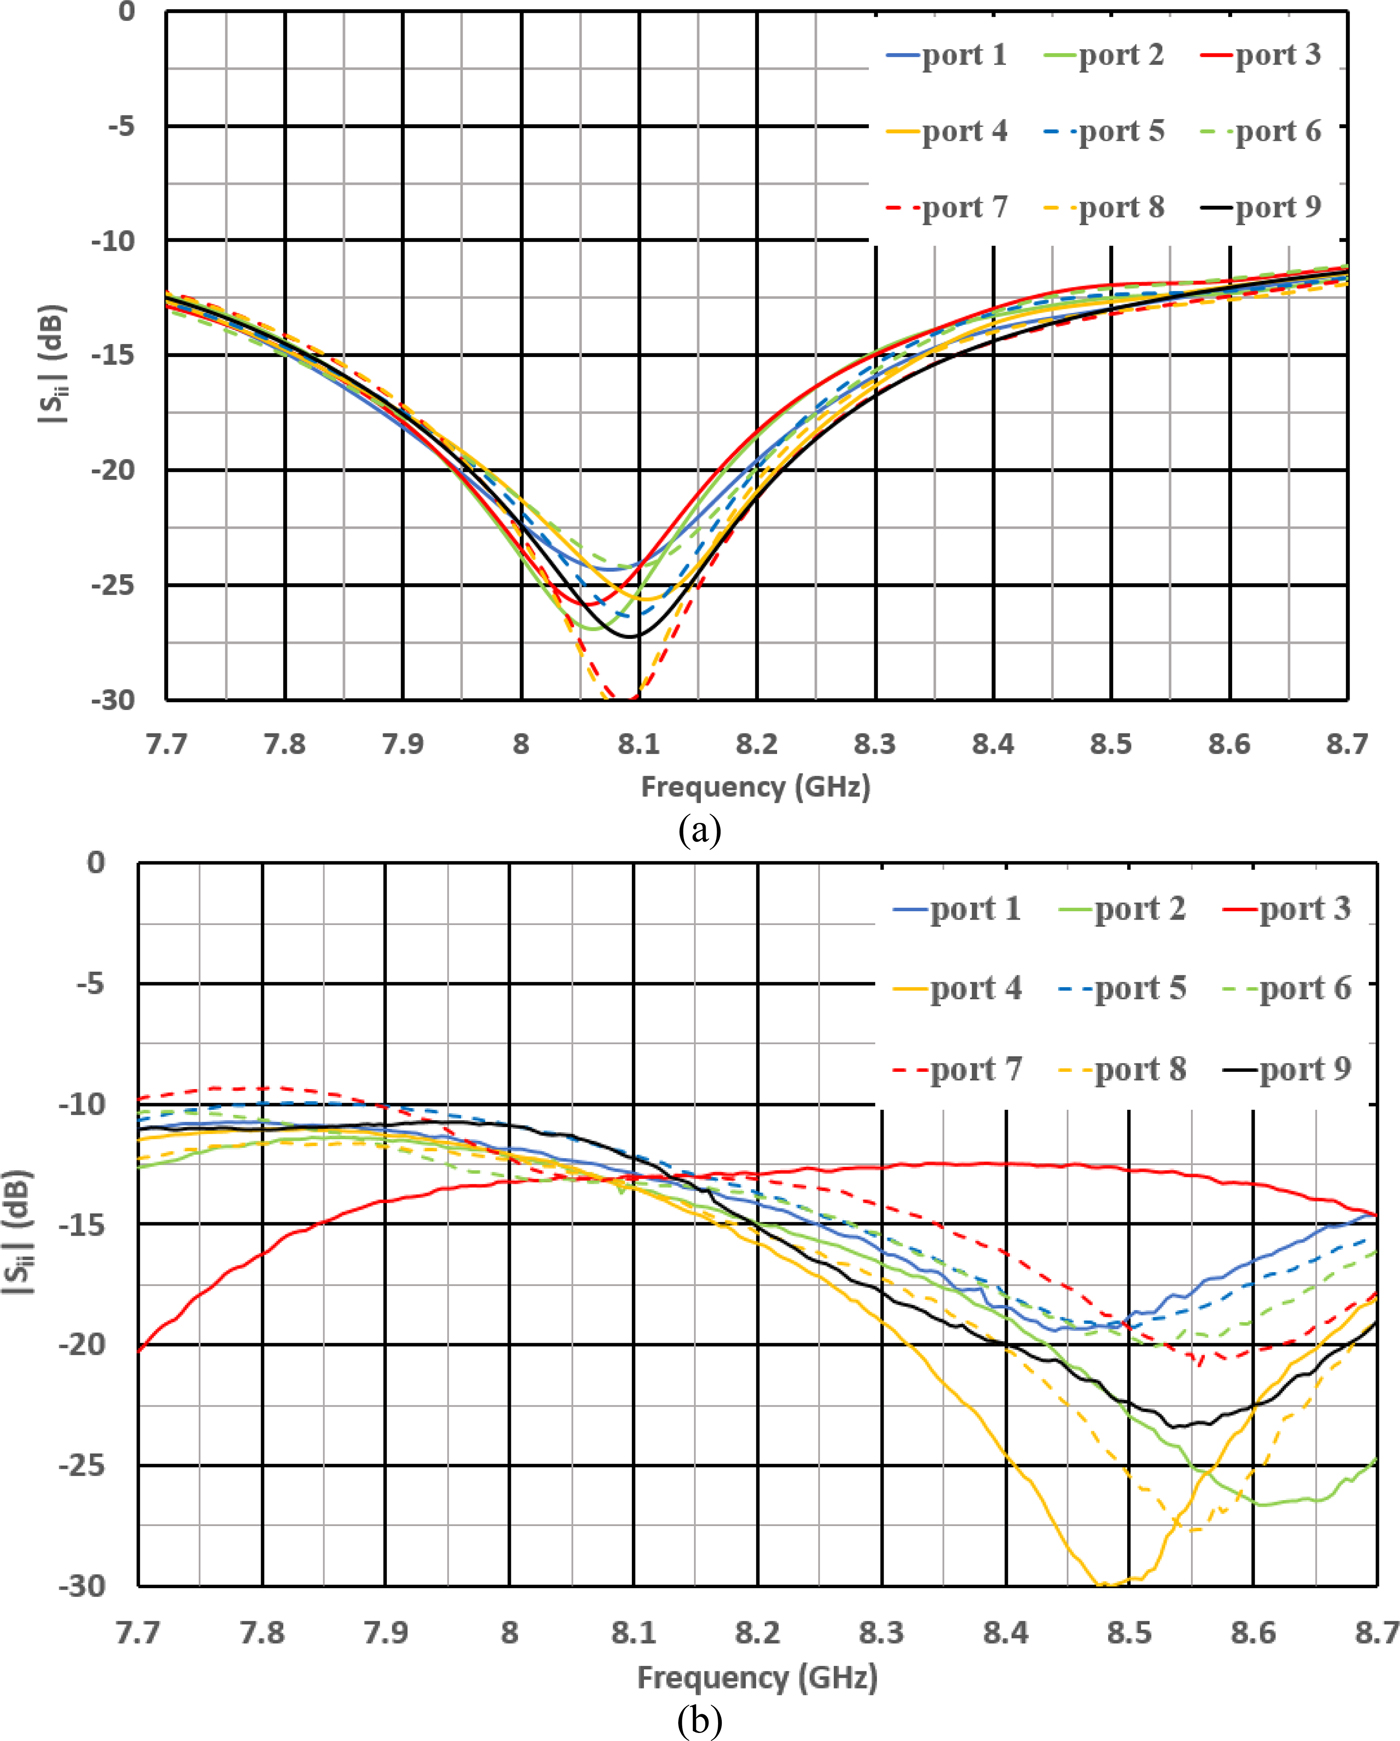
The frequency evolution of the nine S ii parameters obtained in simulation (Fig. 4(a)) is compared with the experimental one in Fig. 4(b).
S ii parameters evolution as a function of the frequency: (a) simulation and (b) experimental results.
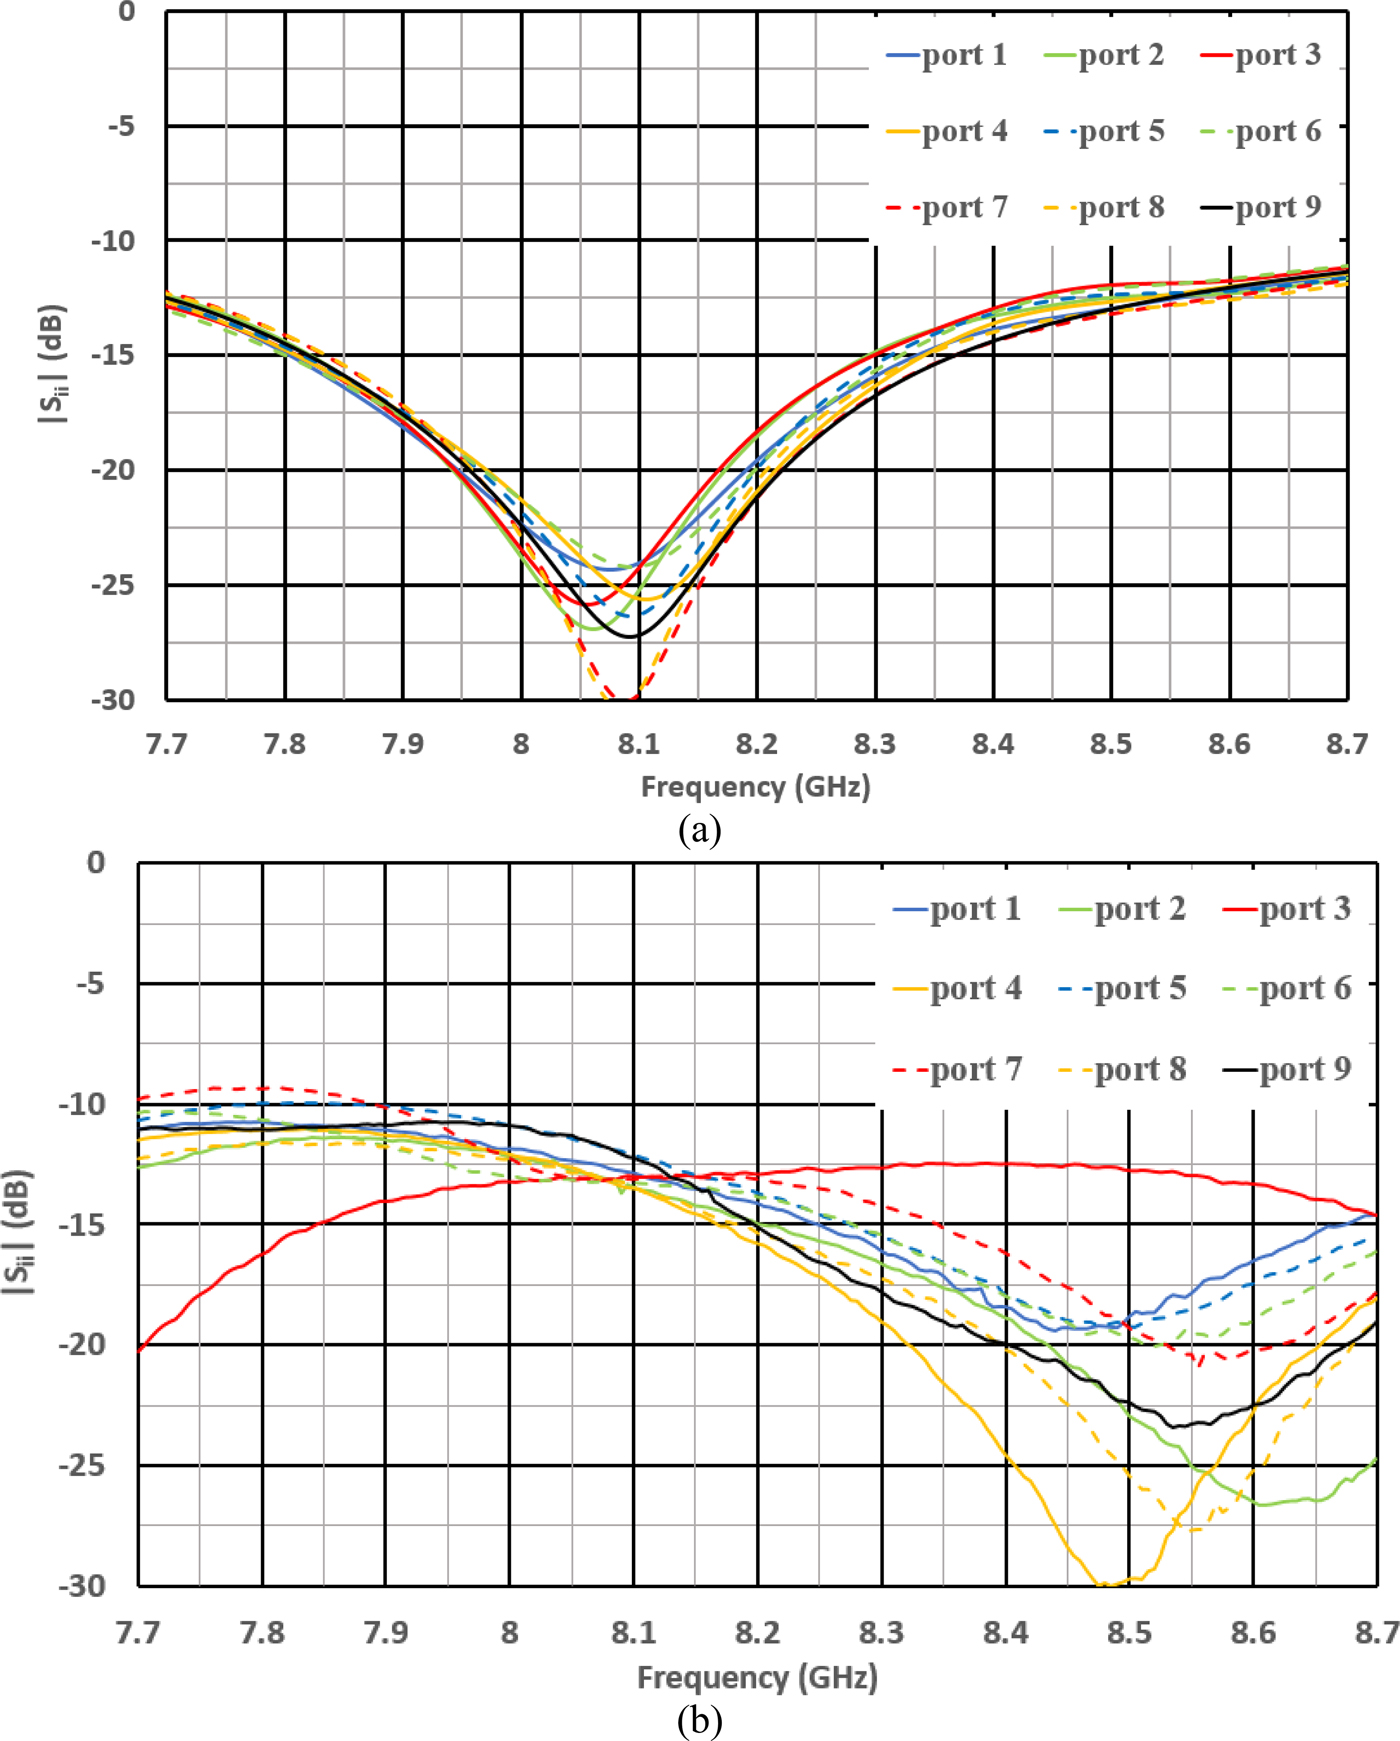
In both cases, the curves show the S ii parameters lower than the expected “−10 dB” value on the whole bandwidth, illustrating the capacity of the ARMA solution to work on a wide frequency band [Reference Jecko, Arnaud, Abou Taam and Siblini13]. However, the S ii minima are shifted toward high frequencies in the experimental results.
Coupling effects
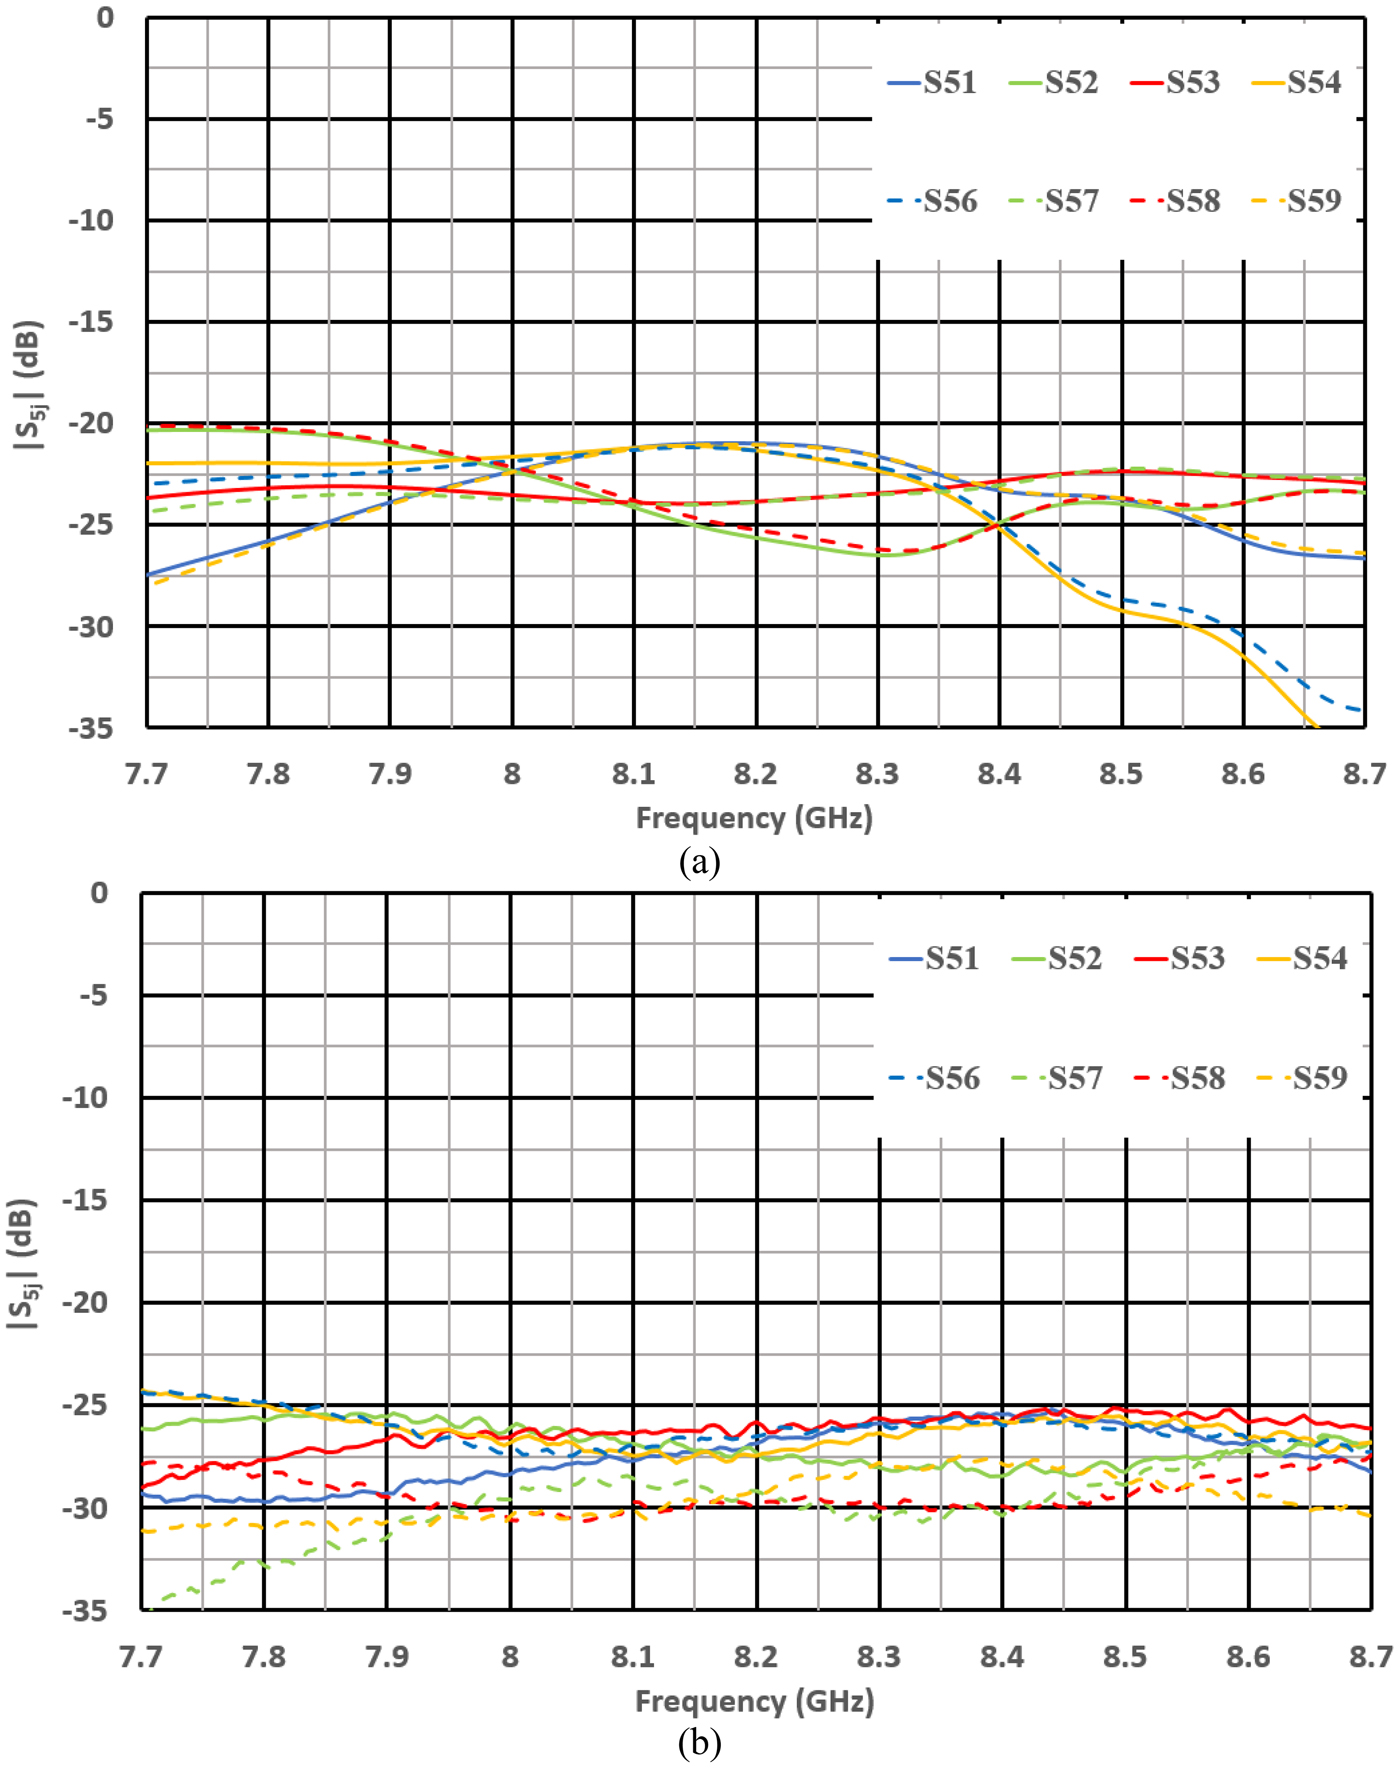
An important property of the ARMA is that the couplings between the pixels are very small: usually smaller than the ones between elementary antennas in an array [Reference Jecko, Arnaud, Abou Taam and Siblini13]. This property is well illustrated in Fig. 5 which shows the modulus of the coupling coefficients between the central port (P5 in Fig. 3) and the other ones for all the frequency range. The experimental results (Fig. 5(b)) are lower than the theoretical ones (Fig. 5(a)) because the matching impedance losses are increasing this phenomenon, as expected.
Mutual couplings between the central pixel and the other ones versus the frequency: (a) theoretical result, (b) experimental result (modulus comparison).
Experimental device for radiation pattern measurements
Experimental device description
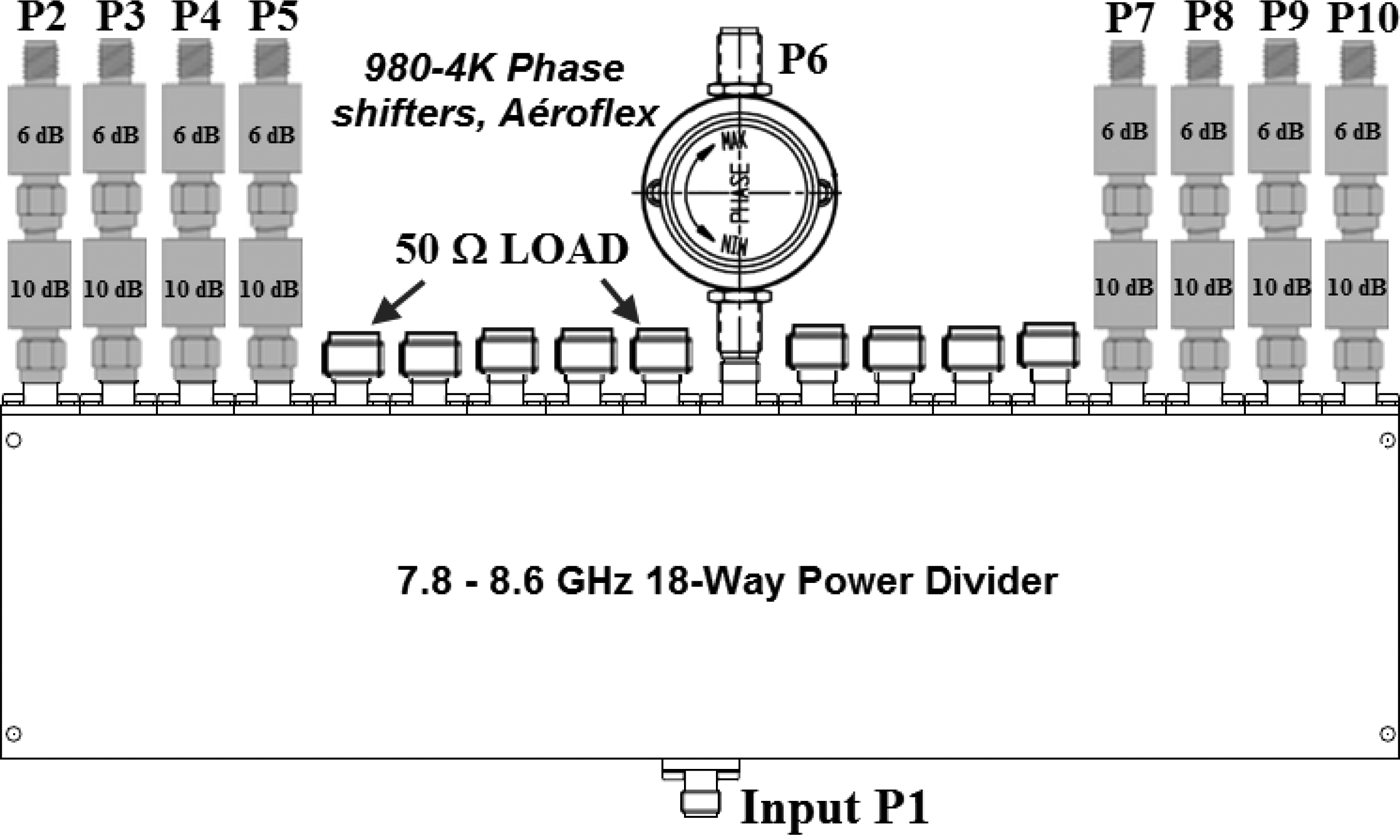
To measure the directivity, gain, axial ratio, and efficiency, the experimental device includes a power divider function with nine active outputs associated with a table of weightings [Reference Siblini, Jecko and Arnaud14, Reference Siblini, Taam, Jecko, Ramma, Bellion and Arnaud15]. The amplitude ratio of all the ports surrounding the central one (level = 1 and phase = 0°) is approximately A = 0.15 with a 180° phase. It was not possible to obtain a suitable power divider to check the previous specifications. As a whole, an experimental device was designed for measurements (Fig. 6).
Experimental device for radiation pattern measurements.
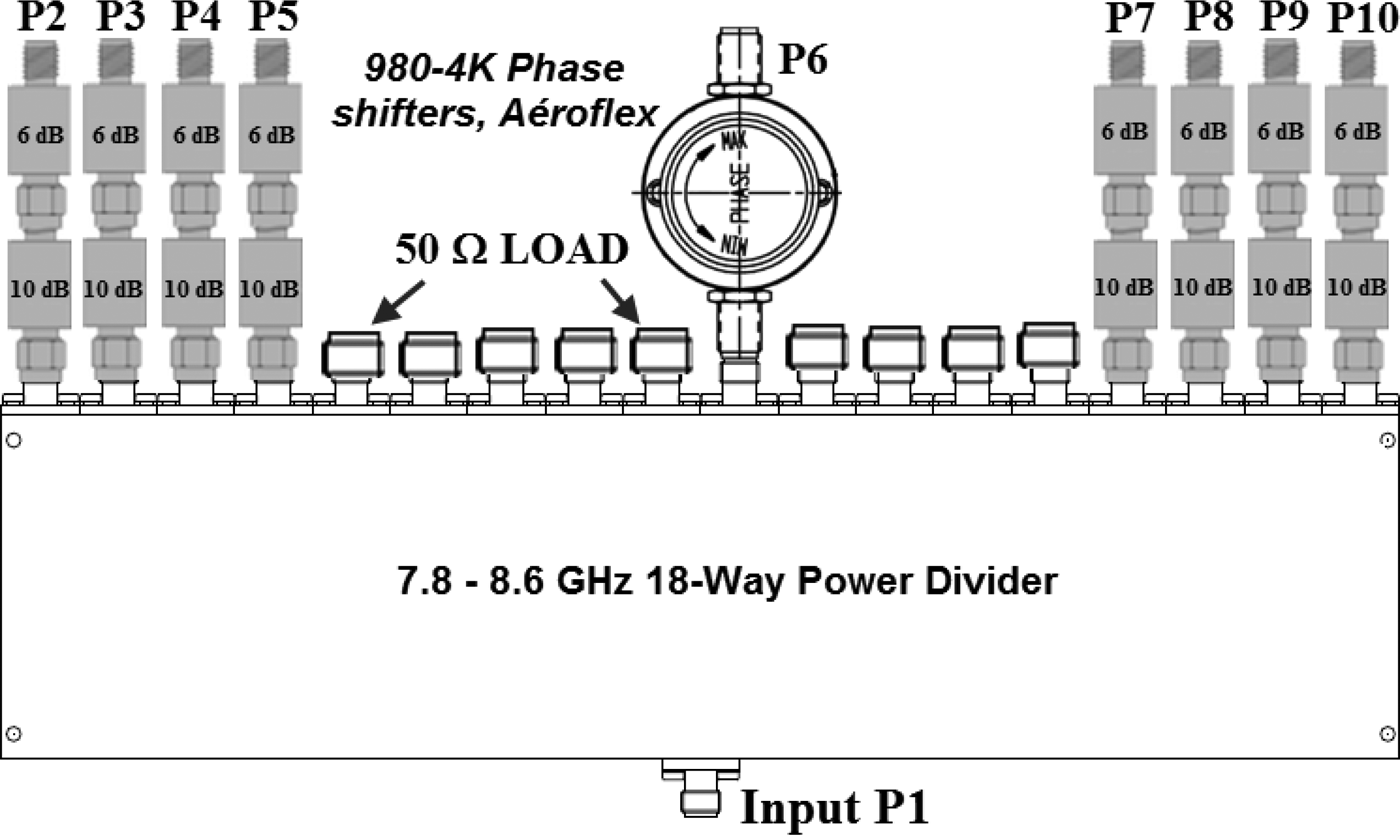
This device is built with “commercial off the shelf components” (COTS). It is made of an equi-amplitude and equi-phase power divider with 18 ways. Only nine outputs are used. The other ones are connected to 50 Ω loads, as shown in Fig. 6.
The eight ports corresponding to the pixels surrounding the central one are connected to attenuators to obtain an output level ratio close to A = 0.15, as given by the theoretical approach [Reference Siblini, Jecko and Arnaud14, Reference Siblini, Taam, Jecko, Ramma, Bellion and Arnaud15].
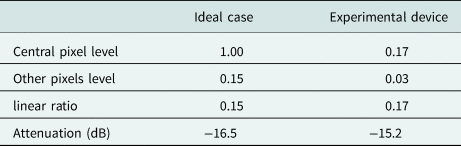
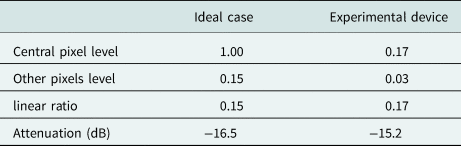
The central pixel is fed by the central port called P6 through a phase shifter to obtain a 180° phase shift with the surrounding ports. The weighting table obtained experimentally with the device is presented in Table 1 and compared with the theoretical one. The ratio between the central port and the other ones is slightly different (A = 0.17) due to the COTS attenuators resolution.
The weighting function
Measured scattering matrix of the experimental device
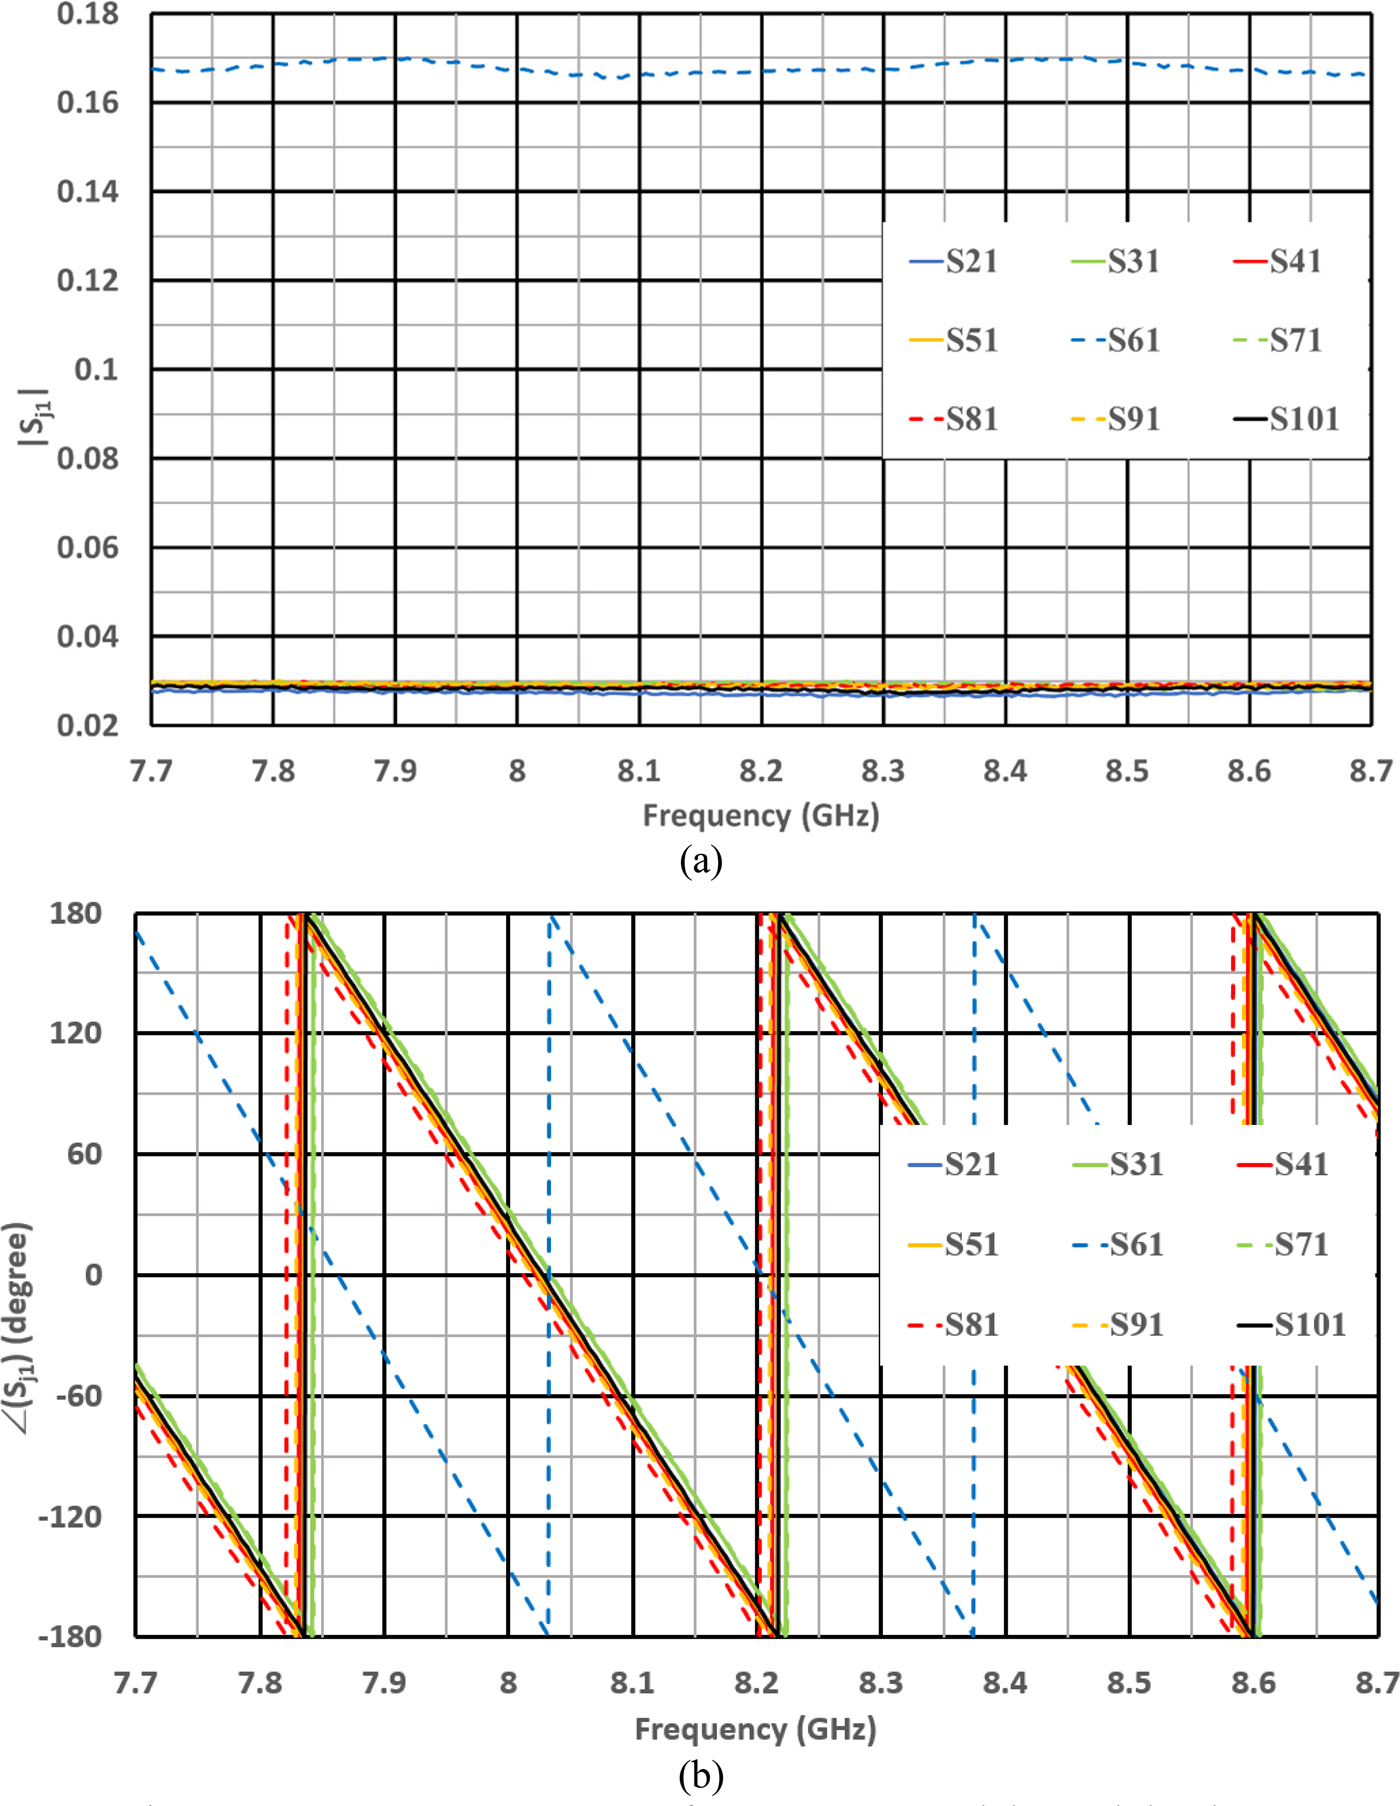
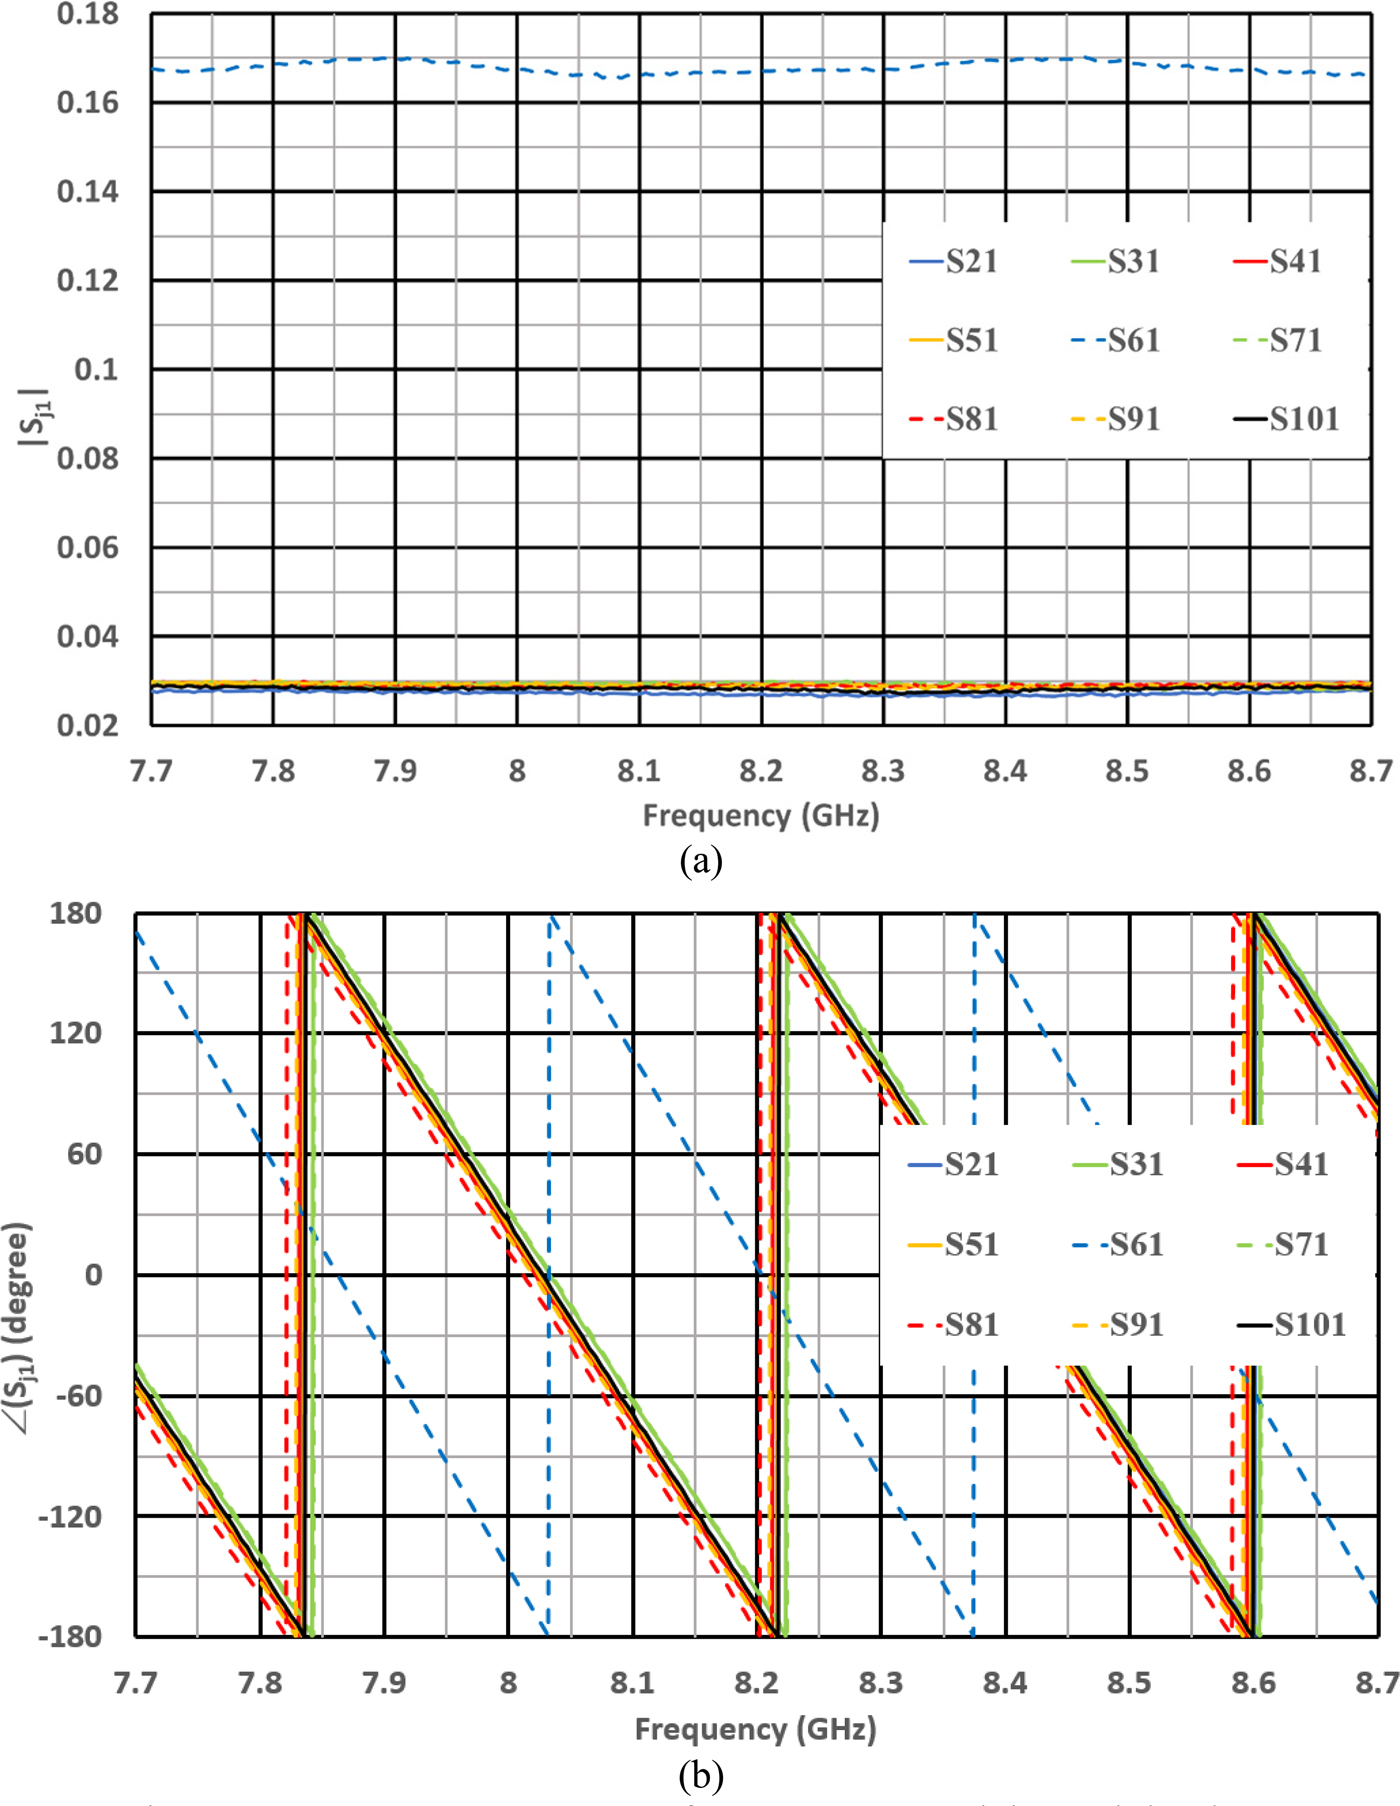
The previous table of weightings is verified in linear modulus (Fig. 7(a)) and phase (Fig. 7(b)) for the whole frequency range.
Input–output parameters versus frequency: (a) modulus and (b) phase.
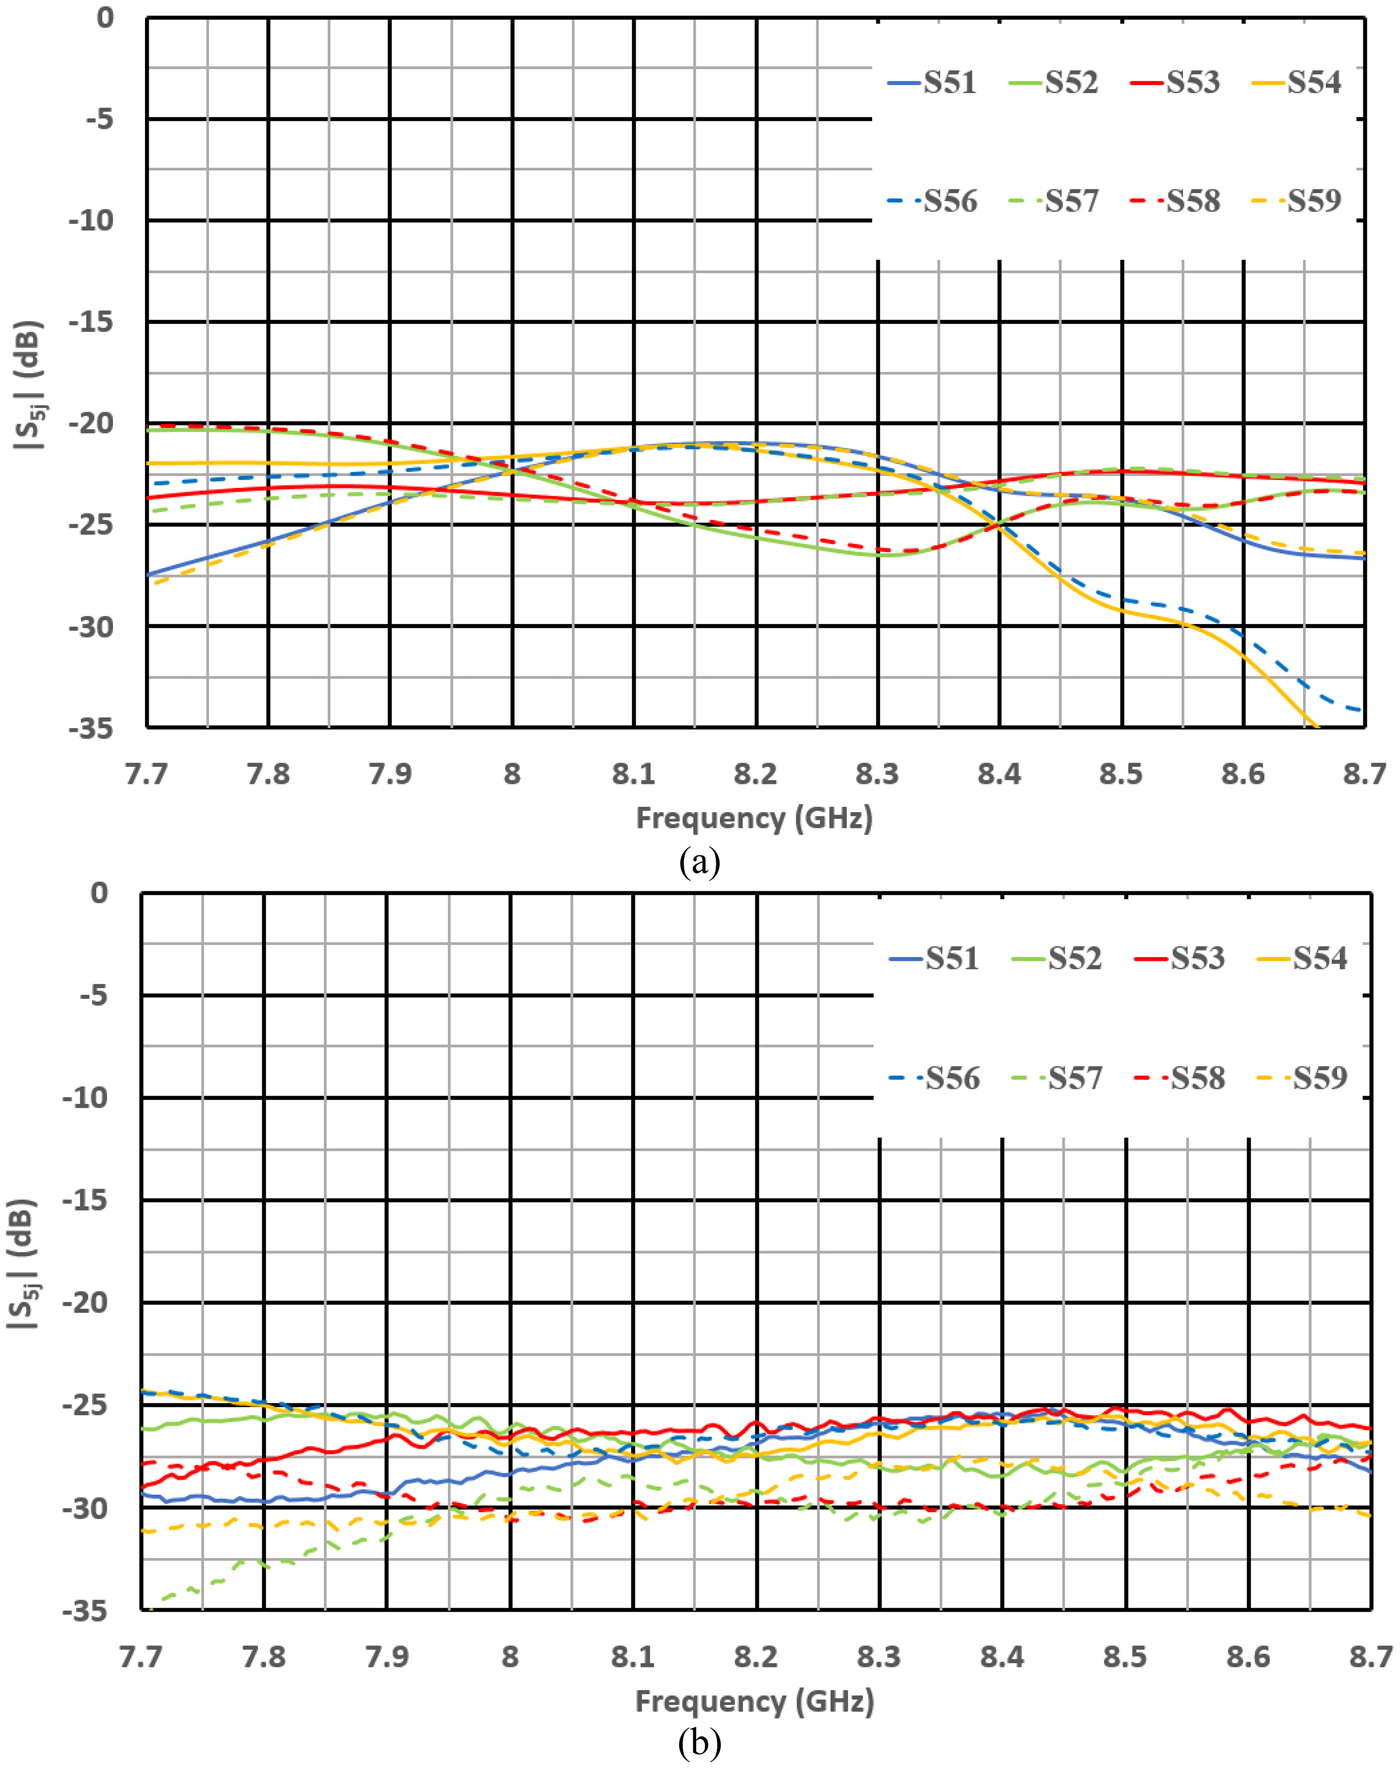
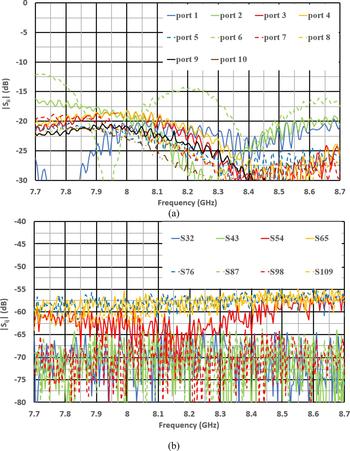
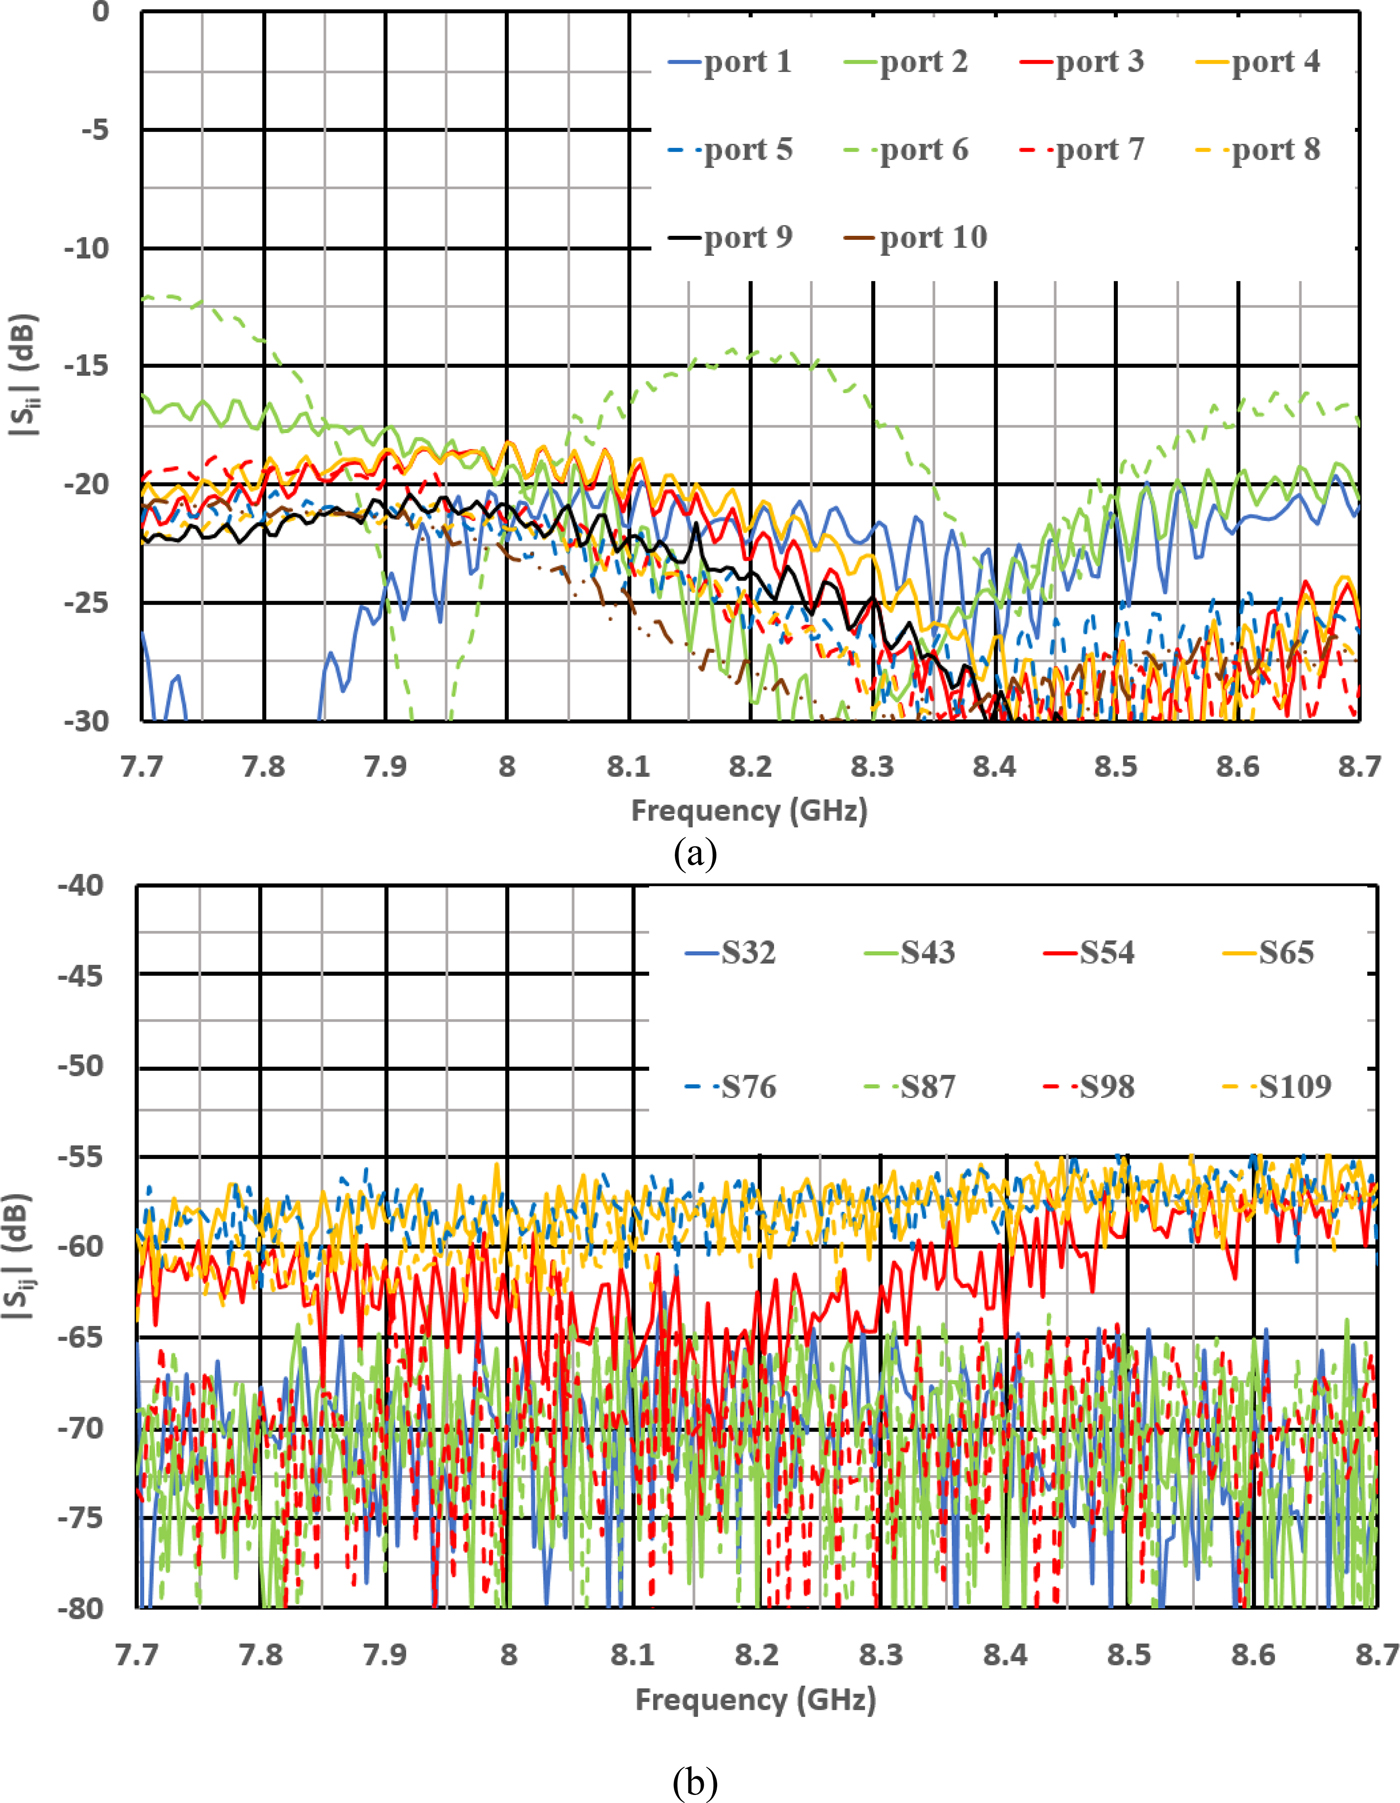
The matching parameters S ii are compliant with our −10 dB objective as shown in Fig. 8(a). It is the same for the S ij coupling parameters in Fig. 8(b).
(a) S ii and (b) S ij parameters evolution over the frequency range.
Measurement of the whole device (antenna + experimental device)
The results in this part are compared to the simulation of the antenna in CST Microwave Studio (RF simulator) connected to the measured scattering parameters, integrated in CST Design Studio (circuit simulator).
Isoflux radiation patterns
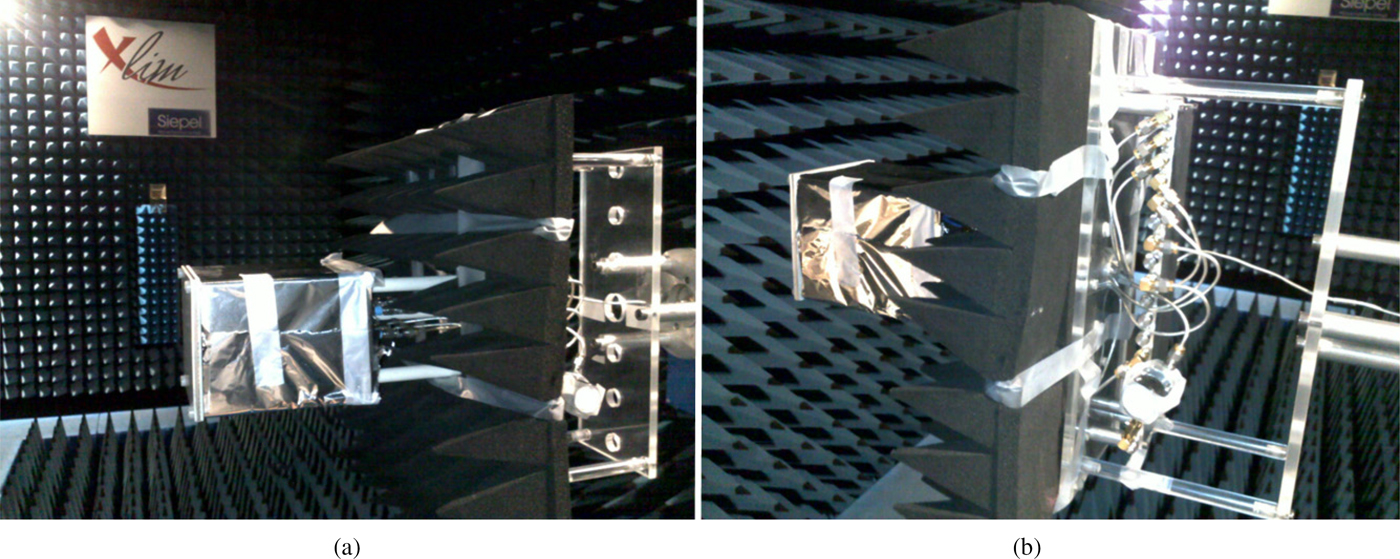
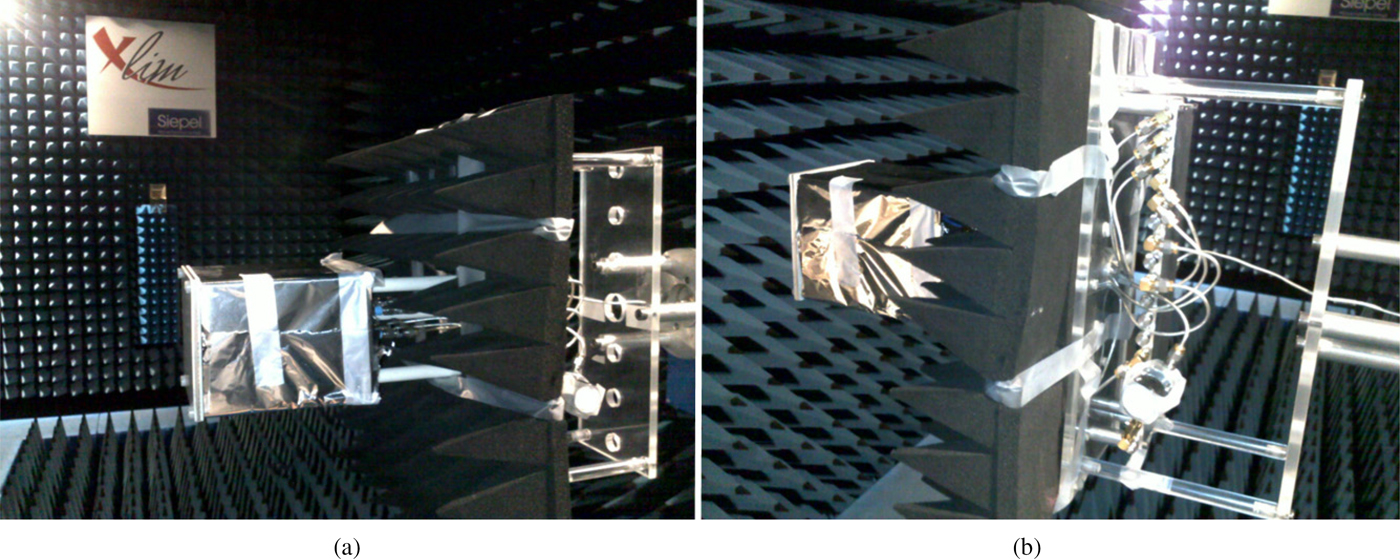
Radiation patterns (directivity, IEEE gain, and realized gains) are measured in our anechoic chamber (Fig. 9). An aluminum thin sheet allows simulating the nanosat platform. Absorbers were installed behind the antenna to minimize electromagnetic interferences of the motor. Therefore, the back radiation will be minimized resulting in a slight increase of the antenna directivity.
XLIM anechoic chamber used for radiation patterns measurement : (a) side view, (b) back view.
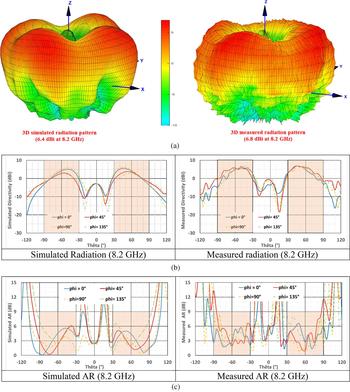
The 3D RHCP radiation pattern theory-measurement comparison is presented at the central frequency of 8.2 GHz in directivity. In Fig. 10(a), the isoflux shape is illustrated on the 3D radiation pattern for theoretical and experimental results. In both cases, the circular symmetry is disturbed by the edges diffraction. Figure 10(b) gives the RHCP radiation pattern in directivity at the same frequency for some φ cut-planes (0°, 44°, 90°, 134°) and Fig. 10(c) shows the axial ratio versus the θ site angle: the results are not really compliant with the isoflux characteristics around the axial direction. However, it is not a problem for a spatial bi-mode application [Reference Siblini, Jecko and Arnaud14, Reference Siblini, Taam, Jecko, Ramma, Bellion and Arnaud15] because the isoflux solution is used only for angles higher than 30°.
(a) 3D radiation patterns, (b) RHCP radiation pattern in φ = 0°, 44°, 90°, and 134° cut-planes, (c) axial ratio for the same cut-planes.
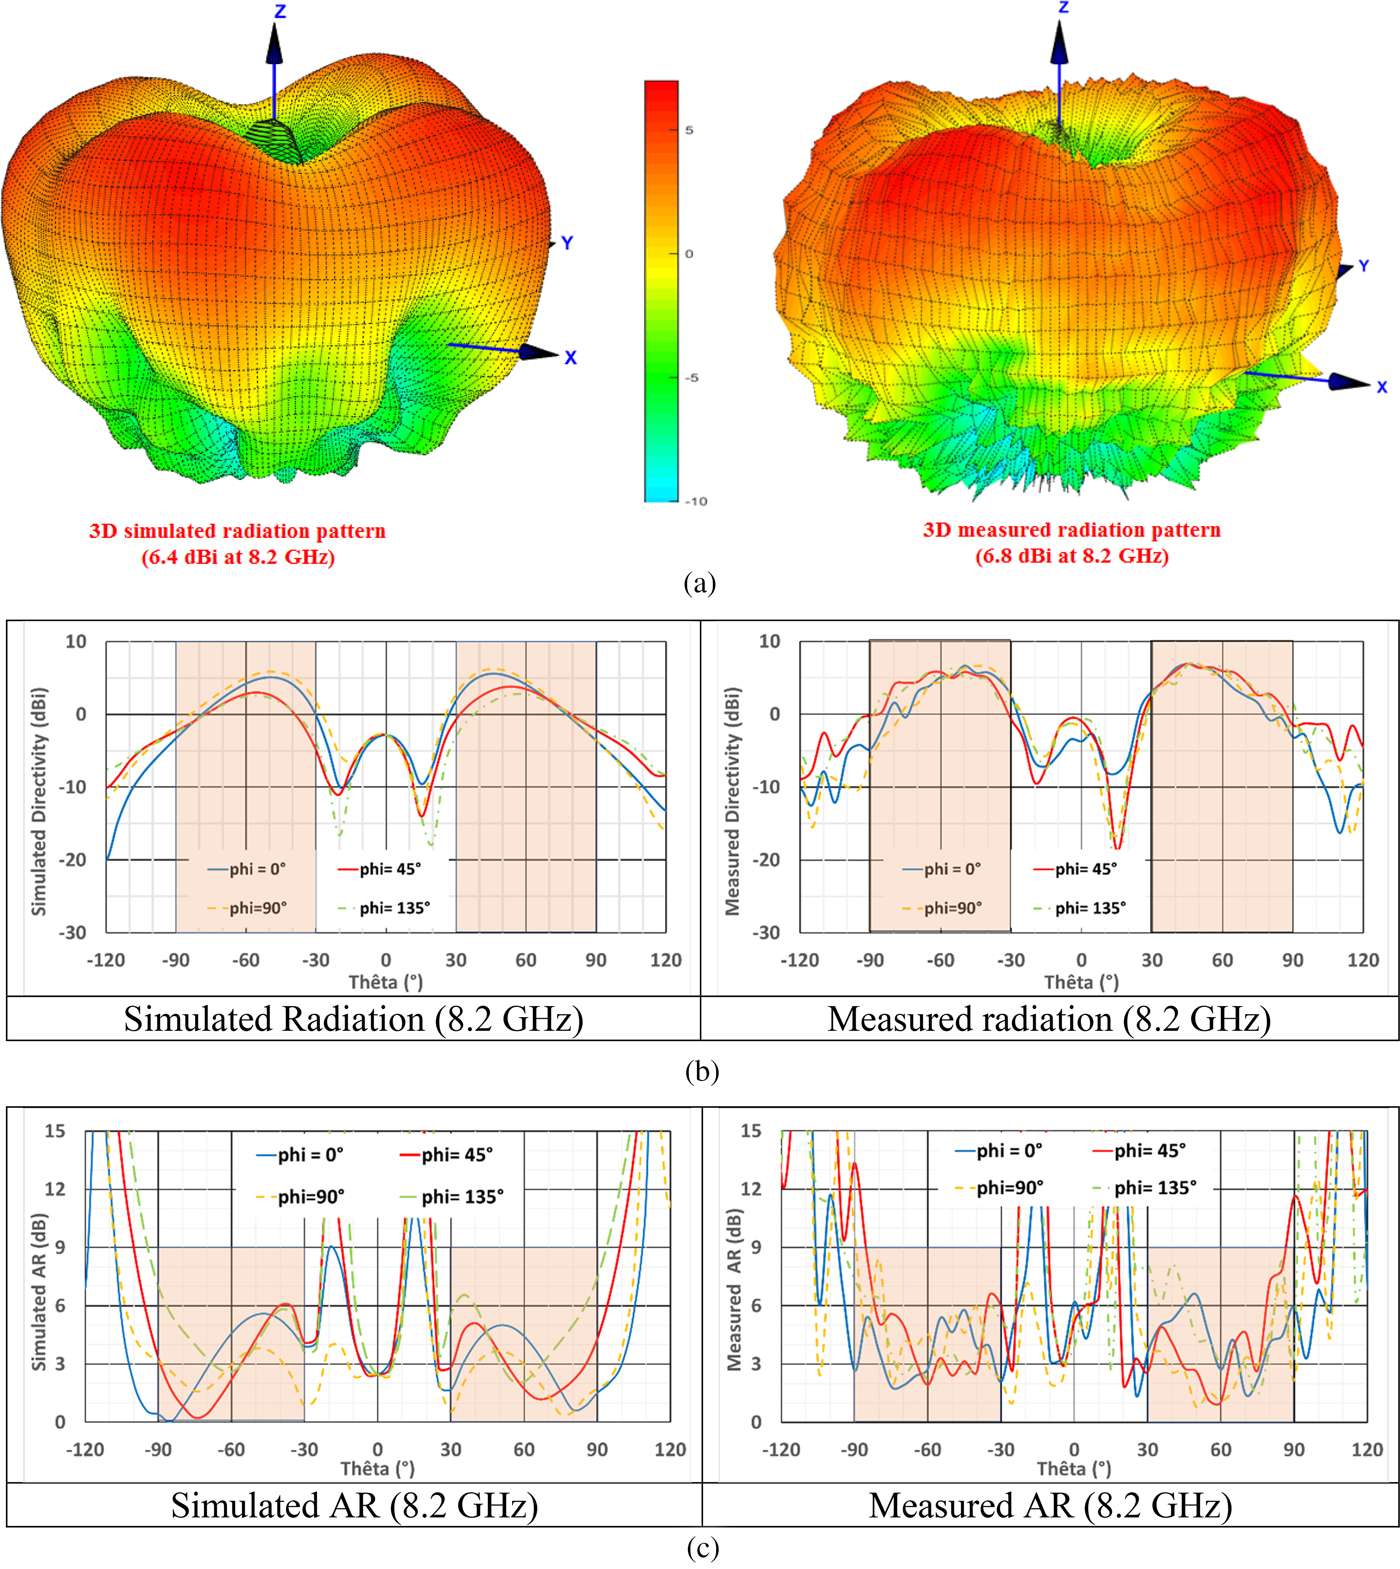
A good agreement is obtained between the theoretical and experimental results.
Frequency dependence comparison and power balance interpretation
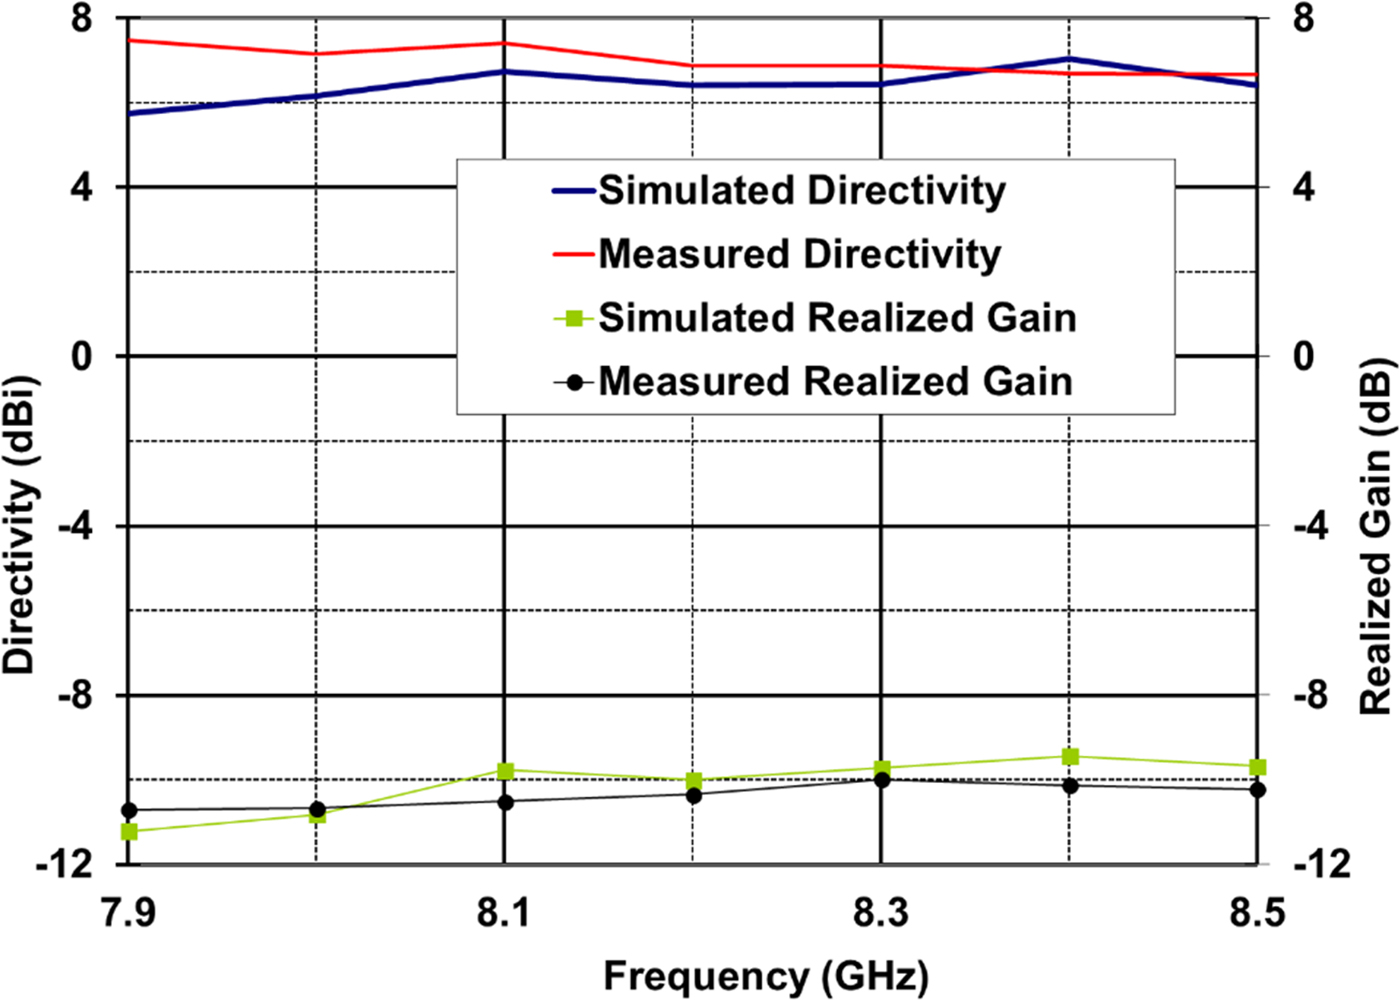
Figure 11 shows the theoretical and experimental evolution with the frequency of the directivity and associated maximum realized gain. The theoretical and experimental results are in good agreement on the whole frequency band.
Theoretical and experimental directivity and maximum realized gain versus frequency.
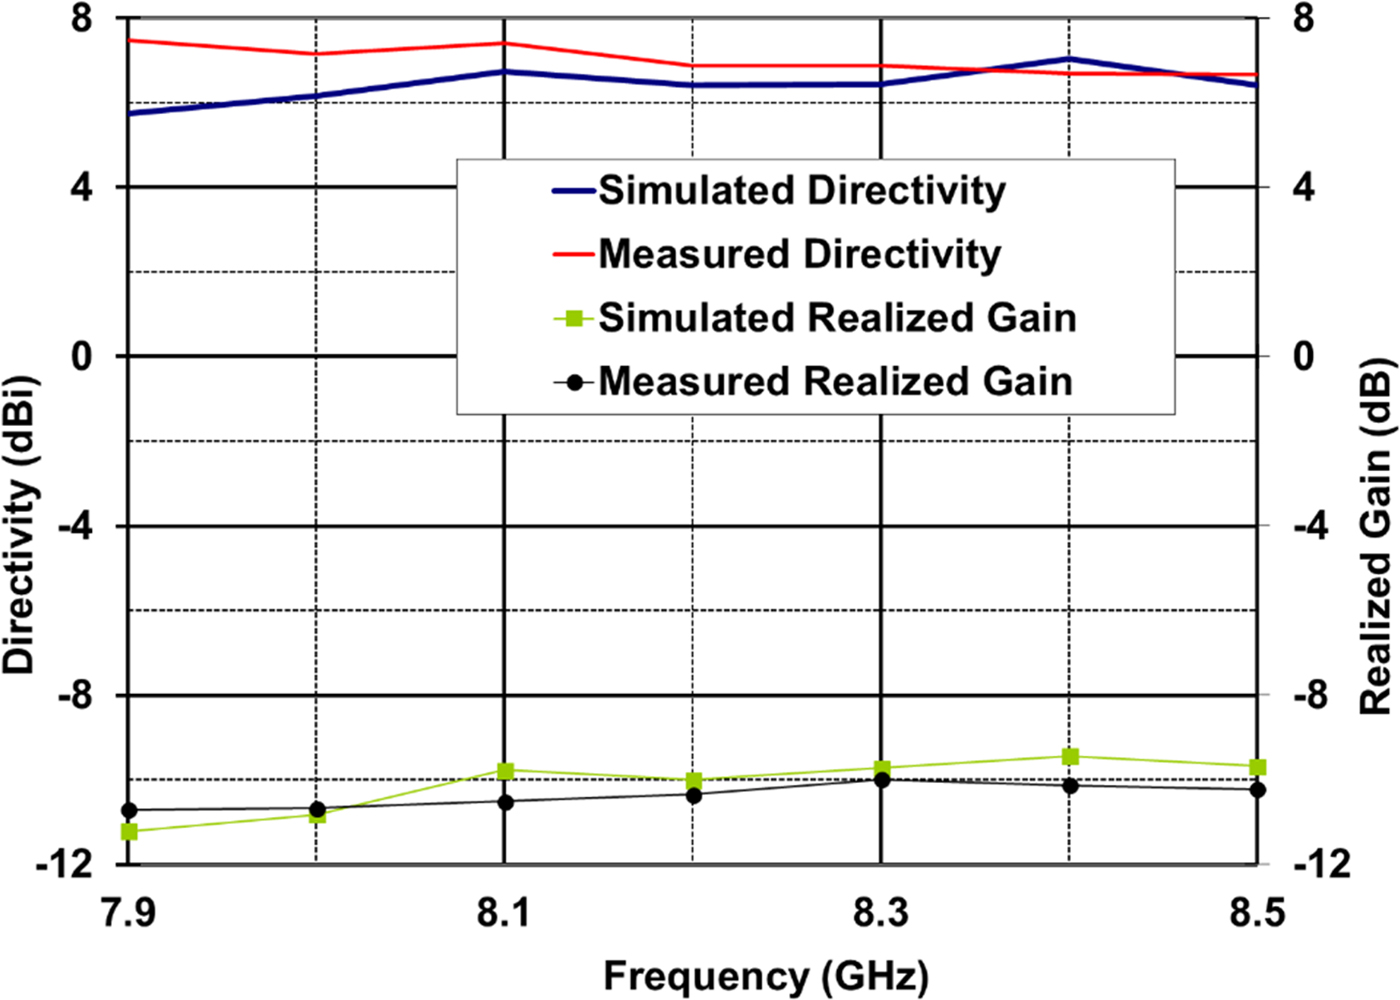
The directivity is obviously higher than the realized gain (about 7 versus −10 dBi) due to the losses of our experimental device. This one introduces 14.4 dB losses, as shown in Table 1: 10 log(0.172 + 8 × 0.032). It remains 2.6 dB due to the losses in the antenna itself (50 Ω resistances, dielectric substrates, transmission lines, connectors, etc.) and due to the experimentation process (±0.8 dB).
Conclusion
After describing the ARMA theoretical approach from [Reference Siblini, Jecko and Arnaud14, Reference Siblini, Taam, Jecko, Ramma, Bellion and Arnaud15] to obtain a bimode Earth coverage from small satellites on LEO orbit, an ARMA antenna was manufactured to validate the solution. A comparison between theory and experiment on the isoflux mode (the axial mode does need not to be validated) in the X frequency band has been performed. The results are in good agreement to show that the manufacturing problems are controlled in this frequency band.
Acknowledgement
The authors would like to thank the French Space Agency – CNES (Centre National d'Etudes Spatiales) – FRANCE for their financial support to this study.
 Eric Arnaud was born in France in 1970. He received the Diplôme D'Etudes Supérieures Specialisées (DESS) and the Ph.D. degrees in Electronics and Telecommunication from the University of LIMOGES in 1994 and 2010, respectively. He did his Ph.D. on circularly polarized EBG antenna. From 1996 to 2001, he has been in charge of the Microwave part of Free-Electron Laser (L.U.R.E). Since 2001, he has been in charge of XLIM laboratory's antenna test range. He participated in several research projects related to the design, development, and characterization of antennas. His research interests are mainly in the fields of circularly polarized EBG antenna, agile electromagnetic band gap matrix antenna, and isoflux pattern antenna.
 A. Siblini, Doctor in telecommunication, high-frequency systems, and agile antenna design during “Cotutelle PhD program” between the Lebanese University and Limoges University/France 2017. Masters in electronics and signal processing from Lebanese University 2012. Telecommunication engineering from Lebanese University 2011. Instructor and researcher at Lebanese International University Lebanon LIU. Researcher at Lebanese University
 Anthony Bellion received his Engineer Diploma in Electronics in 2003 from the Ecole Nationale Superieure d'Ingénieurs de Limoges (ENSIL) (Limoges, France). He received his Ph.D. degree in Optical Communication and Microwave Techniques from the University of Limoges, Limoges, France in 2008 working on multi polarizations and UWB antenna designs for direction finding systems. After industrial experience with Thales, France, he joined the Antenna Department of the French Space Agency (CNES). Since 2016, he has headed the CNES Antenna Department. His areas of research are mainly UWB antennas, miniature antennas design, and characterization.
 B. Jecko was born in Trélissac (24), France in 1944. He obtained the Ph.D. degree in Physics from the University of Limoges (France) in 1979. In this university, he served as a professor (exceptional class in 2000) at the IUT (GE teaching department founder in Brive in 1985). In the research area, he was first an electromagnetism specialist for EMC (fellow member EMP) and now for Telecommunications, Radar, and Electronic Warfare applications. He created and headed the department OSA at the XLIM institute (University of Limoges – CNRS laboratory) until 2009. In 2009, he was appointed as a DRRT (Regional Delegate for Research and Technology) by the French Research Ministry until his retirement in September 2013. Since then, he is coming back to his research department as an Emeritus Professor. Publications ≅ 130, Communications ≅ 400, Patents ≅ 30, Thesis supervision ≅ 130 – HDR ≅ 7