Introduction
Mastitis is the most common disease in dairy cows, impacting animal welfare and farm profitability (Ruegg, Reference Ruegg2017). In automatic milking systems (AMSs), there could be an increase in predisposing factors for mastitis (Jago et al., Reference Jago, Davis, Copeman and Wollford2006; Dohmen et al., Reference Dohmen, Neijenhuis and Hogeveen2010; Hovinen and Pyörälä, Reference Hovinen and Pyörälä2011). On the other hand, AMSs collect various milking data automatically, potentially easing mastitis detection (Hogeveen et al., Reference Hogeveen, Klaas, Dalen, Honig, Zecconi, Kelton and Sánchez Mainar2021).
Since the introduction of AMSs, there has been a demand for automated mastitis detection systems, as there is a need to reduce the time to identify cows with mastitis that require evaluation and, if necessary, intervention by a veterinarian (Mollenhorst et al., Reference Mollenhorst, Rijkaart and Hogeveen2012). Early detection of mastitis can be achieved through the analysis of parameters derived from AMS data. Data from other sensors, such as cow weight measurement, can also be combined (Pakrashi et al., Reference Pakrashi, Ryan, Guéret, Perry, Corcoran, Keane and Mac Namee2023). There are also other sensors that can be used for mastitis monitoring, such as behaviour monitoring sensors (Siivonen et al., Reference Siivonen, Taponen, Hovinen, Pastell, Lensink, Pyörälä and Hänninen2011; Medrano-Galarza et al., Reference Medrano-Galarza, Gibbons, Wagner, de and Rushen2012; Sepúlveda-Varas et al., Reference Sepúlveda-Varas, Proudfoot, Weary and von Keyserlingk2016).
Manufacturers of AMSs have their own models for identifying mastitis, each with its own way of integrating these data into cow monitoring software. However, they do not predict mastitis; instead, they identify cows with a higher likelihood of having mastitis on a day-to-day basis. The manufacturer Lely (Lely Industries) uses the MCQ-C test in its AMS, which performs a viscosity-based assay similar to the principle of the California mastitis test (CMT), generating a value expressed in cells/mL and flagging cows with elevated somatic cell count (SCC). This methodology applied in Lely's AMS follows guidelines according to Deng et al. (Reference Deng, Tjgm, Hogeveen, Spaninks, Heij, Postema, van Werven T and Koop2020). The AMS produced by the manufacturer DeLaval uses the MDi (Delpro® software), which consists of the expected production percentage per quarter (%), presence of blood (ppm), electrical conductivity (EC) per quarter (mS/cm), kicking during the milking process (yes or no) and SCC (using its Online Cell Counter – OCC device).
Khatun et al. (Reference Khatun, Thomson, Kerrisk, Lyons, Clark and Molfino2018) predicted mastitis 1–3 days in advance, combining six AMS sensor measurements (quarter-level milk yield [kg], EC [mS/cm], average milk flowrate [kg/min], occurrence of incompletely milked, quarters in each milking session [yes or no], milk yield per hour [kg/h] and EC per hour [ECH; mS/cm/h]), with results of 90% sensitivity, 91% specificity and 96% accuracy. Pakrashi et al. (Reference Pakrashi, Ryan, Guéret, Perry, Corcoran, Keane and Mac Namee2023) developed a machine learning algorithm using AMS sensor measurements and milk composition data to predict subclinical mastitis 7 days in advance, with a sensitivity of 69.45% and specificity of 95.64%. Pakrashi et al. (Reference Pakrashi, Ryan, Guéret, Perry, Corcoran, Keane and Mac Namee2023) utilized the following parameters: individual cow composite milk yield and maximum milk flow (collected twice a day), milk composition (fat, lactose, protein) and SCC (collected once a week). Data on parity, calving dates, predicted transmitting ability for SCC, body weight and history of subclinical mastitis were also included.
Previous studies on the early detection of mastitis suggest that achieving adequate accuracy and timeliness in identifying the disease remains a challenge. Although various sensors are available for data collection and the development of interaction models, effectively identifying cows with mastitis depends on optimizing these systems. Therefore, further research is needed to understand how the integration of these sensors can improve the prediction of mastitis with greater advance notice.
Therefore, this study aimed to evaluate parameters and monitoring data for early identification of clinical mastitis in dairy cow and determine how early it is possible to identify mastitis, within a 30-day interval, with the highest predictive accuracy.
Material and methods
This study was evaluated and approved by the Ethics Committee on Animal Research at PontifÍcia Universidade CatÓlica do Paraná(PUCPR), registered under number 02298.
The work was conducted following a retrospective longitudinal cohort study design, using data collected from August 2021 to February 2022 from the Dairy Cattle sector of the university farm of PUCPR located in Paraná, southern Brazil (25°39ʹ28.3″S 49°17ʹ17.1″ W – Climate Cfb). The climate is classified as temperate oceanic (Cfb) according to the Köppen–Geiger system (Caviglione et al., Reference Caviglione, Kiihl, Caramori and Oliveira2000). This region experiences mild summers and no dry season, with rainfall uniformly distributed throughout the year, accompanied by severe and frequent frost. The average annual temperature is 17.3°C, and the annual precipitation is 141 mm.
The research unit featured a free-stall barn for housing lactating cows milked by one AMS (VMS 300, DeLaval) using the milk-first system. The beds available in the barn were rubber-mat type, covered with sawdust, replenished four times a week and cleaned once a day. The lactating herd consisted of an average of 55 Holstein cows.
The diet for lactating cows was provided twice daily at predetermined times (08:00 and 16:00 h), split between the feed bunk in the barn and part of the concentrate provided in the AMS, in the form of a partial mixed ration. The diet provided in the feed bunk contained corn silage, ryegrass haylage, commercial concentrate, ground corn, soybean meal, sodium bicarbonate, minerals, vitamins and other additives, meeting nutritional requirements according to NASEM (2021).
Selection of cows suspected of mastitis
Each morning, veterinarians checked the parameters of the AMS, to identify cows with alterations to milk or milking parameter. The selection of cows suspected of mastitis was based on the identification by the Delpro® herd management software, of variations in one or more mastitis indicative parameters, which were: milk EC values per quarter (mS/cm) ≥ 5.37 ± 0.02 mS/cm, according to Norberg et al. (Reference Norberg, Rogers, Goodling, Cooper and Madsen2004); variation in expected production percentage per quarter (%) (≤80%); SCC values exceeding 200,000 cells/mL in this milking, in the last milking or in the average of the last nine milkings; and values ≥ 2.0 in MDi (Delpro® software). The MDi consists of EC, milking interval and blood presence (ppm) at a quarter level, ranging from 0.8 to 4.0, where values below 1.4 indicate a low probability of mastitis and values around 2 or more indicate a high risk of mastitis (Lusis et al., Reference Lusis, Antane and Laurs2017). The data are issued through a management platform (DeLaval DelPro®). The MDi may also include SCC values when the SCC system attached to the AMS is available, as was the case. The contribution of individual variables to the MDI value is not available, since it is a proprietary technology developed by DeLaval (DeLaval DelPro®).
Cows that met one or more of the mentioned parameters were selected as suspected mastitis cows and were examined. For every cow suspected of mastitis, two other lactating cows were randomly chosen for evaluation to provide a comparison with healthy herd companions. A proportion of approximately 3 to 1 was used to increase the study’s power (Dohoo et al., Reference Dohoo, Wayne and Stryhn2012).
Identification of cows with mastitis (M) and without mastitis (NM)
After the selection of suspected cows and the random selection of two healthy cows, a general and a specific udder physical examination (PE) was conducted, following Dirksen et al. (Reference Dirksen, Gründer and Stöber1990). Cows that exhibited changes in the PE consistent with descriptions of catarrhal, apostematous, phlegmonous or gangrenous mastitis (Birgel, Reference Birgel2021) were classified as cows with clinical mastitis (M).
The CMT was performed for all cows (Schalm and Noorlander, Reference Schalm and Noorlander1957). Cows that did not show any changes in the PE and that were negative for CMT were considered cows without mastitis (NM). At the time of performing the CMT test, if the quarter tested positive, a sample was collected for microbiological culture. If the CMT test was non-reactive, a pooled milk sample from all four quarters of the cow was collected. Microbiological culture was conducted using OnFarm® system (Granja et al., Reference Granja, Fidelis, Garcia and Santos2021).
Any cow that was randomly selected and tested negative was temporarily excluded from the possibility of selection for the next 30 days; after this period, it became eligible for random selection again. This same criterion was used for cows with mastitis. Consequently, a cow that was diagnosed with mastitis would only be reinstated into the eligible population after a 30-day period subsequent to complete clinical resolution. In the event of recurrent mastitis following this period, it was classified as a new, independent case.
Evaluated parameters
The following information was collected from all evaluated cows (M and NM):
Cow data: age (years), lactation order, days in milk (DIM) and days of pregnancy. DIM values were categorized into three groups: group 1 (0–90 days in lactation), group 2 (91–180 days in lactation) and group 3 (above 180 days in lactation). This division into three groups follows the definition of peak lactation and lactation persistence in dairy herds. This division is influenced by the location and environment where the herd is, as described by Evangelista et al. (Reference Evangelista, Schenkel, Chen, Oliveira, Casey, Melka and Brito2024), who investigated the influence of environmental factors on the lactation curve parameters and milk production of Holstein cows in Paraná, Brazil. Pregnancy time values were classified into four groups: group 0 (non-pregnant cows), group 1 (0–90 days of pregnancy), group 2 (91–180 days of pregnancy) and group 3 (above 180 days of pregnancy).
Mammary gland health parameters: parameters obtained through reports of DeLaval’s own AMS and its software (Delpro®): milking duration (s), total production per cow and per quarter in that milking (kg), SCC (×1,000 cells/mL), average milk flow per quarter per milking (kg/min), peak milk flow (kg/min), presence of blood (ppm), CE per quarter (mS/cm) and MDi (unitless). For the analysis of MDi data, on the day of mastitis diagnosis, two cut-off values were used: 1.4 and 2.0, following the methodology applied by Lusis et al. (Reference Lusis, Antane and Laurs2017), in which cows with MDi ≥ 1.4 should be examined for udder health problems and cows with MDi ≥ 2.0 are considered to have an acute alert for udder health issues. These data, retrospective to 30 days before diagnosis, were extracted into spreadsheets per evaluated cow (M and NM) in xlsx format for Microsoft Excel® (2010).
Cow behaviour data: automatically recorded by Cowmed® monitoring collars, including rumination, feeding activity and idle behaviour. The validity of behavioural data collected by collars has been supported by Lovatti et al. (Reference Lovatti, Dijkinga, Aires, Garrido, Costa and Daros2024). The parameters were defined as the time each animal spent ruminating, feeding, and remaining idle, quantified over a 24-hour period (1,440 min). All individual cow activity data in the herd were recorded in the Cowmed® software. These data, retrospective to 30 days before diagnosis, were extracted every day at midnight and compiled into spreadsheets per evaluated cow (M and NM) in xlsx format for Microsoft Excel® (2010).
Statistical analysis
The statistics were performed using SPSS 25 software (IBM Corp, 2017), employing the generalized linear model (GLM) method for mastitis prediction, with linear, logistic and discriminant regression models evaluated. Among these, the linear regression model exhibited the most favourable predictive performance, justifying its selection for the final predictive model. The backward elimination technique was applied. Variables with higher p-value were removed first and the model’s predictive ability assessed; if predictive ability increased or remained the same, the next variable with higher p-value was removed and predictive ability reassessed. This procedure was repeated as needed until the final model was obtained. To perform GLM, normally distributed and continuous independent variables were used. The presence of clinical mastitis (yes or no), a dichotomous variable, was used as a response variable (yes or no, M – mastitis or NM – not with mastitis). Therefore, numerical continuous results for this model were classified as values > 0.5 = 1 (M) and values < 0.5 = 0 (NM). The following parameters were used as independent variables: per-quarter parameters – CE per quarter (mS/cm), average milk flow per quarter per milking (kg/min), peak milk flow per quarter per milking (kg/min), milk production per quarter per milking (kg); per-day parameters – average milk flow per quarter per day (kg/min), average CE per quarter per milking per day (mS/cm), average peak milk flow per day (kg/min), average production per day (kg), average milking duration per day (s), rumination (min/day), feeding activity (min/day), rest (min/day), lactation order, DIM and somatic cell score (SCS). Since SCC did not follow a normal distribution, it was transformed into a logarithmic scale, following Shook (Reference Shook1993) with the equation: SCS = log2 (SCC/100,000) + 3. It was decided to evaluate all per-day parameters, regardless of how they were initially collected, whether per milking per quarter or per daily assessment. This change was applied to all subsequent analyses.
Accuracy, sensitivity, specificity, positive predictive value (PPV) and negative predictive value (NPV) of the clinical mastitis prediction method were calculated, according to Banoo et al. (Reference Banoo, Bell, Bossuyt, Herring, Mabey, Poole, Smith, Sriram, Wongsrichanalai, Linke, O'Brien, Perkins, Cunningham, Matsoso, Nathanson, Olliaro, Peeling and Ramsay2006), for the 30 days prior to the diagnosis of mastitis and also for the MDi (≥1.4 and ≥2.0) on day 0. All analysis was performed with SPSS 25 software (IBM Corp, 2017).
Results
Of the total of 129 inspections (in the herd of 55 Holstein cows), 39 cases were confirmed as having clinical mastitis, and the data from these cows were included in the M group; the remaining 90 cases were defined as NM. Of the 39 cases of cows with mastitis, 9 were repeat occurrences in the same cows.
The average age of M cows was 5.64 ± 1.27 years, and for NM cows, it was 5.02 ± 0.92 years. On average, 30 days before the diagnosis of mastitis, cows with mastitis had higher milk production (40.8 ± 11.8 kg/day) and SCCs (200,000 ± 50,000 cells/mL) compared to cows without mastitis (38.4 ± 10.2 kg/day; 50,000 ± 50,000 cells/mL), with shorter DIM (156 ± 85 days vs. 196 ± 85 days) and higher lactation order (2.5 ± 1.0 vs. 1.8 ± 0.8).
The occurrence of mastitis increased with the number of lactations in the cow, as proportionally there were more cows with mastitis than without mastitis from the second lactation onwards. It was observed that cows in early pregnancy (0–90 days) had a higher occurrence of mastitis compared to the other groups. As pregnancy time increased, the occurrence of mastitis decreased compared to the early pregnancy stage. In relation to DIM, cows with a higher number of days in lactation showed a higher occurrence of mastitis compared to cases at the beginning of lactation (Table 1).
Percentage and number (in parentheses) of cows with mastitis (M) and without mastitis (NM), according to parity, pregnancy group and DIM

a Percentage of cows with mastitis (M) and without mastitis (NM), according to lactation order.
b Percentage of cows with mastitis (M) and without mastitis (NM) according to pregnancy group: group 0 (no pregnancy), group 1 (0–90 days of pregnancy), group 2 (91–180 days of pregnancy) and group 3 (above 180 days of pregnancy).
c Percentage of cows with mastitis (M) and without mastitis (NM), according to DIM: group 1 (0–90 days in lactation), group 2 (91–180 days in lactation) and group 3 (above 180 days in lactation). In parentheses, the absolute number of cows with and without mastitis, according to days of lactation.
Thirty-nine positive microbiological cultures were identified. Among the positive results, the bacteria found were as follows: Staphylococcus non-aureus (SNA) at 41.4%, other Gram-positive bacteria at 27.3%, Streptococcus agalactiae/Streptococcus dysgalactiae at 10.2%, Klebsiella/Enterobacter spp. at 7.8%, Streptococcus uberis at 5.5%, Serratia spp. at 3.9%, Enterococcus spp. at 2.3% and Escherichia coli at 1.6%.
The variables were evaluated individually by day during the 30 days prior to diagnosis. The parameters that remained in the final model were (Supplementary Table 1) rumination (min/day), panting (min/day), feeding activity (min/day), daily milk production (kg/day), SCS, average milk flow (kg/min), average conductivity (mS/cm), average peak flow (kg/min), average production per milking (kg) and milking duration (s).
The mean and standard deviation of the significative parameters, during the 30 days, respectively, for cows M and NM were: rumination (min/day) (548.57 ± 7.66 vs. 302.02 ± 6.60), panting (min/day) (589.32 ± 12.80 vs. 564.99 ± 8.36), feeding activity (min/day) (274.27 ± 8.52 vs. 302.02 ± 5.59), daily milk production (kg/day) (41.13 ± 1.88 vs. 39.16 ± 0.93), SCS (SCC Log2) (5 ± 1 vs. 3 ± 0), SCC (580.44 ± 154.91 vs. 249.12 ± 58.70), average milk flow (kg/min) (1.16 ± 0.04 vs. 1.23 ± 0.02), average conductivity (mS/cm) (4.38 ± 0.08 vs. 4.29 ± 0.04), average peak flow (kg/min) (1.61 ± 0.05 vs. 1.69 ± 0.02), average production per milking (kg) (4.07 ± 0.20 vs. 3.75 ± 0.10) and milking duration (s) (441.63 ± 9.15 vs. 390.10 ± 5.87).
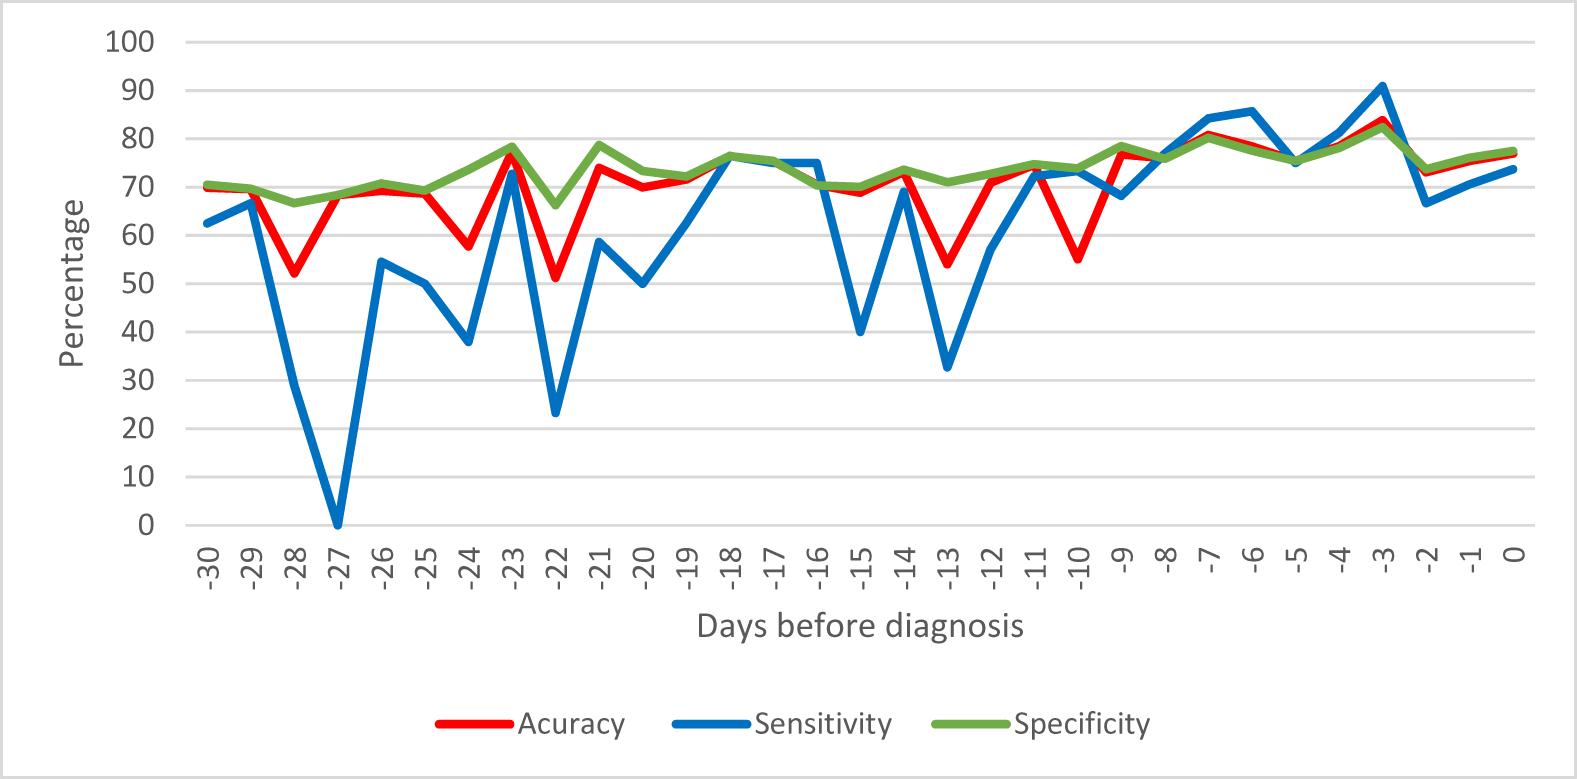
During the period from −30 to −10 days, accuracy, sensitivity and specificity showed variations without a defined pattern, as can be seen in Fig. 1. From day −9 to day 0, it was possible to predict the occurrence of mastitis with an average accuracy of 79.2%, a sensitivity of 82.5%, a specificity of 78.7%, a PPV of 41.5% and an NPV of 92.2% (Figures 1 and 2).
Percentage of accuracy, sensitivity and specificity of the final model in the 30 days prior to the diagnosis of clinical mastitis, considering the variables: rumination (min/day), panting (min/day), feeding activity (min/day), daily milk production (kg/day), SCS (SCC Log2), average of mean flows (kg/min), average conductivity (mS/cm), average peak flow (kg/min), average production per milking (kg) and milking duration (s).

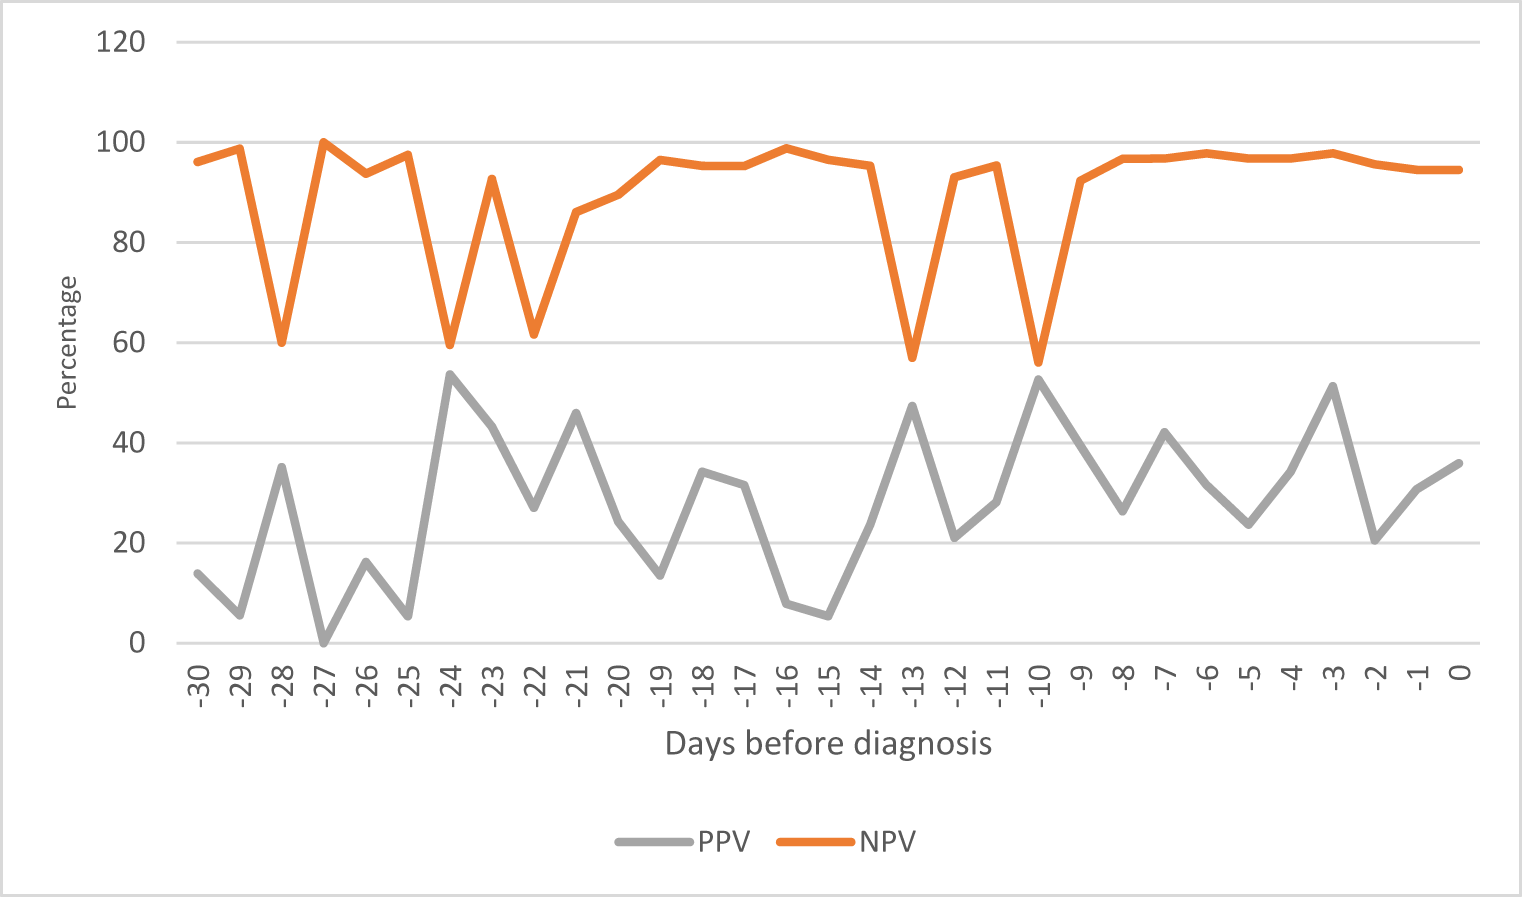
Percentage of positive predictive value (PPV) and negative predictive value (NPV) of the final model in the 30 days leading up to the diagnosis of clinical mastitis, considering the variables: rumination (min/day), panting (min/day), feeding activity (min/day), daily milk production (kg/day), SCS (SCC Log2), average of mean flows (kg/min), average conductivity (mS/cm), average peak flow (kg/min), average production per milking (kg) and milking duration (s).

The values of PPV averaged 28% over the 30 days, with fluctuations during the period. In the last 2 days before the diagnosis of mastitis, there was an increase, reaching 36%. On the other hand, NPV values remained higher, with an average of 89% over the 30 days. From day −9 to day 0, these values remained above 92% (Fig. 2).
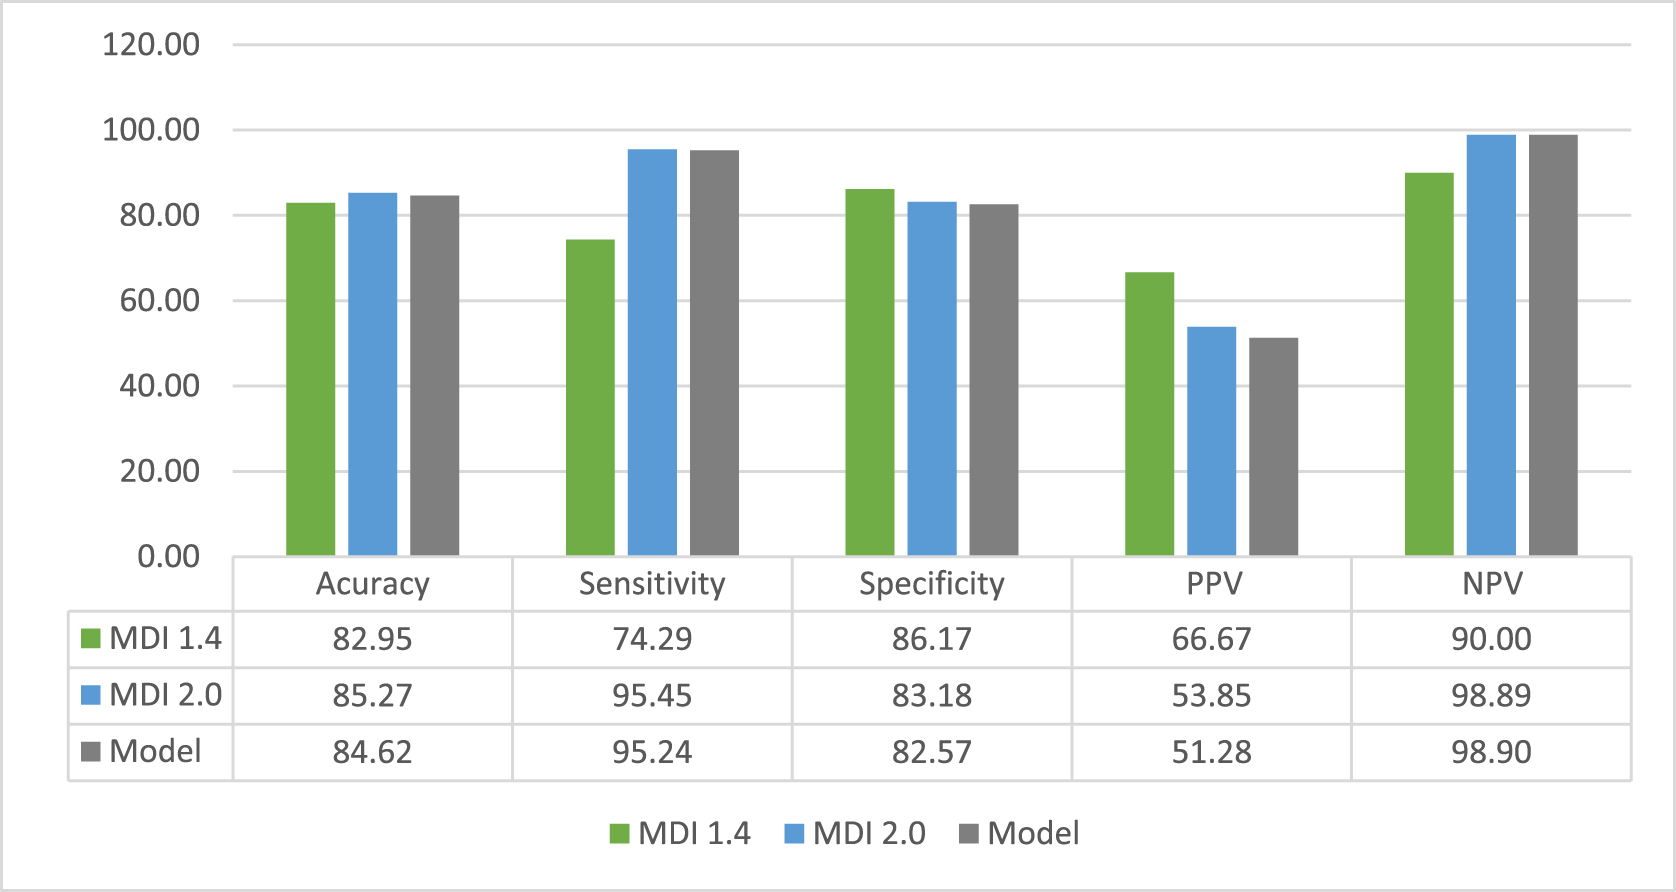
The results of the final model on day 0, compared to MDi, showed higher accuracy when considering the MDi 1.4 cut-off value. Considering the MDi 2.0 value, the results were very close. Regarding sensitivity and NPV, the values of MDi 2.0 and final model were similar. Using MDi 1.4, final model achieved a higher result. The specificity results were higher when the MDi value of 1.4 was used, followed by the MDi value of 2.0, and lastly, the final model of this study. This trend was also observed for the PPV values (Fig. 3).
Percentage of accuracy, positive predictive value (PPV) and negative predictive value (NPV), sensitivity and specificity of the final model, comparing MDi values, on day 0.

Discussion
The final model demonstrated stability in the prediction values calculated from as early as 9 days prior to mastitis diagnosis. This outcome extends the prediction lead time compared to previous studies (Khatun et al., Reference Khatun, Thomson, Kerrisk, Lyons, Clark and Molfino2018; Pakrashi et al., Reference Pakrashi, Ryan, Guéret, Perry, Corcoran, Keane and Mac Namee2023), highlighting the potential of using sensor data for the early detection of mastitis.
The significant variables included in the final model are consistent with those reported in other studies on the early detection of mastitis (Pakrashi et al., Reference Pakrashi, Ryan, Guéret, Perry, Corcoran, Keane and Mac Namee2023). Additionally, parameters such as average flow rates (kg/min), peak flow rates (kg/min) and milking duration (s), selected for their correlation with mastitis, are consistent with studies by Khatun et al. (Reference Khatun, Thomson, Kerrisk, Lyons, Clark and Molfino2018) and Penry et al. (Reference Penry, Crump, Ruegg and Reinemann2017). Similarly, Inzaghi et al. (Reference Inzaghi, Zucali, Thompson, Penry and Reinemann2021) used milk flow parameters (kg/min) and peak flow (kg/min) to assess changes in cows with mastitis. However, they found that the average milk flow rate changed only 1 day before the cow was identified with mastitis.
EC (mS/cm), which is directly related to cellular damage in the mammary gland caused by bacterial invasion, also proved to be a reliable indicator, as demonstrated by Zhao and Lacasse (Reference Zhao and Lacasse2008). Rutten et al. (Reference Rutten, Velthuis, Steeneveld and Hogeveen2013) found that EC was the most widely used sensor technique for detecting mastitis. Furthermore, behavioural changes such as rumination, panting and feeding activity, monitored through collars, have been effective in mastitis diagnostic models due to their association with the condition (Fitzpatrick et al., Reference Fitzpatrick, Chapinal, Petersson-Wolfe, DeVries, Kelton, Duffield and Leslie2013). The validity of these behavioural data was corroborated by Lovatti et al. (Reference Lovatti, Dijkinga, Aires, Garrido, Costa and Daros2024), who found that cows with mastitis show increased standing time compared to healthy cows, consistent with Medrano-Galarza et al.’s (Reference Medrano-Galarza, Gibbons, Wagner, de and Rushen2012) findings on increased feeding activity in cows with moderate to severe mastitis due to inflammatory discomfort.
In the development of the final model, certain parameters were not included: DIM, lactation number (parity), kick-offs (yes or no), presence of blood (ppm) and MDi. These parameters were excluded either due to their lack of significance or because they were redundant, as in the case of MDi, which is calculated from other parameters used individually in the final model. This exclusion of parameters is consistent with the findings of Khatun et al. (Reference Khatun, Thomson, Kerrisk, Lyons, Clark and Molfino2018), who also did not include peak milk flow rate (kg/min), kick-offs (yes or no) in each milking session, lactation number, DIM (days), presence of blood in the milk (yes or no) and MDi in their final model.
Comparing our study with that of Fan et al. (Reference Fan, Watters, Nydam, Virkler, Wieland and Reed2023), who developed a decision tree model for clinical mastitis using current and recent milking data, it is noted that while they achieved 95% specificity and 82% sensitivity with a 1-day warning, our model, with a 9-day advance notice, showed a specificity of 77.5% and a sensitivity of 77.3%. This longer warning time allows for more effective interventions, even though there is a decrease in specificity and sensitivity.
Khatun et al. (Reference Khatun, Thomson, Kerrisk, Lyons, Clark and Molfino2018) managed to predict mastitis with a lead time of 1–3 days, achieving 90% sensitivity, 91% specificity and 96% accuracy by using six specific variables related to behaviour and milk production. In comparison, our research, although showing lower sensitivity and specificity values, provides a 9-day warning, which could be more useful for long-term preventive strategies. Kamphuis et al. (Reference Kamphuis, Mollenhorst, Feelders, Pietersma and Hogeveen2010) and Khatun et al. (Reference Khatun, Thomson, Kerrisk, Lyons, Clark and Molfino2018) prioritized accuracy within shorter time windows, whereas our goal was to extend the detection window.
Previous studies aimed to develop models with high sensitivity and specificity values, but meeting the ISO 20966:2007 standard (ISO 20966, 2007) remains a challenge due to the multifactorial and complex nature of mastitis-related changes (Petrovski et al., Reference Petrovski, Trajcev and Buneski2006; Kamphuis et al., Reference Kamphuis, Sherlock, Jago, Mein and Hogeveen2008; Schwarz et al., Reference Schwarz, Diesterbeck, Failing, König, Brügemann, Zschöck, Wolter and Czerny2010; Medrano-Galarza et al., Reference Medrano-Galarza, Gibbons, Wagner, de and Rushen2012; Khatun et al., Reference Khatun, Thomson, Kerrisk, Lyons, Clark and Molfino2018; Fan et al., Reference Fan, Watters, Nydam, Virkler, Wieland and Reed2023). The ISO 20966:2007 standard (ISO 20966, 2007) standard requires sensitivity greater than 80% and specificity above 99%, goals that many studies, including ours, find challenging to achieve due to the inherent complexity of mastitis. Our model partially met these criteria, aiming for advance warning time and identification accuracy. Hogeveen et al. (Reference Hogeveen, Klaas, Dalen, Honig, Zecconi, Kelton and Sánchez Mainar2021) emphasize that mastitis detection systems should have high sensitivity for effective early detection.
The average specificity of 78.7% observed in our study, although below the ISO 20966:2007 standard (ISO 20966, 2007) requirement, reflects the challenges of avoiding false positives in an early detection system. False positives can reduce producers’ confidence in monitoring systems (Steeneveld et al., Reference Steeneveld, Gaag Lc, Barkema and Hogeveen2010). However, our high NPV of 95.9% highlights the model’s effectiveness in correctly identifying healthy cows, aligning with Barkema et al. (Reference Barkema, Schukken, Lam, Beiboer, Benedictus and Brand2008), who suggest that a high NPV is crucial for minimizing unnecessary treatments and production losses.
The PPV of 33.5% over 9 days, lower compared to other models, reflects our lower specificity. As noted by Akobeng (Reference Akobeng2007), NPV and PPV are influenced by the prevalence of the condition in the studied population, while sensitivity and specificity are inherent to the test. The low prevalence of mastitis in dairy herds, with an average of 8.6% in our study, contributes to these values. Thus, our model prioritizes the accurate identification of healthy cows, reducing the risk of unnecessary treatments and promoting a more responsible use of antibiotics (Hovinen and Pyörälä, Reference Hovinen and Pyörälä2011; Naranjo-Lucena and Slowey, Reference Naranjo-Lucena and Slowey2023).
The integration of easily collectable parameters into mastitis prediction models is essential to align with the objective of AMS to minimize human intervention and labour. Hogeveen et al. (Reference Hogeveen, Kamphuis, Steeneveld and Mollenhorst2010) suggest that models incorporating multiple variables tend to exhibit higher accuracy compared to univariate models. Although longer advance warnings, such as the 9-day lead time presented in our study, offer advantages for implementing corrective and preventive actions, the choice of variables should consider the ease of automation.
Studies such as Pakrashi et al. (Reference Pakrashi, Ryan, Guéret, Perry, Corcoran, Keane and Mac Namee2023), which used a machine learning algorithm to predict subclinical mastitis with a 7-day advance notice, demonstrate that including parameters like milk composition and peak flow improves the model’s sensitivity and specificity. However, reliance on manual measurements, such as body weight and condition score, compromises automation. This aspect underscores the importance of selecting variables that can be automatically collected without manual intervention.
Our study confirms the effectiveness of using readily collectable variables, such as milk production, EC and behaviour monitored by collars, which are integrable into AMSs. The choice of parameters that facilitate automated collection not only ensures the efficient functionality of the model but also promotes acceptance by producers by reducing workload and increasing diagnostic reliability. Thus, the combination of sensors and the selection of variables should seek a balance between diagnostic accuracy and operational practicality, ensuring that AMSs meet their goals of efficiency and automation.
Among the AMS models available from manufacturers, the MDi from DeLaval is distinguished by its ease of data collection and accessibility for farmers. Given these characteristics, we conducted a comparison between the MDi and our final model. On day 0, the MDi 1.4 and 2.0 models demonstrated superior performance in terms of specificity and PPV compared to the final model of this study. Accuracy was higher when using MDi 1.4 as the cut-off value, and the results of MDi 2.0 were close to those of the final model in terms of sensitivity and NPV. However, the main advantage of our model lies in its ability to predict the occurrence of mastitis up to 9 days in advance, a capability that the MDi models do not achieve. This advance notice provides a crucial opportunity for preventive interventions and proactive management, reducing the adverse impacts of mastitis before the onset of clinical signs. Therefore, while the MDi models perform better at the point of immediate diagnosis, the model developed in this study offers a more effective preventive approach, which is essential for the early management of mastitis in dairy production systems.
Despite the advances achieved, our study has some limitations that must be considered. Firstly, the average specificity of 77.5% is below the requirements of the ISO 20966:2007 standard (ISO 20966, 2007), which may lead to a considerable number of false positives and, consequently, reduce producers’ confidence in early mastitis detection systems. Although our model has demonstrated a longer warning window of up to 9 days, its accuracy still does not fully meet the expected levels of sensitivity and specificity for clinical applications. Future research should focus on optimizing these parameters and incorporating new sensor technologies that can capture additional data automatically and non-invasively to improve the accuracy and reliability of mastitis predictive models.
Conclusion
The model demonstrated the ability to accurately predict clinical mastitis within 9 days, achieving an average accuracy of 79.2%, a sensitivity of 82.5%, a specificity of 78.7%, a PPV of 41.5% and an NPV of 92.2%. This predictive capability empowers farmers to identify at-risk cows early, enabling timely interventions.
Supplementary material
The supplementary material for this article can be found at https://doi.org/10.1017/S0022029925101337.