


1 Introduction
Besides being instrumental in the long-time storage of charged particles and thus allowing experimentalists unchallenged high-accuracy measurements of fundamental atomic and nuclear properties of matter and antimatter (Rauth et al. Reference Rauth, Ackermann, Blaum, Block, Chaudhuri, Di, Eliseev, Ferrer, Habs and Herfurth2008; DiSciacca et al. Reference DiSciacca, Marshall, Marable, Gabrielse, Ettenauer, Tardiff, Kalra, Fitzakerley, George and Hessels2013; Danielson et al. Reference Danielson, Dubin, Greaves and Surko2015), non-neutral plasmas confined in Penning and Penning–Malmberg traps (Malmberg & deGrassie Reference Malmberg and deGrassie1975) represent an excellent environment to study the collective properties of large particle samples (Dubin & O’Neil Reference Dubin and O’Neil1999). In this respect, typical experimental parameters satisfy conditions that guarantee significant simplifications and advantages in the observation and detection of trapped non-neutral plasmas, e.g. easy control and repeatability, as well as in their modelling, e.g. the opportunity to effectively decouple the axial and transverse dynamics by averaging over the high longitudinal bounce frequency makes it possible to describe the trapped plasma as a two-dimensional (2-D) system dominated by the fluid (Kelvin–Helmholtz) dynamics occurring over much longer time scales, as kinetic (cyclotron gyration) effects are important only at very small spatial scales.
Of special significance is the isomorphism between a non-neutral plasma and an ideal (inviscid and incompressible) 2-D fluid (Driscoll & Fine Reference Driscoll and Fine1990), as the measurement of the transverse density distribution of the plasma yields directly the fluid vorticity. It is therefore possible to observe the features of a turbulent fluid flow under the controlled conditions of Penning–Malmberg trap-based experiments, which have also been demonstrated to be well reproduced by means of 2-D particle-in-cell (PIC) simulations (Notte et al. Reference Notte, Peurrung, Fajans, Chu and Wurtele1992; Peurrung & Fajans Reference Peurrung and Fajans1993a ; Driscoll et al. Reference Driscoll, Schecter, Jin, Dubin, Fine and Cass1999; Schecter et al. Reference Schecter, Dubin, Fine and Driscoll1999; Amoretti et al. Reference Amoretti, Durkin, Fajans, Pozzoli and Romé2001; Lepreti et al. Reference Lepreti, Romé, Maero, Paroli, Pozzoli and Carbone2013), although 3-D effects may play an important role in some situations (Peurrung & Fajans Reference Peurrung and Fajans1993b ; Tsidulko, Pozzoli & Romé Reference Tsidulko, Pozzoli and Romé2005; Bettega et al. Reference Bettega, Cavaliere, Cavenago, Illiberi, Pozzoli and Romé2007a ; Gomberoff et al. Reference Gomberoff, Wurtele, Friedman, Grote and Vay2007).
Investigations on the forced turbulence in quasi-neutral laboratory and fusion plasmas or astrophysical plasmas are available in the literature (Sattin et al. Reference Sattin, Scarin, Agostini, Cavazzana, Serianni, Spolaore and Vianello2006; Chernyshov, Karelsy & Petrosyan Reference Chernyshov, Karelsy and Petrosyan2010; Perrone, Nigro & Veltri Reference Perrone, Nigro and Veltri2011; Toufen et al. Reference Toufen, Pereira, Guimaraes, Caldas and Gentle2014). Among the most striking results of both theoretical and experimental studies is the evidence of the universal behaviour of turbulence properties in both freely decaying and forced turbulence. On the contrary, most of the experimental and theoretical/numerical studies in non-neutral plasmas have either focused on the formation of coherent structures, possibly under the effects of electric field drives (Fajans, Backhaus & McCarthy Reference Fajans, Backhaus and McCarthy1999a ; Fajans, Gilson & Friedland Reference Fajans, Gilson and Friedland1999b ; Gomberoff et al. Reference Gomberoff, Higaki, Ito and Okamoto2016), or have dealt with the analysis of turbulent quantities in conditions of free evolution (Driscoll et al. Reference Driscoll, Schecter, Jin, Dubin, Fine and Cass1999; Romé & Lepreti Reference Romé and Lepreti2011). An analysis of turbulence in conditions of forced evolution has been seldom considered, with few recent exceptions (Hurst et al. Reference Hurst, Danielson, Dubin and Surko2016; Romé, Chen & Maero Reference Romé, Chen and Maero2017). And yet both weak perturbations and strong radio frequency (RF) drives are routinely used in the manipulation of non-neutral plasmas and motivate the ongoing interest in further investigating both old and new excitation procedures and understanding the associated particle transport phenomena (Huang et al. Reference Huang, Anderegg, Hollmann, Driscoll and O’Neil1997; Danielson, Weber & Surko Reference Danielson, Weber and Surko2006; Bettega et al. Reference Bettega, Paroli, Pozzoli and Romé2009a ; Paroli et al. Reference Paroli, De Luca, Maero, Pozzoli and Romé2010b ; Maero et al. Reference Maero, Paroli, Pozzoli and Romé2011; Paroli et al. Reference Paroli, Maero, Pozzoli and Romé2014; Kabantsev & Driscoll Reference Kabantsev and Driscoll2015; Maero et al. Reference Maero, Chen, Pozzoli and Romé2015, Reference Maero, Paroli, Pozzoli and Romé2016). At the same time, Penning-trapped non-neutral plasmas offer advantages with respect to, e.g. fusion or astrophysical plasmas on the one hand, due to their relative simplicity, flexibility, accessibility and ease of detection, and to experiments on 2-D fluids on the other hand (Rivera, Vorobieff & Ecke Reference Rivera, Vorobieff and Ecke1998; Baroud et al. Reference Baroud, Plapp, She and Swinney2002) as they do not feature the latter’s non-idealities. These considerations suggest the potential interest in a turbulence analysis of the forced dynamics of a trapped non-neutral plasma, with the aim, among others, of testing the aforementioned similarities found in other plasma and fluid systems.
A preliminary study in this direction was undertaken by the authors in Romé et al. (Reference Romé, Chen and Maero2017), where the analysis of PIC simulations of annular-shaped electron plasmas subjected to quadrupole and rotating-dipole excitations were presented. The choice of this specific class of initial conditions is natural also as a benchmark test of the plasma evolution, since analytical results on the linear evolution of azimuthal plasma perturbations are available in this case (Davidson Reference Davidson1990). On the other hand, annular initial configurations are characterized by a low level of intermittency, as they typically lead to the formation of a small number of large vortices in a tenuous turbulent background. In the same way, the spatial structure of the electrostatic perturbations at the boundary was limited to the lowest multipoles (dipole and quadrupole). In this respect, the results presented in the previous investigation cannot be considered conclusive.
On the basis of the previous results, a wider range of case studies is investigated here. Concerning the aspect of initial conditions, spiral-like distributions have been considered in addition to the ring-like configurations. Spiral distributions are of experimental interest as they reflect the structure of typical thermocathode sources, and more importantly, they have been shown to produce during the free relaxation a more complex dynamics and a higher level of intermittency due to the formation and subsequent merger of multiple vortices (Romé, Chen & Maero Reference Romé, Chen and Maero2016). The class of electrostatic perturbations is also extended to higher multipoles to observe possible effects at the spatial scales of the involved unstable modes. Consequently, the spatial resolution of the PIC simulations is increased here to improve the quality of the spatial scale analysis.
The use of tailored analysis technique is decisive in order to acquire a detailed understanding of the fluid dynamics and final states. In particular, the density maps are used to calculate enstrophy maps, which are then wavelet processed so that the spatial scales involved in the turbulent process are identified during the entire evolution, without losing the information about their localization in the transverse plane. With respect to previous investigations (Romé et al. Reference Romé, Chen and Maero2017), in order to investigate complementary information the wavelet-decomposition technique is applied here to the energy map (calculated from the density and electrostatic potential maps) in addition to the enstrophy one, and a statistical analysis of the vorticity increments is also performed.
Previous works exploiting these multiresolution analysis techniques have shown the relation between the initial conditions and the time required to achieve a state of fully developed turbulence (Chen, Maero & Romé Reference Chen, Maero and Romé2015) as well as the dramatic influence played by the fluctuations, e.g. inhomogeneities (a feature of both experimental and numerical studies), in the initial density (vorticity) distributions in determining whether this final state can be reached or the relaxation is temporarily or indefinitely halted by the occurrence of intermittent phenomena such as localized vortices (Romé et al. Reference Romé, Chen and Maero2016). In this respect, these observations do not contradict at large the self-similarity laws of turbulence decay, and yet highlight their limitations when a detailed analysis of the dynamical structure of the flow is performed. The aim of the present work is hence the observation and identification of the features of turbulence associated with behaviours that are either general or specific to determined sets of initial and boundary conditions. Therefore the investigation of low-frequency (Kelvin–Helmholtz-scale) multipolar drives goes beyond the obvious experimental interest, and aims at gaining an understanding of the way energy is injected into the system by an external non-axisymmetric forcing, in terms of the spatial scales and the plasma modes involved, the localization of energy and enstrophy structures and the consequences of the interaction between the excitation scheme and the initial conditions with their inherent properties and fluctuations.
In the following, the case studies are first presented, accompanied by the numerical simulation and data analysis tools of choice (§ 2). Selected results are discussed in § 3 and the overall interpretation is summarized in the concluding § 4 together with a perspective on possible implications and upcoming investigations.
2 Numerical simulations
The evolution of the 2-D turbulence in an electron plasma is investigated using a Cartesian 2-D PIC code (Maero et al. Reference Maero, Romé, Lepreti and Cavenago2014), which integrates the drift-Poisson equations (Driscoll & Fine Reference Driscoll and Fine1990),
 $$\begin{eqnarray}\frac{\unicode[STIX]{x2202}n}{\unicode[STIX]{x2202}t}+\frac{1}{B}\boldsymbol{e}_{z}\times \unicode[STIX]{x1D735}\unicode[STIX]{x1D719}\boldsymbol{\cdot }\unicode[STIX]{x1D735}n=0,\quad \unicode[STIX]{x1D6FB}^{2}\unicode[STIX]{x1D719}=en/\unicode[STIX]{x1D716}_{0},\end{eqnarray}$$
where
 $n$
is the electron density,
 $\unicode[STIX]{x1D719}$
is the electrostatic potential,
 $\boldsymbol{B}=B\boldsymbol{e}_{z}$
is the static and uniform magnetic field,
 $-e$
is the electron charge and
 $\unicode[STIX]{x1D716}_{0}$
is the vacuum permittivity. Equations (2.1) are isomorphic to those of an ideal (incompressible and inviscid) 2-D fluid with uniform density (Levy Reference Levy1965), with vorticity
 $\unicode[STIX]{x1D701}=en/\unicode[STIX]{x1D716}_{0}B$
and streamfunction
 $\unicode[STIX]{x1D719}/B$
.
A static or time-dependent electrostatic potential
 $\unicode[STIX]{x1D719}_{w}(\unicode[STIX]{x1D703},t)$
, where
 $\unicode[STIX]{x1D703}$
is the azimuthal angle, is set on a circular boundary, approximated by a piecewise linear function following the sides of the grid cells. Two different initial conditions are considered. The reference case is a flat annular density (vorticity) distribution (Peurrung & Fajans Reference Peurrung and Fajans1993a
; Bettega, Pozzoli & Romé Reference Bettega, Pozzoli and Romé2009b
; Rodgers et al.
Reference Rodgers, Servidio, Matthaeus, Montgomery, Mitchell and Aziz2009)
 $$\begin{eqnarray}\displaystyle & n(r)=n_{0}[H(r-r_{-})-H(r-r_{+})], & \displaystyle\end{eqnarray}$$
where
 $H$
denotes the Heaviside step function, and
 $r_{-}$
and
 $r_{+}$
are the inner and outer radius of the annulus, respectively. The other initial condition corresponds to an Archimedean spiral distribution. Both kinds of density distribution are typically used in experiments on pure electron plasmas confined in Penning–Malmberg traps (Malmberg & deGrassie Reference Malmberg and deGrassie1975; Kriesel & Driscoll Reference Kriesel and Driscoll1998; Peurrung & Fajans Reference Peurrung and Fajans1993a
; Bettega et al.
Reference Bettega, Pozzoli and Romé2009b
; Rodgers et al.
Reference Rodgers, Servidio, Matthaeus, Montgomery, Mitchell and Aziz2009). The same density and the same total number of particles are considered in all simulations. In other words, the total area covered by the plasma is the same for all initial distributions and simulations. Highly uniform initial distributions are created using a Mersenne Twister random number generator (Matsumoto & Nishimura Reference Matsumoto and Nishimura1998).
The external forcing is produced by voltages applied to angular sectors of the confining cylindrical wall, as is customary in the experiments on non-neutral plasmas, where electrodes split into several electrically insulated azimuthal sectors are used to control and manipulate the plasma dynamics (Notte et al. Reference Notte, Peurrung, Fajans, Chu and Wurtele1992; Hollmann, Anderegg & Driscoll Reference Hollmann, Anderegg and Driscoll2000; Eggleston & Carrillo Reference Eggleston and Carrillo2002; Fujiwara et al. Reference Fujiwara, Amoretti, Bonomi, Bouchta, Bowe, Carraro, Cesar, Charlton, Doser and Filippini2004; Bettega et al. Reference Bettega, Cavaliere, Paroli, Cavenago, Pozzoli and Romé2007b , Reference Bettega, Cavaliere, Paroli, Pozzoli, Romé and Cavenago2008; Kawai et al. Reference Kawai, Kiwamoto, Soga and Aoki2007).
To be more specific, in the simulations reported here the conducting wall is supposed to be split into four
 $\unicode[STIX]{x03C0}/2$
-sectors or eight
 $\unicode[STIX]{x03C0}/4$
-sectors. Quadrupolar and octupolar excitations are considered, with
 $$\begin{eqnarray}\displaystyle & \displaystyle \unicode[STIX]{x1D719}_{w}^{quad}(\unicode[STIX]{x1D703},t)=V_{RF}\sin (2\unicode[STIX]{x03C0}\unicode[STIX]{x1D708}_{RF}t)\mathop{\sum }_{m=0}^{3}(-1)^{m}H(\unicode[STIX]{x1D703}-m\unicode[STIX]{x03C0}/2), & \displaystyle\end{eqnarray}$$
 $$\begin{eqnarray}\displaystyle & \displaystyle \unicode[STIX]{x1D719}_{w}^{octu}(\unicode[STIX]{x1D703},t)=V_{RF}\sin (2\unicode[STIX]{x03C0}\unicode[STIX]{x1D708}_{RF}t)\mathop{\sum }_{m=0}^{7}(-1)^{m}H(\unicode[STIX]{x1D703}-m\unicode[STIX]{x03C0}/4). & \displaystyle\end{eqnarray}$$
Simulation parameters consistent with typical experimental values (Maggiore et al.
Reference Maggiore, Cavenago, Comunian, Chirulotto, Galatà, De Lazzari, Porcellato, Roncolato, Stark and Caruso2014; Romé et al.
Reference Romé, Cavaliere, Cavenago, Chen and Maero2015) are chosen:
 $n_{0}=10^{7}~\text{cm}^{-3}$
,
 $R_{w}=2~\text{cm}$
and
 $B=1~\text{T}$
. The reference annular distribution is characterized by
 $r_{-}/R_{w}=0.3724$
,
 $r_{+}/R_{w}=0.46$
. The number of grid points is
 $N_{grid}^{2}=512^{2}$
and the number of macro-particles is
 $2.5\times 10^{6}$
. The final time of the simulations is 4 ms, and the time step is
 $10^{-7}~\text{s}$
.
Results relevant to two different values of the frequency of the RF drive applied on the circular boundary are reported in the following:
 $\unicode[STIX]{x1D708}_{RF}=1.05~\text{kHz}$
and
 $\unicode[STIX]{x1D708}_{RF}=5.145~\text{kHz}$
, which are close to the frequencies
 $\unicode[STIX]{x1D708}_{1}$
and
 $\unicode[STIX]{x1D708}_{2}$
of the
 $l=1$
and
 $=2$
diocotron modes for the reference annular density distribution, respectively (Davidson Reference Davidson1990). For all simulations, an amplitude of the RF drive
 $V_{RF}=0.5~\text{V}$
has been considered, to be compared with the maximum of the plasma potential
 $|V_{p}|\simeq 2.31V$
, evaluated for the reference annular density profile in the case of a grounded cylindrical wall.
The results of the PIC simulations and the wavelet statistical analysis about the turbulent features of the plasma evolution are presented in the next section.
3 Wavelet analysis
The density and electrostatic potential maps obtained from the PIC simulations are used to calculate enstrophy and energy maps. The enstrophy (Leith Reference Leith1968) corresponds to the second moment of the density
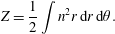 $$\begin{eqnarray}Z=\frac{1}{2}\int n^{2}r\,\text{d}r\,\text{d}\unicode[STIX]{x1D703}.\end{eqnarray}$$
Note that (2.1) contain no viscosity terms, but the PIC approach introduces an effective dissipation in the system due to coarse graining, leading in general to a decay of all density moments of order greater than unity, as observed both in experiments and numerical simulations (Schecter et al. Reference Schecter, Dubin, Fine and Driscoll1999; Rodgers et al. Reference Rodgers, Matthaeus, Mitchell and Montgomery2010; Romé et al. Reference Romé, Chen and Maero2016).
For the drift-Poisson model, the energy of the system is purely electrostatic and is computed as
 $$\begin{eqnarray}E=-e\int n\left(\frac{1}{2}\unicode[STIX]{x1D719}_{p}+\unicode[STIX]{x1D719}_{v}\right)r\,\text{d}r\,\text{d}\unicode[STIX]{x1D703},\end{eqnarray}$$
where
 $\unicode[STIX]{x1D719}_{p}(r,\unicode[STIX]{x1D703},t)$
is the plasma potential, satisfying the boundary condition
 $\unicode[STIX]{x1D719}_{p}(R_{w},\unicode[STIX]{x1D703},t)=0$
and
 $\unicode[STIX]{x1D719}_{v}(r,\unicode[STIX]{x1D703},t)$
denotes the vacuum potential due to the (asymmetric and time-dependent) perturbations
 $\unicode[STIX]{x1D719}_{w}(\unicode[STIX]{x1D703},t)$
applied to the azimuthal sectors of the confining cylindrical conductor. Note that the coupling of the RF drive with the plasma is expected to be effective mainly at the lowest-order azimuthal modes, since the amplitudes of the azimuthal Fourier expansion of
 $\unicode[STIX]{x1D719}_{v}$
scale as
 $r^{l}$
.
Electron density evolution for different RF drives and drive frequencies. (a) No external drive is present. (b,c) Correspond to
 $\unicode[STIX]{x1D708}_{RF}=1.05~\text{kHz}\simeq \unicode[STIX]{x1D708}_{1}$
for a quadrupole and octupole drive, respectively. (d,e) Relevant to
 $\unicode[STIX]{x1D708}_{RF}=5.145~\text{kHz}\simeq \unicode[STIX]{x1D708}_{2}$
, again for a quadrupole and octupole drive, respectively. The columns correspond to
 $t=0$
, 0.24, 1.0, 2.0 and 4.0 ms. The amplitude of the RF drive is
 $V_{RF}=0.50~\text{V}$
.

In figure 1(a–e), the electron density evolution starting from an initial annular distribution for quadrupole and octupole RF drives is compared to that for the case of no external drive. Two RF drive frequencies, namely
 $\unicode[STIX]{x1D708}_{1}=1.05~\text{kHz}$
and
 $\unicode[STIX]{x1D708}_{2}=5.145~\text{kHz}$
, are considered, corresponding to the frequencies of the lowest two diocotron modes. Without an RF drive, the electron annulus first undergoes a stage of unstable diocotron mode development, forming five well-defined vortex patches at approximately 0.24 ms. This initial evolution is in agreement with the fact that for the chosen annular configuration the diocotron modes from
 $l=2$
to
 $l=6$
are unstable, with
 $l=5$
having the largest growth rate (Davidson Reference Davidson1990). After the formation of this five-vortex ring, no vortex merger events take place. The system evolves in a rigidly rotating way, with the five-vortex configuration being maintained until the end of the simulation and the formation of a weakly turbulent background.
When the RF drive is applied, different plasma evolutions are obtained, depending on the type of perturbation. In the case of a quadrupole drive with
 $\unicode[STIX]{x1D708}_{RF}\simeq \unicode[STIX]{x1D708}_{1}$
, the shape and position of both vortex patches and filaments show only slight changes during the diocotron instability stage with respect to the no RF case (see figure 1
b). However, when
 $\unicode[STIX]{x1D708}_{RF}$
is increased to
 $\unicode[STIX]{x1D708}_{2}$
, five highly distorted vortex patches with an elongated configuration are formed (see figure 1
d). This elongation of the vortex configuration is indicative of the influence of a strong
 $l=2$
mode, in accordance with the azimuthal symmetry of the quadrupole drive. Likewise, the octupole drive seems to stimulate a competing or even overwhelming
 $l=4$
mode. In the case of an octupole drive with a frequency close to
 $\unicode[STIX]{x1D708}_{1}$
, a considerable development of the
 $l=4$
mode occurs together with the evolution of the most unstable
 $l=5$
mode (see figure 1
c). For a drive frequency close to
 $\unicode[STIX]{x1D708}_{2}$
, the
 $l=4$
mode becomes the fastest-growing mode, forming a quite symmetric four-vortex patch configuration (see figure 1
e). This effect of the azimuthal symmetry of the drive remains evident until the end of simulation. In particular, the turbulent backgrounds show elliptical and square shapes for the quadrupole and octupole drives, respectively (see figure 1
d,e).
After the development of the diocotron instability, vortex merger events could also occur under the influence of the RF drive. However, as it was pointed out in a previous study (Romé et al. Reference Romé, Chen and Maero2017), the vortex merger process induced by the RF drive depends on the details of the vorticity configuration at the end of the linear stage of the diocotron instability. As a result, different plasma evolutions such as a rapid collapse (see figure 1 c,d), a collapse with intermediate stages of rigid rotation (see figure 1 b) as well as no collapse at all (see figure 1 e) are all observed.
A suitable analysis tool for studying the intermittency features of turbulence, i.e. the presence of field (vorticity) activity localized in both physical and spectral space, is wavelet decomposition (Farge Reference Farge1992; Mallat Reference Mallat1999; Bettega et al. Reference Bettega, Pozzoli and Romé2009b ; Paroli et al. Reference Paroli, Bettega, Maero, Romé, Norgia, Pesatori and Svelto2010a ). A 2-D orthogonal wavelet-based multiresolution analysis is adopted here. At each time, the vorticity (density) distribution is decomposed into coefficients that contain coarse and fine details at increasing resolution. The 2-D vorticity field is expanded as
 $$\begin{eqnarray}\unicode[STIX]{x1D701}(x,y)=\overline{\unicode[STIX]{x1D701}}_{0,0,0}\unicode[STIX]{x1D719}_{0,0,0}(x,y)+\mathop{\sum }_{j=0}^{J-1}\mathop{\sum }_{i_{x}=0}^{2^{j}-1}\mathop{\sum }_{i_{y}=0}^{2^{j}-1}\mathop{\sum }_{\unicode[STIX]{x1D70E}=1}^{3}\tilde{\unicode[STIX]{x1D701}}_{j,i_{x},i_{y}}^{\unicode[STIX]{x1D70E}}\unicode[STIX]{x1D713}_{j,i_{x},i_{y}}^{\unicode[STIX]{x1D70E}}(x,y),\end{eqnarray}$$
i.e. as a linear combination of elementary well-localized functions
 $\unicode[STIX]{x1D713}_{j,i_{x},i_{y}}^{\unicode[STIX]{x1D70E}}(x,y)$
(in particular, a Symlet8 wavelet is adopted), with coefficients
 $\tilde{\unicode[STIX]{x1D701}}_{j,i_{x},i_{y}}^{\unicode[STIX]{x1D70E}}$
, where the sum is over the scales indexed by
 $j$
(with
 $J=\log _{2}N_{grid}$
), the positions indexed by
 $(i_{x},i_{y})$
and the directions (horizontal, vertical, diagonal) indexed by
 $\unicode[STIX]{x1D70E}$
. These wavelet coefficients are then separated into coherent and incoherent parts, using an adaptive, self-consistent threshold within an iterative method (Farge, Schneider & Kevlahan Reference Farge, Schneider and Kevlahan1999). In more detail, at the
 $i$
th step of the iteration, the wavelet coefficients are separated into two classes: those whose modulus is larger than a threshold
 $\unicode[STIX]{x1D716}_{T}^{(i)}$
, and those whose modulus is smaller. The coherent vorticity field
 $\unicode[STIX]{x1D701}_{{>}}$
is reconstructed from the strongest wavelet coefficients by an inverse wavelet transform, while the incoherent vorticity field
 $\unicode[STIX]{x1D701}_{{<}}$
is obtained by subtracting the coherent from the total vorticity. At the first iteration, the threshold value is computed as
 $\unicode[STIX]{x1D716}_{T}^{(1)}=(2\langle \unicode[STIX]{x1D701}^{2}\rangle \log N_{grid}^{2})^{1/2}$
, where
 $\langle \unicode[STIX]{x1D701}^{2}\rangle$
is the variance of the total signal. The variance of the incoherent part,
 $\langle \unicode[STIX]{x1D701}_{{<}}^{2}\rangle =1/N_{grid}^{2}\sum \unicode[STIX]{x1D701}_{{<}}^{2}(x,y)$
, is then used to compute the threshold
 $\unicode[STIX]{x1D716}_{T}^{(i+1)}=(2\langle \unicode[STIX]{x1D701}_{{<}}^{2}\rangle \log N_{grid}^{2})^{1/2}$
at the next iteration step (Farge et al.
Reference Farge, Schneider and Kevlahan1999).
The iteration method is modified in order to take into account the inhomogeneity of the incoherent part (Chen et al.
Reference Chen, Maero and Romé2015), in particular, the fact that the vorticity field is non-zero only in a small fraction of the total domain (i.e. of the grid cells), so that the threshold may fail to converge. Namely, at each iteration step the relative change of the threshold,
 $\unicode[STIX]{x0394}\hat{\unicode[STIX]{x1D716}}_{T}^{(i)}=[\unicode[STIX]{x1D716}_{T}^{(i+1)}-\unicode[STIX]{x1D716}_{T}^{(i)}]/\unicode[STIX]{x1D716}_{T}^{(i)}$
, is considered. This relative change does not depend on the actual domain of definition of the signal, so that
 $|\unicode[STIX]{x0394}\hat{\unicode[STIX]{x1D716}}_{T}^{(i_{0}+1)}-\unicode[STIX]{x0394}\hat{\unicode[STIX]{x1D716}}_{T}^{(i_{0})}|$
may converge to zero (i.e. it may become smaller than some chosen accuracy) at a certain step
 $i_{0}$
. The corresponding threshold
 $\unicode[STIX]{x1D716}_{T}^{(i_{0})}$
is then used to separate the coherent and incoherent parts of the flow (Chen et al.
Reference Chen, Maero and Romé2015).
In general, the coherent component of the flow can be reconstructed using only 1 %–2 % of the wavelet coefficients, but contains
 ${>}95$
% of the ‘energy of the signal’ (i.e. the enstrophy) and is able to track the main features of the dynamics of the system. The remaining small-amplitude coefficients represent the incoherent component, and take into account the noise and the possible presence of an incoherent background flow.
The total, coherent and incoherent enstrophy evolution is shown in figure 2(a–c). In agreement with the previous observations, the coherent part of the enstrophy remains larger for the two cases of no RF drive and octupole drive at
 $\unicode[STIX]{x1D708}_{RF}\simeq \unicode[STIX]{x1D708}_{2}$
, due to the surviving vortex crystal-like final states and the very weak turbulent backgrounds. When a fast collapse of the strongest vortices is produced, i.e. for the quadrupole drive at
 $\unicode[STIX]{x1D708}_{RF}\simeq \unicode[STIX]{x1D708}_{2}$
and the octupole drive at
 $\unicode[STIX]{x1D708}_{RF}\simeq \unicode[STIX]{x1D708}_{1}$
, a rapid decrease of the coherent part and an increase of the incoherent part corresponding to vortex merger processes are observed. For the case of a quadrupole drive at
 $\unicode[STIX]{x1D708}_{RF}\simeq \unicode[STIX]{x1D708}_{1}$
, the merger of the vortex patches is interrupted by a stage of rigid rotation, resulting in a slow-decaying phase of both the coherent and incoherent parts (corresponding approximately to the time interval 1–3 ms).
Comparison of the total (a), coherent (b) and incoherent (c) enstrophy evolution for a quadrupole drive at
 $\unicode[STIX]{x1D708}_{RF}=\unicode[STIX]{x1D708}_{1}=1.05~\text{kHz}$
(red solid), an octupole drive at
 $\unicode[STIX]{x1D708}_{RF}=\unicode[STIX]{x1D708}_{1}$
(blue solid), a quadrupole drive at
 $\unicode[STIX]{x1D708}_{RF}=\unicode[STIX]{x1D708}_{2}=5.145~\text{kHz}$
(red dash-dotted) and an octupole drive at
 $\unicode[STIX]{x1D708}_{RF}\simeq \unicode[STIX]{x1D708}_{2}$
(blue dash-dotted) for the data of figure 1. For reference, the corresponding enstrophy evolutions for the no RF case (black solid curves) are also plotted.

Comparison of coherent enstrophy spectrum evolution for no RF (a), quadrupole at
 $\unicode[STIX]{x1D708}_{1}$
(b), octupole at
 $\unicode[STIX]{x1D708}_{1}$
(c), quadrupole at
 $\unicode[STIX]{x1D708}_{2}$
(d) and octupole at
 $\unicode[STIX]{x1D708}_{2}$
(e) drives, for the data of figure 1.

The evolution of the coherent enstrophy spectra is shown in figure 3(a–e). The maximum wavenumber of the spectrum corresponds to the inverse of the minimum spatial scale of the wavelet functions. In turn, the latter is twice the length of a grid cell. In each successive decomposition level the spatial scale of the wavelet functions is increased by a factor of two and the wavenumber
 $k$
is accordingly reduced by the same factor. For the grid adopted in the PIC simulations, the maximum level of wavelet decomposition is
 $(\log _{2}N_{grid}-1)=8$
.
Due to the transfer of enstrophy into components of both large (central vortex) and small (vortex filaments) spatial scales, bifurcation structures (Chen et al.
Reference Chen, Maero and Romé2015) are observed for the cases with substantial vortex merger events (see figure 3
b–d). No bifurcation structures are present in both the no RF case and the case of octupole drive at
 $\unicode[STIX]{x1D708}_{2}$
, because of the absence of major vortex merger events. In the case of the quadrupole drive at
 $\unicode[STIX]{x1D708}_{1}$
(see figure 3
b), the rigid-rotation phase lasts for a relatively long time interval and vortex merger processes are still going on at the end of simulation. Therefore, the bifurcation structure also appears much later than the other two cases and the upper branch has still not completely disappeared at 4 ms.
Comparison of electrostatic energy spectrum evolution for no RF (a), quadrupole at
 $\unicode[STIX]{x1D708}_{1}$
(b), octupole at
 $\unicode[STIX]{x1D708}_{1}$
(c), quadrupole at
 $\unicode[STIX]{x1D708}_{2}$
(d) and octupole at
 $\unicode[STIX]{x1D708}_{2}$
(e) drives, for the data of figure 1.

A fast Fourier transform analysis of the time variation of the electrostatic energy (not shown here) confirms that the electrostatic perturbation applied on the circular boundary interacts with the lowest-order azimuthal modes. The evolution of the wavelet spectra of the electrostatic energy is shown in figure 4(a–e). The energy spectrum is calculated at each wavelet-decomposition level using the electron density reconstructed using only the wavelet coefficients at the same level, and including the contribution of the energy injected into the system by the external RF drive. The energy spectrum is normalized ‘instantaneously’, i.e. to its maximum value at the considered instant of time. Using this method, the energy spectra at different times are not directly comparable, but it is possible to recognize at each time the wavenumber for which the energy attains its maximum value and to reconstruct the time evolution of the energy partition among the various spatial scales. Due to the symmetry of both quadrupole and octupole drives, the RF drive is expected to have a negligible effect on the motion of the charge centre for the annular distribution case. This is confirmed by the energy spectra shown in figure 4. In particular, no periodic variations are observed in the spectra.
The same as in figure 1 for an initial 3-turn spiral distribution.

The simulations and the analysis of enstrophy and energy evolutions have been repeated for a 3-turn spiral initial distribution. In figure 5(a–e), the corresponding density evolution is reported. Similarly to the previous case, the quadrupole drives have an observable effect during the diocotron instability stage, especially for the higher frequency
 $\unicode[STIX]{x1D708}_{2}$
. The elongation of the vortex configuration is clear at the end of diocotron instability stage, and the turbulent background also shows an elliptical shape. On the other hand, the octupole drives have negligible effect during the diocotron instability stage, resulting in a very similar distribution for both the vortex patches and the filaments. The effect of the drive is more evident during the later stage, leading to a square-shaped turbulent background at 4 ms. Apart from some details, all cases show a similar trend for the plasma evolution. The initial spiral undergoes a complex diocotron instability development, forming tens of small vortices at approximately 0.24 ms. During the time interval 0.24–1 ms, major vortex merger processes occur, which largely reduce the number of vortex patches and form a relatively strong turbulent background. Later on, vortex patches continue to merge gradually while they are rotating, and the turbulent background becomes more homogeneous.
The same as in figure 2 for an initial 3-turn spiral distribution.

The total, coherent and incoherent enstrophy evolution is shown in figure 6(a–c). In accordance with the previous observations, both the coherent and incoherent parts show almost the same time variations for all cases. In particular, the coherent parts decrease and the incoherent parts increase at nearly the same rates and to nearly the same values up to approximately 1 ms, in agreement with the common trend mentioned above. After that, both parts show free-decaying features. Unlike to the annular case discussed above, the vortex patches formed in the spiral case are characterized by much smaller spatial scales and thus contain less enstrophy. Therefore, the later vortex merger events have a much smaller effect on the enstrophy evolution.
The same as in figure 3 for an initial 3-turn spiral distribution.

The evolution of the coherent enstrophy spectra is shown in figure 7(a–e). Analogously to the enstrophy evolution, the spectra show similar features for all cases. As mentioned above, since the vortex patches formed at the end of diocotron instability stage are much smaller, the difference in spatial scale between the coherent and incoherent parts becomes less distinguishable. Therefore, the bifurcation structure during the 0.24–1 ms time interval looks more like a broadening of the contour ridge.
The same as in figure 4 for an initial 3-turn spiral distribution.

The evolution of the electrostatic energy spectra is shown in figure 8(a–e). Unlike to case of an annular configuration, the charge centre of the initial spiral distribution does not coincide with the trap axis, leading to an inherent
 $l=1$
mode. An analysis of the motion of the charge centre (not shown here) confirms that the plasma is rotating around the trap axis at a frequency of approximately 1 kHz. The motion of the charge centre also causes regular variations observed in the energy spectra. The time interval between the maximum values at both large or small scales is approximately 1 ms, in agreement with the plasma bulk rotation period. Furthermore, this time interval is not affected by the RF drives, confirming the negligible effect of symmetric drives on the motion of the charge centre.
Information about intermittency phenomena and the presence of coherent structures in the evolution of turbulence may be inferred from the statistics of field increments across different scale separations. Here, the spatial increments
 $\unicode[STIX]{x0394}\unicode[STIX]{x1D701}_{l}^{(x)}(x,y,t)$
and
 $\unicode[STIX]{x0394}\unicode[STIX]{x1D701}_{l}^{(y)}(x,y,t)$
of the vorticity in both
 $x$
and
 $y$
directions are considered,
 $$\begin{eqnarray}\left.\begin{array}{@{}c@{}}\unicode[STIX]{x0394}\unicode[STIX]{x1D701}_{l}^{(x)}(x,y,t)=\unicode[STIX]{x1D701}(x+l,y,t)-\unicode[STIX]{x1D701}(x,y,t),\\ \unicode[STIX]{x0394}\unicode[STIX]{x1D701}_{l}^{(y)}(x,y,t)=\unicode[STIX]{x1D701}(x,y+l,t)-\unicode[STIX]{x1D701}(x,y,t).\end{array}\right\}\end{eqnarray}$$
One of the basic signatures of intermittency is the change of the shape of the probability distribution function (PDF) of the field increments with the scale
 $l$
. In order to compare the PDFs at different scales in an effective way, normalized increments are used. These are defined as
 $$\begin{eqnarray}\unicode[STIX]{x0394}\unicode[STIX]{x1D701}_{l,st}=\frac{\unicode[STIX]{x0394}\unicode[STIX]{x1D701}_{l}-\langle \unicode[STIX]{x0394}\unicode[STIX]{x1D701}_{l}\rangle }{\unicode[STIX]{x1D70E}_{\unicode[STIX]{x0394}\unicode[STIX]{x1D701}_{l}}},\end{eqnarray}$$
where
 $\langle \unicode[STIX]{x0394}\unicode[STIX]{x1D701}_{l}\rangle$
and
 $\unicode[STIX]{x1D70E}_{\unicode[STIX]{x0394}\unicode[STIX]{x1D701}_{l}}$
are the mean value and the standard deviation of
 $\unicode[STIX]{x0394}\unicode[STIX]{x1D701}_{l}$
, respectively. The PDFs of the wavelet coefficients at different spatial scales are equivalent to the PDFs of field increments calculated at different spatial separations (Yamada & Ohkitani Reference Yamada and Ohkitani1991a
,Reference Yamada and Ohkitani
b
; Carbone et al.
Reference Carbone, Regnoli, Martines and Antoni2000; Onorato, Camussi & Iuso Reference Onorato, Camussi and Iuso2000; Antoni et al.
Reference Antoni, Carbone, Martines, Regnoli, Serianni, Vianello and Veltri2001; Spada et al.
Reference Spada, Carbone, Cavazzana, Fattorini, Regnoli, Vianello, Antoni, Martines, Serianni and Spolaore2001). However, using directly the wavelet coefficients may provide less information due to the use of a discrete wavelet transformation, and therefore the presence of only a limited number of increments and an increasingly reduced number of data points at larger increments. The PDFs are therefore calculated directly from the reconstructed vorticity distributions. Furthermore, the PDFs of the increments
 $\unicode[STIX]{x0394}\unicode[STIX]{x1D701}_{l,st}^{{>}}$
(coherent part) and
 $\unicode[STIX]{x0394}\unicode[STIX]{x1D701}_{l,st}^{{<}}$
(incoherent part) are calculated separately (Romé et al.
Reference Romé, Chen and Maero2016), in order to evaluate their contribution to the intermittency.
The PDFs of
 $\unicode[STIX]{x0394}\unicode[STIX]{x1D701}_{l,st}^{{>}}$
for the data shown in figure 1 at the end of simulations (
 $t=4~\text{ms}$
) are shown in figure 9(a–c). In particular, three different values of
 $l$
are considered, namely
 $l=1.25$
(a), 0.625 (b) and 0.125 cm (c), and the different drives are represented by the same line styles as those in figure 2. For comparison, the corresponding PDFs for the no RF case as well as the normalized Gaussian distribution with zero mean and unitary standard deviation are also plotted.
The change of the shape of PDF for each case from large to small scales (from a to c) is evident. Deviations from the Gaussian distribution, especially at large absolute values of
 $\unicode[STIX]{x0394}\unicode[STIX]{x1D701}_{l,st}^{{>}}$
, increase as
 $l$
decreases. This feature indicates the existence of coherent structures and hence intermittency in the flow, in agreement with the vorticity evolution reported above.
Probability distribution functions (PDFs) of the normalized vorticity increments
 $\unicode[STIX]{x0394}\unicode[STIX]{x1D701}_{l,st}^{{>}}$
for the coherent part of the flow for the annulus case at
 $t=4~\text{ms}$
and for
 $l=1.25$
(a), 0.625 (b) and 0.125 cm (c). For comparison, the PDFs for a quadrupole drive at
 $\unicode[STIX]{x1D708}_{RF}=\unicode[STIX]{x1D708}_{1}=1.05~\text{kHz}$
(red solid line), an octupole drive at
 $\unicode[STIX]{x1D708}_{RF}=\unicode[STIX]{x1D708}_{1}$
(blue solid line), a quadrupole drive at
 $\unicode[STIX]{x1D708}_{RF}=\unicode[STIX]{x1D708}_{2}=5.145~\text{kHz}$
(red dashed-dotted line) and an octupole drive at
 $\unicode[STIX]{x1D708}_{RF}\simeq \unicode[STIX]{x1D708}_{2}$
(blue dash-dotted line) are plotted. For reference, the corresponding PDFs for the no RF case (black solid lines) as well as the normalized Gaussian distribution with zero mean and unitary standard deviation (black dashed lines) are also shown.

In addition, the PDF for the octupole drive at
 $\unicode[STIX]{x1D708}_{RF}\simeq \unicode[STIX]{x1D708}_{2}$
(blue dash-dotted lines) is quite similar to that for the no RF case (black solid lines). Both of them have very strong and sharp ‘shoulder bumps’ which shift outwards as
 $l$
decreases and maintain their identities very well. This is due to the fact that in both cases a vortex crystal-like final state is reached in which the major fraction of the enstrophy is contained in the surviving vortices and the turbulent background is weak. On the contrary, the ‘shoulder bumps’ of the PDFs for the other three cases are relatively weak and broad at large
 $l$
and are gradually smeared out as they shift outwards, since there is only one collapsed vortex in their final states and a turbulent background is much more strongly developed. In figure 10(a–c), the same analysis for an initial 3-turn spiral case is reported. Similarly to the annulus case, all the PDFs vary as
 $l$
changes from large to small scales, indicating the occurrence of intermittency and the existence of coherent structures. Furthermore, for this spiral case all PDFs are very similar, regardless of the applied RF drives, as observed also from the time evolution of the corresponding enstrophies (see figure 6). This similarity of the PDFs suggests that the intermittency levels for these cases are approximately the same, despite some differences in the time evolution caused by the different external forces. On the other hand, the PDFs of
 $\unicode[STIX]{x0394}\unicode[STIX]{x1D701}_{l,st}^{{<}}$
for all cases, i.e. both the annulus and the spiral ones with/without RF drives, do not change with respect to
 $l$
(not shown here), indicating that the incoherent part of the flow is indeed always turbulent-like.
The same as in figure 9 for an initial 3-turn spiral case.

4 Conclusions
The formation and evolution of coherent structures, as well as the manipulation and control of the trapped sample, have been subject of investigation for decades in the non-neutral plasmas community. The goal of this paper was a more specific study of the turbulence evolution in a non-neutral plasma under external forcing. In order to characterize turbulent properties of the flow, a wavelet-based multiresolution analysis of the enstrophy map already exploited in previous works (Chen et al. Reference Chen, Maero and Romé2015; Romé et al. Reference Romé, Chen and Maero2016) has been extended to the evaluation of the electrostatic energy during the system’s evolution.
The frequencies and the spatial structure of the applied electric drives considered in the simulations reflect common experimental choices. In the case of annular initial configurations, the dynamics is in general characterized by a low level of turbulence and is punctuated by time limited or indefinite persistence of coherent vortices. These features are marked in the enstrophy evolution by stages of stasis and abrupt changes or bifurcations in the spatial scales corresponding to maximum enstrophy content. The effect of the azimuthal symmetry of the drive remains evident until the end of simulation. For instance, the turbulent backgrounds show elliptical and square shapes for the quadrupole and octupole drives, respectively.
On the contrary, in the case of spiral-like initial distributions the dynamics is inherently more complicated and characterized by a stronger intermittency, with multiple vortices and frequent merger events during the evolution. Only seldom a state of fully developed turbulence is achieved at the end of the simulation time. In general, the time frequency and spatial scales associated with the peak of the energy spectrum along the whole evolution are those related to the
 $l=1$
diocotron mode that is unavoidably present since the beginning due to the asymmetry of the initial condition. This fundamental mode is therefore associated with the dominant contribution to the energy present and injected into the system. Despite some small differences in the time evolution caused by the different external forces, the intermittency levels for the considered regime of forcings and the range of frequencies corresponding to the low-order diocotron modes are approximately the same. In addition, the analysis of several runs for each set of drive amplitude, frequency and multipolar drive (not reported explicitly to avoid the exposure of a lengthy series of diagrams in the paper) shows that different final states (e.g. number of vortices) can be reached irrespective of the type of drive. The effect of the drives is therefore mediated by the strong influence of the fluctuation of the initial conditions, which, as already shown in the case of free-decaying turbulence (Chen et al.
Reference Chen, Maero and Romé2015; Romé et al.
Reference Romé, Chen and Maero2016), dramatically affects the evolution towards multiple-vortex intermediate or final states.
In perspective, a further confirmation or a disproof of the general trends observed here, and in particular the existence of features common both to free and forced turbulence conditions, may be obtained from, e.g. the analysis of numerical results relevant to higher-frequency and/or higher-amplitude drives, or to the presence of noise or dissipation phenomena. More definitive results might be obtained from a disentanglement of the effects of initial density fluctuations. The possibility of experimental tests is also very appealing.
Acknowledgements
This work is partially supported by NSFC (no. 11505172) and by the INFN Group V within the ‘BEAM4FUSION’ project.



