INTRODUCTION
The Carpathian Basin is particularly rich in aeolian landscapes, such as loess plateaus and dune fields. Dune fields were predominantly formed from fluvial deposits of the Danube, the Tisza, and other rivers during the dry and cold climatic phases of the Pleistocene (Borsy, Reference Borsy, Rachocki and Church1990). When vegetation was scarce, winds could attack and erode former alluvial surfaces, alluvial fans, and terraces, which were abandoned due to avulsion or incision of major rivers (Bukurov, Reference Bukurov1982; Gábris, Reference Gábris2003; Mezősi, Reference Mezősi2017).
Other dune fields of the region, especially in Hungary, have been extensively studied in the past decades using various geomorphological and dating methods (Lóki, Reference Lóki1981; Borsy, Reference Borsy1991; Kiss et al., Reference Kiss, Sipos and Kovács2009, Reference Kiss, Györgyövics and Sipos2012a; Buró et al., Reference Buró, Sipos, Lóki, Andrási, Félegyházi and Négyesi2016; Györgyövics and Kiss, Reference Györgyövics and Kiss2016). The main phase of aeolian activity has been dated to the last glacial maximum (LGM) (Borsy, Reference Borsy1991) when, due to the lack of vegetation, dune forms could develop anywhere where sand was available. However, several pieces of evidence exist for renewed dune formation during the last glacial termination or late glacial (ca. 19–11 ka; Shakun and Carlson, Reference Shakun and Carlson2010) and in the Holocene (Nyári et al., Reference Nyári, Kiss and Sipos2007; Kiss et al., Reference Kiss, Sipos, Mauz and Mezősi2012b; Sipos et al., Reference Sipos, Marković, Tóth, Gavrilov, Balla, Kiss, Urdea and Mészáros2016). This phase of climate-driven aeolian activity lasted the longest on the driest, central and eastern parts of the Carpathian Basin (Mezősi, Reference Mezősi2017).
There is minimal information concerning blown sand movement in the Deliblato Sands in Serbia, an area termed the ‘Desert of Europe’ or ‘European Sahara,’ because it is characterized by large, fixed dune forms that were bare in the past few centuries, and provided a desert-like look to the landscape until the beginning of the 20th century (Cholnoky, Reference Cholnoky1902). The development of the dune field has been investigated by several researchers in the past, and primarily based on geomorphic observations, various hypotheses and assumptions were made concerning the origin and the time of its formation (Cholnoky, Reference Cholnoky1910, Reference Cholnoky1940; Menković, Reference Menković2013).
Based on the model of Bukurov (Reference Bukurov1954), development of the area is strongly related to Pleistocene climatic oscillations; namely, the sand was accumulated in the area by the Danube River in interglacials, and during dry glacials, repeated aeolian activity could have reworked the fluvial deposits. As the sand overlies loess at some locations, other authors placed the major deflation phase in the Holocene, subsequent to fluvial deposition and loess formation (Marković-Marjanovič, Reference Marković-Marjanovič1950). More recently, Menković (Reference Menković2013) concluded that the sand sheet was formed during the last glacial termination and the Preboreal (10.3–9 ka) and Boreal (9–8 ka) periods of the Early Holocene (Greenlandian stage), and, after an Atlantic period (8–5 ka) stabilization in the Mid Holocene (Northgrippian stage), the present-day dunes developed in the Subboreal period (5–2.5 ka) and later (Meghalayan stage). Nevertheless, it is essential to underline that no numeric age data were available when these hypotheses were formulated.
The clarification of the development of the dune field is important not only from a geomorphological aspect but since the dune forms record the direction of contemporary prevailing winds, dating of their formation can be the basis of reconstructing paleowind directions and temporal changes in regional atmospheric circulation patterns (Hesse, Reference Hesse2016; Gavrilov et al., Reference Gavrilov, Marković, Schaetzl, Tošić, Zeeden, Obreht and Sipos2018). Moreover, as aeolian landscapes are very sensitive, sand mobilization is then a good indicator of climatic and environmental change (e.g., Muhs and Holliday, Reference Muhs and Holliday1995; Tolksdorf and Kaiser, Reference Tolksdorf and Kaiser2012; Telfer and Hesse, Reference Telfer and Hesse2013) and increased human impact (e.g., Kiss et al., Reference Kiss, Sipos and Kovács2009, Reference Kiss, Sipos, Mauz and Mezősi2012b; Hugenholtz et al., Reference Hugenholtz, Bender and Wolfe2010).
Consequently, the central aim of our research was to determine the periods of aeolian activity in the Deliblato Sands by providing the first numerical age data that can then be used for further reconstruction of the region's Quaternary environment.
REGIONAL SETTING
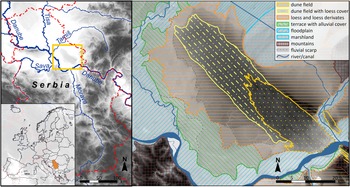
The Deliblato Sands, with an area of 800 km2, is the largest quasi-uniform dunefield in the Carpathian Basin, and it hosts some of the largest dunes known in the region. The oval-shaped dune field is bordered and eroded by the Danube in the SE, and it extends towards the NW to the floodplain of the Tamiš River (Fig. 1).
The location of the Deliblato Sands in Europe and the geomorphology of its surroundings. Small inset map on bottom left shows Serbia shaded in; square in larger map on left shows approximate study area; area inside square is shown in detail in map on right.

At present, the climate of northern Serbia and the study area itself is moderate continental, with cold winters and hot summers. The mean annual temperature is 11.1°C, and the mean annual precipitation is 606 mm (Gavrilov et al., Reference Gavrilov, Marković, Schaetzl, Tošić, Zeeden, Obreht and Sipos2018). If considering the De Martonne aridity index, the region's climate is semi-humid (Hrnjak et al., Reference Hrnjak, Lukić, Gavrilov, Marković, Unkašević and Tosić2014). Prevailing winds in the Deliblato Sands blow with the greatest annual frequency (129.2 days) from the SE quadrant (Gavrilov et al., Reference Gavrilov, Marković, Schaetzl, Tošić, Zeeden, Obreht and Sipos2018), corresponding to the direction of the Košava, a regional wind with a diurnal character, generated by a pressure difference between the Mediterranean Sea and continental areas in Southern Russia and Bulgaria. The Košava can appear at any season, is usually not accompanied by precipitation, and is strengthened because of orographic influences (Unkašević et al., Reference Unkašević, Tošić and Obradović2007). Based on recent studies, the Košava is the prevailing wind at present in this part of Serbia (Gavrilov et al., Reference Gavrilov, Marković, Schaetzl, Tošić, Zeeden, Obreht and Sipos2018), and presumably, it had a significant role in the past as well. Accordingly, both the form of the entire sand sheet and the dunes themselves are oriented in a SE–NW direction (Fig. 1, Fig. 2A).
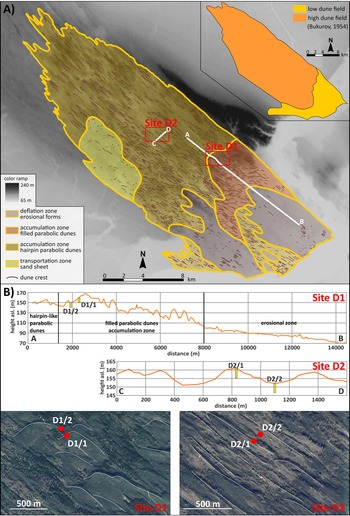
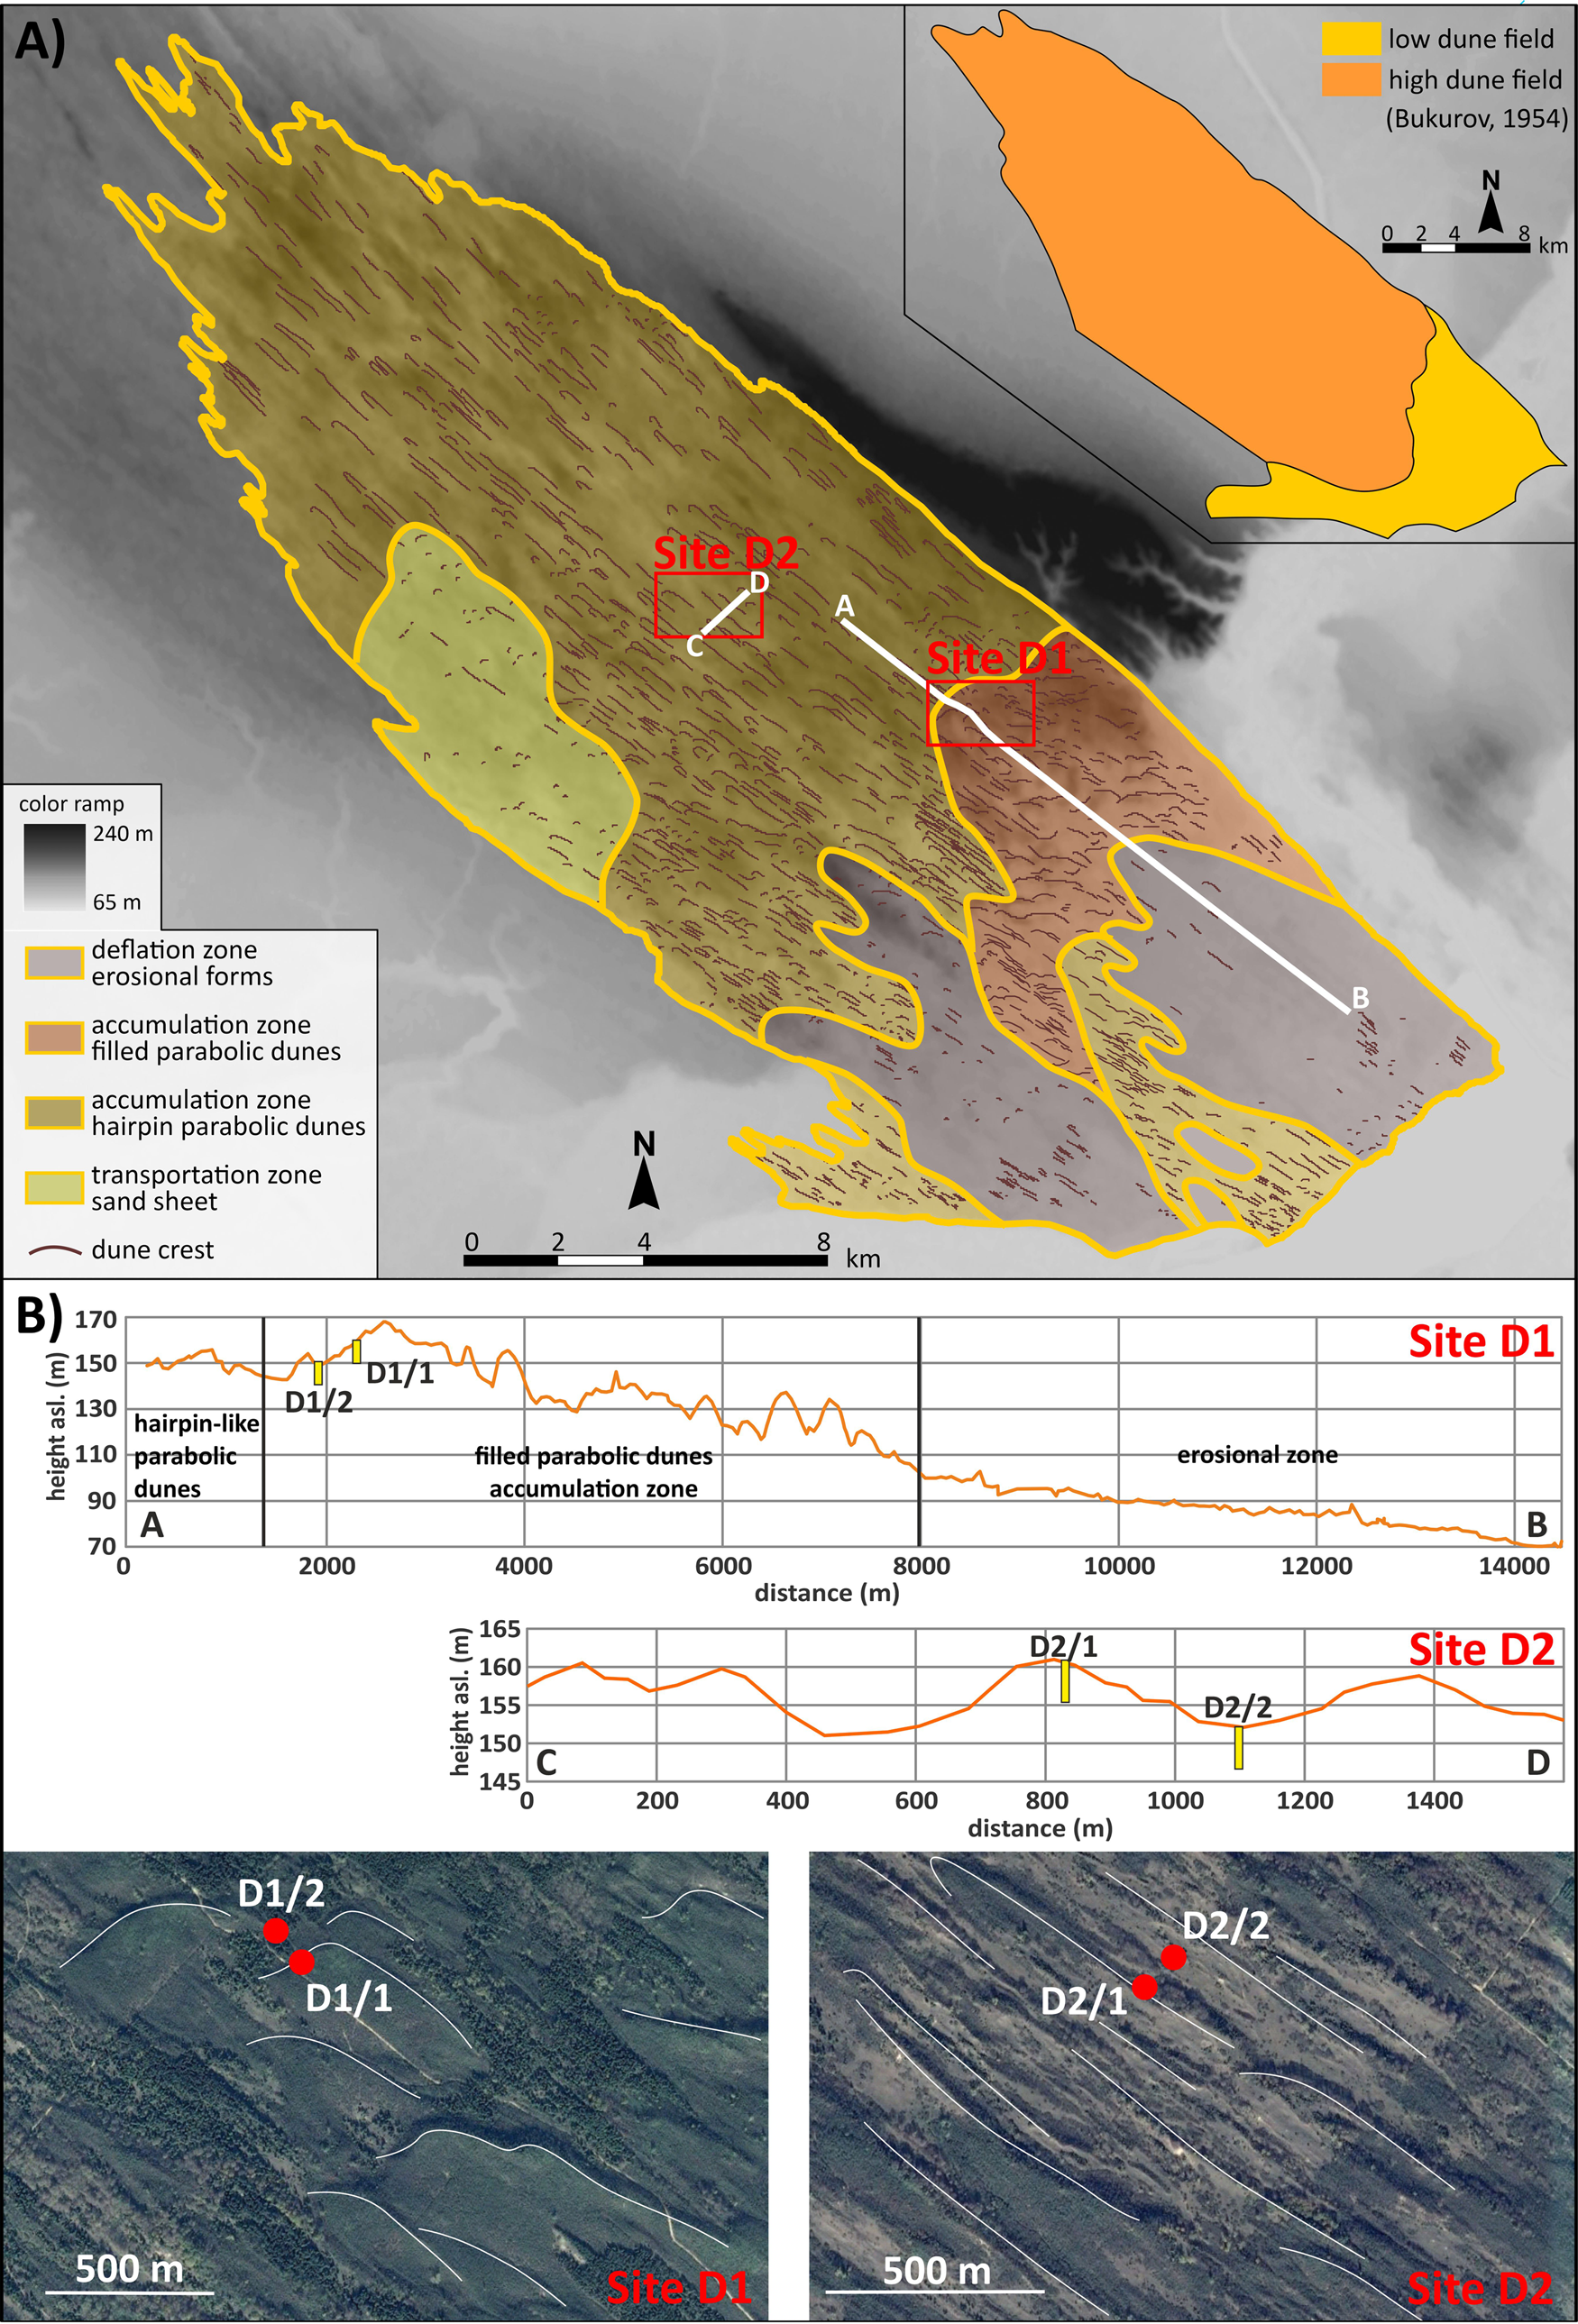
(A) The geomorphological zones of the Deliblato Sands (after Bukurov, Reference Bukurov1954) with geomorphological units reinterpreted based on dune mapping, location of sampling sites, and tracks of GPS surveys labeled A–B (Site D1) and C–D (Site D2). (B) Position of drilling points on the surveyed topographic profiles, and satellite image subsets showing where cores were taken.
The surface of the Deliblato Sands is composed of aeolian sand over an area of 350 km2; the rest is covered by loess and loessic sediments (Fig. 1). Accordingly, the Deliblato Sands can be divided into a typical sand dune area in the SE and a transitional zone with loess cover in the NW. Loess was deposited on previously developed sand dunes and leveled out topographic differences (Zeremski, Reference Zeremski1972; Fig. 1). At present, most of the area is forested; however, afforestation plans from the beginning of the nineteenth century showed that ~160 km2 of bare, vegetation-free sand was exposed to severe deflation (Bachofen, 1815 in Mátyus, Reference Mátyus1870), and stabilization of the blown sand took several decades (Roth, Reference Roth1916). Consequently, most researchers claimed that dune forms must be a few centuries old (Menković, Reference Menković2013).
Traditionally, the sand dune area of the Deliblato Sands has been separated into a so-called low (between 75 m asl and 135 m asl) and a high (up to 170 m asl) dune field (Bukurov, Reference Bukurov1954; Fig. 2A). The low dune field developed on the former alluvial plain of the Danube and ramps up towards the high dune field in the NW. According to Menković (Reference Menković2013), the low dune field is characterized by 5–10 m-high elongated dune forms, with a length of a hundred to several hundred meters. The higher general elevation of the high dune field is explained by its development over a loess plateau (Menković, Reference Menković2013). The area is comprised of dune forms with a relative height of 20–30 m and a length of up to a thousand meters.
METHODS
Mapping and sampling
Sites for sampling were selected based on 1) a digital elevation model (EU-DEM v11_E50N20), used for the identification of the main morphological units; 2) satellite images from Google Earth, used for mapping dune crests and locating different dune types; and 3) GPS profiles, taken in a SE–NW and a SW–NE direction to determine the relative height of dunes and to locate the exact sampling points (Fig. 2B). OSL sampling targeted the two major types of dunes identified in the accumulation zone of the dune field (Fig. 2B).
Two drillings were made at both sites, using either a hand drill with a drilling cylinder into which a 15-cm long, 5-cm diameter PVC tube could be fitted, or a RedHawk-type percussion drill. Samples were removed from the drilling head of the RedHawk drill under red LEDs in a black tent set up in the field. The first site was sampled on a large, filled, parabolic dune (a more detailed morphological description is provided later in this paper). One drilling was made on the slipface of the form (borehole D1/1; 44°54′03″N; 21°09′42″E) to determine the latest phases of dune formation, while the other was in the depression downwind of the dune (borehole D1/2; 44°54′05″N; 21°09′39″E) to get an idea on the timing of preceding aeolian events (Fig. 2). A somewhat similar strategy was followed in terms of the second site, but the first drilling was made on the crest of the form (borehole D2/1; 44°54′39″N; 21°05′03″E), and the second was made in an interdune depression (borehole D2/2; 44°54′41″N; 21°05′05″E) between two hairpin-like dune arms (Fig. 2). In both sites, boreholes were sampled for OSL dating at approximately every meter, taking into account changes in stratigraphy. Site one had 8-m-deep boreholes and site two had 5-m-deep boreholes. Cores were also described macroscopically, and thirteen OSL samples representing the major sedimentary units were selected for further analysis.
Luminescence Dating
Preparation of samples followed usual laboratory techniques (e.g., Mauz et al., Reference Mauz, Bode, Mainz, Blanchard, Hilger, Dikau and Zöller2002). All procedures were carried out in subdued yellow light provided by low-pressure sodium lamps. Selected samples were dried out, and the 90–150 μm fraction was separated out by dry sieving. Carbonate and organics were removed by repeated treatment in 10% HCl and 10% H2O2. Separation of the quartz fraction was made using heavy liquid flotation (LST Fastfloat). Finally, a 45-minute etching in 40% HF was performed to remove any remaining feldspar contamination and the outer layer of quartz grains.
The equivalent dose (De) of samples was determined on a Risø DA-20 TL/OSL-type luminescence reader equipped with a 90SR/90Y β-source and an EMI ET9107-type photomultiplier (Bøtter-Jensen et al., Reference Bøtter-Jensen, Thomsen and Jain2010). Stimulation was carried out using blue (470 ± 30 nm) LEDs set for 90% power release, while detection was made through a Hoya U-340 filter. Throughout the measurements, the single aliquot regeneration (SAR) protocol was applied (Murray and Wintle, Reference Murray and Wintle2003; Wintle and Murray, Reference Wintle and Murray2006). Prior to SAR tests, some of the samples were subjected to an LM-OSL analysis to resolve the components of the OSL signal and to determine the ratio of the fast component (Bulur, Reference Bulur1996; Jain et al., Reference Jain, Murray and Bøtter-Jensen2003; Singarayer and Bailey, Reference Singarayer and Bailey2003), that is usually low in Danube sediments (Bartyik et al., Reference Bartyik, Magyar, Filyó, Tóth, Blanka-Végi, Kiss and Marković2021). Subsequently, preheat and dose recovery tests were performed to identify the optimal measurement parameters and assess the reproducibility of measurements. The effect of applying an elevated temperature OSL treatment at the end of SAR cycles was also tested because its application on other Danube-related sediments caused a considerable decrease in measurement reproducibility as a matter of thermal transfer (Tóth et al., Reference Tóth, Sipos, Kiss and Bartyik2017). Additionally, the effect of aliquot size on De distribution was also tested.
During OSL measurements, optical stimulation was performed at 125°C (heating rate: 5°C/s) for 40 seconds. Standard rejection criteria were used to select aliquots that performed well during the SAR measurements (Murray and Wintle, Reference Murray and Wintle2003). Potential feldspar contamination of the quartz extracts was monitored by the IR/OSL depletion ratio, as proposed by Duller (Reference Duller2003). In the case of each sample, at least 24 aliquots were analyzed. The ratio of aliquots passing the rejection criteria was 90% on average when using a 6-mm mask size. Dose-response curves were fitted in each case using the sum of two saturating exponential functions: I(D) = I0 + A(1-exp(-D/D01)) + B(1-exp(-D/D02)).
Single-aliquot De values were plotted on abanico plots (Dietze et al., Reference Dietze, Kreutzer, Burow, Fuchs, Fischer and Schmidt2016) generated in the R luminescence package (Kreutzer et al., Reference Kreutzer, Schmidt, Fuchs, Dietze, Fischer and Fuchs2012). Sample De values were calculated using either the CAM or the MAM age model of Galbraith et al. (Reference Galbraith, Roberts, Laslett, Yoshida and Olley1999). A decision between the two was made using the single aliquot threshold values proposed by Arnold et al. (Reference Arnold, Bailey and Tucker2007), which are obtained based on the skewness (c), kurtosis (k), overdispersion (σ), and the coefficient of variation (CV) of dose distributions.
Environmental dose rate (D*) was determined using high-resolution, extended-range gamma-ray spectrometry (Canberra XtRa Coaxial Ge detector). Dry dose rates were calculated using the conversion factors of Liritzis et al. (Reference Liritzis, Stamoulis, Papachristodoulou and Ioannides2013). Attenuation factors for β dose rates were given after Brennan (Reference Brennan2003). Wet dose rates were assessed based on in-situ water contents (Aitken, Reference Aitken1985). The rate of cosmic radiation was determined by considering burial depth, and geographic location, following the equation of Prescott and Hutton (Reference Prescott and Hutton1994).
RESULTS
Morphological units and dune forms
In total, 1322 dune crests were mapped by thoroughly screening satellite images. Although this 2-D approach is not the most appropriate technique to survey dune forms, especially on areas under partial forest cover, by complementing the mapping with available low-resolution DEM and field observations, the major geomorphological units and dune types of the Deliblato Sands could be identified. Using these techniques, the traditional morphological map of the area was refined (Fig. 2B), and dune forms could be reclassified.
Accordingly, the low dune field of the Deliblato Sands can be separated morphologically into deflation and transportation zones (Fig. 2B). Deflation areas are characterized by blowouts, planar surfaces, and a low density of positive forms, being mostly blowout dunes and residual ridges. In the transportation zones, elongated positive forms can be identified, with maximum lengths of 100–200 m, and a height of 3-4 meters. Therefore, the SE quarter of Deliblato Sands can be interpreted as a potential source area for the northwesterly situated giant dunes located downwind.
The high dune field can also be separated into different zones based on the number and dimension of the mapped dunes (Fig. 2A). The easternmost area is interpreted as a high sand supply accumulation zone, with dunes up to a 20–25 m relative height. The crest of these dunes is slightly curved and their length is 0.5–1 km (Fig. 2). In some places, they resemble the transverse dunes of deserts, but they can instead be classified as filled parabolic dunes, indicating an abundant sand supply that can be easily explained by the proximity of a large sand source. The wind direction attributed to their formation is more southerly than the present direction of the southeasterly Košava (see Gavrilov et al., Reference Gavrilov, Marković, Schaetzl, Tošić, Zeeden, Obreht and Sipos2018).
Northwest of the previous zone, a lower sand supply accumulation zone that occupies the most extensive area on the dune field can be identified with a complex association of smaller, 5–10-m-high elongated dunes, blowout depressions, and residual ridges (Fig. 2A). The southwest part of this zone is characterized by many smaller blowout dunes that transform into parabolic dunes with elongated arms. Consequently, most longitudinal forms can be interpreted as left-behind wings of hairpin-like parabolas, indicating a moderate sand supply and considerable vegetation control during dune formation. The length of these parabolic dune arms is typically a few hundred meters, but in some places, they can reach a length of 1–1.5 km. Based on dune crests orientations, the wind direction during dune formation was 117 ± 6°, coinciding with the modern prevailing wind regime (Gavrilov et al., Reference Gavrilov, Marković, Schaetzl, Tošić, Zeeden, Obreht and Sipos2018). Finally, there is a zone dominated by sand transportation at the western part of the dune field with a low number of identifiable dune forms (Fig. 2A).
Luminescence properties
The luminescence performance of quartz extracts was first tested by applying a linearly modulated (LM) OSL measurement on one of the samples, using 2-mm aliquots. Although the selected sample was one with a considerable equivalent dose, due to its very low natural signal, components could not be entirely resolved. Therefore, the regeneration LM-OSL signal in response to ~20 Gy was analyzed in more detail (Supplemental Figure 1). In total, six components could be separated, including one fast, one medium, and four slow components. No ultrafast component was identified, and the dominance of the fast component in the initial part of the signal was overwhelming (Supplemental Figure 1). Thus, the signal properties of Deliblato quartz are adequate when the signal is strong enough, i.e., when the paleodose is high or large aliquots are used for the measurements.
Consequently, combined preheat and dose recovery tests were made using 6-mm aliquots. Recycling ratios were good up to 260°C, while recuperation usually showed a continuous increase, and from 280°C, it crossed the 5% rejection threshold (Supplemental Figure 2). Because of these results, and based on the findings of Tóth et al. (Reference Tóth, Sipos, Kiss and Bartyik2017), special attention was given to dose recovery ratios and the effect of 280°C cleanouts (hot bleach) at the end of the SAR cycles. Elevated temperature treatment improved recycling ratios to some extent, but decreased the reproducibility of measurements because dose recovery ratios showed a higher scatter and were farther from unity than in case of tests where hot bleach was not inserted (Supplemental Figure 2).
By applying a preheat and a cutheat temperature of 220°C and 160°C, respectively, dose recovery tests were extended to 24 aliquots per sample, again by including and excluding cleanouts at the end of SAR cycles (Supplemental Figure 3). The application of an elevated temperature treatment caused a significant underestimation of dose recovery ratios. Values were near the 0.9 threshold suggested by Murray and Wintle (Reference Murray and Wintle2003). Measurements without such a treatment produced mean results very close to unity (Supplemental Figure 3). Consequently, no elevated temperature cleanout was applied for subsequent tests and during the measurement of equivalent doses.
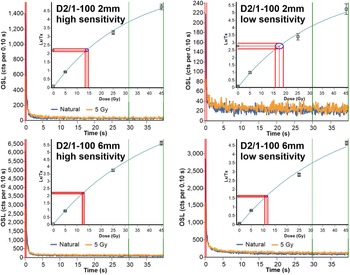
Continuous wave (CW) OSL decay curves, similarly to LM-OSL results, also indicated the moderate sensitivity of samples. By increasing aliquot size from 2 mm (~180 grains) to 6 mm (~1600 grains), signal intensity was considerably improved (Fig. 3). This way, the proportion of aliquots passing SAR rejection criteria increased to 90%.
Typical optically stimulated luminescence (OSL) decay curves and dose-response curves at 2-mm- and 6-mm aliquot size, representing both low and high sensitivity aliquots of the same sample D2/1-100.

Single-aliquot dose distributions
Although larger aliquot size meant better turnout rates in terms of the measurements, aliquot-to-aliquot scatter was also reduced, and information on the sedimentation history of grains might have been lost. This issue was important because proximity of the fluvial sediment source raised the matter of incomplete natural bleaching and potential age overestimation.
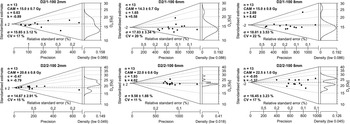
Because of the low luminescence sensitivity of samples, we assumed that 2-mm aliquots carry only a restricted number of luminescent grains, and are just appropriate to detect asymmetric sample De distributions indicating incomplete natural bleaching (Fig. 4). However, when comparing single aliquot De distributions measured from the same sample but using different aliquot sizes, we found that statistical parameters describing the width of the distribution (σ and CV) stayed similar throughout the test. In contrast, those describing the asymmetry and the tail of the curve (c and k) were increased by the presence of some high-residual outlying aliquots (Fig. 4). Therefore, we found that applying medium-sized (6-mm) aliquots would not lead to significant information loss in terms of De scatter.
Abanico plots (see Dietze et al., Reference Dietze, Kreutzer, Burow, Fuchs, Fischer and Schmidt2016) and statistical parameters of single aliquot De results (σ: overdispersion value, c: skewness, k: kurtosis), measured using different mask sizes. For 2-mm aliquots, 13 out of 24 aliquots passed single aliquot regeneration (SAR) criteria in both cases. Accordingly, the first 13 measurements (n) were plotted in the case of larger aliquots with a better turnout rate.

Concerning the De distribution of samples measured using 6-mm aliquots, statistical parameters showed a limited variation in most cases (Supplemental Table 1). If considering the threshold values of Arnold et al. (Reference Arnold, Bailey and Tucker2007), four samples had a statistically significant c and k score, while except for one sample (D2/1-300) σ and CV values were far less than the 40% threshold proposed by them for both parameters. Thus, from this aspect, the width of distributions was below the proposed limit. Still, De was determined using the MAM (minimum) age model for these samples. The CAM (central) age model was applied to the rest of the samples (Galbraith et al., Reference Galbraith, Roberts, Laslett, Yoshida and Olley1999). When looking at abanico plots, increased asymmetry and the narrowness of the dose distributions are the consequence of one or two outliers at the higher end of the values (Supplemental Figure 4). Thus, in the case of three samples of the four affected, MAM and CAM age models yielded very similar De values, while in the case of sample D2/1-300, the difference was 13% (Supplemental Table 1). Consequently, we determined that the aeolian samples of the Deliblato Sands are relatively well-bleached, and fluvial origin affects dose distribution for only a few samples (Supplemental Figure 4).
Profiles and OSL ages
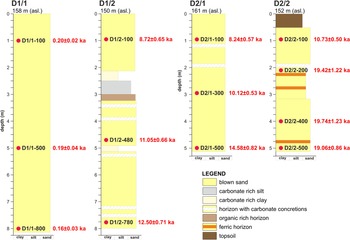
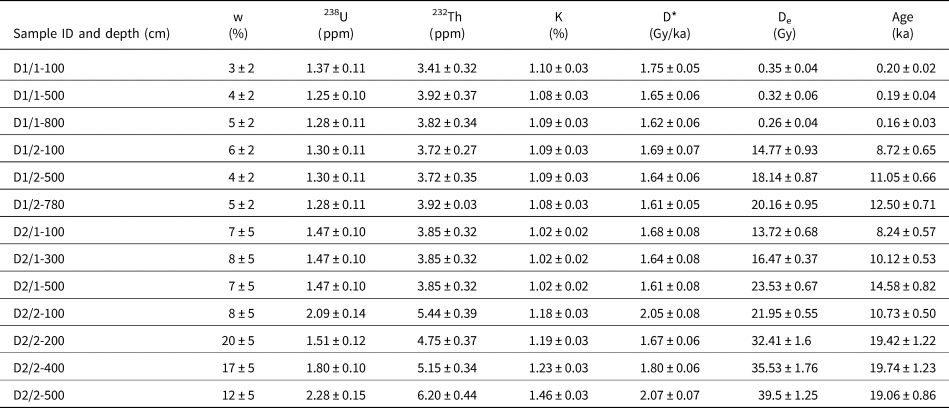
Based on mapping results, the sampled dune at Site D1 is a filled parabolic dune, indicating an abundant sand supply and limited vegetation control during its formation. Its relative height is 19 m, and the length of its crest is 750 m. The 8-m-deep borehole D1/1 from its slipface recovered homogenous, pale yellow, medium grain-sized dune sand (Fig. 5). The sand in the entire section was dated to 0.2 ka, indicating that dune formation stopped around the beginning of the nineteenth century (Table 1).
Stratigraphy and optically stimulated luminescence (OSL) ages of sediment samples from boreholes made at sites D1 and D2 (see Figure 2B for relative locations), representing a filled parabolic dune and a hairpin-like parabolic dune, respectively.

Optically stimulated luminescence (OSL) ages and data used for age calculations; w: in-situ water content; D*: total dose rate; De: sample equivalent dose based on data in Supplemental Table S1.

A more complex stratigraphy and chronology were found at the base of dune D1 (borehole D1/2; Fig. 5). The lowermost layer of blown sand at a depth of almost 8 m was dated to the Younger Dryas (sample D1/2-780, 12.50 ± 0.71 ka; Fig. 5). Within next the sand layer above to approximately a depth of 3 m, several horizons of carbonate concretions (from 0.5 cm to 4 cm in size) were found, indicating increased evapotranspiration at the time of their formation (Li et al., Reference Li, Zhang, Aydin and Deng2018). The upper part of the sedimentary unit was dated to the very end of the Younger Dryas period (sample D1/2-480, 11.05 ± 0.66 ka). At a depth of 5 m, a thin calcareous clayey, silty layer was identified, which indicates a short pause in dune formation in accordance with the obtained OSL ages.
Over the Younger Dryas blown sand layer, a thin (10–15 cm) organic-rich horizon was found that was overlain by a 60–70 cm-thick silty-to-clayey carbonate-rich unit (Fig. 5). This sequence suggests a marshy environment in a local depression that changed into an area with temporary water cover, leading to the accumulation of fine calcareous sediments. Carbonate mobilization by water and regular desiccation of the area could also have led to the development of the carbonate concretion-rich horizons below. Based on numerical ages from the profile, this period of deposition is estimated to have occurred in the Preboreal period of the Holocene. The carbonate-rich unit is overlain by another 2-m-thick blown sand unit dated to 8.72 ± 0.65 ka (sample D1/2-100), suggesting a notable Boreal aeolian event (Fig. 5, Table 1).
The dune form at Site D2 has a relative height of 8 m, considerably lower than the previously described dune. The elongated form is 800 m in length, and is interpreted as the arm of a hairpin-like parabolic dune that developed under substantial vegetation control and a moderate sand supply. Borehole D2/1, drilled on the crest of the form, recovered medium grain-sized dune sand with two carbonate-rich horizons (Fig. 5). Most probably, the core of the dune started to develop during the Older Dryas period (sample D2/1-500, 14.58 ± 0.82 ka) and heightened gradually, as indicated by an OSL date from a depth of 3 m that shows a Preboreal period of sand deposition (Table 1). Above the calcareous horizons, Boreal-age blown sand was found (sample D2/1-100, 8.24 ± 0.57 ka), and secondary carbonate concretions, detected below, most likely developed in this period (Fig. 5). These results indicate a moderate rate of sand transport and a slow but almost continuous development of the dune form up to the Atlantic period.
In the blowout hollow parallel to the dune, LGM deposits were recovered from borehole D2/2 at depths between 5 m and 2 m (Fig. 5). The mean value of ages was 19.4 ka (Table 1). The 3 m-thick sand contained three thin, ferric horizons, indicating groundwater fluctuation and an oxidative environment during the development of these horizons. From a depth of 3 m, medium sand was replaced by fine sand, i.e., it is likely that wind strength had generally decreased. The LGM sand deposit is covered by an almost solid calcareous horizon, above which an early Holocene (sample D2/2-100, 10.73 ± 0.50 ka) sand layer was found (Fig. 5, Table 1). Deposits in D2/1 and D2/2 profiles suggest that the erosion of the blowout and the accumulation of the dune body mainly occurred during the Preboreal period. Their formation possibly lasted until the end of the Boreal period, when the dune was still growing and presumably the hollow was also developing. Based on these data, it is suggested that the development of the soil in the depression started in the Atlantic period, and since then, no severe wind erosion has occurred.
DISCUSSION
Based on the four dated profiles at two sites, the main phases of the aeolian activity in different parts of the Deliblato Sands could be reconstructed, and a brief history of development outlined for the past 20 ka. Moreover, for the first time, phases of Deliblato dune formation can be compared to those identified at other sand dune areas of the Carpathian Basin and Europe, and related to available paleoclimatic information.
Although LGM-age sand was only found at the base of the investigated hairpin-like parabolic dune (samples D2/2-500, D2/2-400, D2/2-200), dune formation was probably active throughout the entire dune field at this time, which is also supported by data available from other sand dune areas of the Carpathian Basin (Kiss et al., Reference Kiss, Sipos, Mauz and Mezősi2012b; Buró et al., Reference Buró, Sipos, Lóki, Andrási, Félegyházi and Négyesi2016; Györgyövics and Kiss, Reference Györgyövics and Kiss2016) and key sites of cover sands in northwest and western Europe (Kasse, Reference Kasse2002; Vandenberghe et al., Reference Vandenberghe, Derese, Kasse and Van den Haute2013; Bertran et al., Reference Bertran, Sitzia, Banks, Bateman, Demars, Hernandez, Lenoir, Mercier and Prodeo2013). According to the regional climate reconstruction of Ludwig et al. (Reference Ludwig, Gavrilov, Radaković and Marković2021), based on malacological data, the LGM can be characterized by a semiarid climate; however, in the summer months (JJA), and especially in the southeast part of Vojvodina where Deliblato Sands is situated, conditions were relatively arid in contrast to the present-day humid and semi-humid climatic regime (Hrnjak et al., Reference Hrnjak, Lukić, Gavrilov, Marković, Unkašević and Tosić2014). Under these circumstances, there were highly favorable conditions for extensive dune formation.
Geomorphic and climatic evidence suggest that environmental conditions during the Oldest Dryas (17.5–14.7 ka; INTIMATE event GS-2.1a of Rasmussen et al., Reference Rasmussen, Bigler, Blockley, Blunier, Buchhardt, Clausen and Cvijanovic2014) were still favorable for sand movement, as indicated by luminescence ages obtained at other Carpathian Basin dune fields (Novothny et al., Reference Novothny, Frechen and Horváth2010; Kiss et al., Reference Kiss, Györgyövics and Sipos2012a; Buró et al., Reference Buró, Sipos, Lóki, Andrási, Félegyházi and Négyesi2016). The interpretation of a cold and dry climate in the region is also reinforced by the occurrence of sand wedges 250 km to the north that date to this period (Fábián et al., Reference Fábián, Kovács, Varga, Sipos, Horváth, Thamó-Bozsó and Tóth2014), and CCSM3 model-based climate simulations (Collins et al., Reference Collins, Bitz, Blackmon, Bonan, Bretherton, Carton and Chang2006; Fordham et al., Reference Fordham, Saltré, Haythorne, Wigley, Otto-Bliesner, Chan and Brook2017). However, at the sites investigated in the present study, only one sample represents this period (sample D2/1-500), with the next major phase of aeolian activity after the LGM dated to the Younger Dryas and the Preboreal.
Following the climatic amelioration during the late glacial Bølling-Allerød warming (14.7–12.9 ka, GI-1 INTIMATE event of Rassmussen et al., Reference Rasmussen, Bigler, Blockley, Blunier, Buchhardt, Clausen and Cvijanovic2014), the Carpathian Basin region was generally characterized by an overall cooling at the onset of the Younger Dryas (Feurdean et al., Reference Feurdean, Klotz, Brewer, Mosbrugger, Tămaş and Wohlfarth2008). However, based on pollen and Chrinomidae records, the temperature decrease was subtle compared to the climatic perturbation in the North Atlantic (Sümegi et al., Reference Sümegi, Molnár, Jakab, Persaits, Majkut, Páll, Gulyás, Jull and Törőcsik2011, Reference Sümegi, Magyari, Daniel, Molnár and Törőcsik2013; Tóth et al., Reference Tóth, Magyari, Brooks, Braun, Buczkó, Bálint and Heiri2012), and this was especially true in lowland areas and for summer (JJA) mean temperatures, which only decreased by <1°C on the NE parts of the Hungarian Great Plains (Magyari et al., Reference Magyari, Pál, Vincze, Veres, Jakab, Braun, Szalai, Szabó and Korponai2019). There also was a marked drop in precipitation in Eastern Europe as indicated by several proxy records (Feurdean et al., Reference Feurdean, Perșoiu, Tanţău, Stevens, Magyari, Onac and Marković2014); thus, aridity increased significantly. By the onset of the Holocene, temperature significantly increased (Magyari et al., Reference Magyari, Pál, Vincze, Veres, Jakab, Braun, Szalai, Szabó and Korponai2019), and according to the pollen-based reconstruction of Mauri et al. (Reference Mauri, Davis, Collins and Kaplan2015), dry conditions persisted until ca. 9 ka in Europe. In southeast Europe, winter (DJF) precipitation was especially low in this period. Consequently, these conditions resulted in extensive deflation and blown sand movement in the Deliblato Sands during the Younger Dryas and the Early Holocene as indicated by four samples (D1/2-780, D1/2-480, D2/1-300, D2/2-100) representing three of the four drilling sites. There are also several OSL-supported data on aeolian activity from this period from other dune fields of the region (e.g., Ujházy et al., Reference Ujházy, Gábris and Frechen2003, Kiss et al., Reference Kiss, Sipos, Mauz and Mezősi2012b). Moreover, Younger Dryas/Preboreal dune formation has been widely reported from the area of the European Sand Belt (Hilgers, Reference Hilgers2007, Tolksdorf and Kaiser, Reference Tolksdorf and Kaiser2012, Kalińska-Nartiša et al., Reference Kalińska-Nartiša, Thiel, Nartišs, Buylaert and Murray2016, Moska et al., Reference Moska, Sokołowski, Jary, Zieliński, Raczyk, Szymak and Krawczyk2021), the inland deposits of the Iberian Peninsula (Bernat Rebollal and Pérez-González, Reference Bernat Rebollal and Pérez-González2008), and the coversands of the Atlantic coast in southwest France (Bertran et al., Reference Bertran, Sitzia, Banks, Bateman, Demars, Hernandez, Lenoir, Mercier and Prodeo2013).
Hence, it seems that a significant dune formation period can be identified in the study area between 12–10 ka, and at least 4 m of deposition can be attributed to this period at Site 1. Whether borehole D1/2 penetrates a Younger Dryas sand sheet filling up a depression, which could be inferred from the development of carbonate-rich horizons, or it intersects the sand of the dune downwind, which is suggested by its morphology (Fig. 2B, Fig. 5), it seems likely that dune forms were probably smaller in this area during the Younger Dryas than those formed more recently. This also means that a significant amount of material was deposited subsequently, resulting in relative dune heights of 20–25 m at Site 1, whereas at Site 2, dunes reach a maximum height of 5–10 m.
Another significant observation that can be made based on the results is that the main formation period of elongated parabolic dunes in the NW part of Deliblato Sands can be dated back to the late Glacial and Early Holocene; thus, they are significantly older than expected based on previous hypotheses (Marković-Marjanovič, Reference Marković-Marjanovič1950; Menković, Reference Menković2013). This also means that the landscape was relatively stable in this part of the dune field for most of the Holocene. In this sense, the northern part of the Deliblato Sands resembles a similar sequence of aeolian events as the dunes in the Nyírség in NE Hungary (Buró et al., Reference Buró, Sipos, Lóki, Andrási, Félegyházi and Négyesi2016; Kiss et al., Reference Kiss, Sipos, Mauz and Mezősi2012b).
At both study sites, Boreal-age deposits were also identified, either in an interdune depression (borehole D1/2) or on the top of a dune (borehole D2/1), indicating that overall aeolian activity probably lasted until 8 ka in the Deliblato Sands (samples D1/2-100, D2/1-100). From a paleoenvironmental perspective, dune stabilization occurred due to the encroachment of vegetation, which was enabled by a considerable increase in precipitation from 9 ka to 7 ka (DJF: 10–15 mm/month, JJA: 5–10 mm/month), as shown by the pollen-based reconstruction of Mauri et al. (Reference Mauri, Davis, Collins and Kaplan2015). A marked shift to a negative NAO phase, accompanied by an intensifying Mediterranean cyclone activity and an increase in precipitation from 8.2 ka was found to occur in the region based on ice core δ18O data from the Scărișoara Ice Cave, 200 km to the NE from Deliblato Sands (Perșoiu et al., Reference Perșoiu, Onac, Wynn, Blaauw, Ionita and Hansson2017). On other sand dune areas of the Carpathian Basin, signs of Boreal-age aeolian activity have also been identified (Borsy, Reference Borsy1991; Nyári et al., Reference Nyári, Kiss and Sipos2007; Buró et al., Reference Buró, Sipos, Lóki, Andrási, Félegyházi and Négyesi2016), but these are usually interpreted as events producing secondary blowouts on previously formed dunes (Borsy, Reference Borsy1991). Meanwhile, based on the extensive review of Tolksdorf and Kaiser (Reference Tolksdorf and Kaiser2012), aeolian activity in the European Sand Belt ceased later, at ca. 7 ka.
Both for the dune fields of the Carpathian Basin and those elsewhere in Europe, numerous previous studies indicate aeolian activity in the wet phases of the Middle and Late Holocene, referring to an increased human impact, leading to the deterioration of vegetation cover and the simultaneous start of deflation (e.g., Ujházy et al., Reference Ujházy, Gábris and Frechen2003; Hilgers, Reference Hilgers2007; Kiss et al., Reference Kiss, Sipos, Mauz and Mezősi2012b; Sipos et al., Reference Sipos, Marković, Tóth, Gavrilov, Balla, Kiss, Urdea and Mészáros2016; Moska et al., Reference Moska, Sokołowski, Jary, Zieliński, Raczyk, Szymak and Krawczyk2021). Nevertheless, no such signs have been detected so far in the Deliblato Sands, which could be either due to low disturbance as a result of low population density in the area or because at least on the SE part of the high dune field, the record is overwritten by eighteenth-century dune formation. Based on the general geomorphologic picture, the elevation profiles measured, and the OSL ages obtained, it seems that filled parabolic dunes, formed in the past few centuries, were climbing up on the previously formed late Glacial/Early Holocene dune field. Also, as indicated by the findings of Gavrilov et al. (Reference Gavrilov, Marković, Schaetzl, Tošić, Zeeden, Obreht and Sipos2018), both the amount of sand supply and the direction of the wind were different in terms of these forms as compared to hairpin-like parabolic dunes in the northwest portion of the dune field. The observations also serve to emphasize the fact that the two main accumulation zones of the high dune field have had different development histories.
CONCLUSIONS
With the help of morphological mapping and OSL dating of dune forms on the Deliblato Sands, novel information was obtained concerning the Late Pleistocene and Holocene evolution of the area, contributing to the regional interpretation of the contemporary aeolian record as well.
Based on the morphology and heights of the dunes, most of the dune field is dominated by elongated, hairpin-like parabolic dunes, indicating a relatively low sand supply during their formation. However, another set of dunes, predominantly a filled parabolic-type, are superimposed on the previous dunes and indicate a much higher sand supply.
According to the numerical ages obtained, the sand forming the base of the present dunes was deposited during the cold and arid LGM, until ca. 19 ka. Subsequently, another major phase of dune formation took place from the Younger Dryas to the Boreal period of the Holocene. However, due to increasing precipitation after 8 ka, the dune landscape was stabilized by vegetation. Therefore, on most of the Deliblato Sands, the dunes are older and more stable than previously assumed. In addition, Middle Holocene stabilization of dunes started earlier here and in the Carpathian Basin as compared to the European Sand Belt.
On the southeast portion of the high dune field, sand was remobilized during historical times. As indicated by our research, the last phase of aeolian activity was dated to 0.2 ka, which corresponds well with written records. Nevertheless, earlier events in historical times that are regularly observed on other European dune fields cannot be ruled out, even though the young dune forms are directly superimposed on the late Glacial to Early Holocene deposits based on their geomorphological position and obtained OSL ages.
Supplementary Material
The supplementary material for this article can be found at https://doi.org/10.1017/qua.2021.67
Financial Support
The research was funded by the Hungarian National Research, Development and Innovation Office [grant numbers: K119309, K135793], the EU H2020-WIDESPREAD-05-2020 Twinning Programme [Grant agreement ID: 952384, acronym: ExtremeClimTwin], and the European Regional Fund [project ID: HUSRB/1602/11/0057, acronym: Water@Risk].