


Introduction
Catastrophe theory (Reference Thom and FowlerThom, 1972) provides a formal mathematical description of systems which exhibit sudden, discontinuous changes in state or form. The distinctive premise of this theory is that these sudden changes, or catastrophes, result from smooth changes in the variables which control the system rather than from discontinuous changes in external stimuli. Certain aspects of the history of global ice fluctuations indicate that the dynamics of large ice masses may be subject to such sudden changes. This is particularly evident from the rapid reductions of global ice volume characterizing the transitions between glacial and interglacial episodes of the Earth’s paleoclimate. Several glaciological treatments of this question have supported the notion that ice-mass dynamics are mutable. For example, the flow laws governing ice sheets and glaciers may develop self-excitation modes through a "surge mechanism" (Reference BuddBudd, 1975); or they may be altered through a reorientation of ice crystal fabric (Reference HughesHughes, 1977). Whatever structural developments trans figure the dynamics of large ice masses, catastrophe theory may provide a logical description of the steps in which these changes can occur.
The catastrophe model presented in this paper will describe the possible changes in the dynamics governing large ice masses. Its validity will be based upon the qualitative behavior of global ice cover rather than a complete and complicated analysis of the somewhat disjointed aspects of glaciological theory. By developing an unconventional synthesis of the actions collectively controlling global ice cover, the catastrophe model will add a different perspective to the collection of speculative glaciological theories which concern the Earth’s climatic history.
The presentation of the catastrophe model will be preceded by a brief discussion of the chronological pattern of global ice fluctuations. This pattern will be shown to imply a two-dimensional set of climate controls. One control will be identified with the insolation fluctuations resulting from the Earth’s orbital cycles. The second control will be designed to account for the apparent changes within the dynamics of large ice masses. Two previous climate models which do not employ the second control parameter will be briefly presented in order to illustrate the inadequacy of simple models which do not account for changeable dynamics. Finally, in the discussion of the catastrophe model, it will be conjectured that the second control parameter can be connected with the isostatic actions occurring within the Earth’s crust and mantle.
The Record of Global Ice Fluctuations
The paleoclimatic record incorporated within deep-sea sediments indicates that global ice fluctuations have been strongly influenced by the secular variations in the Earth’s orbit. These orbital variations, which alter the pattern of seasonal solar heat input, contain cyclical components having frequencies closely matched by the variation in the oxygen-isotope ratios found within deep-sea cores (Reference Hays, Hays, Imbrie and ShackletonHays and others, 1976). Consequently, global ice fluctuations, indexed by the oxygen-isotope ratios (Reference ShackletonShackleton, 1967), are considered the climatic response of an Earth encountering differing insolation conditions.
The most authoritative comparison between cyclical variations in global ice cover and the calculated summer insolation curves for the Northern Hemisphere was performed by Reference Hays, Hays, Imbrie and ShackletonHays and others (1976). Their procedure assumed that global ice cover would respond linearly to the orbital control. Under such an assumption, frequencies characterizing the particular orbital signals would be emphasized in the paleoclimatic spectra. They found that this was indeed the case for cycles with periods of 23000 and 41000 years. These "high-frequency" cycles, corresponding to the changing precession and obliquity of the Earth’s axis, were found to be clearly subsidiary to a "low-frequency" cycle occurring with a period of roughly 100000 years. This cycle, responsible for the fluctuation between major glacial and interglacial phases of global ice coverage, was thought to represent a non-linear response to the changing eccentricity of the Earth’s orbit. Certain asymmetric aspects of this climatic cycle were incongruous with the insolation curves.
The non-linearity of this dominant cycle in global ice coverage was discussed extensively by Reference Broecker and VanBroecker and Van Donk (1970). Their examination of the paleoclimatic record showed that the quasi-periodic fluctuations between glacial and interglacial climates suggested slow and gradual development of global ice cover followed by a rapid disintegration. These sudden terminations of the glacial climates are primarily responsible for the asymmetric "saw-toothed" quality exhibited in the oxygen-isotope curves of Figure 1. The non-linear aspect of this climatic chronology is particularly evident from the fact that no similar "saw-toothed" pattern exists within the calculated summer insolation curves displayed in Figure 2.
A typical record of the Earth’s paleoclimate is revealed through the oxygen-isotope ratios found within deep-sea cores (Reference Broecker and VanBroecker and van Donk, 1970). An asymmetric "saw-toothed" curve is superimposed on the data points to indicate the nature of the 100000 year cycle corresponding to fluctuations between glacial and interglacial phases. From this curve it is clear that global ice build-up is more gradual than disintegration. The purpose of the catastrophe model is to link this 100000 year cycle to the calculated insolation variations in a way which will preserve the quality of gradual advance and sudden retreat.

Displayed are the summer insolation variations (∆Q) for lat. 50° N. Reference Weertman(Weertman, 1976). These insolation variations appear to have driven the global ice fluctuations during the ice age (Reference Hays, Hays, Imbrie and ShackletonHays and others, 1976). The Roman numerals indicate insolation maxima coincident with the rapid transitions from glacial to interglacial conditions. The catastrophe model explains why the asymmetric "saw-toothed" climatic cycle in Figure 1 resulted from this irregular insolation curve.

The dynamic aspect of gradual advance and sudden retreat has suggested that the magnitude of continental glaciation oscillates between two stable configurations (Reference BroeckerBroecker, 1966). Though the transitions between these two modes are subject to the control of a changing eccentricity in the Earth’s orbit, there is evidence for action occurring through an independent stimulus. This suspicion is motivated by the fact that only select maxima in the insolation curves will trigger the sudden transition to interglacial ice coverage. In Figure 2 those insolation maxima coincident with glacial terminations are indicated with Roman numerals. Clearly, several intervening insolation maxima did not produce a dramatic effect upon the global ice cover. Though the mechanism providing for such an internal stimulus remains speculative to date (personal communication from T. J. Hughes), it must account for a potential action accumulated during the gradual growth of global ice cover. This potential action must modify the essentially linear response of global ice cover and move the system towards the threshold for a sudden, non-linear response to particular insolation maxima.
The dynamic behavior exhibited within the paleoclimatic record is particularly suited for description through the general mathematical theory of relaxation oscillations (Reference MinorskyMinorsky, 1962). This theory was developed to describe certain electro-mechanical systems which displayed both gradual and catastrophic transitions between configurations. Applying this theory, a single differential equation is used to relate a generalized variable representing global ice volume to a generalized control parameter representing insolation values. Another control parameter independent of the insolation is also incorporated within the differential equation to represent the internal action which distinguishes between the linear and nonlinear response mechanisms. The resulting model, which adequately accounts for the behavior of the global ice cover, is labeled a "catastrophe model" because of its connection with Thom’s catastrophe theory (1975) as well as its provisions for the apparent catastrophic terminations of glacial climates.
Before developing this model further it is instructive to consider several previous models which have sought to describe the paleoclimatic record. Though both of these models are non-linear and can provide for catastrophic transitions between global ice configurations, it will be shown that both models are unable to account for all of the dynamic behavior exhibited in the paleoclimatic record. The primary problem is that these models do not incorporate the second control parameter necessary to represent any internal glaciological actions. The catastrophe model, once developed, will have many similarities to the previous models and will be shown to represent the logical extension of these models when the second control parameter is incorporated.
The Budyko Model
The Reference BudykoBudyko model (1972) uses a diffusive heat-transport theory to model the latitudinal positions of surface isotherms. Using the — 10°C isotherm as the criterion for the southern (equatorward) ice margin, the model predicted xe, the sine of the latitude of the southern ice margin, to be related to Q, the insolation value, in a way intrinsically similar to the equation (North, 1975[Reference Northa], [Reference Northb]),

where Q 0, Ɛ and x 0 are empirically determined constants. In addition to the relation described in Equations (1), Budyko asserted that the conditions of no ice cover and complete global ice cover were accessible to the Earth’s climate. The graph of this climate model, illustrated in Figure 3, is composed of the union of the folded curve of Equations (1) with the line representing total global ice cover (x e =0). If Equations (1) specifies a value of x e outside the interval {o, 1}, x e must be truncated at either 0 or 1. For certain values of Q, x e can adopt one of three possible values. In such cases the intermediate value of x e is of no physical significance since it represents an unstable solution to the diffusive transport equations (Reference Su and HsiehSu and Hsieh, 1976). Of the other two values of x e, one lies on the upper branch of the folded curve and the other represents total global ice cover (x e = 0).
The Reference BudykoBudyko model (1972) specifies the sine of the latitude of the ice margin of an azimuthally symmetric ice sheet which covers the Earth’s pole, Xe, as a function of the insolation Q. The shape of this curve is a fold with the upper branch representing the only stable and physically attainable state of global ice cover. Climatic changes are represented by a point following a path on the upper branch. When Q falls below a certain critical value the point must move off the knuckle in the curve separating the upper from the lower branch and a runaway glacial advance towards complete global ice cover will occur. According to this model, once runaway glacial advance is complete, total global ice cover will exist permanently because of increased global albedo.

Climatic change is represented on the diagram in Figure 3 as a "flow" on the stable upper branch, with a pending possibility of a catastrophic plunge to complete global ice cover. With fluctuations of Q never falling below Q 0, the ice cover will advance and recede in a gradual and completely reversible manner. However, if Q drops below Q 0, a runaway advance of the ice cover results; and x e will catastrophically assume its minimum value (with ice advancing to the equator). The physical basis of this prescribed runaway advance is the positive feedback between growing ice cover and global albedo. The role of Q 0 in this model is that of a threshold in the control of the Earth’s climate which differentiates between the gradual, reversible and the sudden, irreversible climatological response mechanisms. North (1975[Reference Northa], [Reference Northb]) stated that only a few per cent reduction of Q from present-day values could allow the catastrophic plunge to total global ice cover. In such an event a 35% increase of Q would be necessary to restore the climate to present conditions.
The Budyko model provides an unsatisfactory description of the paleoclimate. One problem is that the oxygen-isotope record provides no evidence for a complete transition towards total global ice cover. This means that Q never exceeded Q 0 and that the climatic response to changing insolation was always gradual and reversible. Furthermore, if a runaway glacial advance were ever to have occurred, there would be no subsequent provision for ensuing interglacials since a 35% increase in Q seems unfeasible. Another obvious problem with the Budyko model is that the criterion for the latitudinal extent of ice cover, namely the — 10°C isotherm, oversimplifies the complicated glaciological processes which determine ice margins.
The Weertman Model
Reference WeertmanWeertman (1976) considered the effect of solar radiation on the size of an idealized, perfectly plastic, two-dimensional ice sheet covering a continental land mass. He postulated that the ice-sheet half-width L was controlled by the parameter h 0 which defines the snow-line elevation at any latitude. Assuming a steady-state ice sheet, where net accumulation and net ablation cancel, the equation relating L to h 0 was written (Reference WeertmanWeertman, 1976),

Here L 0 is the value of L if h 0 is equal to zero, and h 0 ⋆ is the largest value of h 0 that can foster a steady-state ice sheet. For each value of h 0 greater than zero, Equations (2) specifies only one stable and physically attainable value of L (Reference WeertmanWeertman, 1962). These values of h 0 and L form the stable upper branch of the graph of Equations (2) which is displayed in Figure 4. In addition to the graph of Equations (2), ice-free conditions (L/L 0 = 0) are possible for h 0 greater than zero since the surface of an initially ice-free continent would lie beneath the snow line. When h 0 is less than zero, L adopts only values on the upper branch of the curve of Equations (2) since the lower branch becomes physically unmeaningful and ice-free conditions cease to be steady-state.
The Reference WeertmanWeertman (1976) model states that an idealized ice sheet of half-width L and snow-line elevation ho are related through the folded curve pictured above. Changes in insolation will produce changes in ho, and the resulting climatic change will be represented by a point travelling along a trajectory on the upper branch of the folded curve (the lower branch is unstable and does not represent a naturally occurring ice-sheet size). If ho never exceeds ho Footnote * then the ice sheet size will appear to mimic changing insolation. However, once ho exceeds ho Footnote * a catastrophic removal of the ice sheet will result. No ice sheet will grow again until ho becomes less than zero.

The curve in Figure 4 displays one very important property associated with the growth and decay of the idealized ice sheets in the Weertman model. The increased elevation of the surface of the ice sheet where accumulation is occurring will allow the continued existence of the ice sheet despite snow-line elevations which would normally suppress glacial development in the absence of existing ice. This feature is illustrated in the curve of Figure 4 by the coexistence of two stable steady-state ice-sheet sizes; one being large (on the upper branch), and one being zero (L = o). The splitting between these two coexisting climates is removed once h 0 exceeds h 0 ⋆. The singularity at h 0 ⋆ is produced by the fact that the curve of Equations (2) folds over at this point, and the stable upper branch becomes the unstable lower branch. Once a fluctuation in h 0 exceeds h 0 ⋆ the large equilibrium ice sheet necessarily undergoes rapid reduction. Like the quality of runaway glacial advance exhibited in the Reference BudykoBudyko model (1972), a runaway glacial retreat is observed here because of the feed-back between loss of ice-sheet elevation and the increased ratio of ablation to accumulation areas.
Several problems become apparent once this model is subject to periodic insolation forcing. Weertman postulated that h 0 was directly related to the insolation fluctuations ∆Q and that the parameter governing the speed of ice-sheet growth and decay was η, the ratio of the accumulation-rate to the ablation-rate (usually less than unity). Varying the periodicity of the insolation forcing function T and the value of η, Reference BirchfieldBirchfield (1977) found that the response of the ice sheet could be divided into two separate classes. One class is where the values of T and η are too small to allow an ice sheet to ever attain a steady-state profile. The other case is where T and η are large enough to allow the development of steady-state ice sheets. Unfortunately, the insolation forcing associated with the variations of the Earth’s orbit displayed in Figure 2, and the value of η conjectured to have existed during the past, elicited an ice-sheet response which for the most part falls in the former case. This is unfortunate because the underlying assumption of the Weertman model, that ice sheets adopt a perfectly plastic profile, was not meant to describe non-steady-state behavior. Hence any possible agreements between the paleoclimatic record and the responses predicted by the Weertman model must be considered unphysical artifacts.
To improve the Weertman model it is necessary to incorporate the dynamics of large ice masses in a more realistic manner. The assumption that the ice sheets maintain the profile of a perfectly plastic material must be abandoned to account for the rapid and focused ice flow such as that occurring in ice streams, which can transport ice from accumulation to ablation areas. It is also necessary to incorporate a more realistic concept of the isostatic compensations occurring within the Earth’s crust and mantle. The Weertman model presently requires that the continental crust beneath the ice maintain a constant isostatic equilibrium; and that isostatic rebound during ice-sheet wastage is instantaneous. This assumption does not allow certain dynamic effects characteristic of marine ice sheets ever to have an effect on ice-sheet size. Because marine ice sheets rest on rock that is below sea-level they may be subject to conditions of irreversible growth or decay. Retreat may take place independently of climatic change and with great rapidity (Reference ThomasThomas, 1979). Other glaciological aspects missing from the Weertman model are the ablation processes which occur in the northern (poleward) half of the ice sheets such as bottom melting of ice shelves and iceberg calving. By restricting the ablation process to melting on the southern (equatorward) half of the ice sheet, the Weertman model essentially argues that the mass balance of the terrestrial ice-sheet margins will dictate ice-sheet size. This restriction is clearly unphysical, since the glacial history of North America and other select areas suggest that significant amounts of ice-sheet wastage can occur in the high Arctic, well above the snow-line, independent of the conditions existing at the far-removed southern ice margins (Reference Hughes, Hughes, Denton and GrosswaldHughes and others, 1977). Moreover, there is very little melting in Antarctica today; the majority of Antarctic ice sheet ablation is by bottom melting of ice shelves and iceberg calving. One additional improvement of the Weertman model would require the development of a more realistic account of the effects of changing insolation on the snow-line elevations. This would necessitate the incorporation of the feedback mechanisms which involve ice-sheet size and global albedo cited in the Reference BudykoBudyko model (1972).
The Catastrophe Model
On the basis of the qualitative dynamic structure of global ice cover deduced from the paleoclimatic record, the following non-linear differential equation is used to relate the changing global ice cover, x e, and the insolation value Q:

In the above equation x
0, Q
0, and Ɛ are fixed constants; γ(x
e, t) is a parameter assumed to describe the behavior of the ice cover away from its steady-state configuration; and α is an independently varying control parameter similar to Q. If γ(x
e, t) is assumed to be non-zero and quite small, then x
e will always tend towards steady-state values given by the solution of Equations (3) when  . The graph of the steady-state values of x
e comprises a surface in a three-dimensional space where Q, α, and x
e are orthogonal axes. This surface, shown schematically in Figure 5, has a peculiar fold associated with the values of (Q, α) lying within the "cusp" defined by
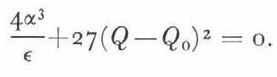
Of the three possible values of x e associated with the values of (Q, α) within the "cusp", only those values of x e defined by the upper and lower branches of the folded surface are stable and physically attainable.Footnote * These two stable branches correspond to alternative configurations of global ice cover. For values of (Q, α) away from the "cusp" only one value of x e is accessible to the system.
The catastrophe model specifies steady-state global ice volume, xe, to be a function of two control parameters: Q and α. Q is the insolation value; and α is conjectured to represent the potential for the glacial– oceanic interactions which change global ice volume independently of the insolation. Because of isostatic compensations within the Earth’s crust and mantle beneath ice loads, changing relative sea-levels will cause α to vary throughout the climate cycle. A typical 100 ka climate cycle is represented by the trajectory drawn on the pleated surface above the (Q, α) plane. A sudden and irreversible transition to interglacial conditions occurs when xe transits from a value on the lower branch of the pleated surface to a value on the upper branch.

The climate system described by the surface in Figure 5 can be considered the logical extension of the Reference WeertmanWeertman (1976) and the Reference BudykoBudyko (1972) models. This is because the folded portion of the surface can allow sudden, irreversible transitions to either glacial or interglacial phases. In addition to these possibilities, more gradual and reversible transitions are possible on the section of the surface which is not folded. The role of the second control parameter α is to control the type of transition characterizing the natural fluctuations between glacial and interglacial climates produced by insolation changes. When α is negative, the action of a changing Q will produce gradual changes in ice cover. These changes will be reversible in the sense that an increase of Q followed by a decrease of Q by the same amount will result in no net change of ice cover. When α is positive the system must reside on either the upper or the lower branch of the folded surface, and a slight change in Q can trigger a catastrophic transition to the other branch. Such a transition would be irreversible in the sense that a slight increase of Q across the threshold for the catastrophic jump followed by an equal decrease in Q would not result in a return to the original ice volume.
The 100 ka climate cycle which favors the gradual development of ice cover followed by quick and irreversible disintegration can be elicited from the irregular fluctuations of Q by including suitable changes in α. At the beginning of a climate cycle α is negative, and a decreasing Q will force a gradual glacial advance. As a slow response to the accumulating ice cover, α becomes larger. Once α has reached positive values, the system will be confined to the lower branch of the surface in Figure 5. Despite several intermediate periods of high Q that follow, the confinement within the lower branch will reduce the subsequent changes in ice volume until the threshold for sudden, irreversible glacial disintegration is approached. This threshold is crossed when the Q increase is large enough to exceed the bounds of the "cusp", thus forcing the system to seek a new position on the upper branch. This crossing will constitute the end of the climate cycle and will allow α to return to negative values, ready for the beginning of the next cycle. The asymmetric "saw-toothed" aspect of the record of global ice cover can be elicited by this type of cyclical behavior among Q and α. The trajectory pictured on the surface of Figure 5 illustrates the climate cycle which has just been described.
Although a physical mechanism is not presently attached to the second control parameter, α concisely represents the apparent "potential action" evident in the paleoclimatic record. One candidate for the physical significance of α is the extent of glacial–oceanic interactions (Reference WeertmanWeertman, 1974) affecting the marine ice sheets comprising a major portion of ice cover during optimum glacial climates (Reference Hughes, Hughes, Denton and GrosswaldHughes and others, 1977). As this ice cover developed in the Northern Hemisphere, the coincident isostatic depression of the Earth’s crust would possibly represent the increase of α from negative to positive values. Once marine ice sheets developed, the positive α would provide the threshold for a quick and irreversible disintegration. Geological field investigations of the late-Würm Arctic ice sheet indicate that such a catastrophic disintegration may have occurred in a time span of only a few hundred years (Reference Hughes, Hughes, Denton and GrosswaldHughes and others, 1977). Moreover, theoretical examinations of the complex interactions among ice streams, ice shelves, and calving bays lend support to these irreversible and sudden events (Reference ThomasThomas, 1977; Reference Thomas and BentleyThomas and Bentley, 1978).
Once global ice cover has disintegrated, its subsequent redevelopment is suppressed until isostatic rebound has reduced α to smaller values. This is due primarily to the fact that isostatically uncompensated continental beds will either be beset by sea-water or will lie at elevations too low to be sensitive to decreasing insolation. This condition would account for the lack of re-glaciation coincident with the insolation lows which occurred immediately after the glacial disintegration. After α has reduced, however, the re-advance could occur in two possible ways. With a slightly positive α, re-advance could occur catastrophically as the climate transits from the upper branch to the lower branch of the surface in Figure 5. Since the positive α is conjectured to represent an increased glacial-oceanic interaction, rapid thickening of sea ice coupled with a diminished global albedo could account for a portion of this re-advance. On the other hand, a negative α would indicate that the glacial re-advance is gradual and completely reversible. This type of advance would favor a largely terrestrial origin and would reflect the gradual size increase of existing equilibrium ice sheets. An additional factor in the redevelopment of global ice cover is the effect of the diminishing α immediately after the end of the previous glacial episode. Since the upper branch of the surface in Figure 5 slopes towards higher ice volume as α is decreased independently of Q, glacial re-advance could occur without the lowering of Q. This process, accounting for the enlargement of catchment areas as land isostatically elevates to meet the snow-line, is consistent with the theoretical evidence for rapid nucleation of ice sheets in the Laurentide (Reference Andrews and MahaffyAndrews and Mahaffy, 1976).
One more speculative consideration allows the apparent lack of glacial cycles during the warm era between the "ice ages" to be incorporated within the catastrophe model. If the erosional actions of each glacial cycle during an "ice age" or other tectonic actions reduce the elevations of critical sections of the continents, α would not return to the same low value at the end of a glacial cycle as it had at the beginning. This could produce the same effect as if the isostatically depressed continents could not rebound to their original elevations. Under these circumstances, α might not become low enough to allow the system to escape the confinement of the upper branch of the surface in Figure 5. Without a sufficiently low value of Q to trigger a transition to the lower branch, ice cover would not develop until a new geological stage of continental uplift would return α to low enough values to start another "ice age".
The catastrophe model can be criticized for being overly simplistic and for ignoring the myriad of details involved in the dynamics of large ice masses. This is indeed a valid observation, but it is partially excusable from the standpoint that the model seeks only to describe "global ice cover" which necessarily lumps all of the physical manifestations of ice occurring throughout the environment. Such a simple treatment of the many parts composing global ice cover is consistent with the notion that the great ice sheets and ice shelves of the past existed as a single dynamic system (Reference Hughes, Hughes, Denton and GrosswaldHughes and others, 1977). In a sense, the catastrophe model has compromised its treatment of the many components of this single system in order to express the qualitative concepts in their most simple form.
Conclusion
Within the paleoclimatic record of global ice fluctuations, evidence exists in support of a second climatological control which is independent of the insolation fluctuations. This second control parameter, missing from previous models of the Earth’s climate, is necessary to account for the apparent variability of the dynamics of large ice masses which are responsible for the dramatic and irreversible changes in global ice volume. The catastrophe model, which incorporates the two-dimensional set of climate controls, conjectures that the glacial-oceanic interactions produced by isostatic deepening of the continental beds beneath ice sheets play an important role in the physical embodiment of the second control parameter. If this is true, the second control parameter can indeed provide for the "retarded action" which accounts for the rapid reductions of ice volume at exclusive insolation maxima. The delayed nature of this action results from the fact that isostatic compensations are not instantaneous (Reference Brotchie and SilvesterBrotchie and Silvester, 1969). Furthermore, the basic glaciological differences between dynamic processes occurring at terrestrial and marine ice margins allow the second control parameter to be conceived as a "switch" engaging the linear and the non-linear events in the paleoclimate.
The basic intuitive premise of the catastrophe model is that the Earth’s climatic history results from a competition between two major forces in the environment: insolation fluctuations and the mutable dynamics of large ice masses. This competition is manifested in a climate record which indicates alternation between states of abundantly glacial or abundantly marine environments. As the glacial environment vies for domination, it absorbs large amounts of water; and, in a sense, dries the oceans. Yet at the same time, the growing ice sheets assure their own liquidation: their increased size and bulk will depress their continental support and eventually bring to play those oceanic actions which induce irreversible disintegration. This is perhaps the greatest advantage of the catastrophe model over the Reference WeertmanWeertman (1976) and the Reference BudykoBudyko (1972) models. Both of these previous models assign a passive role to the dynamics of large ice masses. The Budyko model concentrates solely upon the interrelated global albedo and the latitude of the southern margin of ice cover and their combined effects on a diffusive energy transport model of the atmosphere (Reference NorthNorth, 1975[b]). There is no account of diffusive energy transport in the oceans nor of the active mass transport due to glacial flow. The Weertman model, on the other hand, confines ice-sheet dynamics to those of a strictly plastic material. This assumption will not allow for the dramatic movements of ice produced by ice streams which may have played such an important role during the termination of the glacial episodes (Reference HughesHughes, 1977). Instead, the Weertman model concentrates on the passive ablation processes occurring at the terrestrial ice margins at the lowest latitudes; and, in fact, asserts that the greatest ice-sheet wastage happens when the ice is completely stagnant. The catastrophe model gains its advantage by retaining the active role of ice-sheet dynamics in producing the observed paleoclimatic record. By including the effects of isostatic elevation changes in the Earth’s continental crust as a modulation to the destructive actions at the seaward margins of large ice sheets, the rapid disintegration of major portions of global ice cover has been incorporated into a simple mathematical model. It is for this reason that the catastrophe model and the application of catastrophe theory to glacio-logical problems deserve further study.
In conclusion, it is hoped that the many qualitative aspects of the catastrophe model will add intuitive substance to the more rigorous physical treatments of global ice cover. Furthermore, it is hoped that the implications of this qualitative approach, namely the existence of a second control parameter, will help to add direction and foresight to future theoretical developments.
Acknowledgements
The author would like to thank R. H. Thomas and T. J. Hughes for their careful support and guidance, as well as T. Webb and J. Imbrie who helped at the beginning of this study.
Discussion
G. K. C. CLARKE: I am interested that you have chosen a cusp rather than a fold catastrophe as the basis of your model. If you take the Hays, Imbrie and Shackleton oxygen-isotope record and Verneckar’s insolation curves and attempt to fit these to a fold catastrophe model you get complete nonsense, as I suppose you have discovered. Thus the additional control parameter α must be of great importance in your work and yet its physical significance is unclear. Until α is made a quantitative rather than a qualitative variable it will be impossible to test your hypothesis.
D. R. MACAYEAL: Presently, no one has attempted to devise hypothetical ice-volume curves by subjecting the cusp model to insolation forcing. As you pointed out, this cannot be accomplished until a record of fluctuations of α comparable to Verneckar’s insolation curves is obtained.
C. R. BENTLEY: If your parameter α increases with time, as the cusp model implies, does not this make it increasingly unlikely as time goes on that an ice sheet will disintegrate? We should then commonly see disintegration for relatively small insolation maxima as soon as a becomes positive.
MACAYEAL: To provide the existence of an upper bound to the value of insolation needed to trigger a transition to interglacial climates it is necessary for α also to have an upper bound. If α represents the glacial-oceanic interactions characteristic of marine ice sheets, then the size limitation on continental glaciation of the "marine" type will provide the upper born on α. You also point out that when α is just slightly positive a relatively small insolation maximum will produce the transition from the lower branch to the upper branch of the surface representing my model. Since these two branches do not represent widely differing ice volumes when α is still small, such a transition would not represent the large changes in ice volume characteristic of the initiation of interglacial climates.
D. R. HOMER: Can the parameter α be related to the glaciological parameters with which we are used to dealing ? Or, do you have a variable in search of a process rather than a process in search of a variable ?
MACAYEAL: Your questions raise one of the major unresolved issues associated with this model. I suspect that until we have a greater understanding of the dynamics of marine ice sheets and the processes governing iceberg calving we will not be able to relate to glaciological parameters we are "used to dealing with".
W. D. HIBLERIII: Could not the parameter α be related to sea-ice dynamics as well as, or instead of, glacier dynamics? Also, is it simply a measure of the albedo feed-back effect, or is there an intrinsic relationship to the dynamics of large ice masses ?
MACAYEAL: You have posed a good question which I have not considered. I wonder what dynamic relationships exist between sea ice, ice sheets, and ice shelves.
A. G. FOWLER: I wonder in what sense catastrophe theory can be said to have a genuine application to the observed fluctuations in ice sheets. As I understand it, elementary catastrophe theory can only strictly be used when we have a model consisting of a "gradient dynamic" system of ordinary differential equations, which is certainly not the case in the present context. In this sense modelling ice ages by a cusp catastrophe is hardly more than a convenient analogy, or a useful descriptive picture, but it is not clear that such a description can be used for predictive purposes. Do you think your model is therefore a realistic one?
MACAYEAL: You raise an important issue which I am not fully competent to discuss. I will, however, point out that your reference to a "convenient analogy" reminds me of the fact that the Bohr model of the hydrogen atom represented an unphysical theory of atomic physics. The Bohr model continues to be taught in elementary physics courses because it provides a "convenient analogy" to the conceptual steps in the development of modern quantum mechanics.



